
IMERG-Based Meteorological Drought Analysis over Italy


Abstract
:1. Introduction
2. Materials and Methods
2.1. IMERG Data
2.2. Standardized Precipitation Index
2.3. Run Theory
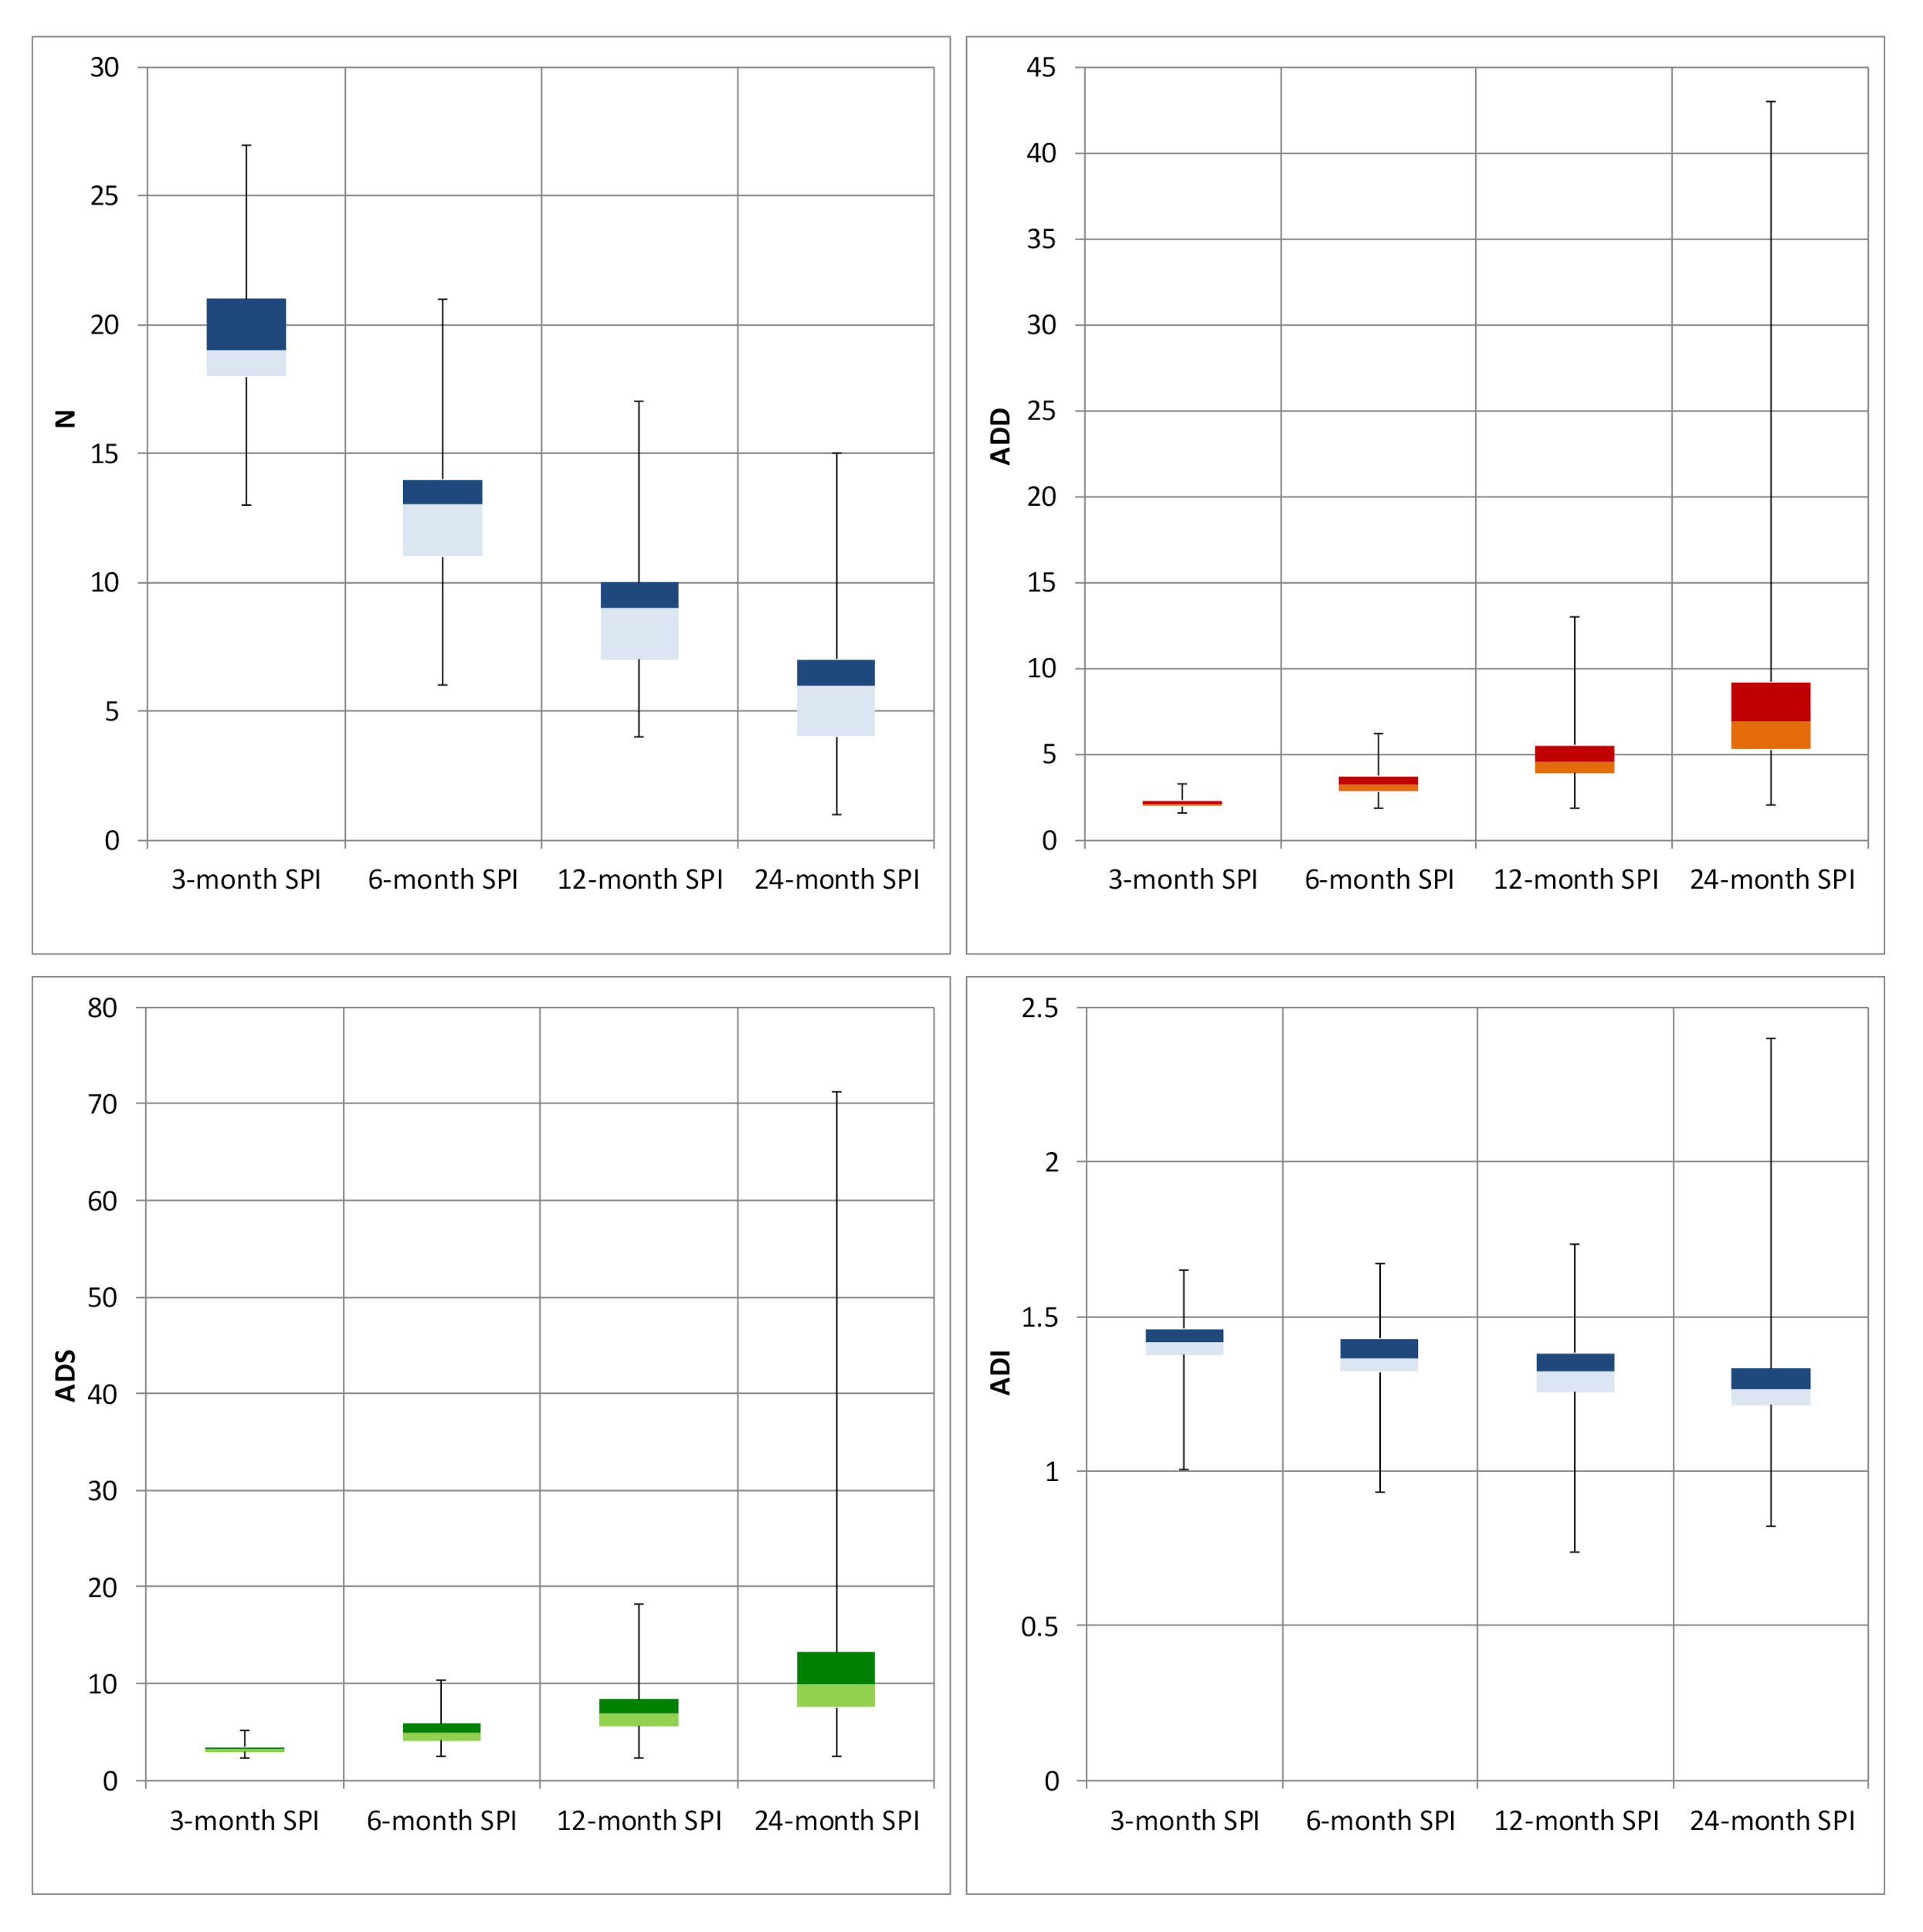
3. Results
4. Discussion
5. Conclusions
Author Contributions
Funding
Data Availability Statement
Acknowledgments
Conflicts of Interest
References
- Hanel, M.; Rakovec, O.; Markonis, Y.; Máca, P.; Samaniego, L.; Kyselý, J.; Kumar, R. Revisiting the recent European droughts from a long-term perspective. Sci. Rep. 2018, 8, 1–11. [Google Scholar] [CrossRef]
- Caloiero, T.; Veltri, S.; Caloiero, P.; Frustaci, F. Drought Analysis in Europe and in the Mediterranean Basin Using the Standardized Precipitation Index. Water 2018, 10, 1043. [Google Scholar] [CrossRef] [Green Version]
- Caloiero, T. SPI Trend Analysis of New Zealand Applying the ITA Technique. Geosciences 2018, 8, 101. [Google Scholar] [CrossRef] [Green Version]
- MunichRe. The Natural Disasters of 2018 in Figures. Losses in 2018 Dominated by Wildfires and Tropical Storms. Available online: https://www.munichre.com/topics-online/en/climate-change-and-natural-disasters/natural-disasters/the-natural-disasters-of-2018-in-figures.html (accessed on 26 March 2021).
- Peters, W.; Bastos, A.; Ciais, P.; Vermeulen, A. A historical, geographical and ecological perspective on the 2018 European summer drought. Philos. Trans. R. Soc. Lond. B Biol. Sci. 2020, 375, 20190505. [Google Scholar] [CrossRef]
- Zargar, A.; Sadiq, R.; Naser, B.; Khan, F.I. A review of drought indices. Environ. Rev. 2011, 19, 333–349. [Google Scholar] [CrossRef]
- Tsakiris, G.; Pangalou, D.; Vangelis, H. Regional drought assessment based on the Reconnaissance Drought Index (RDI). Water Resour. Manag. 2007, 21, 821–833. [Google Scholar] [CrossRef]
- McKee, T.B.; Doesken, N.J.; Kleist, J. The relationship of drought frequency and duration to time scales. In Proceedings of the 8th Conference on Applied Climatology, Anaheim, CA, USA, 17–22 January 1993; pp. 179–184. [Google Scholar]
- Capra, A.; Scicolone, B. Spatiotemporal variability of drought on a short–medium time scale in the Calabria Region (Southern Italy). Theor. Appl. Climatol. 2012, 3, 471–488. [Google Scholar] [CrossRef]
- Caloiero, T.; Coscarelli, R.; Ferrari, E.; Sirangelo, B. An Analysis of the Occurrence Probabilities of Wet and Dry Periods through a Stochastic Monthly Rainfall Model. Water 2016, 8, 39. [Google Scholar] [CrossRef] [Green Version]
- Caloiero, T. Drought analysis in New Zealand using the standardized precipitation index. Environ. Earth Sci. 2017, 76, 569. [Google Scholar] [CrossRef]
- Lee, S.-H.; Yoo, S.-H.; Choi, J.-Y.; Bae, S. Assessment of the Impact of Climate Change on Drought Characteristics in the Hwanghae Plain, North Korea Using Time Series SPI and SPEI: 1981–2100. Water 2017, 9, 579. [Google Scholar] [CrossRef] [Green Version]
- Pei, Z.; Fang, S.; Wang, L.; Yang, W. Comparative Analysis of Drought Indicated by the SPI and SPEI at Various Timescales in Inner Mongolia, China. Water 2020, 12, 1925. [Google Scholar] [CrossRef]
- Bong, C.H.J.; Richard, J. Drought and climate change assessment using Standardized Precipitation Index (SPI) for Sarawak River Basin. J. Water Clim. Chang. 2020, 11, 956–965. [Google Scholar] [CrossRef]
- Khosravi, H.; Haydari, E.; Shekoohizadegan, S.; Zareie, S. Assessment the Effect of Drought on Vegetation in Desert Area using Landsat Data. Egypt. J. Remote Sens. Space Sci. 2017, 20, S3–S12. [Google Scholar] [CrossRef] [Green Version]
- Magno, R.; Pasqui, M.; Di Giuseppe, E. Analysis of changes in drought occurrence over the Mediterranean Basin using multiple time scales SPI index. In Proceedings of the 16th EMS Annual Meeting & 11th European Conference on Applied Climatology (ECAC), Trieste, Italy, 12–16 September 2016. [Google Scholar]
- Cavus, Y.; Aksoy, H. Spatial Drought Characterization for Seyhan River Basin in the Mediterranean Region of Turkey. Water 2019, 11, 1331. [Google Scholar] [CrossRef] [Green Version]
- Caloiero, T.; Caroletti, G.N.; Coscarelli, R. TRMM-based rainfall temporal analysis over Italy. SN Appl. Sci. 2020, 2, 1270. [Google Scholar] [CrossRef]
- Köppen, W. Das Geographische System der Klimate. Handbuch der Klimatologie; Köppen, W., Geiger, R., Eds.; Verlag von Gebrüder Borntraeger: Berlin, Germany, 1936; Volume 1, pp. 1–44. [Google Scholar]
- Spinoni, J.; Naumann, G.; Vogt, J.V.; Barbosa, P. The biggest drought events in Europe from 1950 to 2012. J. Hydrol. Reg. Stud. 2015, 3, 509–524. [Google Scholar] [CrossRef]
- Bonaccorso, B.; Bordi, I.; Cancelliere, A.; Rossi, G.; Sutera, A. Spatial variability of drought: An analysis of SPI in Sicily. Water Resour. Manag. 2003, 17, 273–296. [Google Scholar] [CrossRef]
- Mendicino, G.; Senatore, A.; Versace, P. A Groundwater Resource Index (GRI) for drought monitoring and forecasting in a Mediterranean climate. J. Hydrol. 2008, 357, 282–302. [Google Scholar] [CrossRef]
- Vergni, L.; Todisco, F. Spatio-temporal variability of precipitation temperature and agricultural drought indices in Central Italy. Agric. For. Meteorol. 2011, 151, 301–313. [Google Scholar] [CrossRef]
- Capra, A.; Consoli, S.; Scicolone, B. Long-term climatic variability in Calabria and effects on drought and agrometeorological parameters. Water Resour. Manag. 2013, 27, 601–617. [Google Scholar] [CrossRef]
- Caloiero, T.; Coscarelli, R.; Ferrari, E.; Sirangelo, B. Occurrence Probabilities of Wet and Dry Periods in Southern Italy through the SPI Evaluated on Synthetic Monthly Precipitation Series. Water 2018, 10, 336. [Google Scholar] [CrossRef] [Green Version]
- Caloiero, T.; Veltri, S. Drought Assessment in the Sardinia Region (Italy) During 1922–2011 Using the Standardized Precipitation Index. Pure Appl. Geophys. 2019, 176, 925–935. [Google Scholar] [CrossRef]
- Toté, C.; Patricio, D.; Boogaard, H.; van der Wijngaart, R.; Tarnavsky, E.; Funk, C. Evaluation of Satellite Rainfall Estimates for Drought and Flood Monitoring in Mozambique. Remote Sens. 2015, 7, 1758–1776. [Google Scholar] [CrossRef] [Green Version]
- Fan, F.M.; Collischonn, W.; Quiroz, K.; Sorribas, M.; Buarque, D.; Siqueira, V. Flood forecasting on the Tocantins River using ensemble rainfall forecasts and real-time satellite rainfall estimates. J. Flood Risk Manag. 2016, 9, 278–288. [Google Scholar] [CrossRef]
- Zambrano, F.; Wardlow, B.; Tadesse, T.; Lillo-Saavedra, M.; Lagos, O. Evaluating satellite-derived long-term historical precipitation datasets for drought monitoring in Chile. Atmos. Res. 2017, 186, 26–42. [Google Scholar] [CrossRef]
- Gao, F.; Zhang, Y.; Ren, X.; Yao, Y.; Hao, Z.; Cai, W. Evaluation of CHIRPS and its application for drought monitoring over the Haihe River Basin, China. Nat. Hazard 2018, 92, 155–172. [Google Scholar] [CrossRef]
- Zhu, Q.; Luo, Y.; Zhou, D.; Xu, Y.-P.; Wang, G.; Gao, H. Drought Monitoring Utility using Satellite-Based Precipitation Products over the Xiang River Basin in China. Remote Sens. 2019, 11, 1483. [Google Scholar] [CrossRef] [Green Version]
- Zeng, H.; Li, L.; Li, J. The evaluation of TRMM Multisatellite Precipitation Analysis (TMPA) in drought monitoring in the Lancang River Basin. J. Geogr. Sci. 2012, 22, 273–282. [Google Scholar] [CrossRef]
- Lu, J.; Jia, L.; Menenti, M.; Yan, Y.; Zheng, C.; Zhou, J. Performance of the Standardized Precipitation Index Based on the TMPA and CMORPH Precipitation Products for Drought Monitoring in China. IEEE J. Sel. Top. Appl. Earth Obs. Remote Sens. 2018, 11, 1387–1396. [Google Scholar] [CrossRef]
- Jang, S.; Center, A.C.; Rhee, J.; Center, A.C.; Yoon, S.; Center, A.C.; Lee, T.; Park, K.; Center, A.C. Evaluation of GPM IMERG Applicability Using SPI based Satellite Precipitation. J. Korean Soc. Agric. Eng. 2018, 59, 29–39. [Google Scholar]
- Angelidis, P.; Maris, F.; Kotsovinos, N.; Hrissanthou, V. Computation of drought index SPI with Alternative Distribution Functions. Water Resour. Manag. 2012, 26, 2453–2473. [Google Scholar] [CrossRef]
- Thom, H.C.S. A note on the gamma distribution. Mon. Weather Rev. 1958, 86, 117–122. [Google Scholar] [CrossRef]
- Abramowitz, M.; Stegun, I.A. Handbook of Mathematical Functions with Formulas, Graphs, and Mathematical Tables; Dover Publications, Inc.: New York, NY, USA, 1970. [Google Scholar]
- Yevjevich, V. An Objective Approach to Definitions and Investigation of Continental Hydrologic Droughts. In Hydrology Paper 23; Colorado State University: Fort Collins, CO, USA, 1967. [Google Scholar]
- Mishra, A.K.; Singh, V.P. A review of drought concepts. J. Hydrol. 2010, 391, 202–216. [Google Scholar] [CrossRef]
- Wu, R.; Zhang, J.; Bao, Y.; Guo, E. Run Theory and Copula-Based Drought Risk Analysis for Songnen Grassland in Northeastern China. Sustainability 2019, 11, 6032. [Google Scholar] [CrossRef] [Green Version]
- Liu, X.; Wang, S.; Zhou, Y.; Wang, F.; Li, W.; Liu, W. Regionalization and Spatiotemporal Variation of Drought in China Based on Standardized Precipitation Evapotranspiration Index (1961–2013). Adv. Meteorol. 2015, 2015, 950262. [Google Scholar] [CrossRef] [Green Version]
- Da Rocha, R.L., Jr.; dos Santos Silva, F.D.; Costa, R.L.; Gomes, H.B.; Pinto, D.D.C.; Herdies, D.L. Bivariate Assessment of Drought Return Periods and Frequency in Brazilian Northeast Using Joint Distribution by Copula Method. Geosciences 2020, 10, 135. [Google Scholar] [CrossRef] [Green Version]
- Buttafuoco, G.; Caloiero, T.; Ricca, N.; Guagliardi, I. Assessment of drought and its uncertainty in a southern Italy area (Calabria region). Measurement 2018, 113, 205–210. [Google Scholar] [CrossRef]
- Oliver, J.E. Encyclopedia of World Climatology; Springer: Amsterdam, The Netherlands, 2005. [Google Scholar]
- Kalimeris, A.; Kolios, S. TRMM-based rainfall variability over the Central Mediterranean and its relationships with atmosphric and oceanic climate models. Atmos. Res. 2019, 230, 104649. [Google Scholar] [CrossRef]
- Nastos, P.T.; Kaposmenakis, J.; Philandras, K.M. Evaluation of the TRMM 3B43 gridded rainfall estimates over Greece. Atmos. Res. 2016, 169, 497–514. [Google Scholar] [CrossRef]
- Kolios, S.; Kalimeris, A. Evaluation of the TRMM rainfall product accuracy over the central Mediterranean during a 20-year period. Theor. Appl. Climatol. 2020, 139, 785–799. [Google Scholar] [CrossRef]
- Hoerling, M.; Eischeid, J.; Perlwitz, J.; Quan, X.; Zhang, T.; Pegion, P. On the increased frequency of Mediterranean drought. J. Clim. 2012, 25, 2146–2161. [Google Scholar] [CrossRef] [Green Version]
- Baronetti, A.; González-Hidalgo, J.C.; Vicente-Serrano, S.M.; Acquaotta, F.; Fratianni, S. A weekly spatio-temporal distribution of drought events over the Po Plain (North Italy) in the last five decades. Int. J. Climatol. 2020, 40, 4463–4476. [Google Scholar] [CrossRef]
- Vicente-Serrano, S.M.; López-Moreno, J.I.; Lorenzo-Lacruz, J.; El Kenawy, A.; Azorin-Molina, C.; Morán-Tejeda, E.; Pasho, E.; Zabalza, J.; Begueria, S.; Angulo-Martinez, M. The NAO impact on droughts in the Mediterranean region. In Hydrological, Socioeconomic and Ecological Impacts of the North Atlantic Oscillation in the Mediterranean Region Advances in Global Change Research; Springer: Dordrecht, The Netherlands, 2011. [Google Scholar]


| SPI Value | Class | Probability (%) |
|---|---|---|
| SPI ≥ 2.00 | Extremely wet | 2.3 |
| 1.5 ≤ SPI < 2.00 | Severely wet | 4.4 |
| SPI < 1.50 | Moderately wet | 9.2 |
| SPI < 1.00 | Mildly wet | 34.1 |
| −1.00 ≤ SPI < 0.00 | Mild drought | 34.1 |
| −1.50 ≤ SPI < −1.00 | Moderate drought | 9.2 |
| −2.00 ≤ SPI < −1.50 | Severe drought | 4.4 |
| SPI < −2.00 | Extreme drought | 2.3 |
Publisher’s Note: MDPI stays neutral with regard to jurisdictional claims in published maps and institutional affiliations. |
© 2021 by the authors. Licensee MDPI, Basel, Switzerland. This article is an open access article distributed under the terms and conditions of the Creative Commons Attribution (CC BY) license (https://creativecommons.org/licenses/by/4.0/).
Share and Cite
Caloiero, T.; Caroletti, G.N.; Coscarelli, R. IMERG-Based Meteorological Drought Analysis over Italy. Climate 2021, 9, 65. https://doi.org/10.3390/cli9040065
Caloiero T, Caroletti GN, Coscarelli R. IMERG-Based Meteorological Drought Analysis over Italy. Climate. 2021; 9(4):65. https://doi.org/10.3390/cli9040065
Chicago/Turabian StyleCaloiero, Tommaso, Giulio Nils Caroletti, and Roberto Coscarelli. 2021. "IMERG-Based Meteorological Drought Analysis over Italy" Climate 9, no. 4: 65. https://doi.org/10.3390/cli9040065