Article

Land Use/Cover Response to Rainfall Variability: A Comparing Analysis between NDVI and EVI in the Southwest of Burkina Faso

by
Benewinde J.-B. Zoungrana
1,*,
Christopher Conrad
2,
Leonard K. Amekudzi
3,
Michael Thiel
2 and
Evariste Dapola Da
4
1
Department of Civil Engineering, Kwame Nkrumah University of Science and Technology, Kumasi, Ghana
2
Remote Sensing Unit at the Institute of Geography, University of Wuerzburg, Am Hubland, 97074 Wuerzburg, Germany
3
Department of Physics, Kwame Nkrumah University of Science and Technology, Kumasi, Ghana
4
Department of Geography, University of Ouagadougou, 03 B.P. 7021 Ouagadougou, Burkina Faso
*
Author to whom correspondence should be addressed.
Climate 2015, 3(1), 63-77; https://doi.org/10.3390/cli3010063
Submission received: 8 October 2014 / Accepted: 15 December 2014 / Published: 24 December 2014
(This article belongs to the Special Issue Ecological Impacts of Climate Change)

Abstract

:
A comparative analysis of the sensitivity of NDVI and EVI to rainfall indicators has been carried out for different land use/covers in the Southwest of Burkina Faso. Three classified land use/covers maps for 1999, 2006 and 2011 were produced and change detection was applied to locate persistent areas. Thereafter monthly vegetation indices of plots of 750 × 750 m2 were extracted from 2001 to 2011 for persistent woodland, mixed vegetation, and agricultural area within 5 km radius around four rain gauges. Furthermore, correlation analysis to measure the relationship between vegetation indices and rainfall indicators was performed. The results indicate some similarities between NDVI and EVI. Both indices, for all land use/covers, showed significant and strong positive correlation with the rainfall indicators. In general, NDVI was more sensitive to rainfall than EVI in the study area, but the difference between the Pearson’s coefficient values of both vegetation indices was insignificant. The findings of this work agree with some previous studies, but contrasting conclusions were also noted in literature. Hence wider spatial investigation will be necessary to confirm the results of this paper.

1. Introduction

Climate change is intensifying rainfall variability over West Africa causing extreme events, such as droughts and floods [1]. This may have consequences on land surface vegetation in this zone since climate plays a key role in vegetation condition. Therefore, it is essential to assess and quantify the response of vegetation to rainfall variability.
Land use/cover (LULC) is of particular interest in assessing the relationship between vegetation and rainfall because their modification is a key factor in global environmental change [2]. For instance, Nightingale and Phinn [3] found a strong relationship between precipitation and NDVI (Normalized Difference Vegetation Index) of five land cover types within South Australia and also noted significant positive correlation between precipitation and NDVI for cumulative precipitation over two to four months. Comparing different land covers response to rainfall in the Sahel and East Africa, Nicholson et al. [4] concluded that NDVI is best correlated with the rainfall total for the concurrent and two antecedent months and found this correlation to be better in the Sahel than in East Africa. In Central Asia, Gessner et al. [5] assessed vegetation sensitivity to precipitation anomalies based on time-series of NDVI and gridded precipitation datasets (GPCC Full Data Reanalysis) during the period 1982–2006 and found that the response of vegetation was strong for precipitation anomalies integrated over periods of two to four months, and there is a temporal lag between precipitation anomalies and vegetation activity for one to three months. Concerning the response timing of NDVI to rainfall, maximum correlation for lag of one month and three months cumulative rainfall have been reported by other researchers (e.g., [6,7]). All these studies generally used long time series of NDVI and rainfall against land use/cover data derived for a given year [5]. These researches assumed no change in land use/covers during the time of observation. Applying this method in an area like West African’s savanna where land use/covers change rapidly could cause bias in the analysis.
Modeling approach has also been applied in the assessment of vegetation response to rainfall (e.g., [8,9,10]). Most often linear correlation is used to measure the relation between vegetation and rainfall (e.g., [3,4,5]), but also non-linearity of this relationship was found (e.g., [11,12]). For instance, a polynomial relationship was found to be the best fit between NDVI and rainfall by Boken and Chandra [11] and Fontes de Sousa et al. [12]. Gaughan et al. [8] applied geographically weighted regression to investigate the response of the end of the wet season vegetation production, as measured by MODIS NDVI, to the different months of wet season rainfall for different land cover types in a regional catchment of southern Africa; the results showed that intra-annual wet season rainfall accounts for significant amounts of April NDVI variation. Chaoka et al. [9] used a Seasonal Model (SM) and a linear Perturbation Model (LPM) to assess the relationship between NDVI and rainfall data in a large tropical catchment and concluded that the LPM performed better than the simple seasonal model. Hashemi [10] applied a simple linear regression and multivariate regression to model NDVI response to different cumulated monthly rainfall in Azerbaijan province of Northern Iran and noticed that multivariate regression analysis performed better than simple linear regression.
One of the common points of these aforementioned studies (e.g., [3,5,8]) is the choice of NDVI as indicator of vegetation dynamics. Very few studies, like Bobee et al. [13], tried other indices like Leaf Area Index (LAI) to study the response of vegetation to rainfall in northwest Senegal.
In savanna regions, NDVI signals were found to be limited to express vegetation response to rainfall [14,15]. Huete et al. [
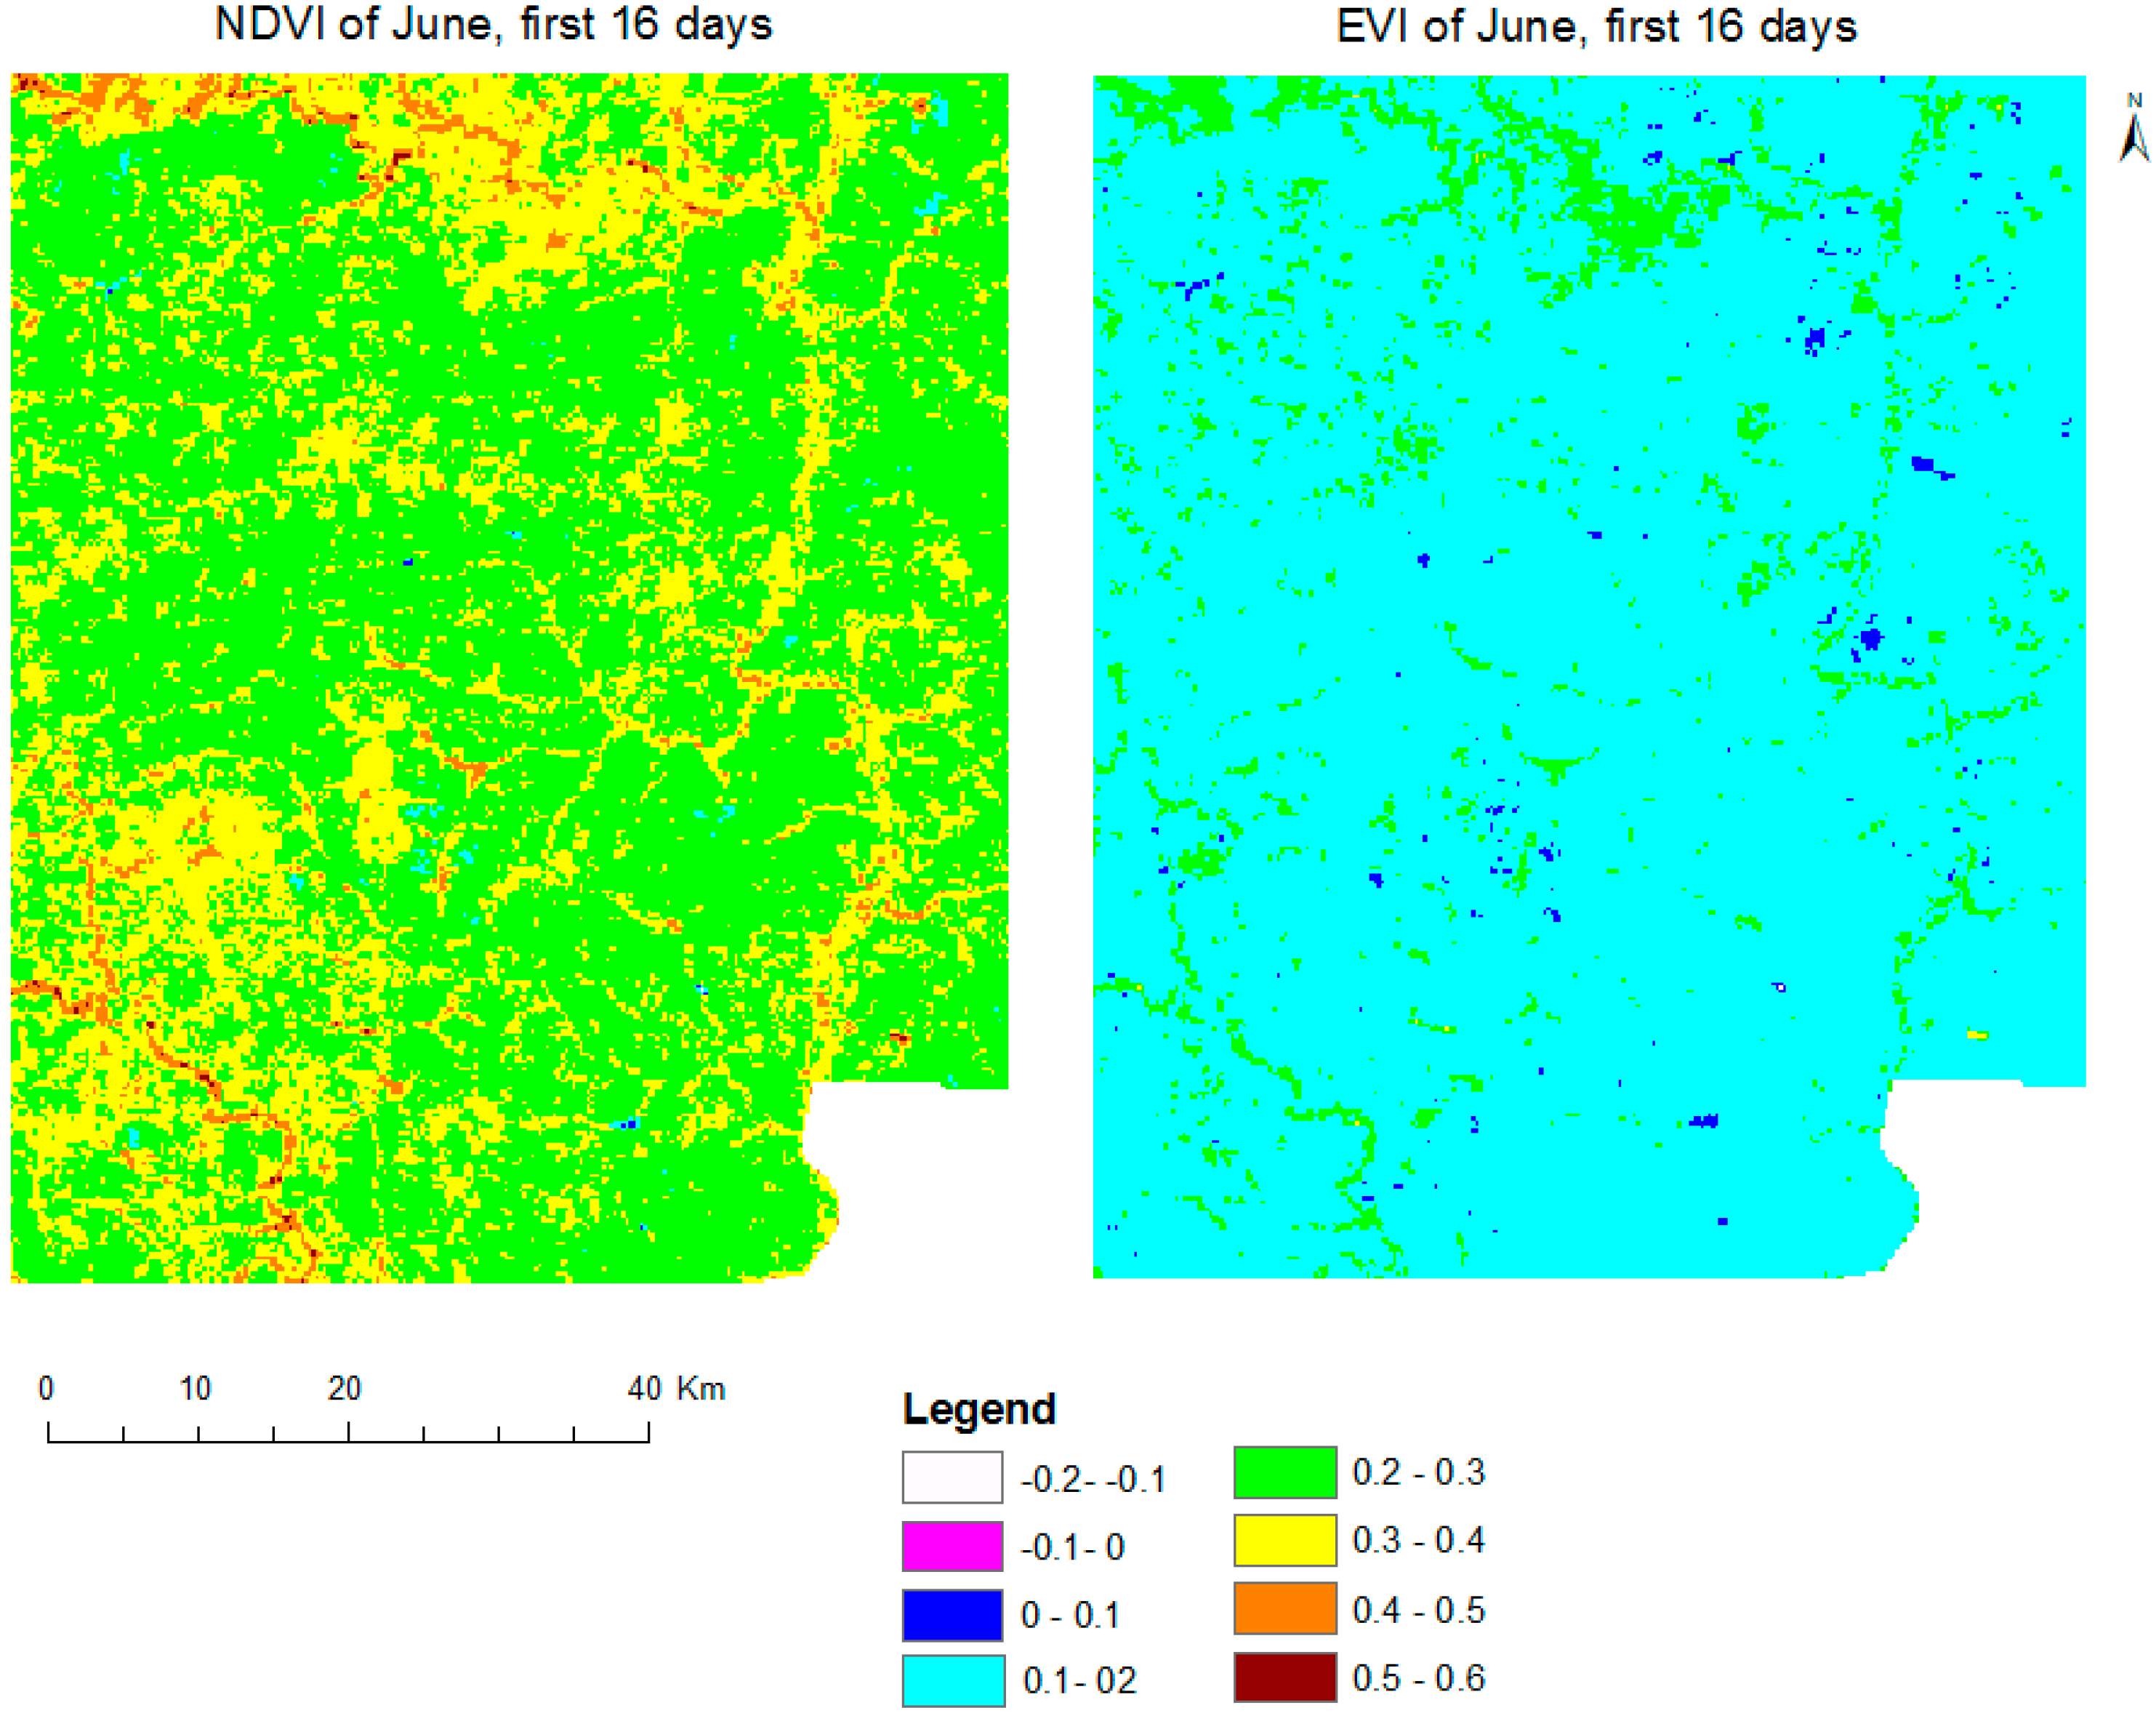
16] supported that this is due to spectral variability of background material, such as soil albedo, which causes nonlinearity between NDVI and vegetation cover. The Enhance Vegetation Index (EVI) has been developed to improve the quality of NDVI, by solving the problem of distortions in the reflected light due to atmospheric particles and the ground cover below the vegetation. In addition, EVI does not saturate rapidly as NDVI [17].
However, in literature, comparison studies carried out between NDVI and EVI showed contrasting results. Son et al. [18] noted that EVI-based models were slightly more accurate than those from NDVI-based models in rice crop yields estimation in the Mekong River Delta of Vietnam. On the other hand, Li et al. [19] in a study carried out in Northern Hebei Province of China indicate that NDVI has a stronger correlation with field data of vegetation covers than EVI and so has obvious advantages for predicting natural vegetation coverage better than EVI. Wardlow et al. [20] in turn found that for crop mapping EVI and NDVI produced equivalent results in Southwest Kansas.
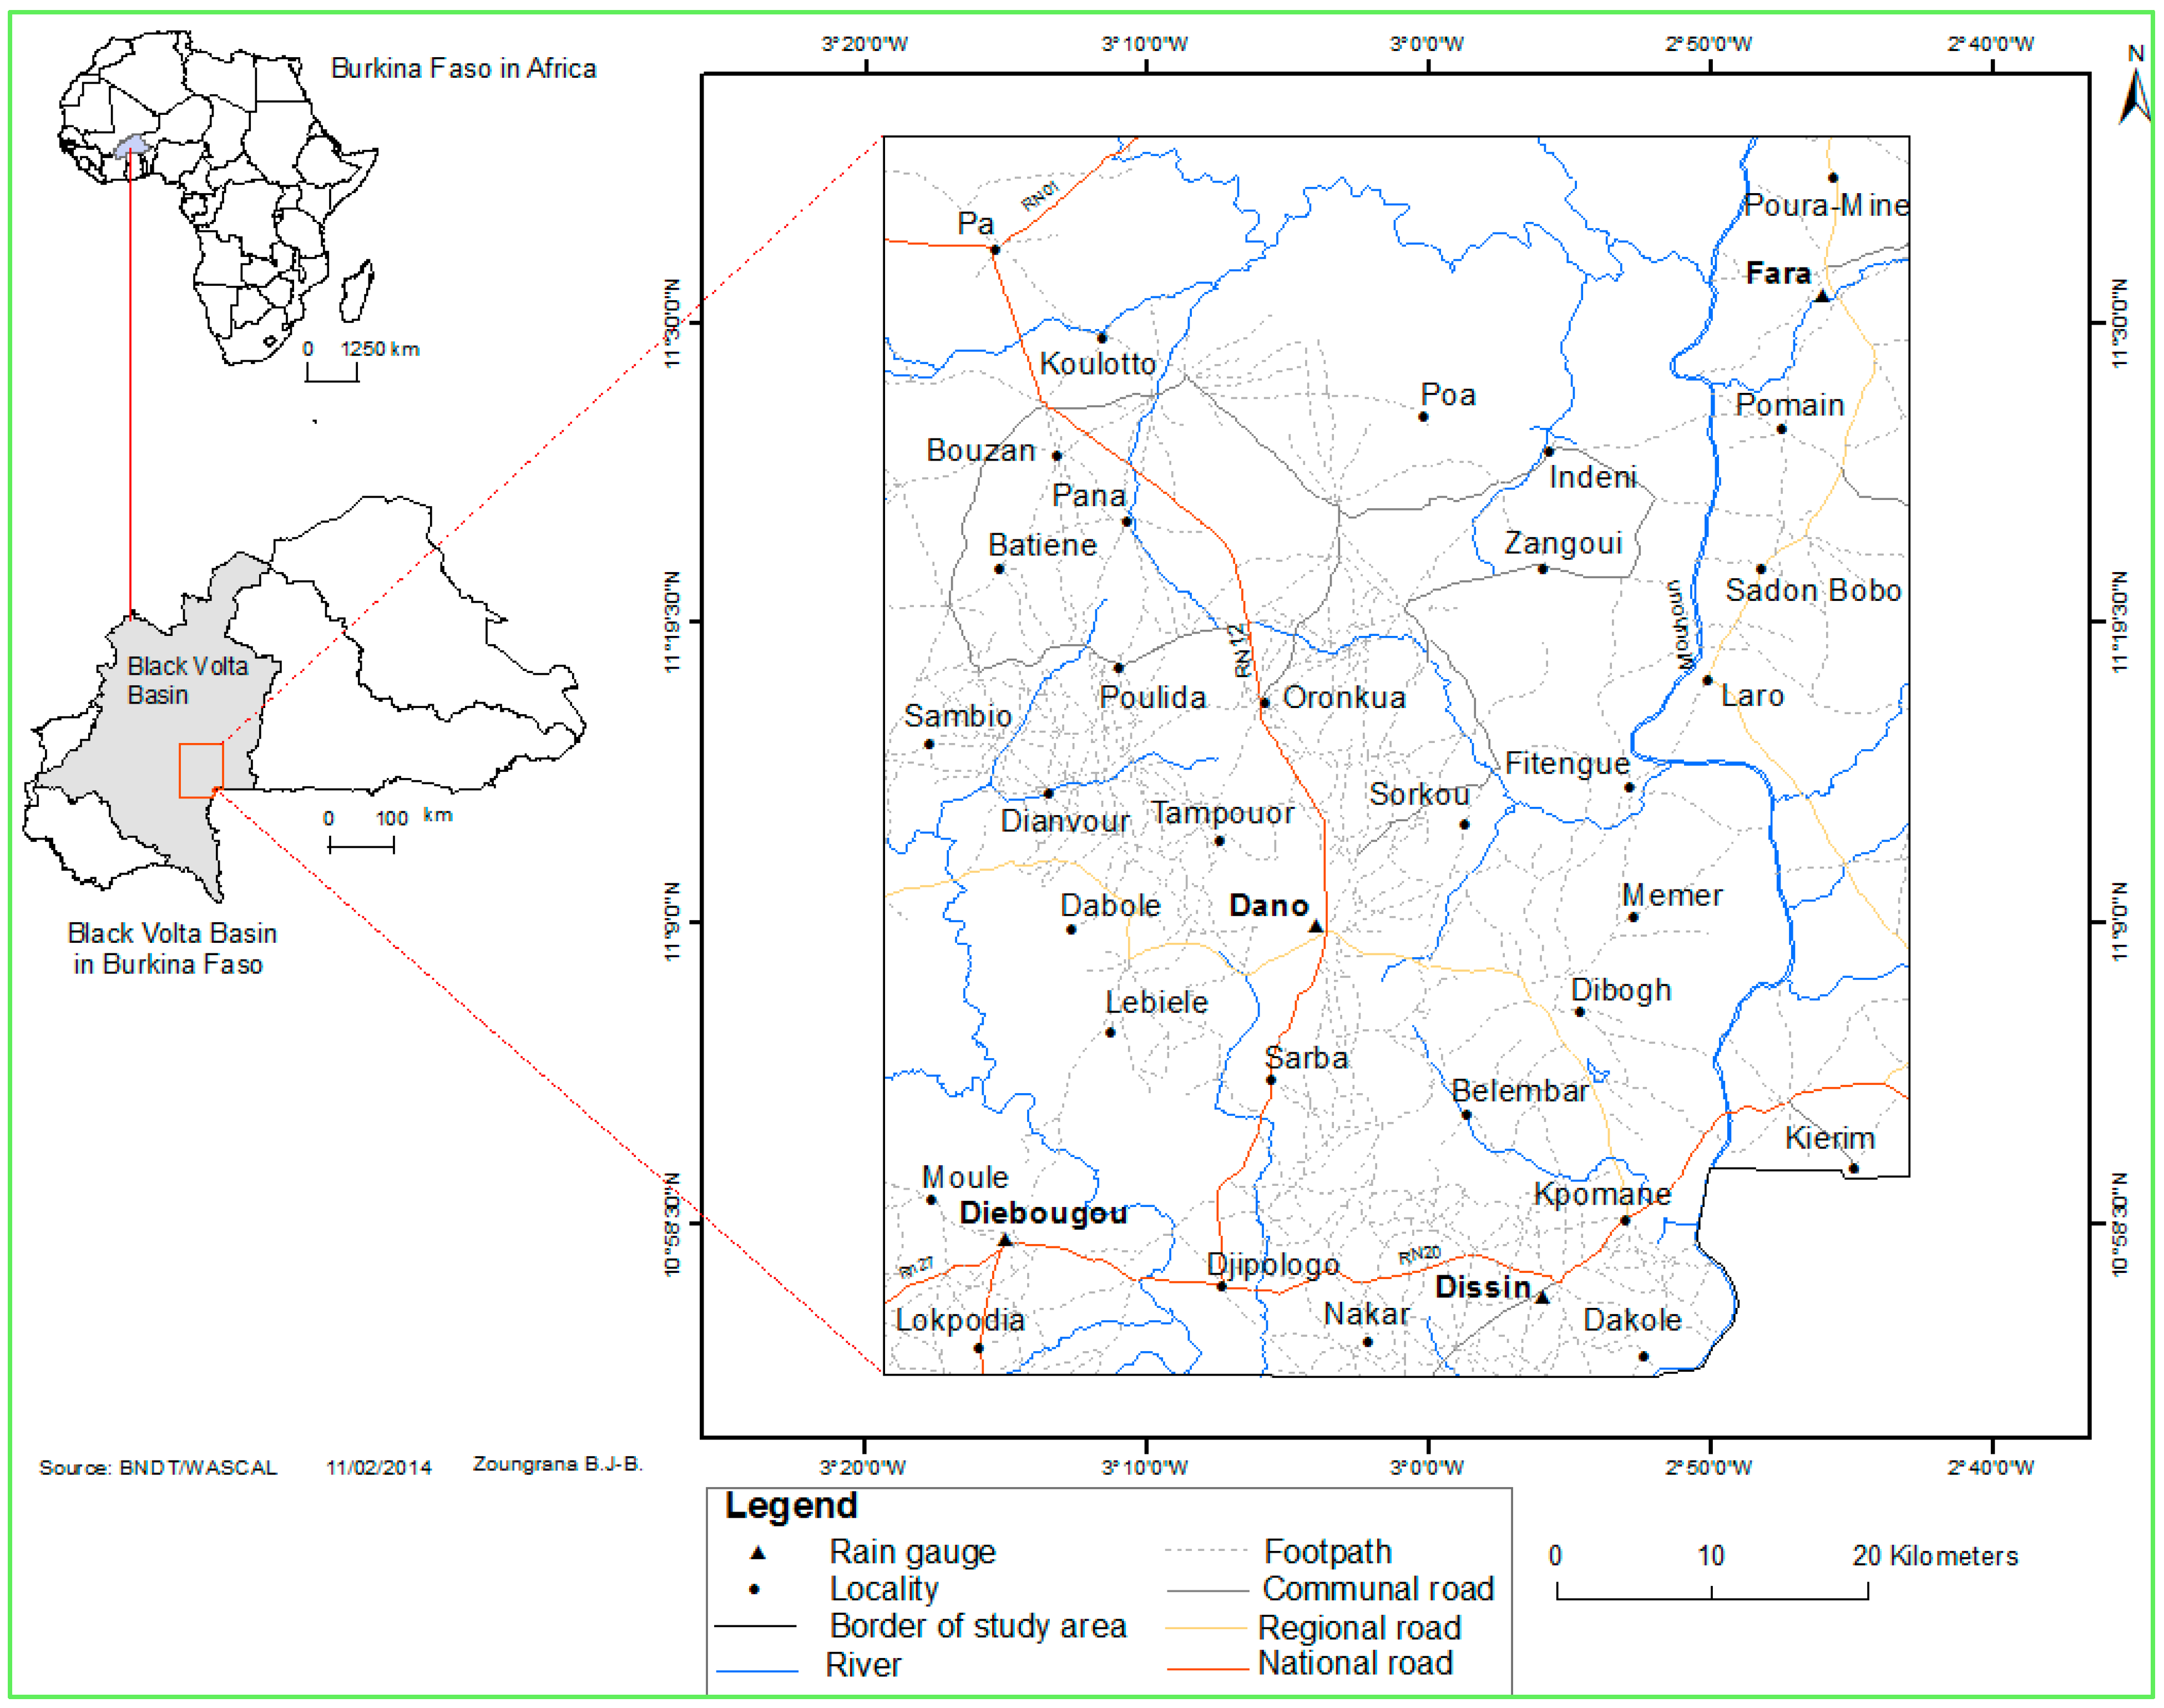
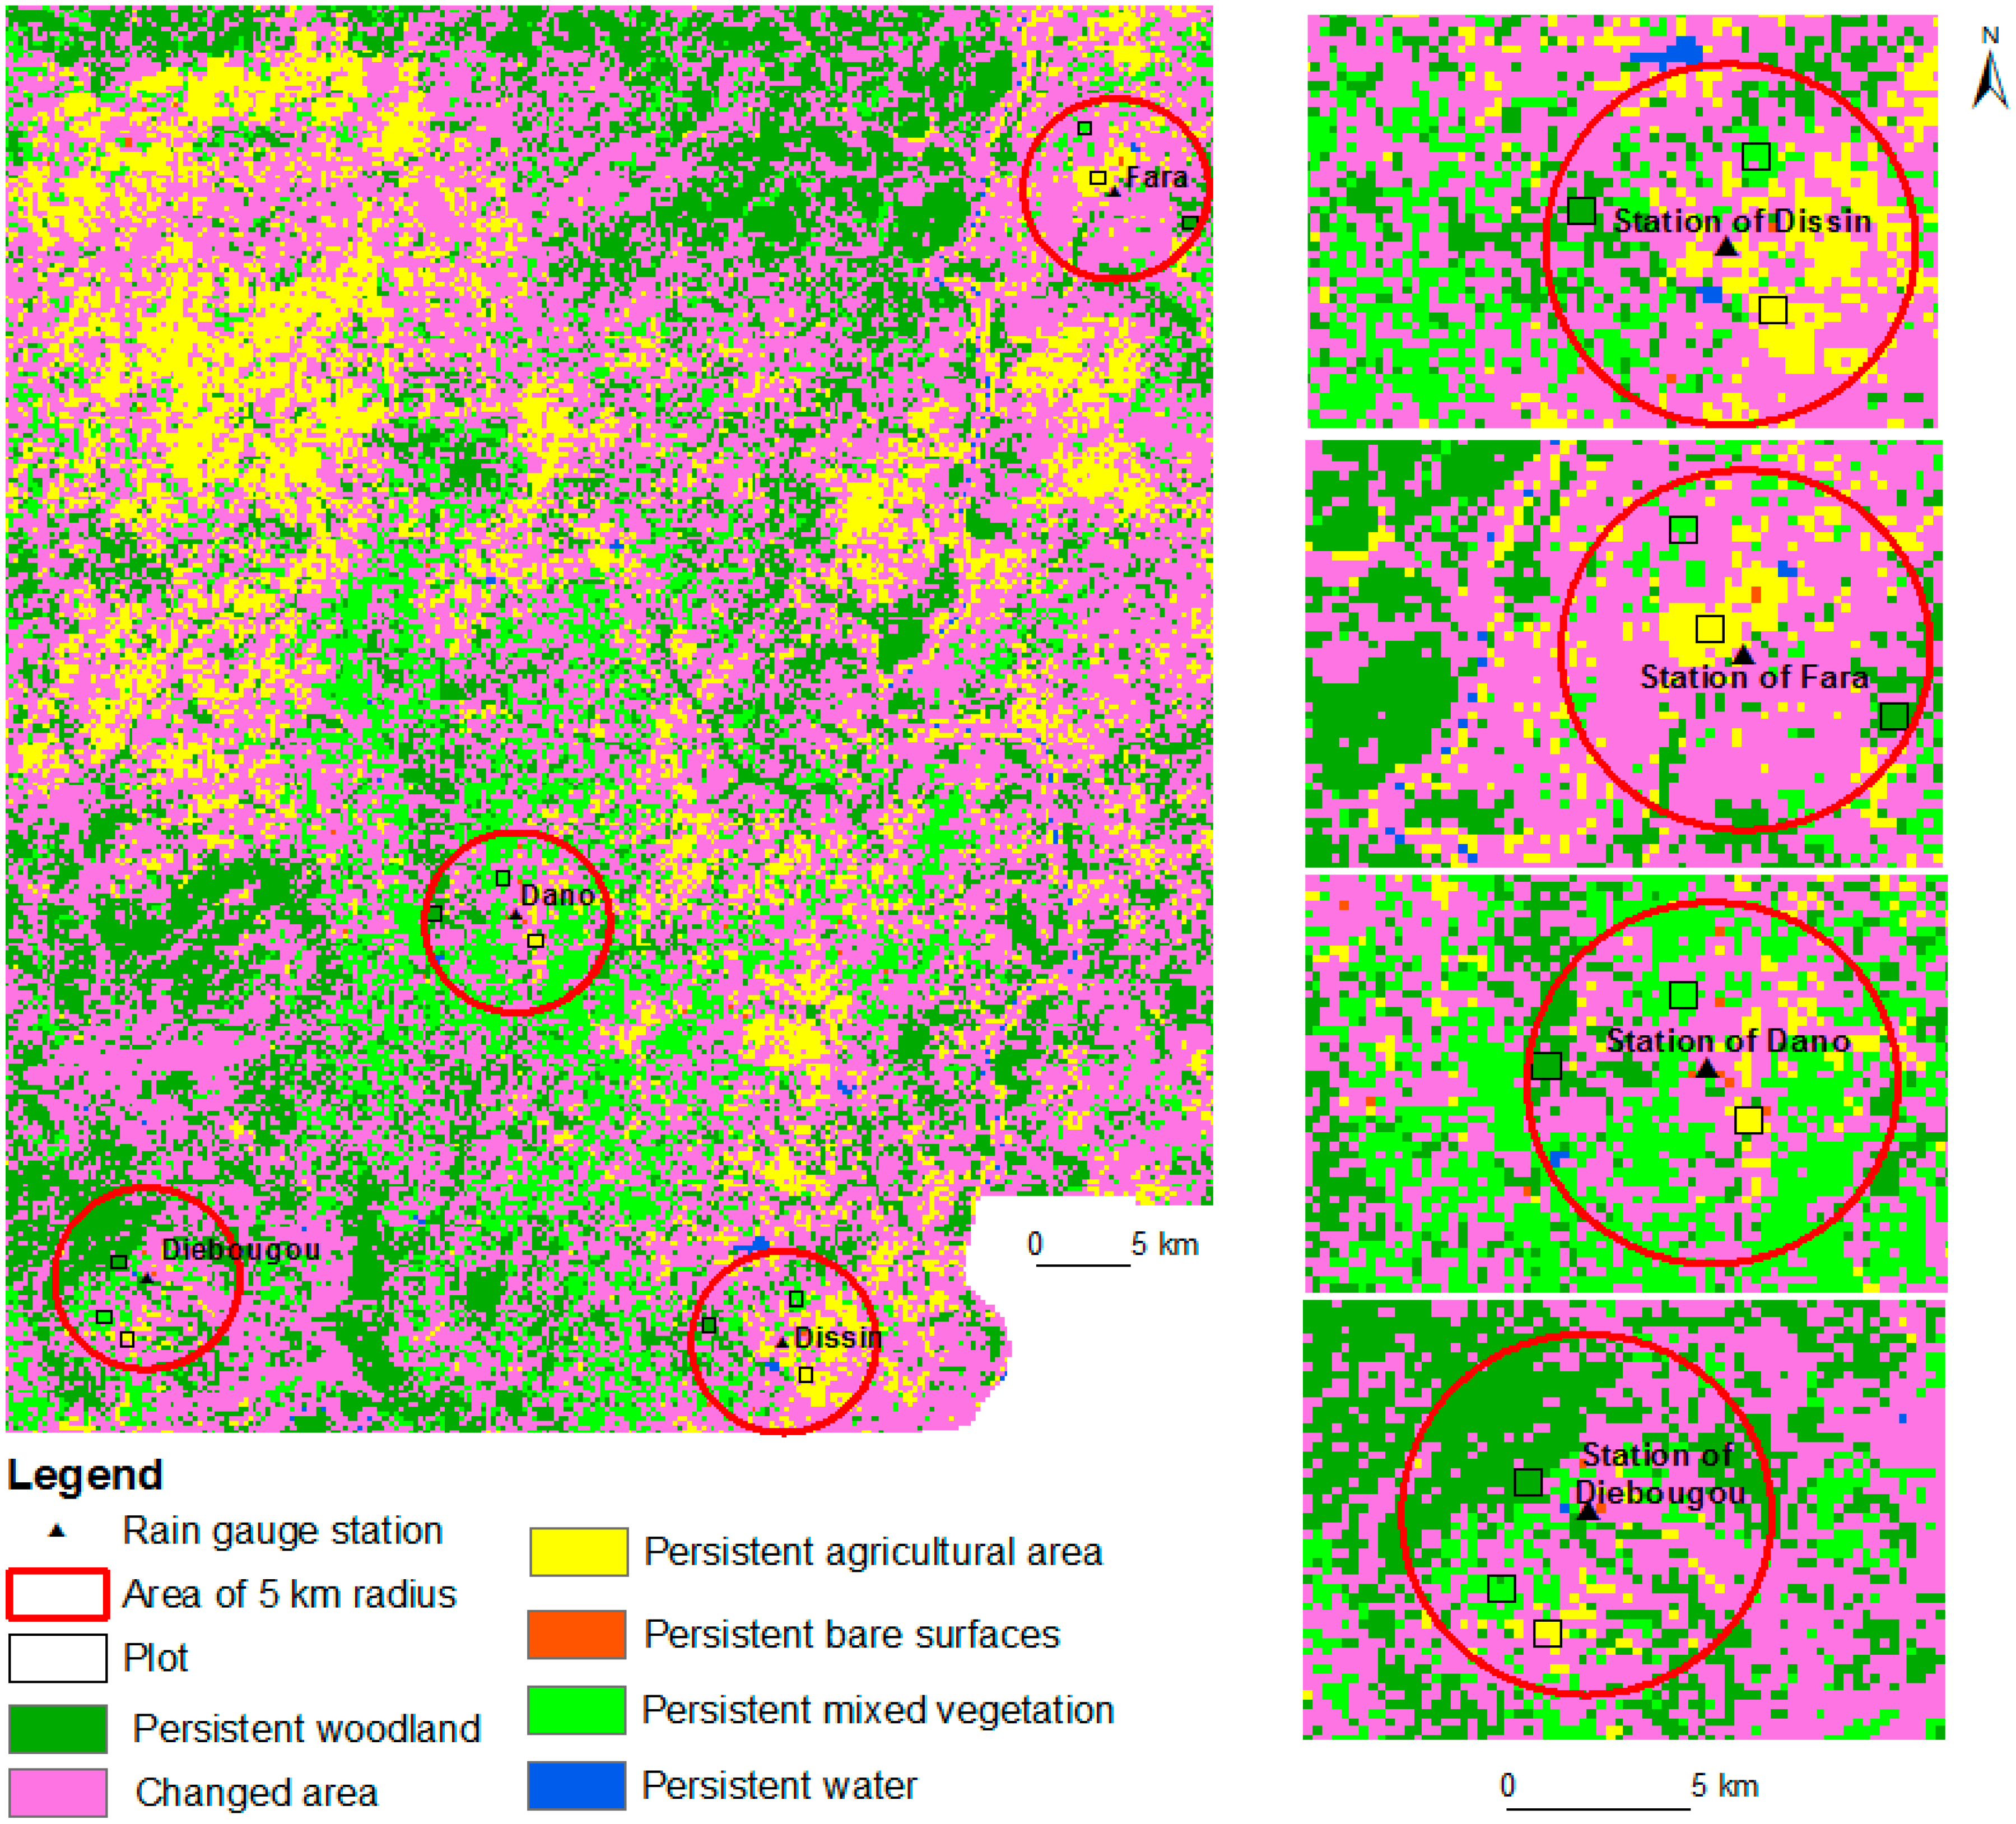
These contrasting conclusions raise the need for more investigation on the performance of NDVI and EVI especially relating to the relationship between vegetation and rainfall variability in West Africa’s savanna where comparative studies are limited, and researches on both indices behavior for different land use/cover types are still rare. The present research, focusing on the relation of NDVI and EVI with rainfall, will fill this gap. The aim of this study is to assess the sensitivity of NDVI and EVI to rainfall variability in the Southwest of Burkina Faso for different land use/covers.

2. Methodology

2.1. Study Area

The study area is situated in the Black Volta basin of Burkina Faso and covers an area of 5119.3 km2 (Figure 1). The climate is Sudan savanna modulated by the Inter Tropical Convergence Zone (ITCZ), and characterized by two main seasons. The rainy season extends from May to October. The dry season occurs between November and April. The average monthly temperature range from 26 °C to 32 °C and the average annual rainfall in the period 1981–2012 is estimated to be 862.87 mm. Rainfall is marked by high inter-annual variability. Vegetation is characterized by Sudanese savanna. The dominant woody species are Gardenia sp, Combretum micranthum, Parkia biglobosa, Butyro spermum parkii, Bombax costatum, Berlinia grandifotia, among other. The dominant herbaceous are Vetiveria nigritana, Urena lobata, Oryza barthii, Paspalum orbiculare, Hygrophila auriculata. The annual herbaceous species are Andropogon pseudapricus, Loudetia Togoensis, Pennisetum pedicellatum, Diheteropogon hagerupii. Locally, natural vegetation is distributed according to topography (altitude, slope and aspect), edaphic conditions and especially ground water availability (e.g., woodlands dominating along river beds in topographic depressions) [21].
Figure 1. Situation of the study area and the rain gauges utilized for this study.
Climate 03 00063 g001
The main livelihood activity of the local population is farming. In this zone, agriculture is characterized by low inputs (e.g., fertilizers). Slash and burn remains the dominant farming practice [22]. The main crop productions are sorghum, cotton, maize, millet, bean, groundnut, sesame and rice. Bush fallow practice is less applied and most often land is cultivated until loss of fertility. Organic manure remains the most preferred fertilizer of most farmers.

2.2. Data Acquisition and Processing

2.2.1. Land Use/Covers and Persistent Areas Mapping

Global land cover data, such as GlobCover and MODIS Land Cover Type (MCD12Q1) are available for the study area, but they are limited due to confusions for mixed and spatially heterogeneous classes [23]. Therefore, land use/cover data were derived by classifying freely available satellite images. In order to select more stable and persistent land use/covers during the observation period, three Landsat TM images of October 1999 and 2011 and November 2006 were chosen for classification. These images were acquired on 20 October 1999, 16 November 2006 and 29 October 2011. The acquisition dates at the onset of the dry season were particularly found suitable for the separation of cropland, especially from grassland and other types of natural vegetation, in the study region [24]. All the three images were free of clouds and recorded under good atmospheric conditions.
The Landsat images were obtained from GLOVIS website [25]. These images were geometrically corrected and calibrated. This means that, by using the respective metadata files, the digital number values of the different bands were converted to at-sensor reflectance. Aerial photos, high spatial resolution images of Quickbird and field data enabled the generation of training and validation data for the classification which was performed using Random Forest (RF) and the software, R. For each land use/cover the maximum training and validation samples were 800 and 2000 respectively. The number of trees built in each classification was 500. Five main land use/covers were considered: woodland, mixed vegetation (tree, shrub and grass mixture), agricultural area, bare surfaces (bare land, rock, urban area and tarred roads) and water. The number of classes was kept to a minimum in order to reduce confusion between classes and improve classification accuracy.
Random Forest algorithm was used for the classification. This algorithm is a machine-learning based classifier such as Bagging and Boosting [26]. Characterized as ensemble model, RF combines the results of different models to compute an output. That is to say, many individual decision trees were constructed from which a final class assignment was determined [27]. RF is non-parametric method that is easy to parameterize and it is neither sensitive to noise nor subject to over fitting. Previous studies have found that RF returning accuracies exceeded those of numerous other classification algorithms (e.g., [28,29]). The resulting classified images were resampled to 250 m by applying the majority rule. Then the persistent land use/cover areas between 1999, 2006 and 2011 were identified by change detection; the aim is to focus the analysis on unchanged vegetation during the observation period because land use/covers change rapidly in West Africa’s savanna [22].

2.2.2. Rainfall Data

Rainfall data were collected from the National Meteorological Directorate of Burkina Faso at monthly scale, from 2000 to 2011. The location of the four stations analyzed in this study is given in Figure 1. Four rainfall indicators have been computed (Table 1). It is mentioned in literature that these four rainfall indicators have better relation with vegetation temporal dynamics [3,4,5]. The period 2001–2011 were used to compute the monthly cumulated precipitation.
Table 1. Indicators characterizing rainfall variability in the study.
IndicatorsDescription
Amount of pcp (lag 1 month)1 month lag precipitation
Cumulated 2 months pcpSum of precipitation of current and previous 1 month
Cumulated 3 months pcpSum of precipitation of current and previous 2 months
Cumulated 4 months pcpSum of precipitation of current and previous 3 months

2.2.3. Vegetation Indices

Vegetation indices data were obtained from MODIS Terra MOD13Q1 product from 2001 to 2011. It comprises 16-days composites of the Red, Near-Infrared (NIR), Mid-Infrared (MIR), Enhanced Vegetation Index (EVI) and NDVI. The data were downloaded from the USGS’ MRTWeb interface [30], then resized and reprojected to WGS 84 zone 30. The software TiSeG (Time-Series Generator) developed by Colditz et al. [31] was used firstly to assess the quality of the MODIS product and, secondly to correct invalid data and fill gaps by linear interpolation. Among other settings of TiSeG, the quality setting UI5-CS (Perfect-Intermediate, no Cloud and no Shadow) was found to give results close to undisturbed situation and, therefore, was applied in this analysis.
Monthly NDVI and EVI time series were extracted for each land use/cover type within plots of 750 × 750 m2 (3 × 3 window). The plots were located inside a radius of 5 km around each of the 4 rain gauges spread in the study area. The computation of NDVI and EVI is described in Equations (1) and (2).
NDVI = NIR RED NIR + RED
where, NIR and RED are, respectively, the near infrared and the red reflectance. NDVI generally is chlorophyll sensitive (greenness) [32].
EVI = G ( NIR RED ) ( NIR + C 1 RED C 2 BLUE + L )
where, NIR, RED and BLUE are, respectively, near infrared, red and blue reflectance. L is the canopy background or soil adjustment factor. G is the gain factor. C1, C2 are the coefficients of the aerosol resistance. In the selected Terra MOD13Q1 product the coefficient values are; L = 1, C 1 = 6, C 2 = 7.5, and G = 2.5. The EVI products are expected to improve sensitivity in high biomass area and reduce atmospheric and canopy background effect on vegetation signal. Therefore EVI is more responsive to canopy structural variations, including LAI, canopy type and architecture [32,33].
Figure 2. First 16 days NDVI and EVI composited images of June of the study area.
Climate 03 00063 g002
Figure 2 shows the distribution of NDVI and EVI values from the first 16 days of the month of June in the study area. It appears that the range of NDVI values is higher than EVI in this zone.
Correlation analysis was performed between each land use/cover indices (NDVI and EVI) and the different indicators of rainfall to assess their relationship. The coefficient of Pearson enabled the magnitude of each correlation to be measured. In total 48 correlations have been done and the performance of each vegetation index was then investigated. The formula of coefficient of Pearson (r) is given in Equation (3) as
r = i = 1 n ( X i X - ) ( Y i Y - ) i n ( X i X - ) 2 i n ( Y i Y - ) 2
where X i and Y i are individual observations of variables X and Y, respectively. X - and Y - are the mean of X and Y.

3. Results and Discussion

3.1. Persistent Land Use/Cover Map

The overall accuracy of the Random Forest algorithm classification derived according to Congalton and Green [34] were estimated to be 92.4%, 92.3% and 91.6% for 2011, 2006 and 1999 images, respectively. Figure 3 presents the change detection map highlighting persistent areas for each land use/cover type for the three different years. For the correlation analysis, plots of 750 × 750 m2 were located on persistent vegetated areas (for woodland, mixed vegetation and agricultural area) within a radius of 5 km around the rain gauges. The selected plots are shown in Figure 3.
The study area has known important land use/cover conversion from one type to another; indeed the changed area represents 54.50% of the total study area (Table 2). The main causes of those changes are pressures due to human activities (e.g., cropland expansion, livestock, woodfuel collection, bushfire, mining activities, built up and charcoal production) [22], but also effects of climatic variability, which increased in this zone [1]. Despite of the conversion some spots remained unchanged in which 21.77%, 10.59%, 12.95%, 0.15% and 0.04% are, respectively, woodland, mixed vegetation, agricultural area, water and bare surfaces.

3.2. Rainfall Variability between Stations

The mean total annual rainfall (period of 1981–2012) of the stations lies between 880.20 mm and 949 mm. The four stations have strong positive and significant correlation (Table 3). The inter-station correlation matrix shows coefficient of Pearson ranging from 0.848 to 0.917. The high values of the coefficient prove that rainfall has varied almost in the same way in all the stations during the period 2001–2011, i.e., very similar spatial patterns of precipitation were recognized.
Figure 3. Map of persistent areas of land use/covers between 1999, 2006 and 2011 (250 m).
Climate 03 00063 g003
Table 2. Proportion of persistent land use/covers and changed area between 1999, 2006 and 2011.
LULCPercentage
Persistent woodland21.77
Persistent mixed vegetation10.59
Persistent agricultural area12.95
Persistent water0.15
Persistent bare surfaces0.04
Changed area54.50
Table 3. Correlation matrix of stations and mean total annual rainfall.
StationDanoFaraDiebougouDissinMean Total Annual Rainfall
Dano10.8850.8500.917897.20
Fara0.88510.8740.899880.81
Diebougou0.8500.87410.848723.48
Dissin0.9170.8990.8481949.97
Correlation is significant at the 0.01 level (2-tailed).

3.3. Correlation Analysis between Land Use/Covers and the Indicators of Rainfall

3.3.1. NDVI as LULC Indicator

All the correlations were significant at p value level of 0.01. The NDVI of the land use/covers and the rainfall indicators have strong positive correlation (Table 4). The value of Pearson’s coefficient ranges from 0.798 to 0.945. This is supported by previous studies like Nightingale and Phinn [3] that noted significant and strong positive correlation between precipitation and NDVI for cumulative precipitation over two to four months. The good positive correlation of vegetation with one month lag precipitation has also been mentioned by other researchers (e.g., [5,35]).
The analysis shown in Table 4 revealed that cumulated three months, two months and four months precipitation have the highest influence on land use/cover classes, but to a less extent for the two latter. Most often, land use/covers were more sensitive to the variability of three months cumulated precipitation and less to one month lag precipitation. In various studies (e.g., [4,6,7]), three months cumulated rainfall was also found particularly performing with the NDVI. Another aspect raised by Table 4 is the response magnitude between and within land use/cover types. Actually no land use/cover type has shown a noticeable domination over others, except for cumulated four months precipitation where agricultural area shows higher performance in the four stations. The comparison of the four stations shows a difference in coefficient of Pearson within the same land use/cover class; this could be due to several factors, such as difference in soil moisture [14], plant community [36], anthropogenic activities and vegetation phenology [37,38,39].
Table 4. Correlation between NDVI of land use/cover types and rainfall variability indicators.
StationLULC1 month Lag pcpCum. 2 Months pcpCum. 3 Months pcpCum. 4 Months pcp
DanoAgricultural area0.8610.8480.9340.943
Mixed vegetation0.8490.9370.9170.825
Woodland0.8640.8930.9450.917
FaraAgricultural area0.8960.9210.9440.880
Mixed vegetation0.8600.9110.9180.846
Woodland0.8490.9030.9190.850
DiebougouAgricultural area0.8430.8730.9290.899
Mixed vegetation0.8290.9090.8980.798
Woodland0.8240.8690.9130.871
DissinAgricultural area0.8550.8730.9110.878
Mixed vegetation0.8590.8960.9120.858
Woodland0.8750.8910.9240.877
Correlation is significant at the 0.01 level (2-tailed).

3.3.2. EVI as LULC indicator and comparative analysis with NDVI

The analysis with EVI showed significant and strong positive correlations with rainfall indicators (see Table 5); these results are in some cases similar to those of NDVI. The Pearson’s coefficient for EVI is in the range of 0.768–0.946. This finding supports the good relationship noted in literature between the four rainfall indicators and vegetation indices. No land use/cover type is dominating in the relation with rainfall indicators, except agricultural areas that still remain more sensitive to four months of cumulated precipitation in the four stations. Similar to the NDVI results, the strength of correlations between EVI and rainfall indicators is different within each land use/cover type, which is likely due to the influence of local environment on the magnitude of vegetation response to rainfall. In the case of EVI, in addition to factors like soil moisture, plant community and phenology, topography may also cause difference in the response. Indeed, Méndez-Barroso et al. [36] noted that elevation controls EVI dynamics.
There are also discrepancies in the results. Unlike NDVI, the EVI of land use/cover has stronger correlation with cumulated two months precipitation or cumulated three months precipitation. Furthermore, it was observed that a lag of one month precipitation as well as four months cumulated precipitation had the lowest influence on EVI.
Table 5. Correlation between EVI of land use/cover types and rainfall variability indicators.
StationLULC1 Month Lag pcpCum. 2 Months pcpCum. 3 Months pcpCum. 4 Months pcp
figureDanoAgricultural area0.8720.8870.9460.922
Mixed vegetation0.8300.9390.8930.783
Woodland0.8590.9040.9420.890
FaraAgricultural area0.8560.9070.9070.832
Mixed vegetation0.8360.9100.8970.812
Woodland0.7960.9040.8760.778
DiebougouAgricultural area0.8590.8970.9320.877
Mixed vegetation0.8280.9270.8890.768
Woodland0.8440.9030.9250.857
DissinAgricultural area0.8440.8810.9010.844
Mixed vegetation0.8310.8960.8900.811
Woodland0.8600.9080.9160.840
Correlation is significant at the 0.01 level (2-tailed).
The difference between NDVI and EVI was also noticed in the magnitude of their response to the rainfall indicators. Table 6 shows that the EVI often responded stronger to 2 months cumulated precipitation than NDVI. For the three other rainfall indicators, NDVI has better results. Generally, the magnitude of the correlations with EVI is often low compared to NDVI. This is illustrated by Figure 4a where 66.67% of the correlations were stronger with NDVI as against 29.17% with EVI. 4.17% of the correlations had the same coefficient of Pearson with both indices. For all the land use/cover types NDVI was found to perform better than EVI mostly for mixed vegetation and woodland (see Figure 4b). Generally, the difference between the Pearson’s coefficient values of both vegetation indices was slight in the four stations. This means that their performances with rainfall are not so much different.
It is also observed that the two indices showed opposite reaction to the number of cumulated month rainfall (from two to four months). NDVI performs better when the number of cumulated month of rainfall increases, whereas the performance of EVI rather decreases (Table 6). This situation might be due to the time lag response of each vegetation index; indeed, NDVI has longer time lag of response to rainfall than EVI at the sub-Saharan’s savanna area where rainfall is a controlling factor as noted by Jamali et al. [37]. However, more investigations are necessary for better clarification.
The difference noted with EVI and NDVI shows that the land use/covers reaction to rainfall variability in savanna areas varies according to the type of vegetation index and to the rainfall indicators.
The results disagree with studies [14,15], which found that NDVI signals were limited in savanna zone due to the effects of soil background material and exposure. The present work has demonstrated that those disturbances do not so much influence the performance of the signals of NDVI to express the response of vegetation to rainfall variability in the Sudanese savanna around the location of Dano, Diebougou, Dissin and Fara. This finding is supported by the work of Li et al. [19], which revealed that NDVI performs better than EVI for some land use/covers classes.
Table 6. Best performing index according to land use/covers and rainfall indicators.
StationLULC1 Month Lag pcpCum. 2 Months pcpCum. 3 Months pcpCum. 4 Months pcp
DanoAgricultural areaEVIEVIEVINDVI
Mixed vegetationNDVIEVINDVINDVI
WoodlandNDVIEVINDVINDVI
FaraAgricultural areaNDVINDVINDVINDVI
Mixed vegetationNDVINDVINDVINDVI
WoodlandNDVIEqualNDVINDVI
DiebougouAgricultural areaEVIEVIEVINDVI
Mixed vegetationNDVIEVINDVINDVI
WoodlandEVIEVIEVINDVI
DissinAgricultural areaNDVIEVINDVINDVI
Mixed vegetationNDVIEqualNDVINDVI
WoodlandNDVIEVINDVINDVI
Figure 4. (a) Global best performance between NDVI and EVI; (b) NDVI and EVI performance according to land use/covers.
Climate 03 00063 g004
Some possible factors that could explain the performance of NDVI have been discussed elsewhere. As mentioned by Li et al. [19], estimating vegetation dynamics from NDVI or EVI is not a straightforward achievement. Although in this work quality assessment was done on the MOD13Q1 product to eliminate noises, other factors, such as plant community [36], anthropogenic perturbation, vegetation phenology and sensor conditions [38,39,40], may influence the temporal dynamics of the two indices and their response to rainfall. Figure 5 shows that NDVI and EVI are strongly correlated for all land use/covers with Pearson’s coefficient value ranging from 0.976 to 0.984. This confirms that the problem of NDVI saturation is not quite pertinent in the study area and thus does not influence the reaction of the index, which can explain its performance. In addition, the sensitivity of NDVI and EVI to soil moisture, which has not been investigated in this study, may also explain the discrepancies between them.
Figure 5. Correlation between NDVI and EVI for different land use/cover types.
Climate 03 00063 g005

4. Conclusions

A study to assess the relationship between vegetation dynamics and rainfall variability has been carried out in the savanna biome of the Southwest of Burkina Faso. Unlike other studies, this study focuses on comparative analysis between NDVI and EVI in assessing the response of land use/covers to different rainfall indicators.
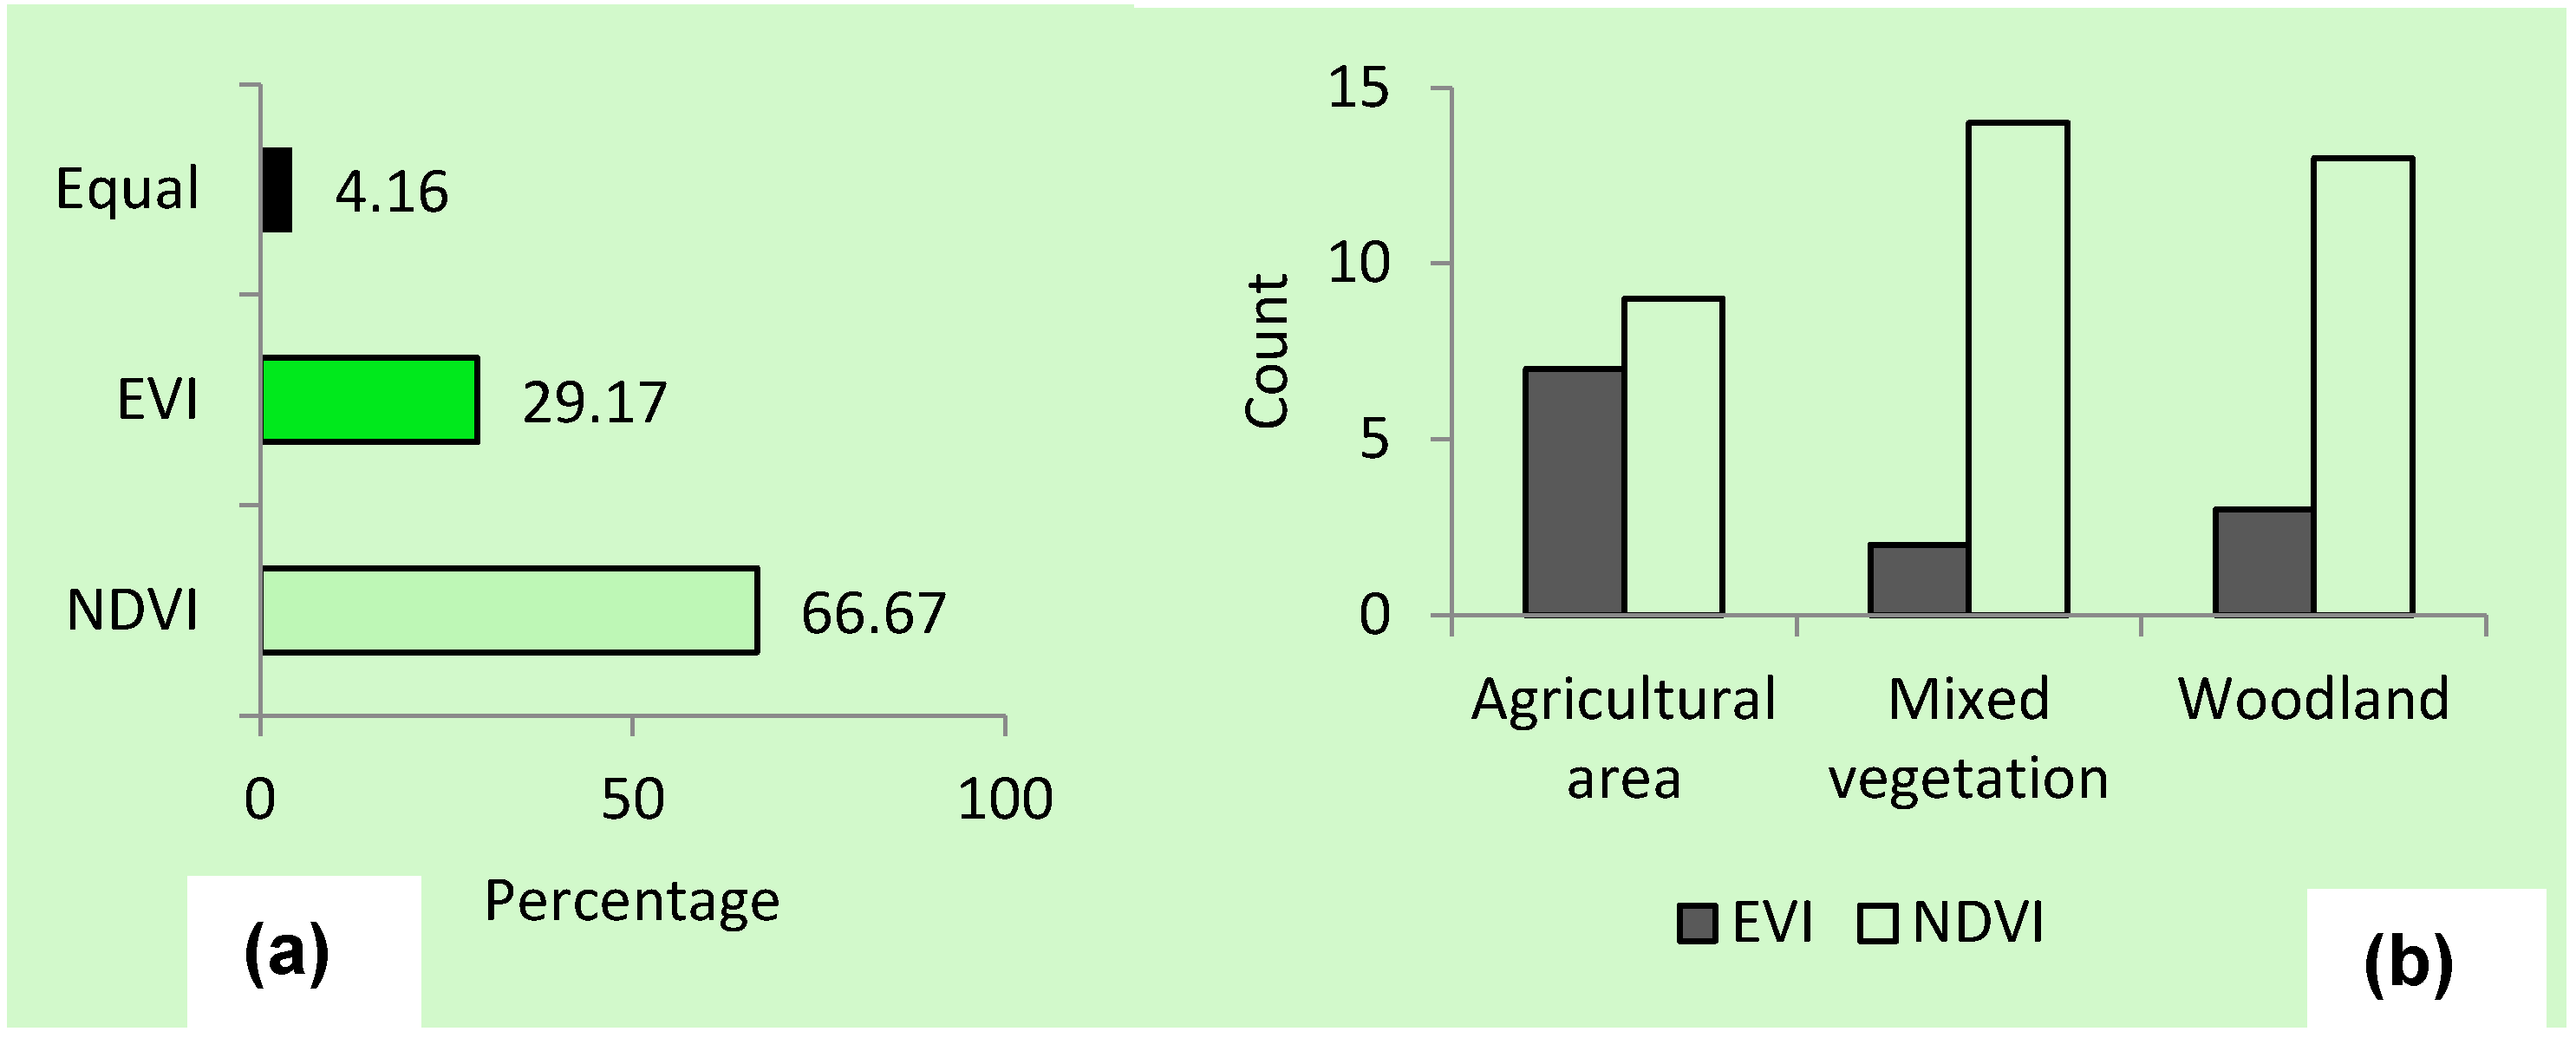
The main conclusion of the research is that NDVI and EVI are well correlated with rainfall variability according to different land use/cover types. This finding is supported by the results of previous studies. Some similarities were noticed in the response of NDVI and EVI to rainfall, but discrepancies were also found and mainly seen on the response magnitude and the influence of the rainfall indicators. Between both indices, and for all land use/covers, NDVI was generally more sensitive to rainfall variability compared to EVI. However, the difference between the Pearson’s coefficient values of both vegetation indices was slight in the four stations.
As this study focused on only a selected area on a local scale, there is the need for further analysis on regional scale in order to reaffirm the results obtained. Nevertheless, the study reveals important findings that will trigger further investigations on EVI and NDVI with respect to their accuracy in estimating vegetation temporal dynamics. For example further study to understand the difference in response magnitude between both indices by determining the contributing factors has to be explored.
The similar performance of the vegetation indices may suggest combined investigations on biophysical parameters like Leaf Area Index (LAI) and Fraction of Absorbed Photosynthetically Active Radiation (FAPAR). Optimal correlations of a certain vegetation index may be misleading in case that this index is underperforming in its relation to that quantifiable biophysical variables used in environmental modeling. Those investigations could be relevant for improving the understanding of the environmental dynamics that is occurring in the Southwest of Burkina Faso.

Acknowledgments

This study forms part of a PhD research performed within the WASCAL (West African Science Service Center on Climate Change and Adapted Land use) program on Climate Change and Land Use hosted by the Kwame Nkrumah University of Science and Technology of Kumasi, Ghana. We thank WASCAL for funding this work. Special thanks to the Remote Sensing Unit at the Institute of Geography of the University of Wuerzburg (Germany) for providing training facility, Landsat, Quickbird and MODIS images. Finally, we are grateful to our reviewers for their comments and suggestions that helped to improve this paper.

Author Contributions

This work has been designed by Benewinde J-B. Zoungrana and Christopher Conrad. They processed the satellite images with help from Michael Thiel and Evariste Dapola Da. Leonard K. Amekudzi help for rainfall data processing and analyzing. The manuscript was written and revised by Benewinde J.-B. Zoungrana with inputs from all co-authors.

Conflicts of Interest

Authors declare no conflict of interest.

References

  1. IPCC. Contribution of Working Groups I, II and III to the Fourth Assessment Report of the Intergovernmental Panel on Climate Change; IPCC: Geneva, Switzerland, 2007; p. 104. [Google Scholar]
  2. Lambin, E.F. Modeling and monitoring land-cover change processes in tropical regions. Prog. Phys. Geogr. 1997, 21, 375–393. [Google Scholar] [CrossRef]
  3. Nightingale, J.M.; Phinn, S.R. Assessment of relationships between precipitation and satellite derived vegetation condition within South Australia. Aust. Geogr. Stud. 2003, 41, 180–195. [Google Scholar] [CrossRef]
  4. Nicholson, S.E.; Davenport, M.L.; Maloa, A.R. A comparison of the vegetation response to rainfall in the sahel and east africa, using normalized difference vegetation index from NOAA AVHRR. Clim. Chang. 1990, 17, 209–241. [Google Scholar] [CrossRef]
  5. Gessner, U.; Naeimi, V.; Klein, I.; Kuenzer, C.; Klein, D.; Dech, S. The relationship between precipitation anomalies and satellite-derived vegetation activity in Central Asia. Glob. Planet. Chang. 2013, 110, 74–87. [Google Scholar] [CrossRef]
  6. Eklundh, L. Estimating relations between AVHRR NDVI and rainfall in East Africa at 10-day and monthly time scales. Int. J. Remote Sens. 1998, 19, 563–568. [Google Scholar] [CrossRef]
  7. Richard, Y.; Poccard, I. A statistical study of NDVI sensitivity to seasonal and interannual rainfall variations in Southern Africa. Int. J. Remote Sens. 1998, 19, 2907–2920. [Google Scholar] [CrossRef]
  8. Gaughan, A.E.; Stevens, F.R.; Gibbes, C.; Southworth, J.; Binford, M.W. Linking vegetation response to seasonal precipitation in the Okavango-Kwando-Zambezi catchment of southern Africa. Int. J. Remote Sens. 2012, 33, 6783–6804. [Google Scholar] [CrossRef]
  9. Chaoka, R.T.; Alemaw, B.F.; Tsige, D.M. Modeling and understanding the relationship between vegetation and rainfall of a tropical watershed using remote sensing data and GIS. JOSH 2007, 7, 47–61. [Google Scholar]
  10. Hashemi, S.A. Investigation of relationship between rainfall and vegetation index by using NOAA/AVHRR satellite images. World Appl. Sci. J. 2011, 14, 1678–1682. [Google Scholar]
  11. Boken, V.K.; Chandra, S. Estimating leaf area index for an arid region using spectral data. Afr. Crop. Sci. J. 2012, 20, 215–223. [Google Scholar]
  12. Fontes de Sousa, L.; Braga, C.C.; Braga, R.C.; Dantas, M.P. Interrelationship between rainfall and vegetation index by remote sensing. JHRS 2014, 4, 87–99. [Google Scholar]
  13. Bobée, C.; Ottlé, C.; Maignan, F.; de Noblet-Ducoudré, N.; Maugis, P.; Lézine, A.-M.; Ndiaye, M. Analysis of vegetation seasonality in Sahelian environments using MODIS LAI, in association with land cover and rainfall. J. Arid Environ. 2012, 84, 38–50. [Google Scholar] [CrossRef]
  14. Farrar, T.J.; Nicholson, S.E.; Lare, A.R. The influence of soil type on the relationships between NDVI, rainfall, and soil moisture in semiarid Botswana. II. NDVI response to soil moisture. Remote Sens. Environ. 1994, 50, 121–133. [Google Scholar] [CrossRef]
  15. Liu, H.Q.; Huete, A.R. A feedback based modification of the NDV I to minimize canopy background and atmospheric noise. IEEE Trans. Geosci. Remote Sens. 1995, 33, 457–465. [Google Scholar] [CrossRef]
  16. Huete, A.R.; van Leeuwen, W.J.D.; Hua, G.; Qi, J.; Chehbouni, A. Normalization of multidirectionalred and NIR reflectances with the SAVI. Remote Sens. Environ. 1992, 41, 143–154. [Google Scholar] [CrossRef]
  17. Huete, A.; Didan, K.; Miura, T.; Rodriguez, E.P.; Gao, X.; Ferreira, L.G. Overview of the radiometric and biophysical performance of the MODIS vegetation indices. Remote Sens. Environ. 2002, 83, 195–213. [Google Scholar] [CrossRef]
  18. Son, N.T.; Chen, C.F.; Chen, C.R.; Minh, V.Q.; Trung, N.H. A comparative analysis of multitemporal MODIS EVI and NDVI data for large-scale rice yield estimation. Agric. For. Meteorol. 2014, 197, 52–64. [Google Scholar] [CrossRef]
  19. Li, Z.; Li, X.; Weia, D.; Xub, X.; Wanga, H. An assessment of correlation on MODIS-NDVI and EVI with natural vegetation coverage in Northern Hebei Province, China. Proc. Environ. Sci. 2010, 2, 964–969. [Google Scholar] [CrossRef]
  20. Wardlow, B.D.; Egbert, S.L. A comparison of MODIS 250-m EVI and NDVI data for crop mapping: A case study for southwest Kansas. Int. J. Remote Sens. 2010, 31, 805–830. [Google Scholar] [CrossRef]
  21. Cord, A.; Conrad, C.; Schmidt, M.; Dech, S. Standardized FAO-LCCS land cover mapping in heterogeneous tree savannas of West Africa. J. Arid Environ. 2010, 74, 1083–1091. [Google Scholar] [CrossRef]
  22. Duadze, S.E.K. Land Use and Land Cover Study of the Savannah Ecosystem in the Upper West Region (Ghana) Using Remote Sensing; Cuvillier Verlag: Göttingen, Germany.
  23. Friedl, M.A.; Sulla-Menashe, D.; Tan, B.; Schneider, A.; Ramankutty, N.; Sibley, A.; Huang, X. MODIS Collection 5 global land cover: Algorithm refinements and characterization of new datasets. Remote Sens. Environ. 2010, 114, 168–182. [Google Scholar] [CrossRef]
  24. Forkuor, G.; Conrad, C.; Thiel, M.; Ullmann, T.; Zoungrana, E. Integration of optical and Synthetic Aperture Radar imagery for improving crop mapping in Northwestern Benin, West Africa. Remote Sens. 2014, 6, 6472–6499. [Google Scholar] [CrossRef]
  25. USGS Global Visualization Viewer. Available online: http://glovis.usgs.gov/ (accessed on 03 October 2012).
  26. Breiman, L. Random forests. Mach. Learn. 2001, 45, 5–32. [Google Scholar] [CrossRef]
  27. Cutler, D.R.; Edwards, T.C.; Beard, K.H.; Cutler, A.; Hess, K.T.; Gibson, J.; Lawler, J.J. Random forests for classification. Ecology 2007, 88, 2783–2792. [Google Scholar] [CrossRef] [PubMed]
  28. Akar, O.; Güngör, O. Classification of multispectral images using Random Forest algorithm. J. Geod. Geoinf. 2013, 2, 105–112. [Google Scholar]
  29. Waske, B.; Braun, M. Classifier ensembles for land cover mapping using multi temporal SAR imagery. ISPRS J. Photogr. Remote Sens. 2009, 64, 450–457. [Google Scholar]
  30. MODIS Reprojection Tool Web Interface (MRTWeb). Available online: https://mrtweb.cr.usgs.gov/ (accessed on 06 June 2014).
  31. Colditz, R.R.; Conrad, C.; Wehrmann, T.; Schmidt, M.; Dech, S. TiSeG: A flexible software tool for time-series generation of MODIS data utilizing the quality assessment science data set. IEEE Trans. Geosci. Remote 2008, 46, 3296–3308. [Google Scholar] [CrossRef]
  32. Pettorelli, N.; Vik, J.O.; Mysterud, A.; Gaillard, J.-M.; Tucker, C.J.; Stenseth, N.C. Using the satellite-derived NDVI to assess ecological responses to environmental change. Trends Ecol. Evol. 2005, 20, 503–510. [Google Scholar] [CrossRef] [PubMed]
  33. Gao, X.; Huete, A.R.; Ni, W.; Miura, T. Optical-biophysical relationships of vegetation spectra without background contamination. Remote Sens. Environ. 2000, 74, 609–620. [Google Scholar] [CrossRef]
  34. Congalton, R.G.; Green, K. Assessing the Accuracy of Remotely Sensed Data. Principles and Practices; CRC Press Inc.: London, UK, 2009. [Google Scholar]
  35. Davenport, M.L.; Nicholson, S.E. On the relation between rainfall and the Normalized Difference Vegetation Index for diverse vegetation types in East Africa. Int. J. Remote Sens. 1993, 14, 2369–2389. [Google Scholar] [CrossRef]
  36. Méndez-Barroso, L.A.; Vivoni, E.R.; Watts, C.J.; Rodríguez, J.C. Seasonal and interannual relations between precipitation, surface soil moisture and vegetation dynamics in the North American monsoon region. J. Hydrol. 2009, 377, 59–70. [Google Scholar] [CrossRef]
  37. Jamali, S.; Seaquist, J.; Ardö, J.; Eklundh, L. Investigating temporal relationships between rainfall, soil moisture and MODIS-derived NDVI and EVI for six sites in Africa. Savanna 2011, 21, 547–550. [Google Scholar]
  38. Zhao, B.; Yan, Y.N.; Guo, H.Q.; He, M.M.; Gu, Y.J.; Li, B. Monitoring rapid vegetation succession in estuarine wetland using time series MODIS-based indicators: An application in the Yangtze River Delta area. Ecol. Indic. 2009, 9, 346–356. [Google Scholar] [CrossRef]
  39. Sims, D.A.; Luo, H.; Hastings, S.; Oechel, W.C.; Rahman, A.F.; Gamon, J.A. Parallel adjustments in vegetation greenness and ecosystem CO2 exchange in response to drought in a Southern California chaparral ecosystem. Remote Sens. Environ. 2006, 103, 289–303. [Google Scholar] [CrossRef]
  40. Lu, H.; Raupach, M.R.; Mc Vicar, T.R.; Barrett, D.J. Decomposition of vegetation cover into woody and herbaceous components using AVHRR NDVI time series. Remote Sens. Environ. 2003, 86, 1–18. [Google Scholar] [CrossRef]

