Article

Spatiotemporal Assessment of Surface Solar Dimming in India: Impacts of Multi-Level Clouds and Atmospheric Aerosols

1
Department of Atmospheric and Space Sciences, Savitribai Phule Pune University, Pune 411007, India
2
Indian Institute of Tropical Meteorology (IITM), Pune 411008, India
3
Department of Atmospheric Science, Environmental Science and Physics, University of the Incarnate Word, San Antonio, TX 78209, USA
4
Aryabhatta Research Institute of Observational SciencES (ARIES), Nainital 263001, India
5
Department of Physics, Graphic Era (Deemed to be University), Dehradun 248002, India
*
Author to whom correspondence should be addressed.
Climate 2024, 12(4), 48; https://doi.org/10.3390/cli12040048
Submission received: 22 February 2024 / Revised: 28 March 2024 / Accepted: 28 March 2024 / Published: 30 March 2024

Abstract

:
Surface solar radiation (SSR) is a fundamental energy source for an equitable and sustainable future. Meteorology-induced variability increases uncertainty in SSR, thereby limiting its reliability due to its intermittent nature. This variability depends on several meteorological factors, including clouds, atmospheric gases, and aerosol concentrations. This research investigates the detailed impact of different levels of clouds and aerosols on SSR across India. Utilizing satellite data with reanalysis retrievals, the research covers a span of three decades (30 years), from 1993 to 2022. Aerosols contributed to an average attenuation of ~13.33% on SSR, while high, mid, and low cloud conditions showed much stronger impacts, with an attenuation of ~30.80%, ~40.10%, and ~44.30%, respectively. This study reveals an alarming pattern of increasing cloud impact (Cimpact) on SSR in the recent decade, with a significant increasing rate of ~0.22% year−1 for high cloud (HCimpact) and ~0.13% year−1 for mid cloud (MCimpact) impact, while low cloud impact (LCimpact) showed minimal change. The trend of aerosol impact (Aimpact) also showed an average increase of ~0.14% year−1 across all regions. The findings underscore the imperative of considering climatic variables while studying the growing solar dimming. Our findings also will assist policymakers and planners in better evaluating the solar energy resources across India.

1. Introduction

Renewable energy research and utilization have become paramount, especially for developing countries aiming to satisfy the demands of their expanding populations and economies [1,2]. Among the array of resources, solar energy stands as a beacon of hope, offering numerous benefits that extend well beyond the simple generation of electricity. As the world confronts the urgent challenges posed by climate change, the role of solar energy becomes increasingly pivotal [3,4,5,6,7]. In the context of developing countries, where the need for accessible and reliable energy is crucial, the promise of solar energy shines brightly [8,9,10]. It represents a pathway towards mitigating the adverse impacts of climate change, offering a rational alternative to fossil fuels that have long burdened both economies and environments. Projections suggest that nearly 85 percent of global energy generation is projected to stem from renewables by 2050, underscoring the transformative potential of solar energy (https://www.un.org/en/climatechange/raising-ambition/renewable-energy, last accessed on 2 January 2024). Solar energy serves as a catalyst for economic growth and reduces reliance on finite resources. Beyond its immediate economic and environmental benefits, solar energy epitomizes the principles of a circular economy, promoting resource efficiency and waste reduction throughout the energy value chain [11,12]. With optimal access to the sun’s rays, countries like India are poised to harness this abundant source of clean energy, charting a way towards a more equitable and sustainable future.
Solar radiation, as the fundamental factor determining solar energy availability, is inherently linked with Earth’s meteorological conditions. It is imperative to understand these conditions and their influence on surface-reaching solar radiation to harness the full potential of solar energy, both today and in the face of future climate change. Over the years, various regions around the world have experienced notable fluctuations in incident solar radiation. Liepert [13] observed a substantial decline, often termed “solar dimming”, in surface solar radiation within the United States, noting a reduction of 19 Wm−2 or 10% between 1961 and 1990. Similarly, Liang and Xia [14] reported a significant decrease in global and direct irradiance across various regions of China. Stanhill and Cohen [15] conducted a thorough evaluation of global irradiance data from 854 sites over the globe; their study revealed an average reduction of 0.51 Wm−2 (2.7%) per decade over the past 50 years. Another study by Wang and Yang [16] observed a prevalent dimming trend in surface solar radiation and sunshine hours since the 1960s across China. This dimming is attributed to increasing anthropogenic aerosol loading. However, a weak brightening trend since 1990 has been noted, mainly in south-eastern China during the spring season. The reversal in the solar radiation trend is associated with climate change factors such as cloud suppression and a slowdown in anthropogenic emissions. The study by Meng et al. [17] analyzed the effects of solar dimming on the North China Plain (NCP) from 1961 to 2015. Radiation has decreased significantly in the NCP since the 1960s, with the greatest decline from 1990 to 2001–2015. This dimming resulted in a 17% decrease in solar radiation. An increase in PM2.5 (particulate matter having a diameter of 2.5 μm) air pollution was closely linked to this dimming trend. In a separate investigation by Padma Kumari et al. [18], monthly mean global solar radiation data from 12 stations in India indicated an average dimming of ~0.86 Wm−2 per year between 1981 and 2004. Similarly, research by Kambezidis et al. [19] focusing on the South Asian region noted a substantial yearly decrease in net downward shortwave radiation (NDSWR) of about 0.54 Wm−2 from 1979 to 2004 by using the long-term Modern Era Retrospective analysis for Research and Applications (MERRA 2D) dataset. This decline in NDSWR, primarily during pre-monsoon periods, was attributed to aerosol impact. Furthermore, the trends in NDSWR closely mirrored the spatial distribution of cloudiness, with negative trends indicative of solar dimming observed in regions such as the tropical Indian Ocean and certain parts of India. Despite extensive observations, the trend shows no definitive signs of reversal [10,11,20]. It is essential to recognize that, within the context of “global dimming,” the term “global” originally denoted “global radiation,” serving as a synonym for surface solar radiation. This distinction is important, as it clarifies that “global” does not refer to the spatial scale of the entire globe [21]. These findings highlight the importance of solar brightening and dimming trends and emphasize the need for a deeper understanding of its underlying causes, particularly concerning its implications for solar energy applications.
Many studies suggest that aerosols and clouds play significant roles in reducing surface solar radiation [21,22,23,24,25]. There are two primary methods that influence surface solar radiation: (a) external changes in incoming solar radiation due to the characteristics of the Earth’s orbit or solar output and (b) internal changes in the portion of solar radiation that is reflected through modifying cloud features, radiatively active gases like water vapor, aerosol quantities and their optical properties, as well as the surface’s albedo [21]. Observed decadal fluctuations in surface solar radiation are minimally influenced by changes in the Earth’s orbital parameters and water vapor content. Recent alterations in water vapor content are not substantial enough to have a significant influence on radiation, but variations in water vapor content impact the degree of cloudiness, which, in turn, have a significant impact on incoming solar radiation [26,27].
According to estimates by the IPCC 2007 (https://www.ipcc.ch/report/ar4/syr/, last accessed on 8 January 2024) [28], human activities contribute to negative radiative forcing, with aerosols exerting the most major impact compared to surface albedo and ozone effects. Therefore, global dimming and brightening should largely occur from clouds and aerosols, which, respectively, signify the dual influence of climate change and human disruptions [21,29,30]. So far, it remains uncertain whether clouds or aerosols serve as the primary contributor to recent shifts in surface solar radiation. However, growing studies with evidence suggest that, while clouds influence surface solar radiation on an annual scale, pollution-related aerosols determine surface solar radiation variability on a decadal scale [31,32].
A number of studies worldwide [22,33,34] have shown that clouds act as modulators of solar radiation by reflecting, scattering, and absorbing radiation. The presence, type, and altitude of clouds affect the amount of sunlight reaching the surface, leading to variations in solar radiation. A study conducted by Dumka et al. [4] at Nainital examined the impact of aerosols and clouds on solar energy potential (2008–2012) in the central Gangetic Himalayan region of India. They found that aerosols and clouds cause 0–14% and 20–65% of the attenuation of global horizontal irradiance (GHI) on an annual basis, respectively. In a study about India, Wild et al. [23] highlighted that the increase in cloud cover also contributed to the significant loss of surface solar radiation. The influence of these meteorological factors results in modifications to the intensity, spectral distribution, and temporal variability of surface solar radiation, consequently impacting the potential for solar electricity generation [35,36].
India, situated within the tropical and subtropical latitudes, has a strategic geographical location and a massive land mass that grants it abundant solar irradiation year-round. According to data from the Indian Ministry of New and Renewable Energy (available at https://mnre.gov.in/solar/current-status, last accessed on 8 January 2024), the country receives an average of 4 kilowatt-hours per square meters (kWh/m2) of radiation annually, establishing it as one of the sunniest regions worldwide. Additionally, India has set an ambitious target of achieving a non-fossil-based electricity generation capacity of 500 gigawatts (GW) by 2030, which incorporates solar installations of ~300 GW (https://mnre.gov.in/annual-reports-2022-23/, last accessed on 8 January 2024). The significant expansion of solar energy systems in India underscores the paramount importance of precise, potential, and up-to-date resource assessments that incorporate the accurate mapping of surface-reaching solar radiation and its related influencing factors (https://shaktifoundation.in/wp-content/uploads/2017/09/State-of-Renewable-Energy-in-India.pdf, last accessed on 8 January 2024). Solar radiation also plays a crucial role in agriculture, as it directly influences plant growth, development, and productivity. Adequate surface solar radiation is essential for photosynthesis, the process by which plants convert sunlight into energy to fuel their growth [37,38].
From the above research literature, it is evident that both clouds and aerosols exert significant impacts on the surface solar radiation. Recent data indicate a decline in solar radiation levels across India [4,8,36], with insufficient studies quantifying these influences. Furthermore, the relative importance of cloud levels and aerosols for specific solar energy applications across different Indian regions remains unclear. Navigating the complexities of assessing solar dimming poses challenges for new researchers. Addressing these gaps requires sophisticated modelling techniques and thorough validation processes to accurately grasp these complex interactions. Spatiotemporal variability, interdisciplinary collaboration, and effective communication of findings to policymakers add layers of complexity to this endeavor. To overcome these challenges, perseverance, innovation, and collaboration are important. By doing so, we can contribute to a deeper understanding of solar dimming’s implications for sustainable energy and climate resilience.
The study, therefore, addresses (a) the evidence of an increasing decline in surface solar radiation (SSR) attributed to meteorological conditions (particularly due to the presence of clouds and aerosols), and (b) determines the primary driver between clouds at various levels and types of aerosols. To present the geographical distribution of these phenomena, the research delves into a detailed analysis of four regions representative of India (see Table 1). Further, the study discusses the potential implications of dimming to optimize the performance of solar energy systems, to improve energy generation predictions, and adapt to changing environmental conditions. The paper is organized as follows: Section 2 provides a brief description of the datasets and methodology used for the analysis. Major findings are presented and discussed in Section 3, with Section 3.1 explaining decadal variations in surface solar radiation, cloud cover, and aerosols, while Section 3.2 shows the climatology of cloud and aerosol impacts, with the increased impacts attributed to clouds and aerosols. In Section 3.3, the impacts of high, middle, and low cloud cover are discussed with respect to selected regions, including the yearly trend of cloud fraction on vertical levels (from the Earth’s surface to 100 hPa). In Section 3.4, an annual contribution of various types of aerosols in terms of Aerosol Optical Depth (AOD) is presented, with an explanation of their combined impacts and variation, followed by a summary and conclusion on the main findings in Section 4.

2. Materials and Methods

2.1. Reanalysis and Satellite Datasets

2.1.1. European Centre for Medium-Range Weather Forecasting Reanalysis Version 5 (ERA-5)

The research integrates a wide array of meteorological parameters sourced from ERA-5, a dataset renowned as the fifth-generation atmospheric reanalysis that spans global climate patterns from January 1940 to the present [39]. ERA-5 offers hourly estimates of numerous atmospheric, terrestrial, and oceanic parameters. Operating on a spatial resolution of a 0.25° × 0.25° grid and utilizing 137 vertical levels from the Earth’s surface up to an altitude of 80 km, ERA-5 delivers a high-resolution representation of the planet’s atmosphere [40].
The specific datasets utilized in this research include seven parameters (i) Mean Surface Downward Short-wave Radiation Flux (SSR) and (ii) Mean Surface Downward Short-wave Radiation Flux Clear-sky (SSRC); both SSR and SSRC denote the total solar radiation reaching the Earth’s surface, encompassing both direct and diffuse components. SSR accounts for the absorption or reflection of solar radiation by clouds and aerosols (all sky conditions). On the other hand, SSRC represents the solar radiation reaching the surface under clear-sky conditions, indicating the absence of clouds but the possible presence of aerosols. The dataset parameters also include (iii) total cloud cover (TCC), (iv) high cloud cover (HCC, ~6 km and above), (v) medium cloud cover (MCC, ~2 km to 6 km), (vi) low cloud cover (LCC, below ~2 km), and (vii) fraction of cloud cover (FCC); all cloud parameters indicate the percentage (%) of the sky obscured by clouds, expressed as a fraction. TCC, HCC, MCC, and LCC provide insight into the extent of cloud coverage during a given period for a given location and height, while FCC provides insight into the extent of cloud coverage at vertical levels (from the Earth’s surface to 10 hPa) through the atmosphere. The above datasets can be found at https://cds.climate.copernicus.eu/cdsapp#!/search?type=dataset, last accessed on 30 October 2023).
The efficacy of the ERA-5 dataset in mirroring observational data has been previously validated in various regions, particularly in its ability to accurately represent the spatiotemporal distribution of SSR [41,42,43,44]. The integration of SSR, SSRC, and TCC data from ERA-5 in this research enables a thorough examination of the SSR and meteorological parameter trends, and their impact on solar dimming across the study regions over India.

2.1.2. Modern-Era Retrospective Analysis for Research and Applications Version 2 (MERRA-2)

MERRA-2 is the latest atmospheric reanalysis dataset developed by NASA’s Global Modelling and Assimilation Office (GMAO), with a temporal resolution of one hour and a spatial resolution of 0.5° × 0.625°. It incorporates the advancements such as the assimilation of aerosol observations, improvements in stratospheric representation including ozone, and better modelling of cryospheric processes [45].
The data utilized in this research includes AOD of the various types of aerosols, i.e., black carbon (BC), organic carbon (OC), dust (DU), sea salt (SS), and sulphate (SU), including total AOD simulated by the GOCART (Goddard Chemistry, Aerosol, Radiation and Transport) model. The emission and distribution of aerosols are influenced by multiple processes. A comparison of the AOD between MERRA-2 and AERONET (Aerosol Robotic Network) data spanning from 1980 to 2016 showed good spatial agreement globally [46]. Accessible online (https://gmao.gsfc.nasa.gov/reanalysis/MERRA-2/dataaccess/, last accessed on 2 November 2023), MERRA-2 products provide valuable data for climate research and analysis.

2.1.3. Clouds and the Earth’s Radiant Energy System (CERES)

NASA’s CERES dataset is a collection of satellite-based measurements designed to observe and quantify the Earth’s energy budget. CERES instruments are carried aboard multiple satellites and provide observations related to the Earth’s radiation budget, including incoming solar radiation and outgoing reflected solar radiation with a spatial resolution of 1° × 1°. These measurements are crucial for understanding the energy exchanges between the Earth, its atmosphere, and space [47]. The dataset computes shortwave radiant fluxes for different atmospheric conditions, such as pristine (Psky, no aerosols, no clouds), clear-sky (Csky, including aerosols but no clouds), all-sky no-aerosol (NAsky, no aerosols but including clouds), and all-sky conditions (Asky, including clouds and aerosols). To achieve consistency between computed and observed flux, small adjustments are made to the input variables within predetermined uncertainties for each variable [48,49]. The dataset utilized here includes surface shortwave radiation flux for (i) Asky and (ii) NAsky conditions from CERES SYN1deg-Level 3 and available at https://ceres.larc.nasa.gov/data/, last accessed on 30 November 2023).

2.1.4. Moderate Resolution Imaging Spectroradiometer (MODIS)

This research also used AOD data derived from MODIS (Terra and Aqua product-Version 6.1) with a spatial resolution of 1° × 1° at a wavelength of 550 nm. MODIS is a key instrument present on both the Terra and Aqua satellites, and these satellites are part of NASA’s Earth Observing System [50]. The primary purpose of the Terra MODIS and Aqua MODIS instruments is to capture comprehensive and high-quality data about the Earth’s surface. The data are crucial for monitoring dynamic processes occurring in the land, oceans, and lower atmosphere on a global scale. The data acquired by MODIS instruments includes monitoring changes in land cover, vegetation patterns, sea surface temperature, cloud properties, atmospheric composition, and more [51]. The above dataset of AOD with details can be found at https://giovanni.gsfc.nasa.gov/giovanni/, last accessed on 30 October 2023.

2.2. Methodology

In this section, we provide a brief description of the metrics used to fulfil the objective of our research. Given the primary focus on surface-reaching solar radiation, all analyses and computations were confined to daytime hours exclusively (0200 to 1300 + 0530 IST). We computed annual averages from the hourly and daily datasets as part of our methodology.
The linear regression (LR) analysis was conducted to estimate the trend for SSR, TCC, and AOD, which is expressed as a linear function. The slope of the trend represents the rate of change over time. A positive (negative) value of slope indicates an increasing (decreasing) rate [52]. Consequently, to evaluate the statistical significance of the reported trend, a two tailed Student’s t-test and non-parametric Mann–Kendall test (MKT) were used. The MKT is particularly advantageous for trend analysis since it does not assume any specific probability distribution for the time series data [53]. Detailed steps for estimating the MKT and Student’s t-test statistics used in this research are described by Smadi et al. [54] and Wu et al. [55], respectively.
For SSR and TCC analysis, as well as to study the cloud impact on SSR, decadal anomalies for the periods 1993–2002, 2003–2012, and 2013–2022 were estimated using the climatology from 1993 to 2022. For AOD analysis, decadal anomalies for the periods 2003–2012 and 2013–2022 were estimated using the climatology from 2003 to 2022. The period from 2003 to 2022 was selected for the analysis of the trends and impact of AOD, as CERES and MODIS products performed better than MERRA-2 in terms of detecting the spatial and temporal extent of AOD, as suggested by Aldabash et al., Khoir et al. and Zhang et al. [56,57,58].
As discussed above, the ERA-5 dataset provided the SSR values for both all-sky (Asky) and clear-sky (Csky) conditions. This allowed for the calculation of the Cimpact (impact on SSR due to clouds) using the following formula, as described by Yang et al. [36]:
C impact =   SSRC   C sky     SSR   A sky SSR   A sky     100 %
where SSRC (Csky) and SSR (Asky) represents the SSR under clear-sky (includes aerosol, but no clouds) and all-sky (includes both aerosols and clouds) conditions, respectively.
Similarly, the CERES dataset provided the SSR values for both no-aerosol-sky (NAsky) and all-sky (Asky) conditions. The calculations for the Aimpact (impact on SSR due to aerosols) are done using the following formula, as described by Yang et al. [36]:
A impact =   SSR   NA s k y     SSR   A sky SSR   A sky     100 %
where SSR (NAsky) represents the SSR under no-aerosol-sky (includes clouds, but no aerosols) conditions.
Specifically, the study estimated decadal and annual anomalies (expressed as %) for Cimpact and Aimpact. The computations for Cimpact and Aimpact were derived utilizing the Formulas (1) and (2), respectively. Similarly, the annual mean impacts of high (HCimpact), medium (MCimpact) and low (LCimpact) cloud cover were computed by considering only the SSR values during the corresponding HCC, MCC, anLCC periods from the ERA-5 dataset. Hourly MERRA-2 AOD retrievals were used to calculate the mean annual contribution of each specific type of aerosol AOD (%).
The four major regions delineated for analysis are defined as follows: Region 1 (R1): 12.5° N–21.5° N, 72.5° E–82.5° E; Region 2 (R2): 22° N–28° N, 71° E–82.5° E; Region 3 (R3): 17.5° N–28° N, 83° E–88.5° E, and Region 4 (R4): 28° N–33° N, 72.5° E–81° E, shown in Section 3.2. Each of these regions has been selected based on significant differences observed in the decrease of SSR and increase of TCC and AOD during a recent decade (2013–2022), particularly when compared among these regions (see Figure 1). The study exclusively considered Indian landmass, excluding the ocean and non-Indian regions.

3. Results and Discussion

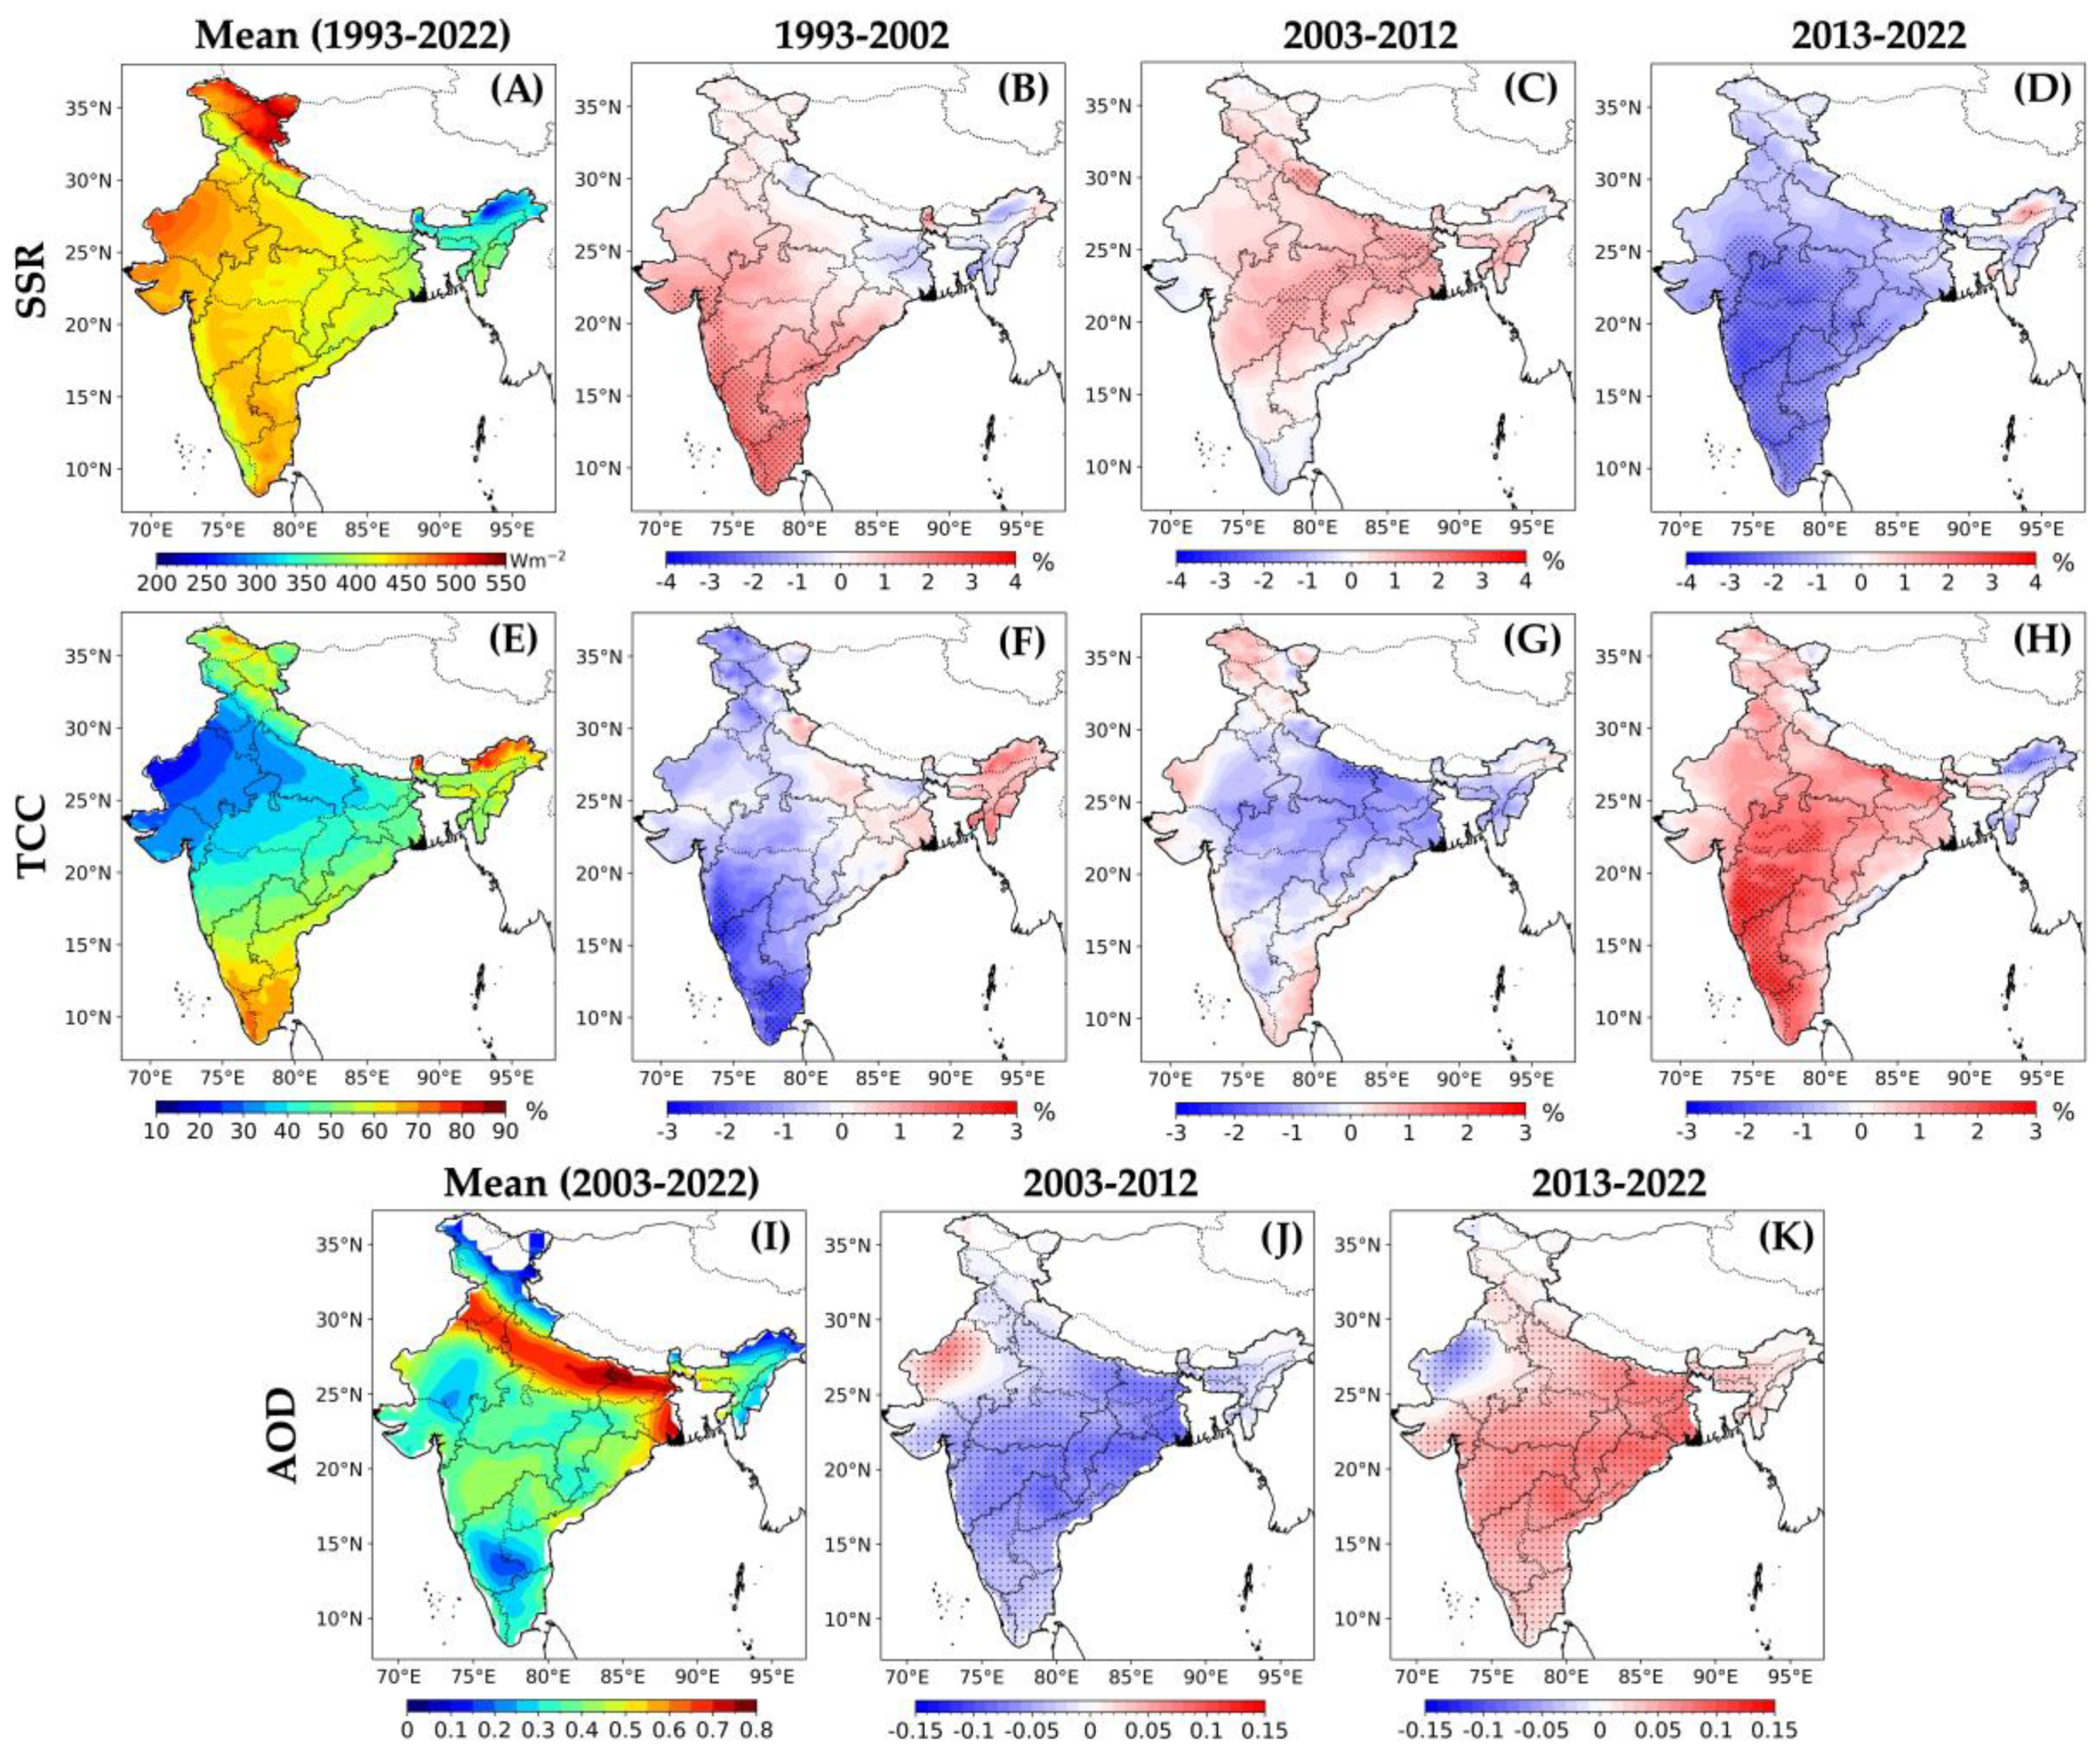
3.1. Variability of SSR, TCC, and AOD in India

To investigate the spatial distribution of SSR, TCC, and AOD in India, we analyzed the decadal climatic anomalies of SSR and TCC (in %), as shown in Figure 1A–H from the ERA-5 hourly dataset, and AOD, as shown in Figure 1I–K from MODIS. Our analysis also showed the increase/decrease trend, providing insights into the temporal pattern of these climatic variables (see Table 1). During the initial two decades of the study (first decade, 1993–2002 and second, 2003–2012), a noticeable increase in SSR values by ~1–4% and ~1–3% was observed, respectively, across most of India. A slight decrease was observed in the first decade over the eastern parts of the country. However, during the recent decade (third decade, 2013–2022), a significant (significance > 95%) decline ranging from ~2 to 4% was observed, particularly prominent over the central, western, and south-western parts of the country (see Figure 1D). Unfortunately, these prominent regions are where over ~60–70% of the solar photovoltaic systems in India are installed (https://mnre.gov.in/annual-reports-2022-23/, last accessed on 8 January 2024); hence, the findings from this study can assist photovoltaic (PV) system planners in accurately predicting future yields of solar systems and improve solar power harnessing abilities. Additionally, the decline in solar radiation can influence photosynthesis rates in plants, affecting agricultural productivity and crop yields [38]. This downward trend underscores the need for a thorough examination of the impact and causes, primarily including changes in atmospheric conditions like cloud cover and aerosols.
It is evident that changes in cloud amounts play a significant role in regulating surface solar radiation on a global scale [19,22,33]. Understanding the intricate relationship between clouds and solar radiation is crucial for accurately assessing climate variability and its impacts. As shown in Figure 1 F–H, TCC is observed to be decreased in the first two decades by ~2–3% and ~0–2%, respectively, while significantly (significance > 95%) increased in third decade by ~3% across most of the Indian region. Similarly, Figure 1J,K shows decadal AOD anomalies which were observed to have decreased in the second decade by ~0.05–0.1 and increased (significance > 95%) during the third decade by ~0.05–0.15. As expected, the SSR was observed to have decreased with increasing TCC and AOD and declining SSR values strongly anticorrelated with the TCC (–0.75) and AOD (–0.56) with a 95% significance level. Considering this significant declining trend and variability of SSR, most likely due to cloud cover and aerosols, we have thoroughly investigated the specific impact of different cloud levels (i.e., high, mid, and low) and AOD on SSR over the four major regions of India, as discussed in Section 2.2.

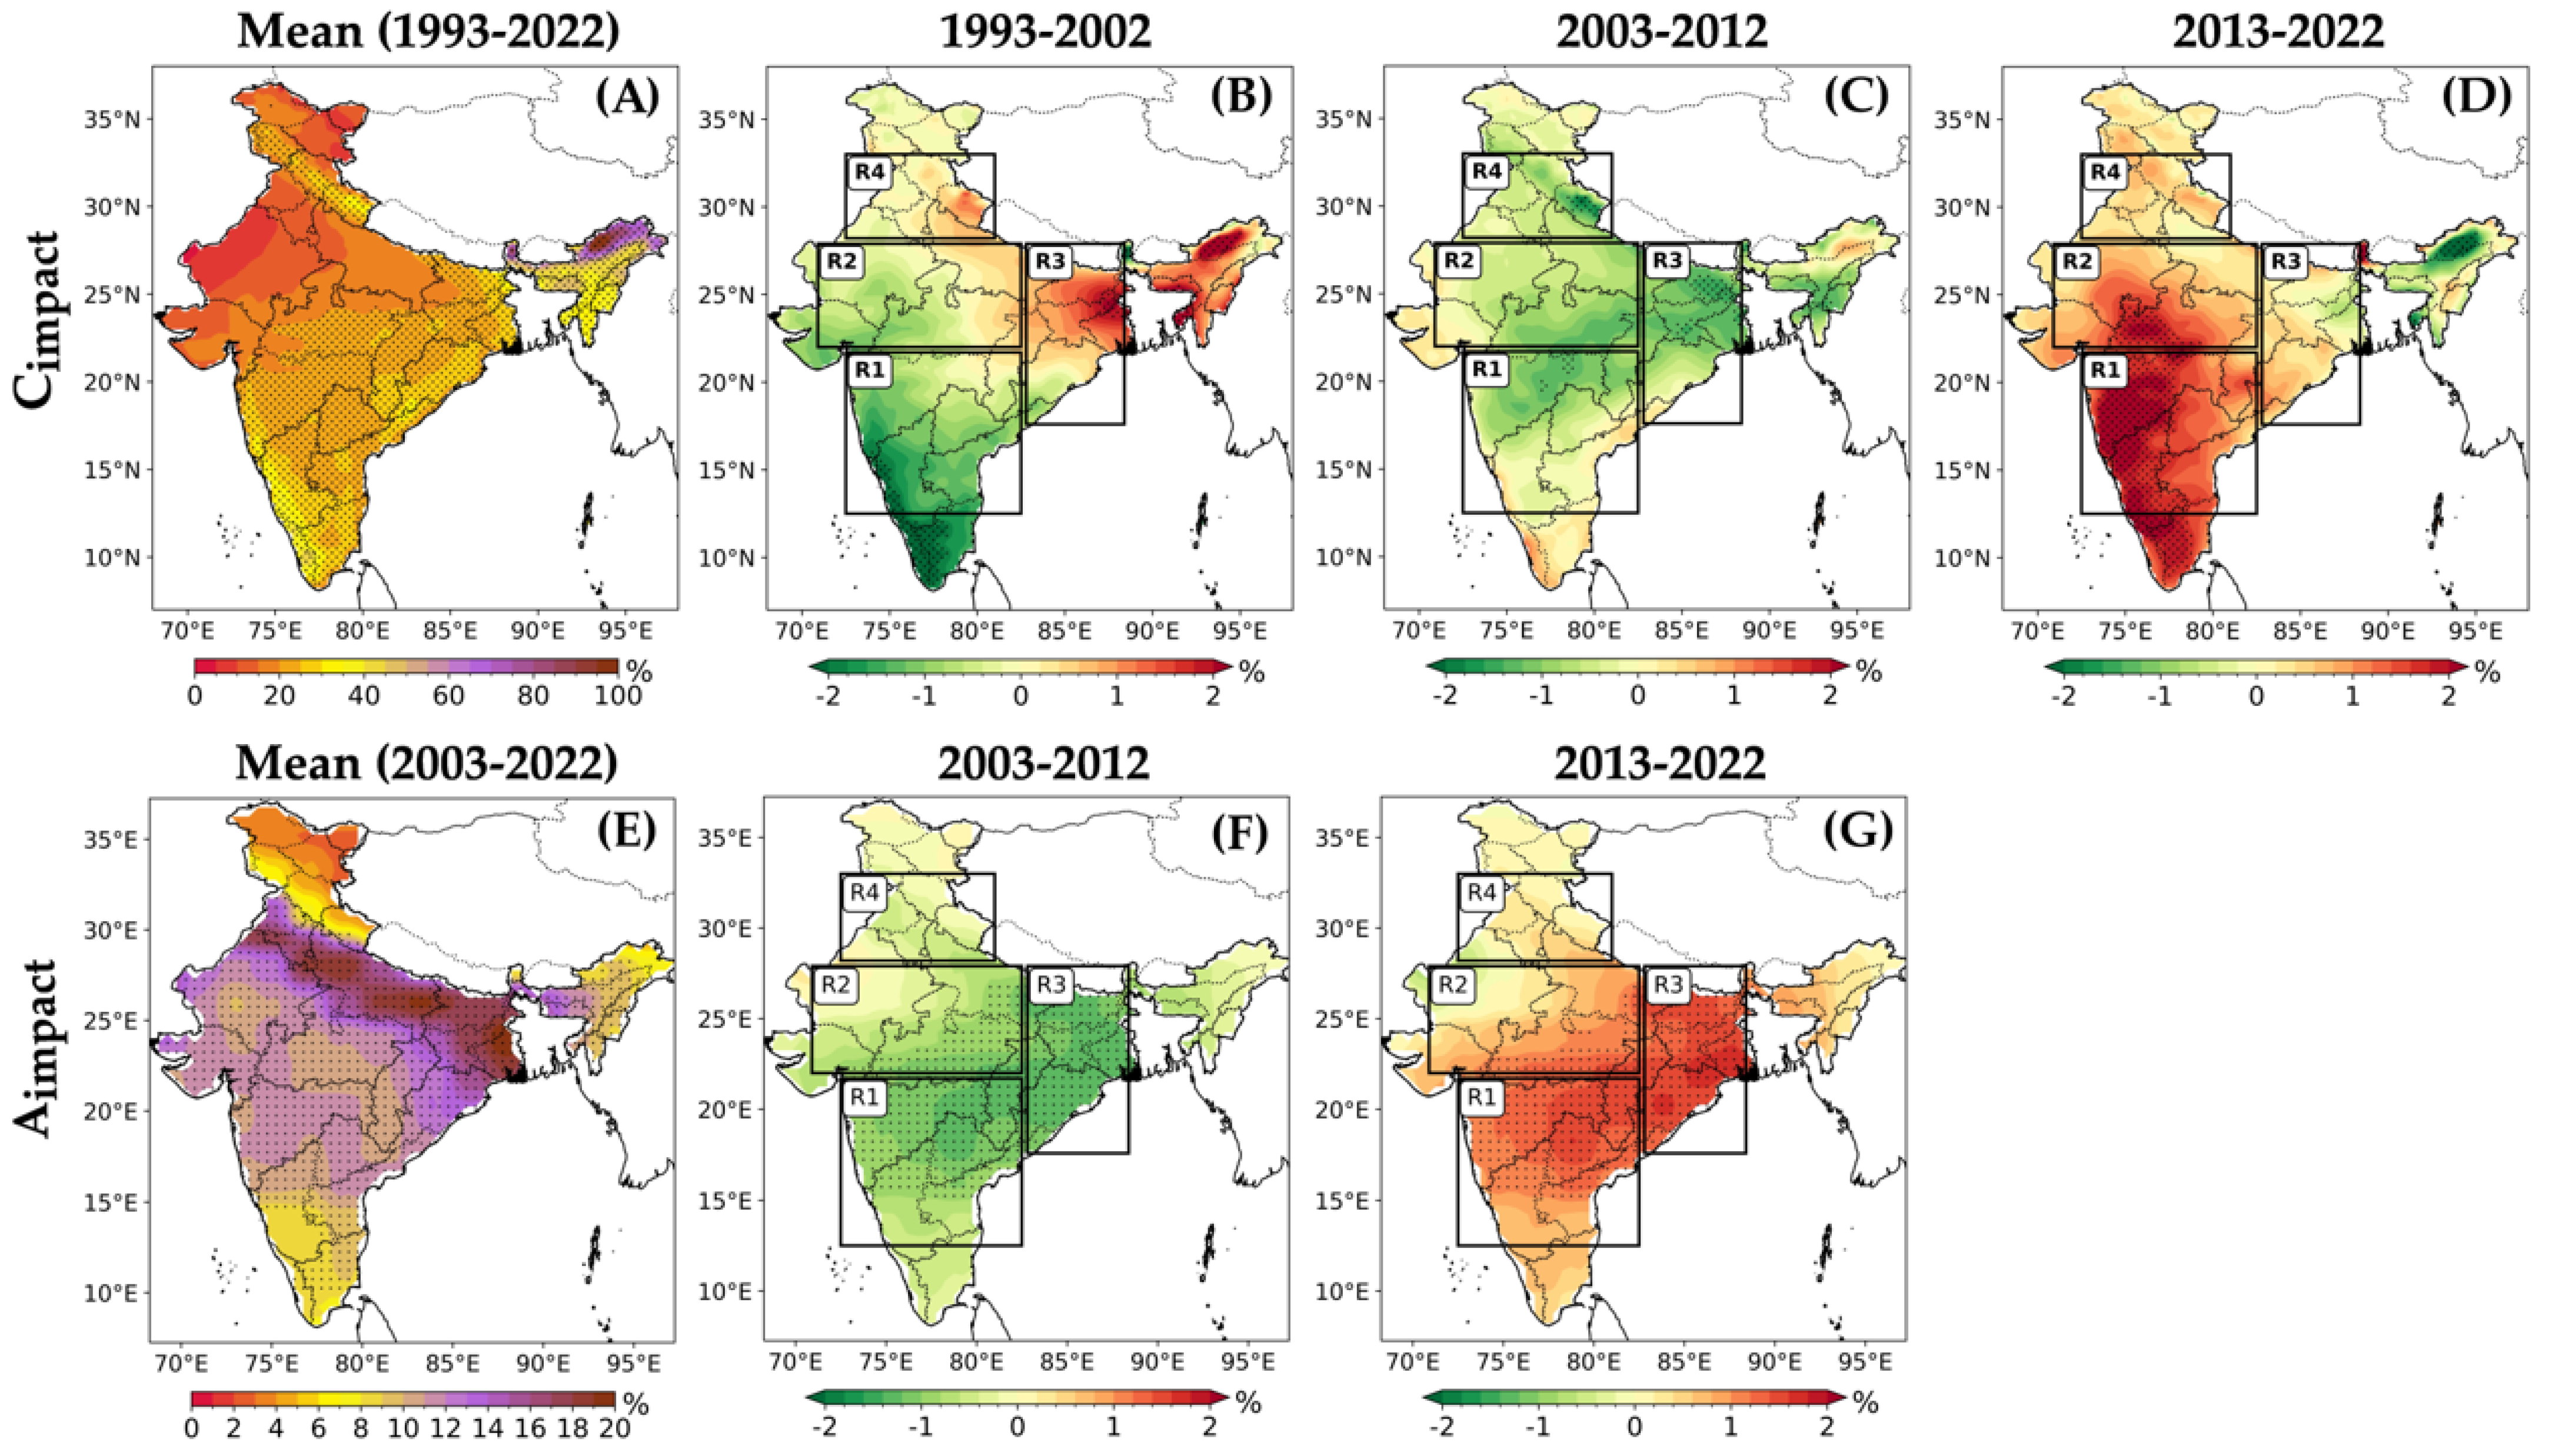
3.2. Variability of Cimpact and Aimpact on SSR

Clouds and atmospheric aerosols can have direct impact on SSR by absorbing and/or scattering the radiation during their travel path from the top of the atmosphere to the Earth’s surface [4,59,60]. In general, increasing cloud cover and aerosol concentration can lead to a decline in SSR. To better understand the spatial and temporal distribution of SSR and potentially address this declining trend, we analyzed the variability of clouds and aerosols impacts separately in this research. In Figure 2, the climatological mean and decadal anomalies of Cimpact (SSR reduction due to clouds) and Aimpact (SSR reduction due to aerosols) are presented separately. We utilized the ERA-5 as well as CERES datasets to compute the Cimpact and Aimpact mean and anomalies, as explained in Section 2.2.
Significant changes (in terms of anomalies) in Cimpact were observed across the Indian region in the past three decades (1993–2022). When analyzing anomalies by decades and regions (Figure 2B–D), a negative anomaly was observed of ~0–1% for R1 and ~0–0.5% for R2 during the first decade. Meanwhile, there was a slight uptick in anomalies around ~0–1.5% for R3 and ~0–0.5% for R4, showing a slightly less negative trend compared to R1 and R2 (Table 2). Moving into the second decade, the negative Cimpact anomalies shift towards the eastern and north-eastern regions of India, ranging from ~0 to 1.5%. Notably, in the most recent decade (third), notable positive (significant at 95%) Cimpact anomalies were observed, with higher changes exceeding ~2% in R1 and moderate changes ranging from ~1 to 2% in R2. Nevertheless, R3 and R4 showed low to negligible Cimpact, anomalies with values ranging between ~0 and 0.5% in the third decade. Overall, the mean Cimpact stands out, showing reductions in SSR by ~47% (Figure 2A) over all four regions during 1993–2022.
The Aimpact also exhibited notable variation over the Indian region from 2003 to 2022, causing a mean reduction in SSR up to ~12% (Figure 2E). The decadal statistics here showed that, during the second decade of the study period (Figure 2F), Aimpact anomalies across all regions were found to be negative, ranging from ~0 to 1.5%, indicating low Aimpact over the Indian region. However, in the third decade, Aimpact resulted in significant (significance > 95%) positive anomalies, showing an increased impact across most of the Indian region. The most positive Aimpact anomalies were observed in R1 and R3, with values ranging from ~1% to more than 2%. In R2 and R4, the Aimpact was low to negligible, with anomaly values ranging from ~0 to 0.5%.
On the other hand, we also estimated the trends of Cimpact and Aimpact for the study regions (R1, R2, R2, and R4) and periods (1993–2022). The trends estimated were tested by traditional methods (discussed in Section 2.2) and are presented in Table 2. The results showed a strong increase in positive anomalies for both Cimpact and Aimpact in the third decade. This analysis has helped us to piece a comprehensive picture of the factors that have separately led to the sustained decrease in SSR during the specified period over the four major Indian regions.

3.3. Analysis of Regional Cimpact on SSR

As per the findings discussed and presented in Section 3.1 and Section 3.2, there has been a noticeable decline in SSR between the years 2013 and 2022 with reference to 1993–2022 climatology, accompanied by an increase in Cimpact and Aimpact over the Indian region.
The existing research literature often characterizes the impact of cloudiness on surface-reaching solar radiation in terms of cloud cover extent, typically overlooking the specific cloud type and cloud levels present. Notably, Matuszko [61] and Monteith and Unsworth [62] pointed out that during overcast conditions with high-level clouds, such as Cirrostratus, solar radiation is observed to reach the Earth’s surface without significant hindrance. Conversely, in our study, the low-level and/or mid-level clouds with layered and thick characteristics, such as Nimbostratus, have been found to potentially reduce solar radiation up to ~80–90%. Interestingly, despite both scenarios being officially classified as overcast (8/8 cloud cover), notable variations in the measured solar radiation flux reaching the Earth’s surface exist. This difference may be attributed to the high-level clouds allowing a significant amount of sunlight to penetrate, while low/mid-level layered clouds may effectively act as barriers. These findings underscore the importance of considering not only the extent of cloud cover, but also taking into account the specific cloud levels when studying the variability of solar radiation. This approach will be crucial for the accurate modelling and prediction of solar radiation and solar energy availability under different cloud conditions over India.
Considering this, we undertook a thorough analysis that delves into the specific annual impact variability of high (HCimpact), middle (MCimpact) and low (LCimpact) cloud levels on SSR over four major regions of India (R1, R2, R2, and R4). This approach allowed us to achieve a more holistic comprehension of how solar radiation interacts with varying cloud levels. The HCimpact, MCimpact, and LCimpact on SSR were separately computed for each cloud level using ERA-5 datasets (as discussed in Section 2.2).
In Figure 3, the annual changes (in terms of anomalies) in HCimpact, MCimpact, and LCimpact underlaid with the FCC across different pressure levels are analyzed. During the first decade, a significant portion of the HCimpact anomalies were observed to be negative, indicating a mean change of ~−0.26% year−1 across all regions. Among these, the most affected regions were R1 and R2, followed by R4 and then R3. LCimpact also played a major role, contributing ~−0.37% year−1, compared to MCimpact which showed a ~−0.19% year−1 contribution. In the second decade, the trend was observed to be minimal to negligible with the values of ~−0.04% year−1 and ~−0.08% year−1 for HCimpact and MCimpact, respectively, while LCimpact showed a slightly higher change of ~0.15% year−1. Notably, HCimpact showed a dominant increase in impact on SSR during the third decade, with a value of ~0.22% year−1, surpassing both MCimpact with ~0.13% year−1 and LCimpact with ~0.01% year−1 in all selected regions. The specific mean (30 years) and decadal mean values of HCimpact, MCimpact, and LCimpact with respect to each region are presented in Table 3. We also found that, when considering high, mid, and low cloud conditions individually, their mean impacts over the last 30 years across all selected regions were ~31%, ~40%, and ~44%, respectively (the mean impacts were estimated by averaging the yearly impact values over the 30-year period). Previous studies by Matuszko [61] during 2003–2007 and Monteith and Unsworth [62] suggested that the intensity of solar radiation reaching the surface reached its peak (up to ~1100 Wm−2) during the days when high-level clouds such as cirrus and cumulonimbus were present as compared to mid-level and low-level clouds. However, our study presents a different perspective. Our findings indicate that high-level clouds led to a significant reduction in SSR, even though their mean impact was lower compared to mid and low cloud levels. This observation is consistent with the results of Kambezidis et al. [19] in 2012, which demonstrated a strong anticorrelation between cloud optical depth (COD), particularly for high clouds, and NDSWR from 1979 to 2004.
The increase in high- and mid-level FCC, leading to HCimpact and MCimpact, with the most significant increase observed during the first decade to the third decade (1993–2002 to 2013–2022) is particularly noticeable in India, followed by low-level clouds. Understanding the increasing combined layered impact of cloud covers, especially high- and mid-level clouds, is crucial in comprehending the reduction in SSR. This insight will form the foundation for more accurate evaluations and planning regarding solar resources.

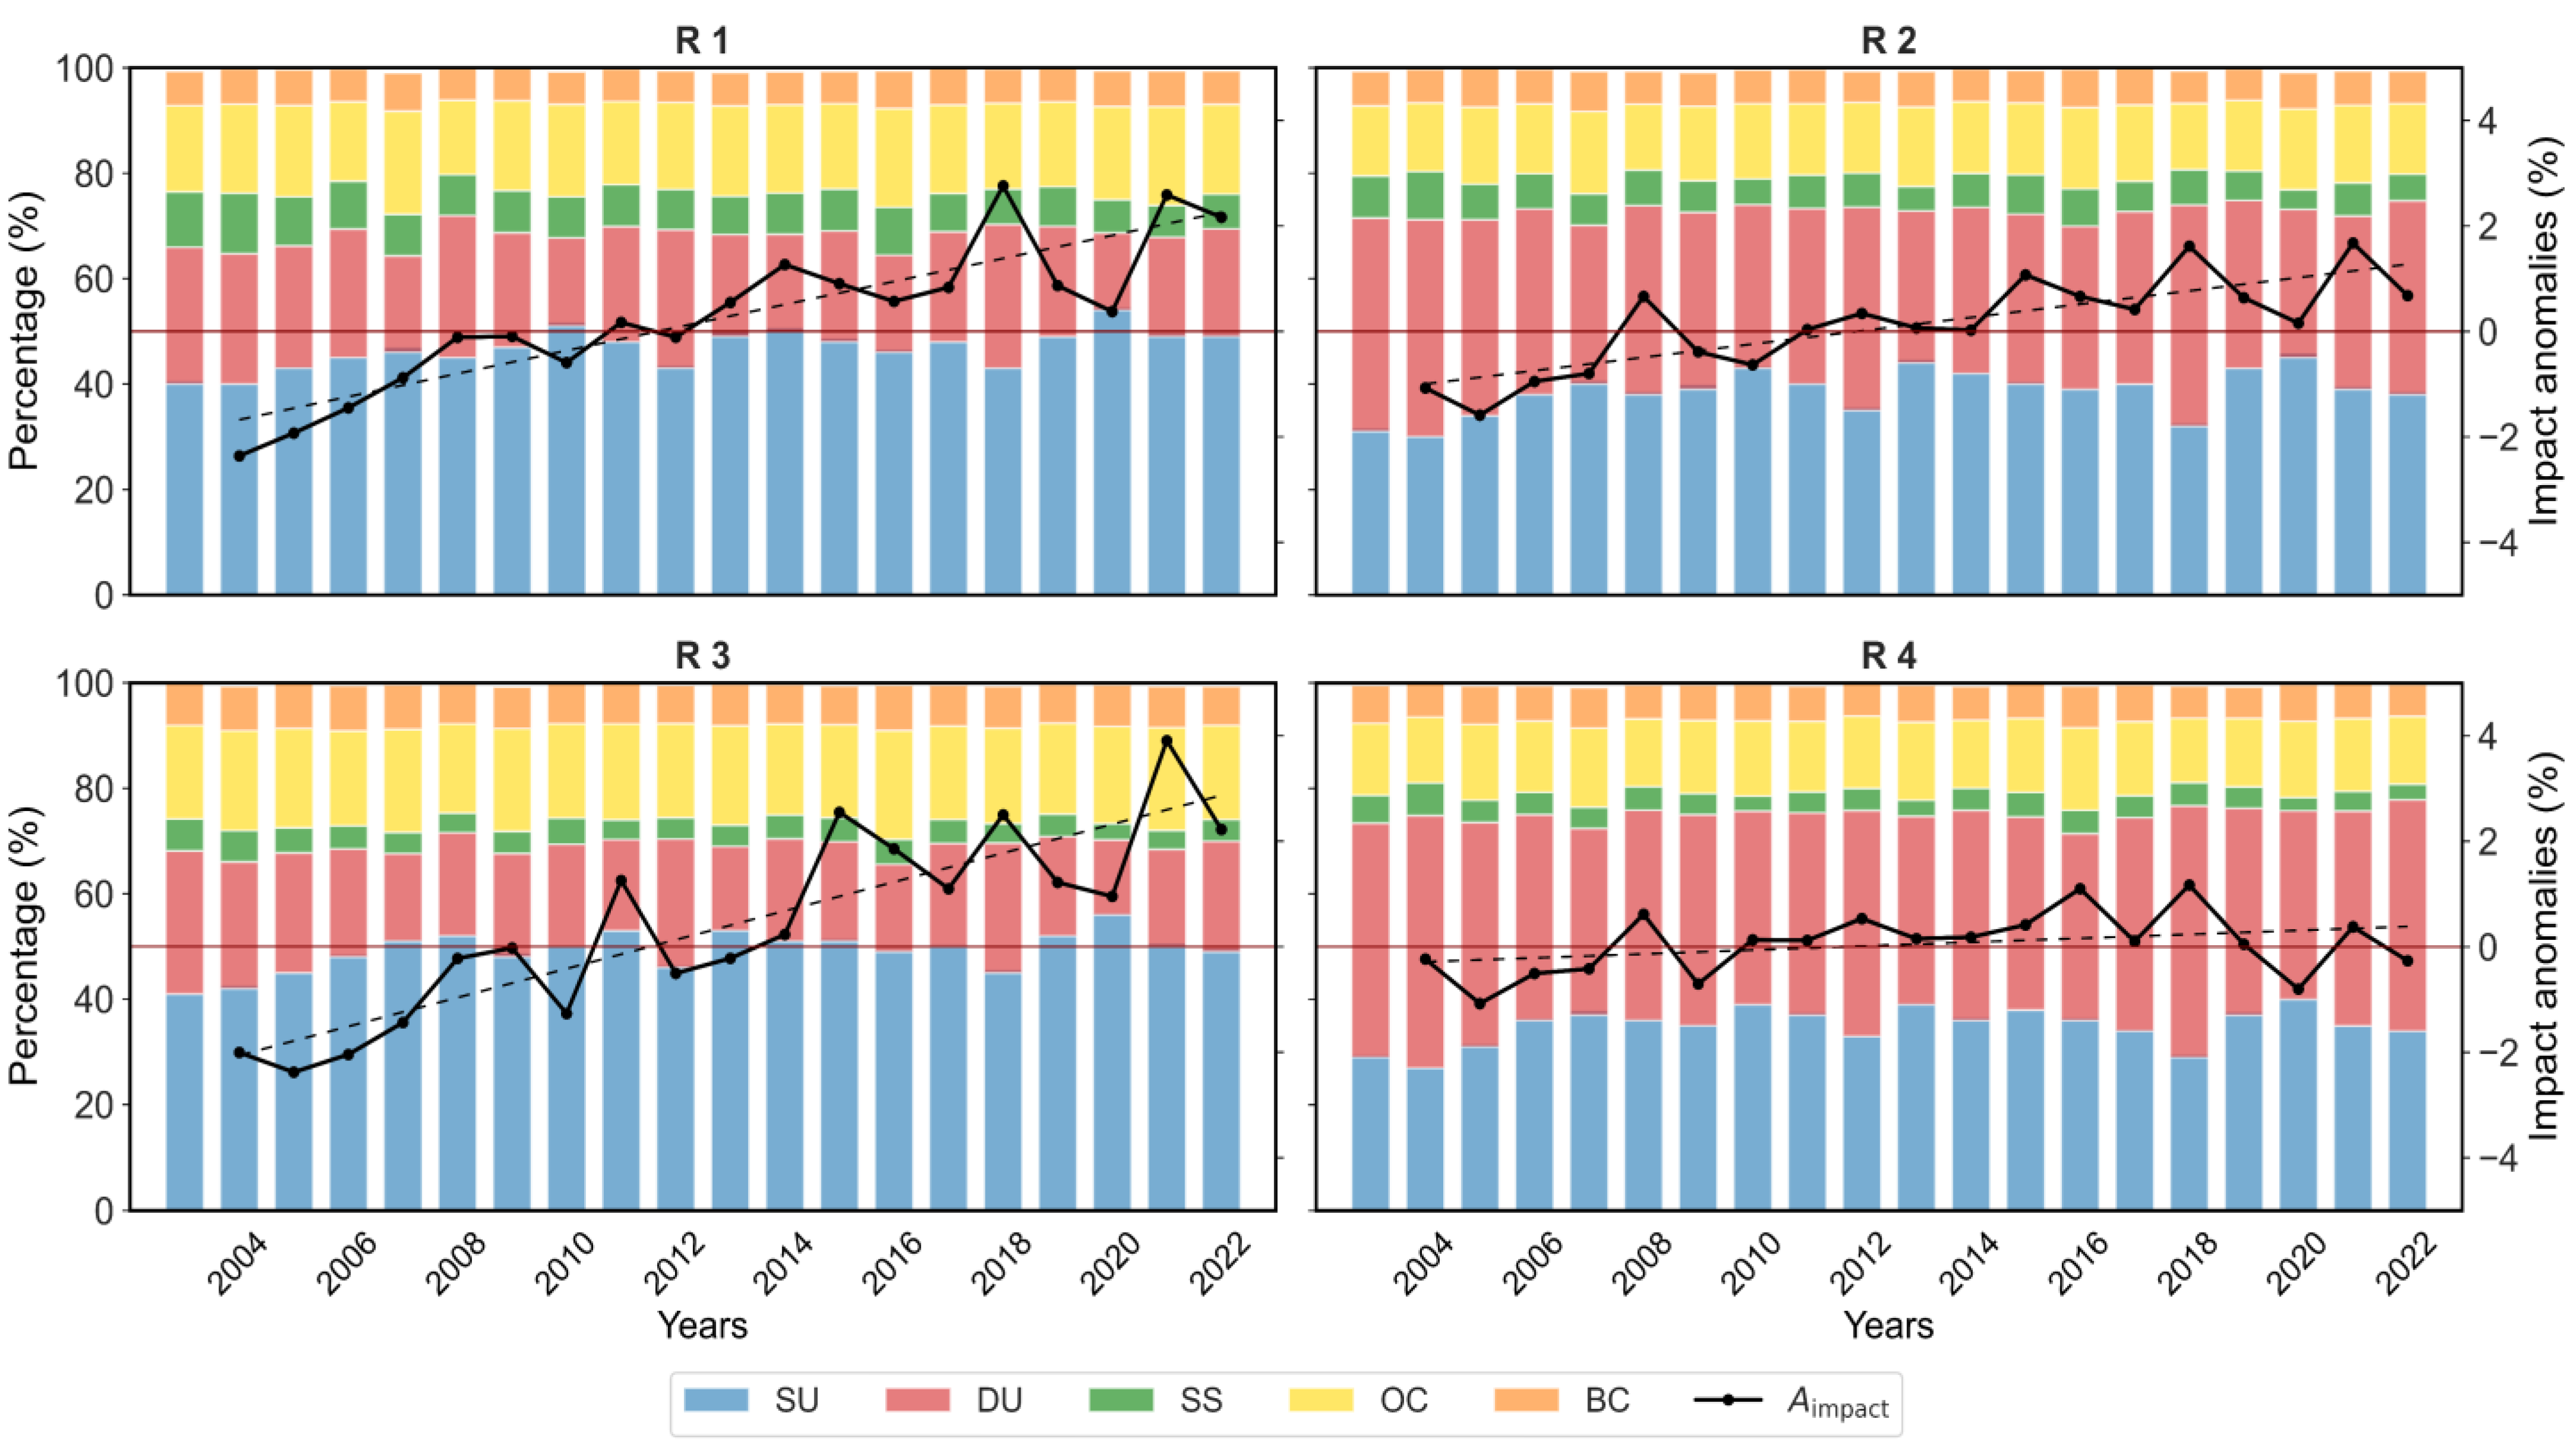
3.4. Analysis of Regional Aimpact on SSR

Regional changes in aerosols can also have a significant impact on surface-reaching solar radiation. High AOD indicates a higher concentration of aerosols in the atmosphere, while low AOD indicates a lower concentration. These aerosols act as scattering and/or absorbing agents, redirecting and/or absorbing sunlight instead of allowing it to reach the surface directly. As a result, the intensity of solar radiation reaching the surface is weakened [36,63].
The analysis of the annual mean of the AOD using MERRA-2 reanalysis products reveals distinct temporal variations and regional characteristics in the distribution of sulphate (SU), dust (DU), sea salt (SS), organic carbon (OC), and black carbon (BC) AODs (Figure 4). In R1 and R3, SU aerosols dominated consistently, accounting for ~40–55% across all years, followed closely with DU and OC contributing around ~15–27% and ~15–20%, respectively, to the total AOD. Meanwhile, BC and SS contributions remained relatively stable at ~4–7% and ~6–12%, respectively, and were higher than in R2 and R4. Conversely, in R2 and R4, DU played a significant role alongside SU aerosols, sometimes surpassing SU levels in the recent decade. Notable differences in annual AOD distributions for SU and DU aerosols were observed among the four major study regions, with DU aerosol predominantly present in R3 and R4, while remaining low in the other regions. However, the Thar desert stands out as a significant source of DU aerosols, consistently influencing northern regions.
Furthermore, Figure 4 shows the annual changes (in terms of anomalies) in Aimpact for R1, R2, R3, and R4 during the period of 2003–2022. These Aimpact anomalies were estimated using the CERES dataset as discussed in Section 2.2. Table 4 represents the 30-year mean and decadal statistics of Aimpact with respect to each region. Notably, significant (with a significance level of 95%) positive trends of Aimpact anomalies (represented as black dashed line in Figure 4) were observed, with values of 0.83 for R1, 0.65 for R2, 0.81 for R3, and minimal for R4, with a value of 0.13. These upward trends in anomalies indicate a consistent increase in Aimpact across the Indian regions, particularly in R1 and R3. Conversely, the diverse aerosol trends across all regions led to a mean reduction in SSR up to ~13% during the period from 2003 to 2022. This signifies that increasing aerosol concentrations are also potentially contributing, alongside clouds, to the dimming of SSR.
Turning to the decadal statistics, in the second decade, all regions showed a positive change per year, indicating a ~0.24% year−1 mean increase in Aimpact. Among these, the most affected regions observed were R3 (~0.38% year−1) followed by R1 (~0.28% year−1), R2 (~0.16% year−1), and R4 (~0.11% year−1). In the third decade, the Aimpact anomalies played a slightly diminishing role compared to the second decade, contributing to a mean increase in impact of ~0.14% year−1. It is noteworthy that Aimpact anomalies for all the regions and the decades showed a positive trend, raising concerns regarding long-term implications for SSR availability. In R1 and R3, the increasing trend of the Aimpact anomaly was particularly pronounced and largely attributed to the persistent impacts of SU and DU, with R3 being the most aerosol-affected region, showing an increase of ~0.38% year−1 and ~0.26% year−1 for the second and third decades, respectively. This approach allowed us to attain a more comprehensive understanding of how SSR is influenced by different types of aerosols.
The impact of aerosols on solar radiation varies depending on the specific wavelength of light and the type and size of the aerosol particles present in the atmosphere [64,65]. These distinct characteristics of various aerosols introduce a range of effects on solar radiation, making the interaction intricate and multifaceted. In the regions marked by high aerosol concentrations, concerted actions aimed at mitigating air pollution and regulating emissions can play a crucial role in diminishing aerosol levels. Strategies encompassing the implementation of air quality regulations, the adoption of cleaner energy sources, and the embrace of sustainable practices all contribute to the reduction of aerosol concentrations. This, in turn, translates to a positive outcome with improved solar energy availability at ground level. To ensure precise assessments of solar resources and to effectively strategize solar energy systems, it is imperative to comprehend the way aerosols impact SSR. This approach empowers the optimization of energy production and informs prudent decisions with regards to the initiation and execution of solar energy initiatives.

4. Summary and Conclusions

This pioneering study over the Indian region investigates the detailed impacts of the high, mid, and low cloud levels on surface-reaching solar radiation individually. Additionally, by closely examining different types of AODs, valuable insights of aerosol impacts were obtained.
Our results reveal that distinct high–mid–low cloud levels have an individual impact of ~31%, ~40%, and ~44%, respectively, on SSR across the selected regions of India. Despite low clouds having the maximum impact, our research highlights a significant increase in the Cimpact rate primarily driven by high- and mid-level clouds during the third decade. The western part of southern region (R1) emerges as the most significantly affected area by clouds, alongside a considerable portion of the central region (R2) of India, showing mean increasing rates of ~0.41% year−1 and ~0.11% year−1, respectively, during the third decade. Unfortunately, these prominent regions account for over ~60–70% of the installed solar photovoltaic systems in India, as reported by the Ministry of New and Renewable Energy in their Annual Reports for 2022-23 (https://mnre.gov.in/annual-reports-2022-23/, last accessed on 8 January 2024). This highlights the potential impact of cloud-induced variations in SSR on the performance of solar power systems in key regions of the country. Additionally, the study also revealed a mean Aimpact of ~13% across the selected regions. The eastern region, along with certain parts of the central region (R3), emerged as the most affected area, experiencing an increasing impact rate of around ~0.32% year−1 during the recent decade.
These findings raise apprehensions about the future viability of solar energy availability in western parts, including the southern region, as well as the eastern regions, including parts of central India (R1, some areas of R2, and R3). Our research underscores the importance of considering meteorological conditions such as cloud and aerosol presence while evaluating solar energy potentials. Looking ahead, it is imperative to conduct further studies to analyze the seasonal variations of high, mid, and low cloud cover along with aerosols and their impact on SSR. We strongly recommend extending the analysis by conducting it at a monthly level to determine which months are most affected by cloud cover and aerosols in terms of SSR.
Variations were observed in SSR and their contributing sources behind these changes, notably clouds, especially at specific altitudes, and aerosols of certain types prevalent in the Indian regions. The insights of the study can offer a valuable guidance to solar system developers in formulating effective strategies to address challenges. Solar developers can prioritize regions for solar panel installations based on their impacts on solar radiation. By incorporating these findings into planning processes, it becomes possible to optimize renewable energy production. In addition to these strategies, it is crucial to invest in advanced forecasting models that incorporate meteorological data to accurately predict SSR. Additionally, to enhance renewable energy output further, a hybrid approach combining windmill parks with solar parks could be implemented. This integrated approach can capitalize on the complementary nature of solar and wind energy, maximizing power generation efficiency while diversifying the renewable energy portfolio. Such strategic planning and innovative approaches are essential steps towards advancing sustainable energy infrastructure and mitigating climate change impacts. Moreover, our findings also will assist policymakers and planners to evaluate solar energy resources and facilitate the expansion of solar infrastructure across India in the years to come. A comprehensive understanding of meteorological impacts on solar energy systems is important for crafting robust renewable energy strategies and ensuring the enduring viability of solar energy as a sustainable energy source.

Author Contributions

A.V.J. and R.L.B. designed and conceptualized the idea for this study. A.V.J. retrieved and analyzed the data, prepared the plots, and wrote the initial manuscript. A.V.J., R.L.B., P.R.C.R. and V.K. reviewed, edited, and formatted the manuscript. Discussions with U.C.D. contributed to the improvement of the manuscript. All authors have read and agreed to the published version of the manuscript.

Funding

This research was financially supported by TRTI, Government of Maharashtra, India.

Data Availability Statement

The data that supports the findings of this study are publicly available for free on their respective websites. Please refer to Section 2 for the sources of the datasets.

Acknowledgments

The authors are thankful to the Department of Atmospheric and Space Sciences (DASS), Savitribai Phule Pune University, Pune, for providing the necessary support to carry out this research. We thank the entire ERA5, MEERA-2, CERES, and MODIS teams for making valuable datasets available. The study utilized free software—Python (version 3.12, India)—for computational and graphical analysis. The authors are also grateful to the editor and three anonymous reviewers of the journal for their constructive comments that helped us to improve the paper.

Conflicts of Interest

The authors declare no conflicts of interest.

References

  1. Ang, T.-Z.; Salem, M.; Kamarol, M.; Das, H.S.; Nazari, M.A.; Prabaharan, N. A Comprehensive Study of Renewable Energy Sources: Classifications, Challenges and Suggestions. Energy Strategy Rev. 2022, 43, 100939. [Google Scholar] [CrossRef]
  2. Dey, S.; Sreenivasulu, A.; Veerendra, G.T.N.; Rao, K.V.; Babu, P.S.S.A. Renewable Energy Present Status and Future Potentials in India: An Overview. Innov. Green Dev. 2022, 1, 100006. [Google Scholar] [CrossRef]
  3. Beer, C.; Reichstein, M.; Tomelleri, E.; Ciais, P.; Jung, M.; Carvalhais, N.; Rödenbeck, C.; Arain, M.A.; Baldocchi, D.; Bonan, G.B.; et al. Terrestrial Gross Carbon Dioxide Uptake: Global Distribution and Covariation with Climate. Science 2010, 329, 834–838. [Google Scholar] [CrossRef]
  4. Dumka, U.C.; Kosmopoulos, P.G.; Ningombam, S.S.; Masoom, A. Impact of Aerosol and Cloud on the Solar Energy Potential over the Central Gangetic Himalayan Region. Remote Sens. 2021, 13, 3248. [Google Scholar] [CrossRef]
  5. Dumka, U.C.; Kosmopoulos, P.G.; Patel, P.N.; Sheoran, R. Can Forest Fires Be an Important Factor in the Reduction in Solar Power Production in India? Remote Sens. 2022, 14, 549. [Google Scholar] [CrossRef]
  6. Hasnain, S.M.; Alawaji, S.H.; Elani, U.A. Solar Energy Education—A Viable Pathway for Sustainable Development. Renew. Energy 1998, 14, 387–392. [Google Scholar] [CrossRef]
  7. Solangi, K.H.; Islam, M.R.; Saidur, R.; Rahim, N.A.; Fayaz, H. A Review on Global Solar Energy Policy. Renew. Sustain. Energy Rev. 2011, 15, 2149–2163. [Google Scholar] [CrossRef]
  8. Anandh, T.S.; Gopalakrishnan, D.; Mukhopadhyay, P. Analysis of Future Wind and Solar Potential over India Using Climate Models. Curr. Sci. 2022, 122, 1268. [Google Scholar] [CrossRef]
  9. Tsoutsos, T.; Frantzeskaki, N.; Gekas, V. Environmental Impacts from the Solar Energy Technologies. Energy Policy 2005, 33, 289–296. [Google Scholar] [CrossRef]
  10. Wild, M.; Gilgen, H.; Roesch, A.; Ohmura, A.; Long, C.N.; Dutton, E.G.; Forgan, B.; Kallis, A.; Russak, V.; Tsvetkov, A. From Dimming to Brightening: Decadal Changes in Solar Radiation at Earth’s Surface. Science 2005, 308, 847–850. [Google Scholar] [CrossRef]
  11. Allen, R.J.; Norris, J.R.; Wild, M. Evaluation of Multidecadal Variability in CMIP5 Surface Solar Radiation and Inferred Underestimation of Aerosol Direct Effects over Europe, China, Japan, and India. JGR Atmos. 2013, 118, 6311–6336. [Google Scholar] [CrossRef]
  12. Stanhill, G.; Cohen, S. Solar Radiation Changes in Japan during the 20th Century: Evidence from Sunshine Duration Measurements. J. Meteorol. Soc. Jpn. 2008, 86, 57–67. [Google Scholar] [CrossRef]
  13. Liepert, B.G. Observed Reductions of Surface Solar Radiation at Sites in the United States and Worldwide from 1961 to 1990. Geophys. Res. Lett. 2002, 29, 61-1–61-4. [Google Scholar] [CrossRef]
  14. Liang, F.; Xia, X.A. Long-Term Trends in Solar Radiation and the Associated Climatic Factors over China for 1961-2000. Ann. Geophys. 2005, 23, 2425–2432. [Google Scholar] [CrossRef]
  15. Stanhill, G.; Cohen, S. Global Dimming: A Review of the Evidence for a Widespread and Significant Reduction in Global Radiation with Discussion of Its Probable Causes and Possible Agricultural Consequences. Agric. For. Meteorol. 2001, 107, 255–278. [Google Scholar] [CrossRef]
  16. Wang, Y.W.; Yang, Y.H. China’s Dimming and Brightening: Evidence, Causes and Hydrological Implications. Ann. Geophys. 2014, 32, 41–55. [Google Scholar] [CrossRef]
  17. Meng, Q.; Liu, B.; Yang, H.; Chen, X. Solar Dimming Decreased Maize Yield Potential on the North China Plain. Food Energy Secur. 2020, 9, e235. [Google Scholar] [CrossRef]
  18. Padma Kumari, B.; Londhe, A.L.; Daniel, S.; Jadhav, D.B. Observational Evidence of Solar Dimming: Offsetting Surface Warming over India. Geophys. Res. Lett. 2007, 34, 2007GL031133. [Google Scholar] [CrossRef]
  19. Kambezidis, H.D.; Kaskaoutis, D.G.; Kharol, S.K.; Moorthy, K.K.; Satheesh, S.K.; Kalapureddy, M.C.R.; Badarinath, K.V.S.; Sharma, A.R.; Wild, M. Multi-decadal variation of the net downward shortwave radiation over south Asia: The solar dimming effect. Atmos. Environ. 2012, 50, 360–372. [Google Scholar] [CrossRef]
  20. Soni, V.K.; Pandithurai, G.; Pai, D.S. Is There a Transition of Solar Radiation from Dimming to Brightening over India? Atmos. Res. 2016, 169, 209–224. [Google Scholar] [CrossRef]
  21. Wild, M. Global Dimming and Brightening: A Review. J. Geophys. Res. 2009, 114, 2008JD011470. [Google Scholar] [CrossRef]
  22. Haywood, J.M.; Abel, S.J.; Barrett, P.A.; Bellouin, N.; Blyth, A.; Bower, K.N.; Brooks, M.; Carslaw, K.; Che, H.; Coe, H.; et al. The CLoud–Aerosol–Radiation Interaction and Forcing: Year 2017 (CLARIFY-2017) Measurement Campaign. Atmos. Chem. Phys. 2021, 21, 1049–1084. [Google Scholar] [CrossRef]
  23. Padma Kumari, B.; Goswami, B.N. Seminal Role of Clouds on Solar Dimming over the Indian Monsoon Region. Geophys. Res. Lett. 2010, 37, 2009GL042133. [Google Scholar] [CrossRef]
  24. Soni, V.K.; Pandithurai, G.; Pai, D.S. Evaluation of Long-term Changes of Solar Radiation in India. Intl. J. Climatol. 2012, 32, 540–551. [Google Scholar] [CrossRef]
  25. Wild, M. Enlightening Global Dimming and Brightening. Bull. Am. Meteorol. Soc. 2012, 93, 27–37. [Google Scholar] [CrossRef]
  26. Ramanathan, V.; Vogelmann, A.M. Greenhouse Effect, Atmospheric Solar Absorption and the Earth’s Radiation Budget: From the Arrhenius-Langley Era to the 1990s. Ambio 1997, 26, 38–46. [Google Scholar]
  27. Solomon, A.A.; Faiman, D.; Meron, G. An Energy-Based Evaluation of the Matching Possibilities of Very Large Photovoltaic Plants to the Electricity Grid: Israel as a Case Study. Energy Policy 2010, 38, 5457–5468. [Google Scholar] [CrossRef]
  28. Solomon, S. Climate Change 2007: The Physical Science Basis: Contribution of Working Group I to the Fourth Assessment Report of the Intergovernmental Panel on Climate Change; Intergovernmental Panel on Climate Change, Ed.; Cambridge University Press: Cambridge, NY, USA, 2007; ISBN 978-0-521-88009-1. [Google Scholar]
  29. Shi, G.-Y.; Hayasaka, T.; Ohmura, A.; Chen, Z.-H.; Wang, B.; Zhao, J.-Q.; Che, H.-Z.; Xu, L. Data Quality Assessment and the Long-Term Trend of Ground Solar Radiation in China. J. Appl. Meteorol. Climatol. 2008, 47, 1006–1016. [Google Scholar] [CrossRef]
  30. Streets, D.G.; Yu, C.; Wu, Y.; Chin, M.; Zhao, Z.; Hayasaka, T.; Shi, G. Aerosol Trends over China, 1980–2000. Atmos. Res. 2008, 88, 174–182. [Google Scholar] [CrossRef]
  31. Wang, K.C.; Dickinson, R.E.; Wild, M.; Liang, S. Atmospheric Impacts on Climatic Variability of Surface Incident Solar Radiation. Atmos. Chem. Phys. 2012, 12, 9581–9592. [Google Scholar] [CrossRef]
  32. Wang, W.; Huang, J.; Zhou, T.; Bi, J.; Lin, L.; Chen, Y.; Huang, Z.; Su, J. Estimation of Radiative Effect of a Heavy Dust Storm over Northwest China Using Fu–Liou Model and Ground Measurements. J. Quant. Spectrosc. Radiat. Transf. 2013, 122, 114–126. [Google Scholar] [CrossRef]
  33. Bonkaney, A.; Madougou, S.; Adamou, R. Impacts of Cloud Cover and Dust on the Performance of Photovoltaic Module in Niamey. J. Renew. Energy 2017, 2017, 9107502. [Google Scholar] [CrossRef]
  34. Suri, M.; Cebecauer, T. Satellite-Based Solar Resource Data: Model Validation Statistics Versus User’s Uncertainty. In Proceedings of the ASES SOLAR 2014 Conference, San Francisco, CA, USA, 6–10 July 2014. [Google Scholar]
  35. Ruosteenoja, K.; Räisänen, P.; Devraj, S.; Garud, S.S.; Lindfors, A.V. Future Changes in Incident Surface Solar Radiation and Contributing Factors in India in CMIP5 Climate Model Simulations. J. Appl. Meteorol. Climatol. 2019, 58, 19–35. [Google Scholar] [CrossRef]
  36. Yang, J.; Yi, B.; Wang, S.; Liu, Y.; Li, Y. Diverse Cloud and Aerosol Impacts on Solar Photovoltaic Potential in Southern China and Northern India. Sci. Rep. 2022, 12, 19671. [Google Scholar] [CrossRef] [PubMed]
  37. Agrios, G.N. Plant Pathology, 5th ed.; Elsevier Academic Press: Amsterdam, The Netherlands; Boston, MA, USA, 2005; ISBN 978-0-12-044565-3. [Google Scholar]
  38. Hatfield, J.L.; Prueger, J.H. Temperature Extremes: Effect on Plant Growth and Development. Weather Clim. Extrem. 2015, 10, 4–10. [Google Scholar] [CrossRef]
  39. Poli, P.; Hersbach, H.; Dee, D.P.; Berrisford, P.; Simmons, A.J.; Vitart, F.; Laloyaux, P.; Tan, D.G.H.; Peubey, C.; Thépaut, J.-N.; et al. ERA-20C: An Atmospheric Reanalysis of the Twentieth Century. J. Clim. 2016, 29, 4083–4097. [Google Scholar] [CrossRef]
  40. Hersbach, H.; Bell, B.; Berrisford, P.; Hirahara, S.; Horányi, A.; Muñoz-Sabater, J.; Nicolas, J.; Peubey, C.; Radu, R.; Schepers, D.; et al. The ERA5 Global Reanalysis. Q. J. R. Meteorol. Soc. 2020, 146, 1999–2049. [Google Scholar] [CrossRef]
  41. Fang, W.; Yang, C.; Liu, D.; Huang, Q.; Ming, B.; Cheng, L.; Wang, L.; Feng, G.; Shang, J. Assessment of Wind and Solar Power Potential and Their Temporal Complementarity in China’s Northwestern Provinces: Insights from ERA5 Reanalysis. Energies 2023, 16, 7109. [Google Scholar] [CrossRef]
  42. Khalil, S.A.; Rahoma, U.A. Verification of Solar Energy Measurements by (ERA-5) and Its Impact on Electricity Costs in North Africa. IJAA Int. J. Astron. Astrophys. 2022, 12, 301–327. [Google Scholar] [CrossRef]
  43. Urraca, R.; Huld, T.; Gracia-Amillo, A.; Martinez-de-Pison, F.J.; Kaspar, F.; Sanz-Garcia, A. Evaluation of Global Horizontal Irradiance Estimates from ERA5 and COSMO-REA6 Reanalyses Using Ground and Satellite-Based Data. Sol. Energy 2018, 164, 339–354. [Google Scholar] [CrossRef]
  44. Zhang, X.; Dong, X.; Li, X. Study of China’s Optimal Concentrated Solar Power Development Path to 2050. Front. Energy Res. 2021, 9, 724021. [Google Scholar] [CrossRef]
  45. Gelaro, R.; McCarty, W.; Suárez, M.J.; Todling, R.; Molod, A.; Takacs, L.; Randles, C.A.; Darmenov, A.; Bosilovich, M.G.; Reichle, R.; et al. The Modern-Era Retrospective Analysis for Research and Applications, Version 2 (MERRA-2). J. Clim. 2017, 30, 5419–5454. [Google Scholar] [CrossRef] [PubMed]
  46. Che, H.; Gui, K.; Xia, X.; Wang, Y.; Holben, B.N.; Goloub, P.; Cuevas-Agulló, E.; Wang, H.; Zheng, Y.; Zhao, H.; et al. Large Contribution of Meteorological Factors to Inter-Decadal Changes in Regional Aerosol Optical Depth. Atmos. Chem. Phys. 2019, 19, 10497–10523. [Google Scholar] [CrossRef]
  47. Doelling, D.R.; Loeb, N.G.; Keyes, D.F.; Nordeen, M.L.; Morstad, D.; Nguyen, C.; Wielicki, B.A.; Young, D.F.; Sun, M. Geostationary Enhanced Temporal Interpolation for CERES Flux Products. J. Atmos. Ocean. Technol. 2013, 30, 1072–1090. [Google Scholar] [CrossRef]
  48. Rose, F.G.; Rutan, D.A.; Charlock, T.; Smith, G.L.; Kato, S. An Algorithm for the Constraining of Radiative Transfer Calculations to CERES-Observed Broadband Top-of-Atmosphere Irradiance. J. Atmos. Ocean. Technol. 2013, 30, 1091–1106. [Google Scholar] [CrossRef]
  49. Rutan, D.A.; Kato, S.; Doelling, D.R.; Rose, F.G.; Nguyen, L.T.; Caldwell, T.E.; Loeb, N.G. CERES Synoptic Product: Methodology and Validation of Surface Radiant Flux. J. Atmos. Ocean. Technol. 2015, 32, 1121–1143. [Google Scholar] [CrossRef]
  50. King, M.D.; Menzel, W.P.; Kaufman, Y.J.; Tanre, D.; Bo-Cai , G.; Platnick, S.; Ackerman, S.A.; Remer, L.A.; Pincus, R.; Hubanks, P.A. Cloud and Aerosol Properties, Precipitable Water, and Profiles of Temperature and Water Vapor from MODIS. IEEE Trans. Geosci. Remote Sens. 2003, 41, 442–458. [Google Scholar] [CrossRef]
  51. Gautam, S.; Gautam, A.S.; Singh, K.; James, E.J.; Brema, J. Investigations on the Relationship among Lightning, Aerosol Concentration, and Meteorological Parameters with Specific Reference to the Wet and Hot Humid Tropical Zone of the Southern Parts of India. Environ. Technol. Innov. 2021, 22, 101414. [Google Scholar] [CrossRef]
  52. Pfeifroth, U.; Sanchez-Lorenzo, A.; Manara, V.; Trentmann, J.; Hollmann, R. Trends and Variability of Surface Solar Radiation in Europe Based On Surface- and Satellite-Based Data Records. JGR Atmos. 2018, 123, 1735–1754. [Google Scholar] [CrossRef]
  53. Singh, J.; Kumar, M. Solar Radiation over Four Cities of India: Trend Analysis Using Mann-Kendall Test. Int. J. Renew. Energy Resour. 2016, 6, 1385–1395. [Google Scholar]
  54. Smadi, M.M.; Zghoul, A. A Sudden Change In Rainfall Characteristics In Amman, Jordan During The Mid 1950s. Am. J. Environ. Sci. 2006, 2, 84–91. [Google Scholar] [CrossRef]
  55. Wu, X.; Zhang, L.; Zhao, C.; Gegen, T.; Zheng, C.; Shi, X.; Geng, J.; Letu, H. Satellite-Based Assessment of Local Environment Change by Wind Farms in China. Earth Space Sci. 2019, 6, 947–958. [Google Scholar] [CrossRef]
  56. Aldabash, M.; Bektas Balcik, F.; Glantz, P. Validation of MODIS C6.1 and MERRA-2 AOD Using AERONET Observations: A Comparative Study over Turkey. Atmosphere 2020, 11, 905. [Google Scholar] [CrossRef]
  57. Khoir, A.N.; Siahaan, A.R.; Sopaheluwakan, A.; Se-tiawan, B.; Nahas, A.C.; Taryono; Kinanti, N.P.; Prih Waryatno, N.F.; Sucianingsih, C.; Nurhayati, H. Evaluation of MERRA-2 and MODIS C6.1 Aerosol Products over Indonesia. E3S Web Conf. 2024, 485, 06003. [Google Scholar] [CrossRef]
  58. Zhang, K.; Zhao, L.; Tang, W.; Yang, K.; Wang, J. Global and Regional Evaluation of the CERES Edition-4A Surface Solar Radiation and Its Uncertainty Quantification. IEEE J. Sel. Top. Appl. Earth Obs. Remote Sens. 2022, 15, 2971–2985. [Google Scholar] [CrossRef]
  59. Li, X.; Mauzerall, D.L.; Bergin, M.H. Global Reduction of Solar Power Generation Efficiency Due to Aerosols and Panel Soiling. Nat. Sustain. 2020, 3, 720–727. [Google Scholar] [CrossRef]
  60. Li, Z.; Yang, J.; Dezfuli, P.A.N. Study on the Influence of Light Intensity on the Performance of Solar Cell. Int. J. Photoenergy 2021, 2021, 6648739. [Google Scholar] [CrossRef]
  61. Matuszko, D. Influence of the Extent and Genera of Cloud Cover on Solar Radiation Intensity. Intl. J. Climatol. 2012, 32, 2403–2414. [Google Scholar] [CrossRef]
  62. Monteith, J.L.; Unsworth, M.H. Principles of Environmental Physics: Plants, Animals, and the Atmosphere, 4th ed.; Elsevier/Academic Press: Amsterdam, The Netherlands; Boston, MA, USA, 2013; ISBN 978-0-12-386910-4. [Google Scholar]
  63. Fountoulakis, I.; Kosmopoulos, P.; Papachristopoulou, K.; Raptis, P.-I.; Mamouri, R.-E.; Nisantzi, A.; Gkikas, A.; Witthuhn, J.; Bley, S.; Moustaka, A.; et al. Effects of Aerosols and Clouds on the Levels of Surface Solar Radiation and Solar Energy in Cyprus. Remote Sens. 2021, 13, 2319. [Google Scholar] [CrossRef]
  64. Papayannis, A.; Balis, D.; Amiridis, V.; Chourdakis, G.; Tsaknakis, G.; Zerefos, C.; Castanho, A.D.A.; Nickovic, S.; Kazadzis, S.; Grabowski, J. Measurements of Saharan Dust Aerosols over the Eastern Mediterranean Using Elastic Backscatter-Raman Lidar, Spectrophotometric and Satellite Observations in the Frame of the EARLINET Project. Atmos. Chem. Phys. 2005, 5, 2065–2079. [Google Scholar] [CrossRef]
  65. Qian, Y.; Wang, W.; Leung, L.R.; Kaiser, D.P. Variability of Solar Radiation under Cloud-free Skies in China: The Role of Aerosols. Geophys. Res. Lett. 2007, 34, 2006GL028800. [Google Scholar] [CrossRef]
Figure 1. Spatial distribution of the 30-year mean of (A) SSR (Wm−2) and (E) TCC (%), and 20-year mean of (I) AOD (unitless), with Decadal anomalies of (BD) SSR (%), (FH) TCC (%), and (J,K) AOD. Stippling indicates the regions with 95% significance based on Student’s t-test.
Climate 12 00048 g001
Figure 2. Spatial distribution of the 30-year mean of (A) Cimpact (%) and the 20-year mean of (E) Aimpact (%) with decadal anomalies of (BD) Cimpact (%) and (F,G) Aimpact (%). Stippling indicates the regions with a 95% significance level based on Student’s t-test.
Climate 12 00048 g002
Figure 3. Regional annual mean of (1) anomalies (%) of HCimpact (black line), MCimpact (red line), and LCimpact (blue line), underlaid with contours of FCC (%) with respect to pressure levels. The pink dashed lines represent the separation for low-, mid- and high-level clouds. The values enclosed in boxes represent the decadal mean anomalies combining of all three levels of clouds.
Climate 12 00048 g003
Figure 4. Regional annual mean of (1) the percentages of AOD of five aerosol types to the total AOD (bar plots), overlaid with (2) Aimpact anomalies (%) (black solid line). Black dashed line represents the trend of Aimpact anomalies.
Climate 12 00048 g004
Table 1. Thirty-year mean (1993–2022) statistics of SSR and TCC from 1993 to 2022, and twenty-year mean statistics of AOD from 2003 to 2022.
Meteorological ParametersMeanTrend
SSR429 (Wm−2)−0.11% year−1 (−0.40 Wm−2 year−1)
TCC45%0.10% year−1
AOD0.41 (unitless)0.76% year−1
The positive (+) or negative (−) sign indicates an increasing or decreasing trend. The trend is statistically significant at a 95% significance level.
Table 2. Regional statistics of Cimpact from 1993 to 2022 and Aimpact from 2003 to 2022, with decadal trends.
ImpactRegionMean Impact (%)Trend (% year−1)
1st Decade2nd Decade3rd Decade
CimpactR140−0.340.090.41
R238−0.560.210.11
R346−0.15−0.280.07
R428−0.260.060.09
AimpactR1110.280.15
R2130.160.08
R3170.370.25
R4130.110.07
The positive (+) or negative (−) sign in trends indicates an increasing or decreasing trend. The trend is statistically significant at 95% significance level and all trends are not statistically significant.
Table 3. Regional statistics of HCimpact, MCimpact, and LCimpact from 1993 to 2022, with decadal trends.
ImpactRegionRegional Mean Impact (%)Mean Impact (%)Trend (% Year−1)
1st DecadeMean2nd DecadeMean3rd DecadeMean
HCimpactR13131−0.33−0.260.02−0.040.540.22
R228−0.360.100.15
R337−0.10−0.210.07
R429−0.24−0.040.12
MCimpactR144400.05−0.190.02−0.080.380.13
R239−0.260.000.03
R348−0.08−0.470.01
R429−0.440.150.08
LCimpactR14644−0.04−0.370.210.150.30−0.01
R251−1.100.51−0.14
R353−0.25−0.17−0.12
R428−0.070.05−0.05
The positive (+) or negative (−) sign in trends indicates an increasing or decreasing trend. The trend is statistically significant at 95% significance level and all trends are not statistically significant.
Table 4. Regional statistics of Aimpact from 2003 to 2022, with decadal trends.
ImpactRegionRegional Mean Impact (%)Mean Impact (%)Trend (% Year−1)
1st DecadeMean2nd DecadeMean3rd DecadeMean
AimpactR111130.280.240.150.14
R2130.160.08
R3170.380.26
R4130.110.08
The positive (+) or negative (−) sign in trends indicates an increasing or decreasing trend. The trend is statistically significant at 95% significance level and all trends are not statistically significant.
Disclaimer/Publisher’s Note: The statements, opinions and data contained in all publications are solely those of the individual author(s) and contributor(s) and not of MDPI and/or the editor(s). MDPI and/or the editor(s) disclaim responsibility for any injury to people or property resulting from any ideas, methods, instructions or products referred to in the content.

