Article

Reducing Fossil Fuel Dependence and Exploring Just Energy Transition Pathways in Indonesia Using OSeMOSYS (Open-Source Energy Modelling System)

by
Laksmita Dwi Hersaputri
1,*,
Rudolf Yeganyan
1,2,
Carla Cannone
1,2,
Fernando Plazas-Niño
1,
Simone Osei-Owusu
3,
Yiannis Kountouris
1 and
Mark Howells
1,2
1
Centre for Environmental Policy, Imperial College London, London SW7 2BX, UK
2
STEER Centre, Department of Geography, Loughborough University, Loughborough LE11 3TU, UK
3
Bartlett School of Environment, Energy and Resources, University College London, London WC1E 6BT, UK
*
Author to whom correspondence should be addressed.
Climate 2024, 12(3), 37; https://doi.org/10.3390/cli12030037
Submission received: 21 January 2024 / Revised: 28 February 2024 / Accepted: 1 March 2024 / Published: 4 March 2024

Abstract

:
Indonesia’s commitment to the Paris Agreement and its Nationally Determined Contribution (NDC) is not adequately reflected in the significant CO2 emissions from fossil-fuel-intensive energy sectors, despite the enormous potential of renewable energy sources in the country. The ongoing coal regime has led to electricity oversupply and air pollution problems. Despite the huge challenges for Indonesia, a just energy transition away from fossil fuel is crucial. This study aims to explore the ideal energy mix and key emission reduction pathway in Indonesia in achieving a just energy transition using the least-cost optimisation energy modelling tool OSeMOSYS. Six scenarios are modelled over the period 2015–2050 including coal phase-out, NDC, the Just Energy Transition Partnership (JETP), and carbon tax implementation. The results highlight that solar power, geothermal power, and hydropower are the alternatives for coal decommissioning. Despite the large-scale investment in renewable energy under the NDC and JETP scenarios, emissions could be reduced by 55% and 52%, respectively, by 2050. Moreover, Indonesia’s current carbon tax rate will not lead to a significant emission reduction. Three recommended policies include (1) accelerating CFPP retirement; (2) imposing an aggressive carbon tax rate; (3) prioritising investment in solar technologies.

1. Introduction

1.1. Overview

Indonesia, the world’s fourth most populous country, is experiencing continuous population growth [1], contributing to a rapid annual increase in overall energy and electricity demand, projected at around 4.9% [2]. However, the International Energy Agency (IEA) suggests an overestimation of demand and the oversupply of Coal-Fired Power Plants (CFPPs) [3], creating financial pressure on both the state-owned company (PLN) and government expenditures [4]. This surplus stems from inconsistent energy balance, with the supply constantly surpassing consumption by 18.2% for the last five years [5]. Intensified with the initiation of the 35 GW CFPP national megaproject in 2015, the construction of new CFPPs has led to electricity generation and consumption imbalances in Indonesia. In 2021, coal contributed to 66% of Indonesia’s electricity generation mix, as shown on Figure 1. Therefore, electricity oversupply is one of the main energy challenges in the country.
Abundant coal and oil reserves have historically made Indonesia rely heavily on fossil fuels as the primary energy source [5], as illustrated in Figure 2. Despite being the world’s largest oil exporter until 2003 [7], production declined in the following years, turning Indonesia into a net importer [8]. In response, the current energy strategy aims to reduce reliance on imported oil and promote local resources for economic growth, resulting in increased coal mining [9]. In 2021, coal, oil, and gas accounted for 38%, 33%, and 17% of the primary energy mix, respectively, while renewable energy contributed to only 12% [5].
Indonesia, ranked among the top greenhouse gas (GHG) emitters globally, contributed to 1050 MtCO2e emissions in 2020 [10]. The energy sector, which also includes the power sector, contributes to 56% of the country’s emissions and became the highest emitting sector in 2020 [10], thus playing a significant role in decarbonisation. Beyond environmental consequences, GHG emissions impact public health, including the worsening of respiratory diseases [11]. With the estimated health cost at USD 15.98/MWh and a total of 120 CFPPs in Indonesia, the impact on the current generation is intolerable [12]. Exacerbated by the fact that Jakarta, the capital, is the world’s most polluted city, largely due to the emissions from nearby CFPPs [13], air pollution ranks among the top five leading causes of mortality in Indonesia, with an annual toll of 123,000 deaths [14]. This highlights the urgent need for a transition to cleaner energy.

1.2. Literature Review

Several studies have previously evaluated Indonesia’s power system through the lens of least-cost modelling analyses. Sarjiya et al. [15] examined the generation expansion of the main power grid in Indonesia, Jawa-Bali power system, using OSeMOSYS. Gupta [16] analysed fuel switching and energy efficiency measures in the residential, commercial, and transportation sector using OSeMOSYS. Reyseliani and Purwanto [17] investigated modelling approaches across all power grids in achieving 100% renewable energy using another modelling tool, VEDA TIMES. Paiboonsin et al. [18] modelled six clean energy transition scenarios including net zero 2050 and 2060 using OSeMOSYS. However, the impact of Indonesia’s pursuit of a just energy transition on its future power generation mix, CO2 emissions, and capital investments remains to be thoroughly explored.
The shift in energy structures involves changes in technology, institutions, employment, and socio-economic aspects at all levels. A just energy transition prioritises individuals and communities [19], tackling justice concerns, and promotes equality in society and job opportunities [20]. Moreover, it fosters economic diversification [21] and minimises socio-economic shocks from ambitious energy transition commitments [22]. Thus, Indonesia urgently requires a socially inclusive energy transition.
Given the substantial investment required for a just energy transition, financially capable nations may navigate it more easily than emerging countries [22]. Hence, international support, particularly initiatives like the Just Energy Transition Partnership (JETP), is crucial. The Indonesian JETP involves a USD 20 billion investment from an international partner group, and serves as a financing model, focusing on the social impact of transitioning away from coal [23]. However, there are barriers involving multi-dimensional factors in achieving a just energy transition in Indonesia.
First and foremost, many academics, NGOs, businesses, and other stakeholders have proposed that the primary challenges in implementing a just energy transition in Indonesia are associated with political and institutional issues [24,25,26]. These include a lack of national capacity to formulate relevant policies and provide skilled labour [20], an inconsistent and unstable political landscape, and also conflicts among decision makers at various hierarchical levels [27]. Indonesia’s stable regime of fossil-fuel-based energy, the coal industry’s strong ties with political stakeholders, along with politically driven support of fossil energy, drive pressure to continue exploiting fossil energy sources [28] despite ongoing efforts for institutional reforms.
Secondly, political and institutional barriers have significantly impacted the economic and financial sectors in Indonesia’s energy transition. The government allocates a limited budget for climate action, prioritising other sectors over it [29], and considers the decarbonisation framework, such as renewable energy development, as a significant burden [30]. Similarly, the private sector deems it as a high-risk investment due to its substantial capital expenditure [31], thus is unattractive to investors [9] and leads to market inefficiency [32]. This is evident in the low investment in relevant projects [25]. Furthermore, complex bureaucratic procedures associated with capital-intensive renewable energy projects result in double-digit interest rates [9].
Thirdly, fossil fuel energy outperforms renewable energy in terms of dispatchability, technical maturity, and cost effectiveness [33]. Furthermore, there may be incompatibility between existing technologies and renewable energy specifications in the country. Often involving imported power plant components [25], the Decree of the Minister of Industry of Indonesia Number 5 of 2017 mandated that at least 60% of solar photovoltaic (PV) infrastructure components must be domestically sourced. This requirement, aimed at promoting local production, poses a significant challenge to the expansion of solar PV due to resource limitations and industry readiness [34]. As a relatively new technology, renewable energy may also entail complex maintenance processes and technical operational inefficiencies and intermittencies, resulting in higher operational and maintenance costs [34]. Also, although Indonesia relies on power grids for transmitting and distributing electricity, ‘take-or-pay’ contracts between PLN and the independent power producer restrict the flexibility needed to effectively integrate renewables to the grid system [9]. Institutional and regulatory reform ought to be the starting point of a just energy transition in Indonesia.
Lastly, beyond institutional unawareness, the local community confronts similar challenges. As most renewable energy sources are located outside urban areas, the local community expresses greater concerns about the immediate consequences of renewable energy projects than the future benefits [25]. This is intensified by the low rate of rural electrification, potentially requiring substantial subsidy support for the expansion of renewable energy deployment, a notion that is not commonly granted [22]. Additionally, the shift from carbon-intensive industries to renewable energy, which demands advanced technical expertise, may lead to job losses, transfers, and expansions. This shift directly affects 165,000 coal miners and 1.2 million labourers in Indonesia’s coal mining sector [35]. Exacerbated by the frequent job rotation within the related sector, this has impacted the workforce’s skill and competency standards required for the successful implementation of renewable energy projects [25].
Indonesia has implemented various energy sector regulations to reduce coal dependence, diversify energy sources, and meet the Paris Agreement. The National Electricity Supply Business Plan (RUPTL) of 2021–2030 limits new CFPP construction with the exception of ongoing projects and planning gradual CFPP retirement from 2030 [2]. Moreover, the Acceleration of Renewable Energy Development for Power Supply through the Presidential Decree Number 112 of 2022 mentioned the ban of new CFPP construction except for those stated in previous law and those willing to minimise the emissions from the power plant. GHG emission reduction targets are ratified through the Enhanced NDC of 2022: 12.5% without international aid or 15.5% with international aid by 2030 [36].
A just energy transition framework enables a country to evaluate its energy policy and progress towards low-carbon goals in NDC commitments to the Paris Agreement [37]. Despite numerous studies on Indonesia’s energy system, comprehensive research of energy system modelling that incorporates the latest ratified policies and targets such as Enhanced NDC and JETP with a cost optimisation approach appear to have not yet been fully explored. Therefore, this study aims to address this gap in modelling the energy mix and key pathways for emission reduction in Indonesia by analysing potential scenarios for the energy mix, considering environmental, economic, and technical factors. The objectives include analysing several potential scenarios of different policy and investment constraints, examining the optimal energy mix, and identifying feasible policy recommendations.

2. Methodology

2.1. OSeMOSYS as a Modelling Approach

The model of Indonesia’s electricity system is developed using OSeMOSYS (Open-Source Energy Modelling System), an energy system optimisation for planning and decision-making by generating least-cost and locally focused alternatives for energy sources [38]. This is particularly crucial for Indonesia, given its financial constraints in transitioning to cleaner energy sources.
Using a bottom-up approach, OSeMOSYS focuses on the detailed structure of the energy system, and provides insights into the cost, performance, and environmental impacts of various technologies [39]. Its goal is to determine the most optimal and least-cost solutions by aligning with the intended demand, policy objectives, system constraints, and country-specific technoeconomic data. Moreover, OSeMOSYS addresses cost minimisation related to capital investments, operating expenses, emissions penalties, and salvage value variables, as illustrated in the following equation, where y is the year modelled, r is the region, and t is the technology (power plant) [40]:
M i n i m i z e y , t , r n T o t a l D i s c o u n t e d C o s t y ,   t ,   r
where
y , t , r T o t a l D i s c o u n t e d C o s t y , t , r = D i s c o u n t e d O p e r a t i n g C o s t s y , t , r + D i s c o u n t e d C a p i t a l I n v e s t m e n t y , t , r + D i s c o u n t e d T e c h n o l o g y E m i s s i o n s P e n a l t y y , t , r D i s c o u n t e d S a l v a g e V a l u e y , t , r
OSeMOSYS also allows for the flexibility of new scenarios and hypotheses analysis in the medium to long-term through the simplification of complex energy modelling [41], utilising simple building ‘blocks’ for detailed representation of technologies in energy systems, as illustrated on Figure 3. In compliance with the U4RIA concept (Ubuntu, Retrievability, Repeatability, Reconstructability, Interoperability, Auditability) [42], OSeMOSYS provides a user-friendly and accessible spreadsheet-based interface, in which this study utilises clicSAND (Simple and Nearly Done) 3.0 interface.
The general assumptions used in this study include a discount rate of 4.78% based on Indonesia’s Central Bank rate [43], a modelling period from 2015 to 2050, and a time variability assumption of four time slices representing two seasonal conditions in Indonesia as an equatorial country—dry season (April to October) and wet season (November to March) and two daily load profiles—day (06 a.m. to 06 p.m.) and night (06 p.m. to 06 a.m.).

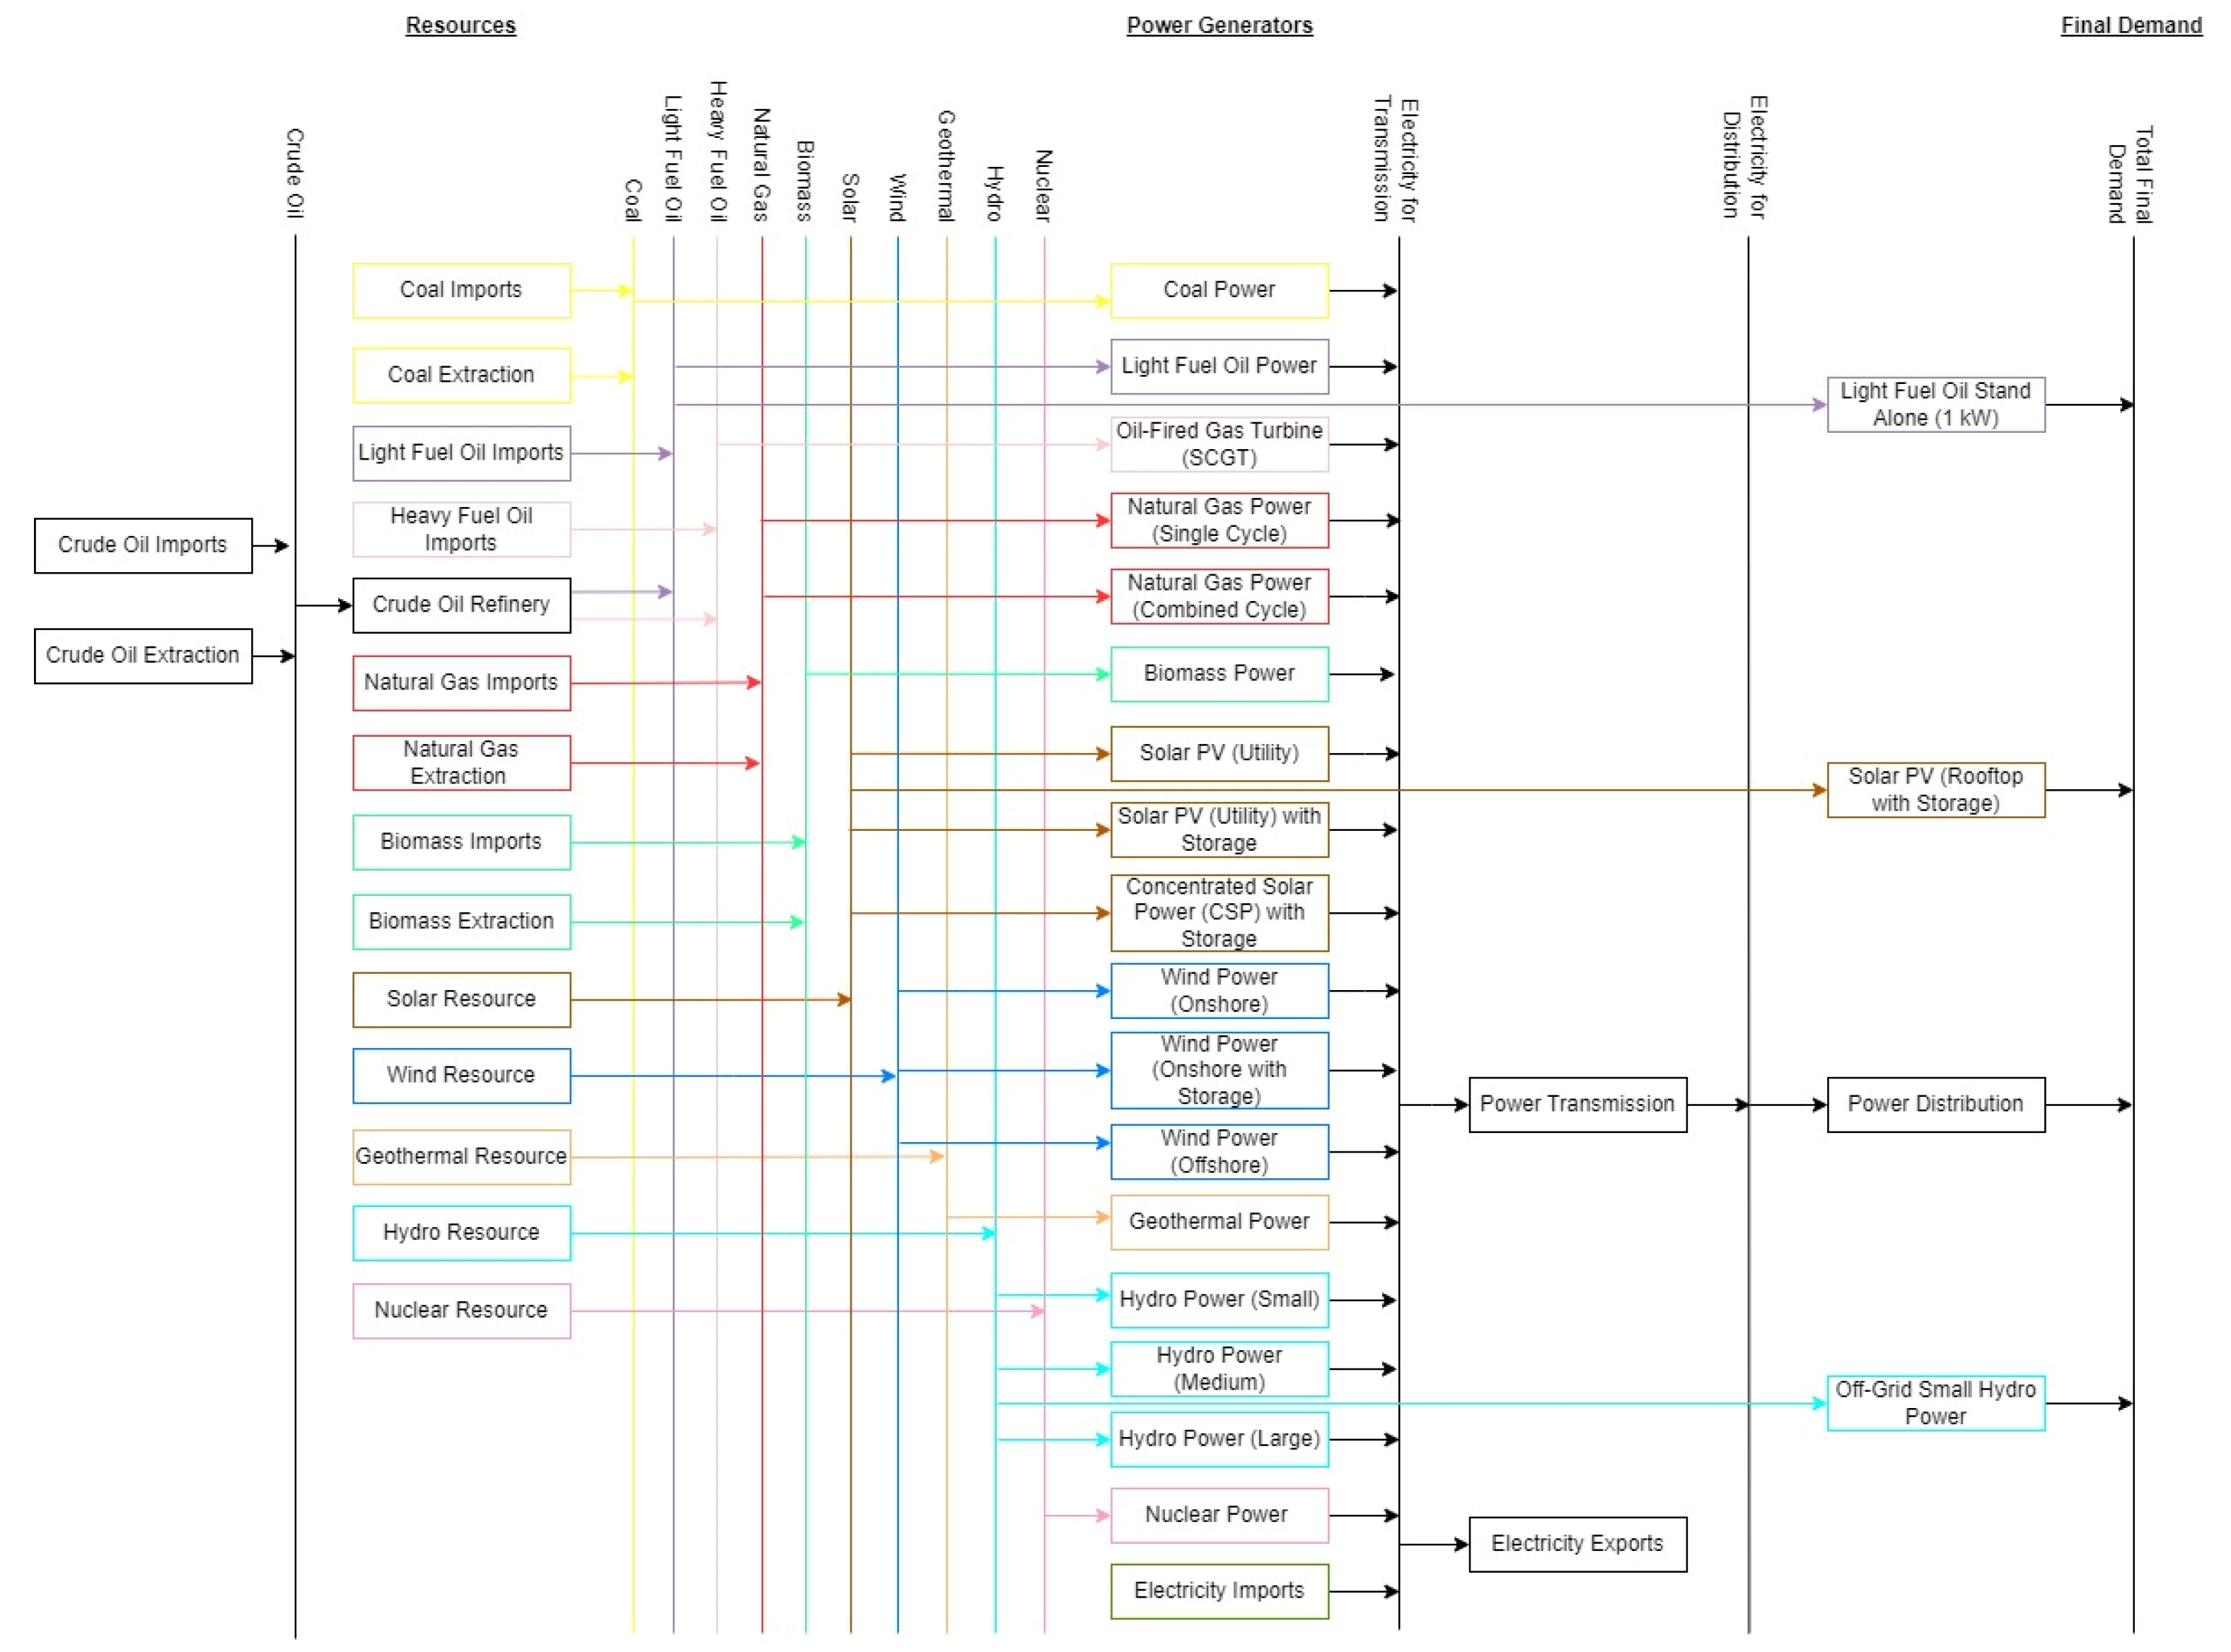
2.2. Reference Energy System

Indonesia’s energy system is defined through a simplified diagram that includes 14 commodities (primary resources for power generators), 9 technologies (existing power generators in Indonesia), and the final electricity demand, as illustrated in Figure 4. The resources also encompass imported commodities for electricity generation, such as coal, light fuel oil, heavy fuel oil, natural gas, and biomass.

2.3. Demand Projection

The electricity demand of Indonesia’s energy system in this study is specified from three categories, industrial, residential, and commercial, with the total demand listed on Table 1. The electricity demand data are sourced from Paiboonsin (2023) [44].

2.4. Techno-Economic Input Data

The main techno-economic data in this study consist of cost (capital, fixed, variable), efficiency, installed capacity, electricity production, and the operational lifetime of each power plant. While the cost data are available in 10- and 20-year intervals (2020, 2030, and 2050), Table 2 lists the data of 2020. Furthermore, the data of coal and geothermal technology in this study are the average values of the existing types in Indonesia (coal—subcritical, supercritical, and ultra-supercritical power plants; geothermal—small and large power plants).
The variable cost in this study reflects the fuel cost of each technology; thus, it is assumed that some renewable energy technologies have 0 variable cost. The costs and operational lifetime data are sourced from the Ministry of Energy and Mineral Resource’s (MEMR)’s Technology Data for the Indonesian Power Sector publication [45]. Most of the capital cost, except for geothermal energy, includes the engineering, procurement, and construction cost. The learning rates for most technologies vary between 10 and 15% and also yield the cost reduction in later years [45]. In addition, the efficiency data for the power plant are obtained from Paiboonsin (2023) [44,46].

2.5. Renewable Energy Potential

As an archipelagic and equatorial country, Indonesia has an abundant renewable energy resource potential, such as geothermal, hydropower, wind, and specifically solar energy with constant year-round availability [47]. However, the development and its realised power plant capacity as of 2022 is relatively low, at only 0.3%, as listed on Table 3 [48].

2.6. Scenario Definition

In this study, seven scenarios are modelled to investigate the impacts of the baseline, phasing out of CFPPs, levying of carbon tax, and implementation of decarbonisation targets of the NDC and JETP. Details of each scenario are described below.
  • Scenario 1: Baseline Least Cost (Least Cost)
The Least Cost scenario is a baseline or business-as-usual model to be compared with other scenarios, to illustrate Indonesia’s current energy landscape by assuming that the current regulatory framework is implemented until the end of the modelling period. In the model, there are no constraints on electricity generation from fossil-powered plants and no coal phase-out.
  • Scenario 2: Coal Phase-Out 2045
This scenario assumes that a phasing out of CFPPs occurs in 2045. This scenario may depict alternative energy mix and emission reduction pathways if the predominant yet unsustainable electricity generation source is phased out.
  • Scenario 3: Moderate Carbon Tax
This scenario uses the current carbon tax rate (Rp30,000 or USD 1.98/tCO2e) proposed by the government through Law Number 7 of 2021 to examine the emission reduction and optional energy mix once this emission penalty is effectively enforced in Indonesia.
  • Scenario 4: Aggressive Carbon Tax
This scenario uses a more aggressive carbon tax rate to analyse the effectiveness of the current carbon tax rate in Indonesia by evaluating the emission reduction gap from Scenario 3. This study uses Denmark’s carbon tax rate (USD 26.53/tCO2e) as a benchmark given its success in achieving a 23% emission reduction in the country between 2005 and 2018, surpassing the performance of other European countries [49].
  • Scenario 5: Unconditional NDC
This scenario represents Indonesia’s Enhanced NDC target of 2022, which includes a 12.5% emission reduction by 2030 (justified from a 12.5% emission reduction target in the energy sector, which involves the power sector) and energy mix share target by 2025 (minimum 23% renewable energy, maximum 25% oil, minimum 30% coal, minimum 22% gas) [36].
  • Scenario 6: Conditional NDC
This scenario is similar to Scenario 5 but achieves its objectives with international support and more ambitious targets, aiming for a 15.5% reduction in emissions by 2030 (justified from a 15.5% emission reduction in the energy sector, which includes the power sector) [36].
  • Scenario 7: JETP
This scenario refers to the JETP targets of a 19% emission reduction by 2030 (justified from 67 MtCO2 reduction from the baseline value of 357 MtCO2), a 34% renewable energy share in the energy mix, and the early retirement of CFPPs (assumed to occur in 2035, earlier than in Scenario 2, yet aligned with the JETP plan of starting coal phase-out after 2035) [50].

3. Results

This section shows each scenario’s results relating to electricity generation, installed capacity, emissions, and cost. The figure for electricity generation and installed capacity is divided into two parts, detailing the baseline Least Cost scenario in comparison with the independent emission reduction policies (coal phase-out and carbon tax) first, and then the national decarbonisation targets (NDC and JETP).

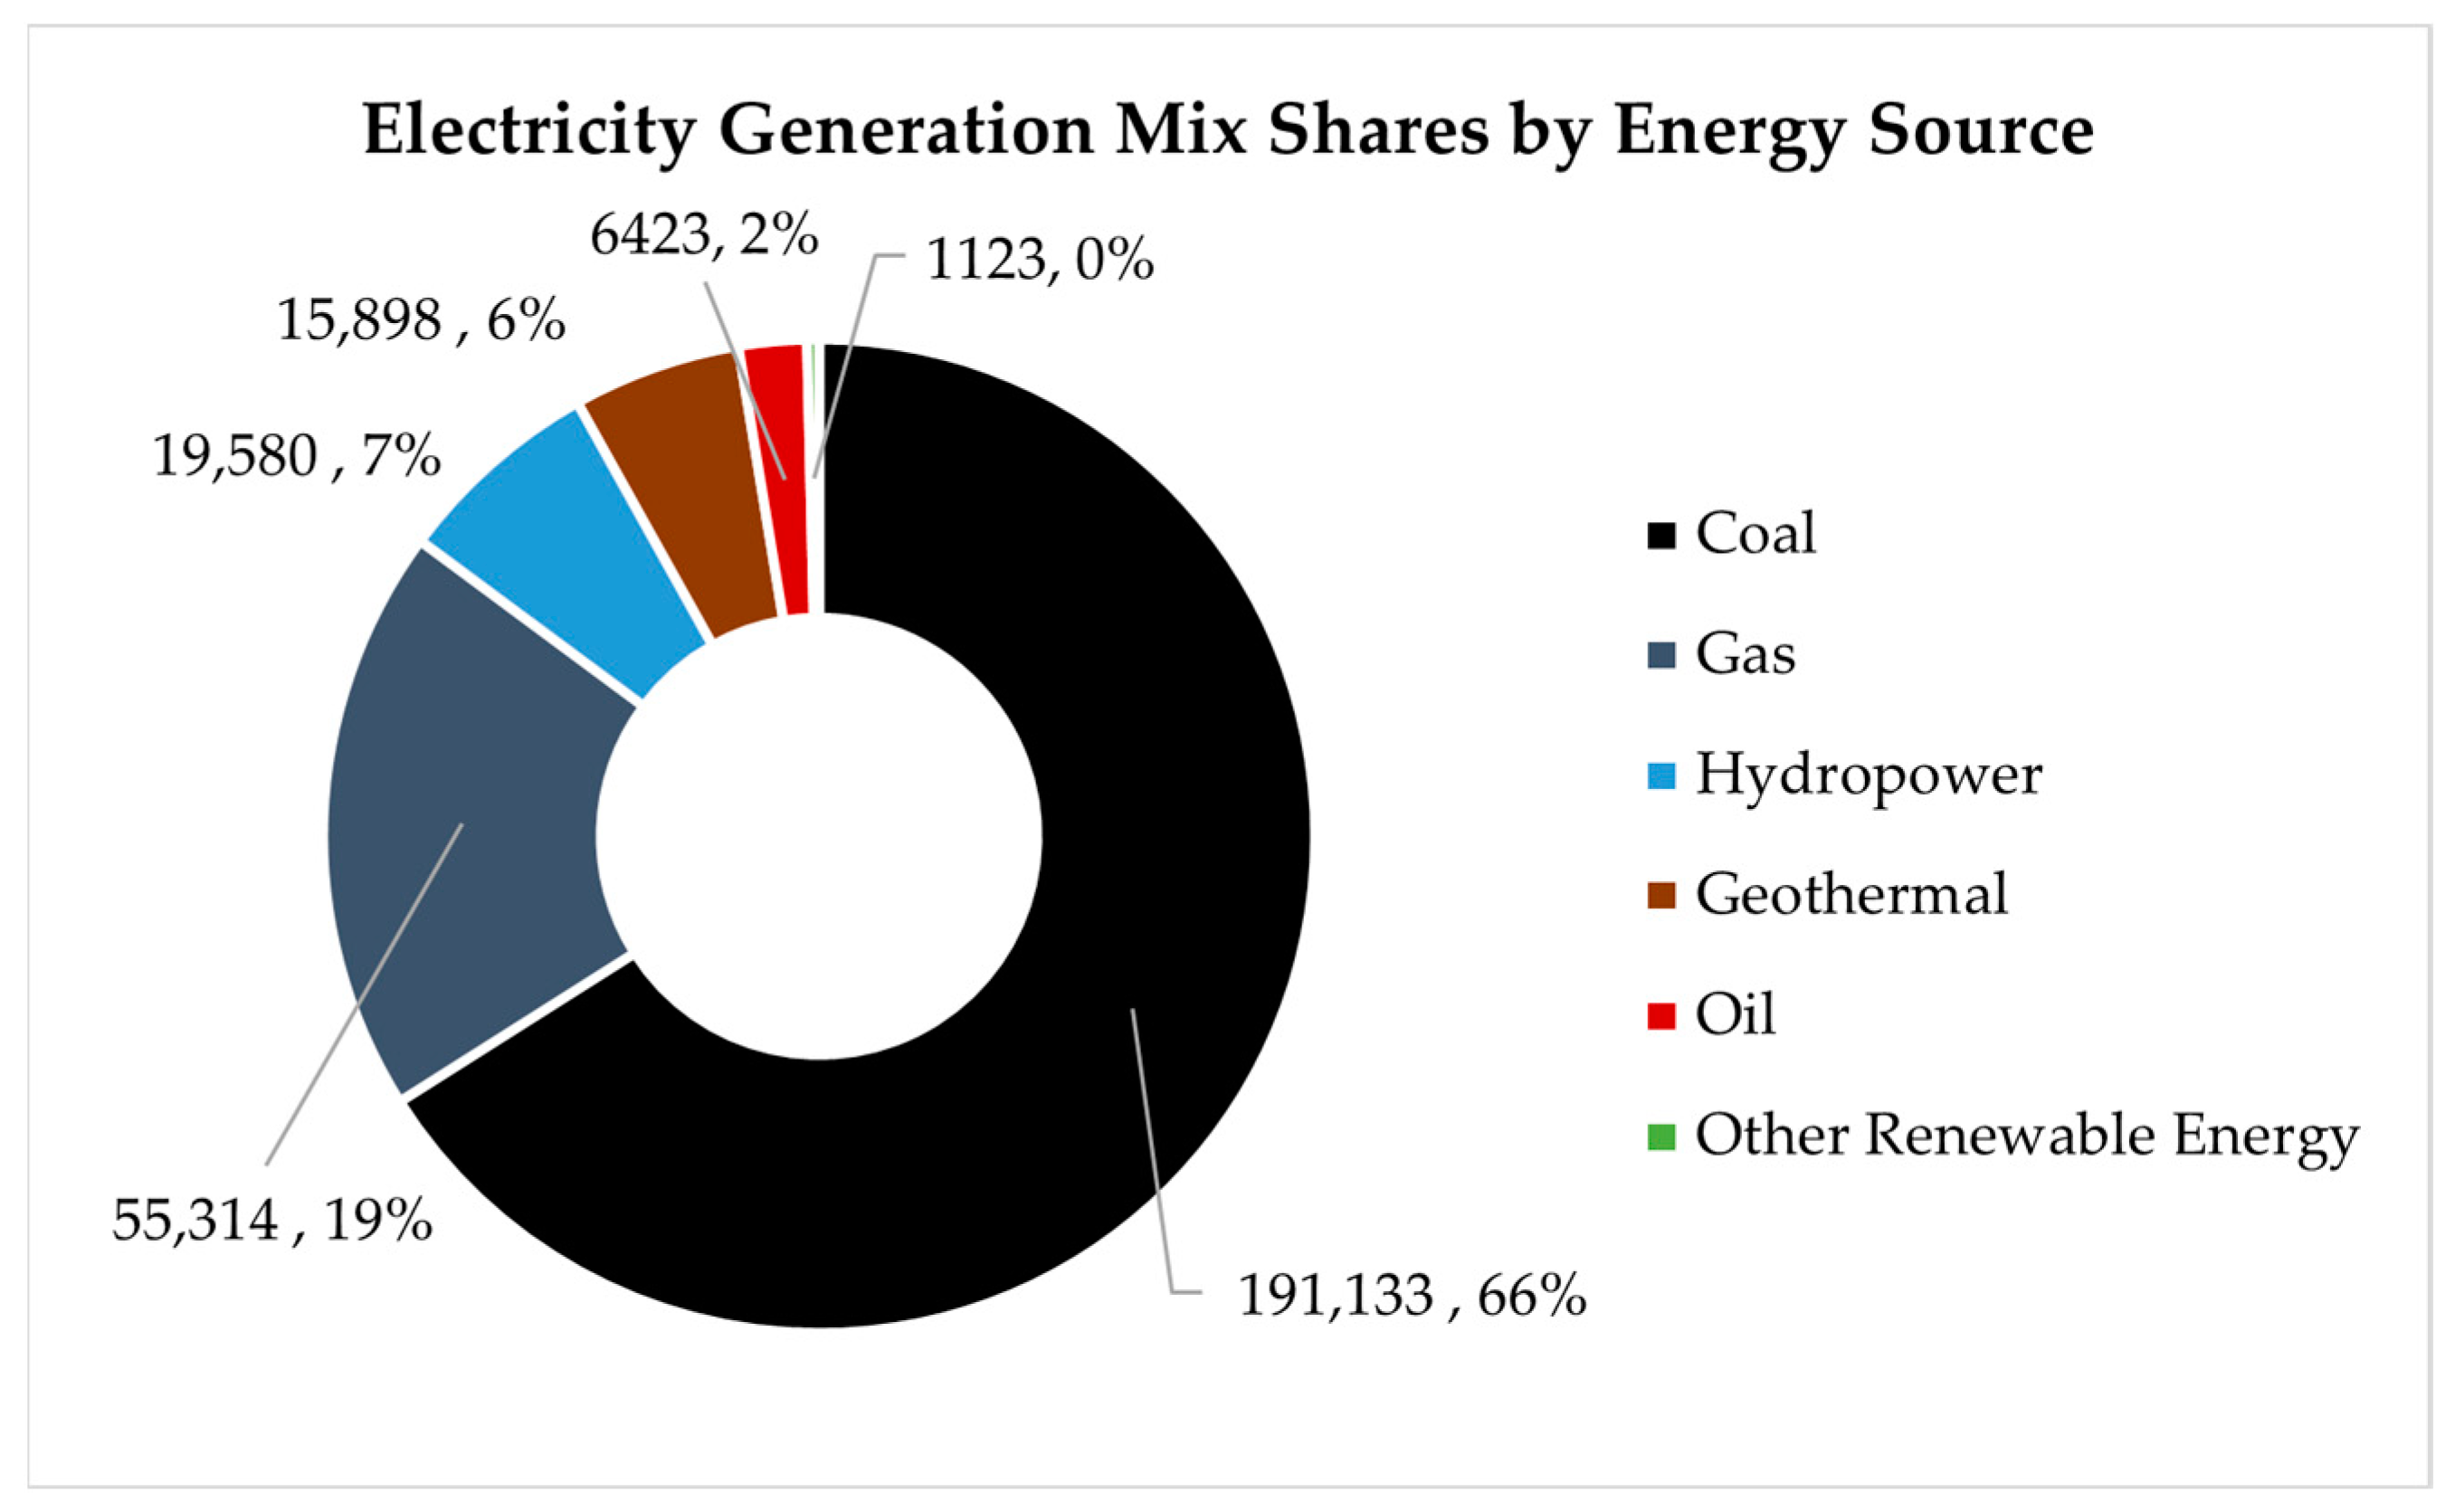
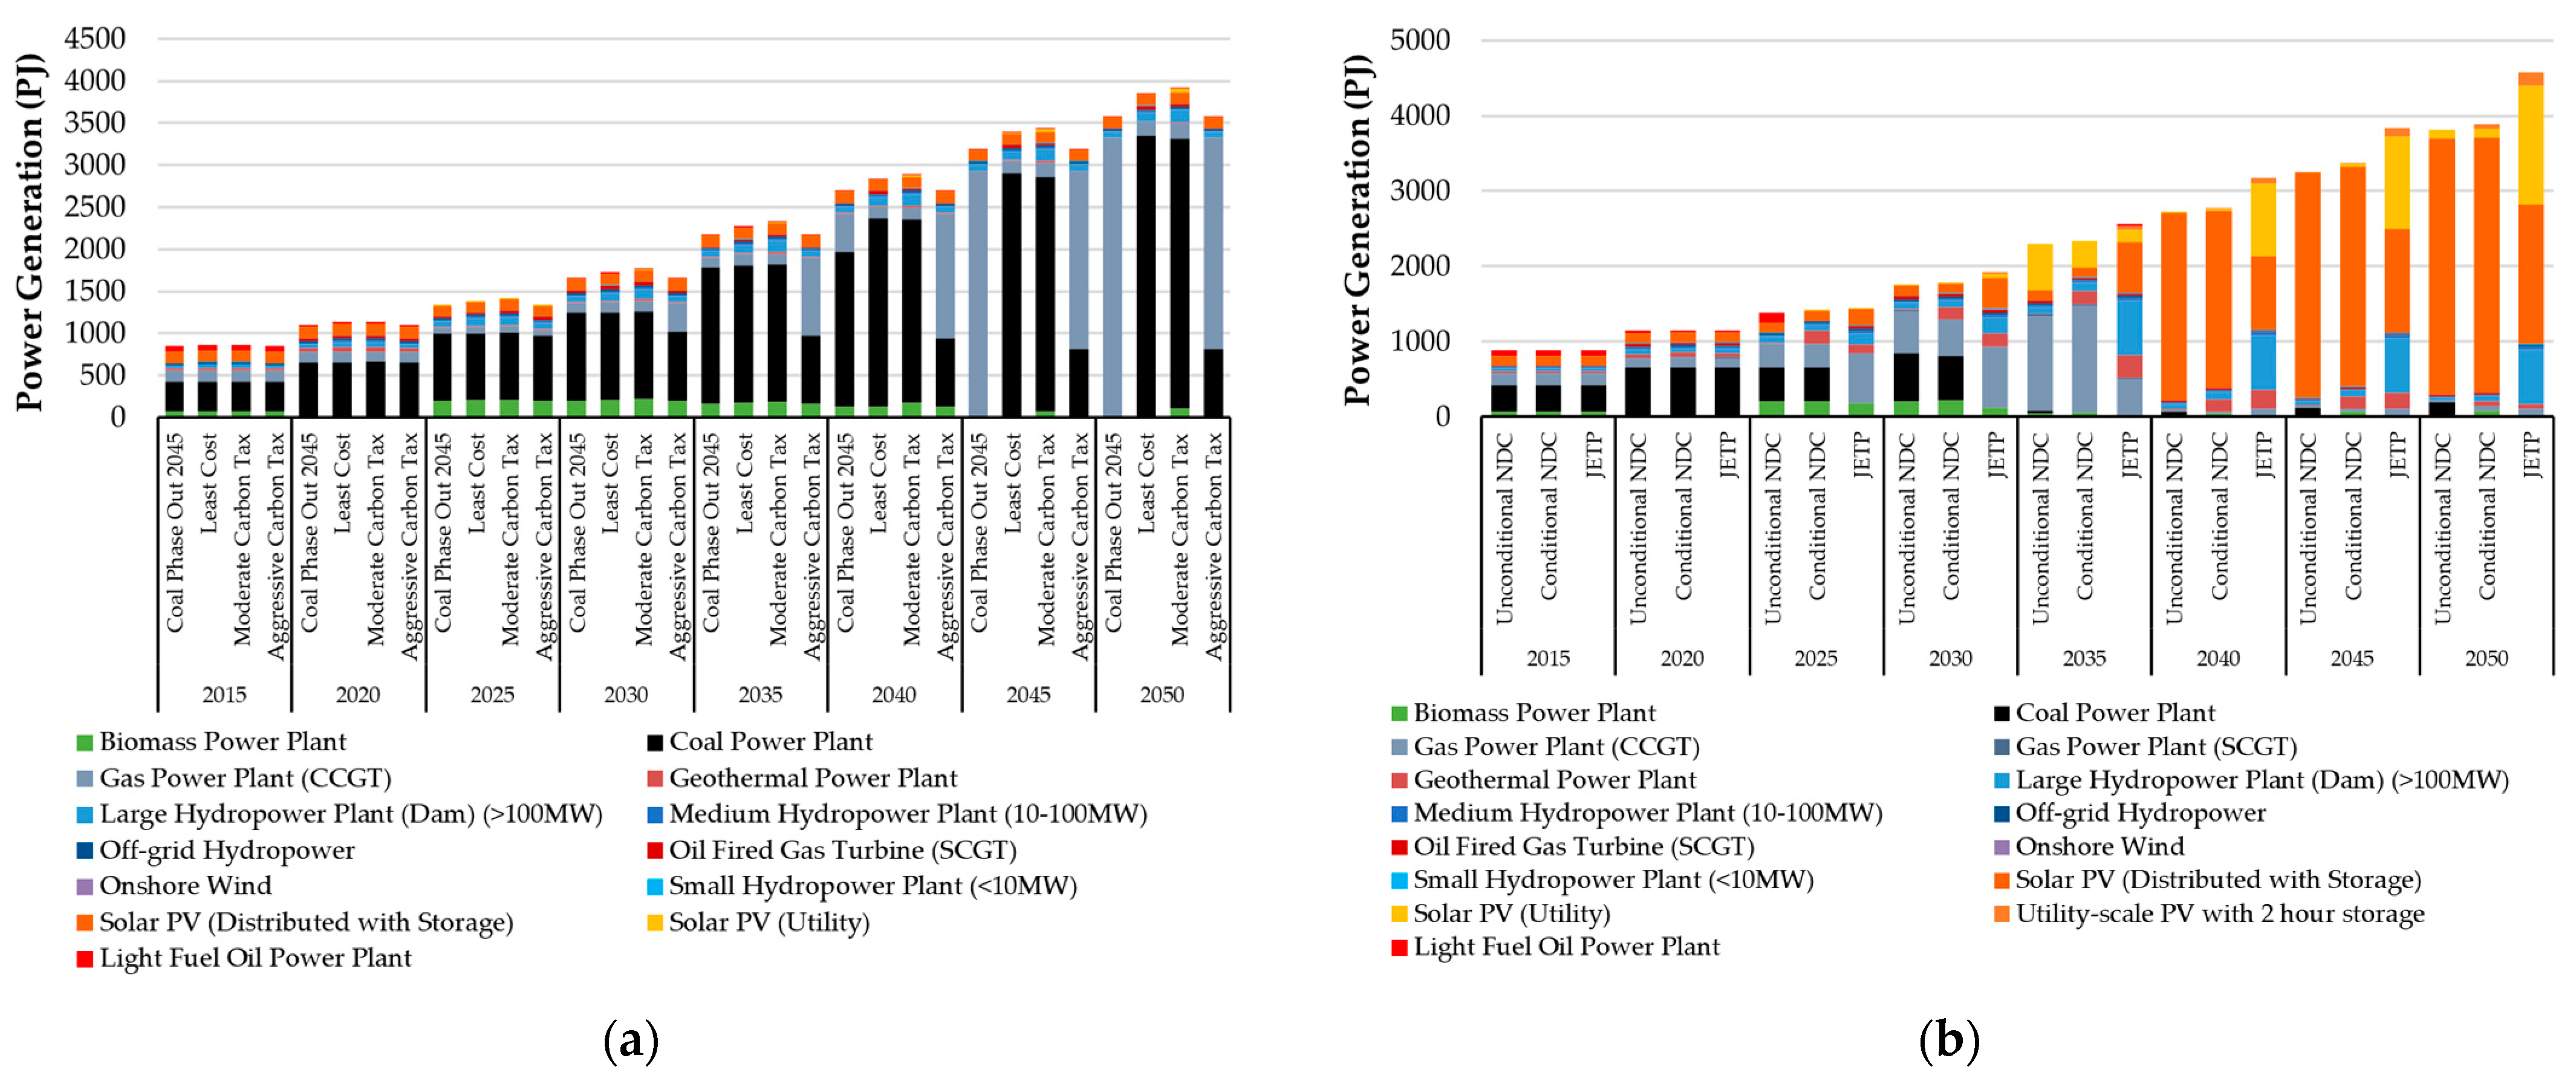
3.1. Electricity Generation

In the business-as-usual and moderate carbon tax scenario, electricity generation increases to almost 4000 PJ in 2050 and coal continues to be the predominant power source until the end of the modelling period. The variation in power generation across the scenarios may be due to the different constraints that affect the decision of energy efficiency or end-use electrification. Meanwhile, natural gas replaces coal as the main fuel source from 2040 in the aggressive carbon tax scenario and from 2045 in the Coal Phase-Out scenario. As the model investigates the least-cost alternative, it chooses a technology with the second lowest overall cost compared to the available fuel options, which, after coal, is natural gas. However, those scenarios alone are not able to meet the NDC and JETP target of 23% renewable energy by 2025, as illustrated on Figure 5a.
In Figure 5b, it is shown that the renewable energy mix target of NDC can be achieved by utilising 12% geothermal, 10% solar, and 7% hydro power in the electricity mix in 2025, then reaching 30% renewable energy by 2030. On the other hand, the renewable energy mix target of 2030 in the JETP scenario can be realised through 21% solar, 12% hydro, and 10% geothermal power. Thus, it can be concluded that Indonesia may have to invest hugely in solar technology as the current realisation is only 0.01% compared to its potential [48].
In the absence of coal phase-out constraints, coal generation can only be constant until 2050 with the adoption of a more aggressive carbon tax rate. Consequently, the reduction in coal generation to as low as 5% in the electricity mix in 2050 can be achieved through the implementation of NDCs and JETP scenarios. In the JETP scenario, the renewable energy share in the electricity mix increases from 34% in 2025 and 43% in 2030, to nearly 100% in 2050. The electricity generation diversifies to include geothermal power, solar power, hydropower, and under 1% of onshore wind technology (in 2030). In contrast, without intervention, coal technology is projected to expand and contribute to 88% of the electricity mix by 2050, which aligns with the study by Reyseliani and Purwanto (2021) of a baseline scenario [17].

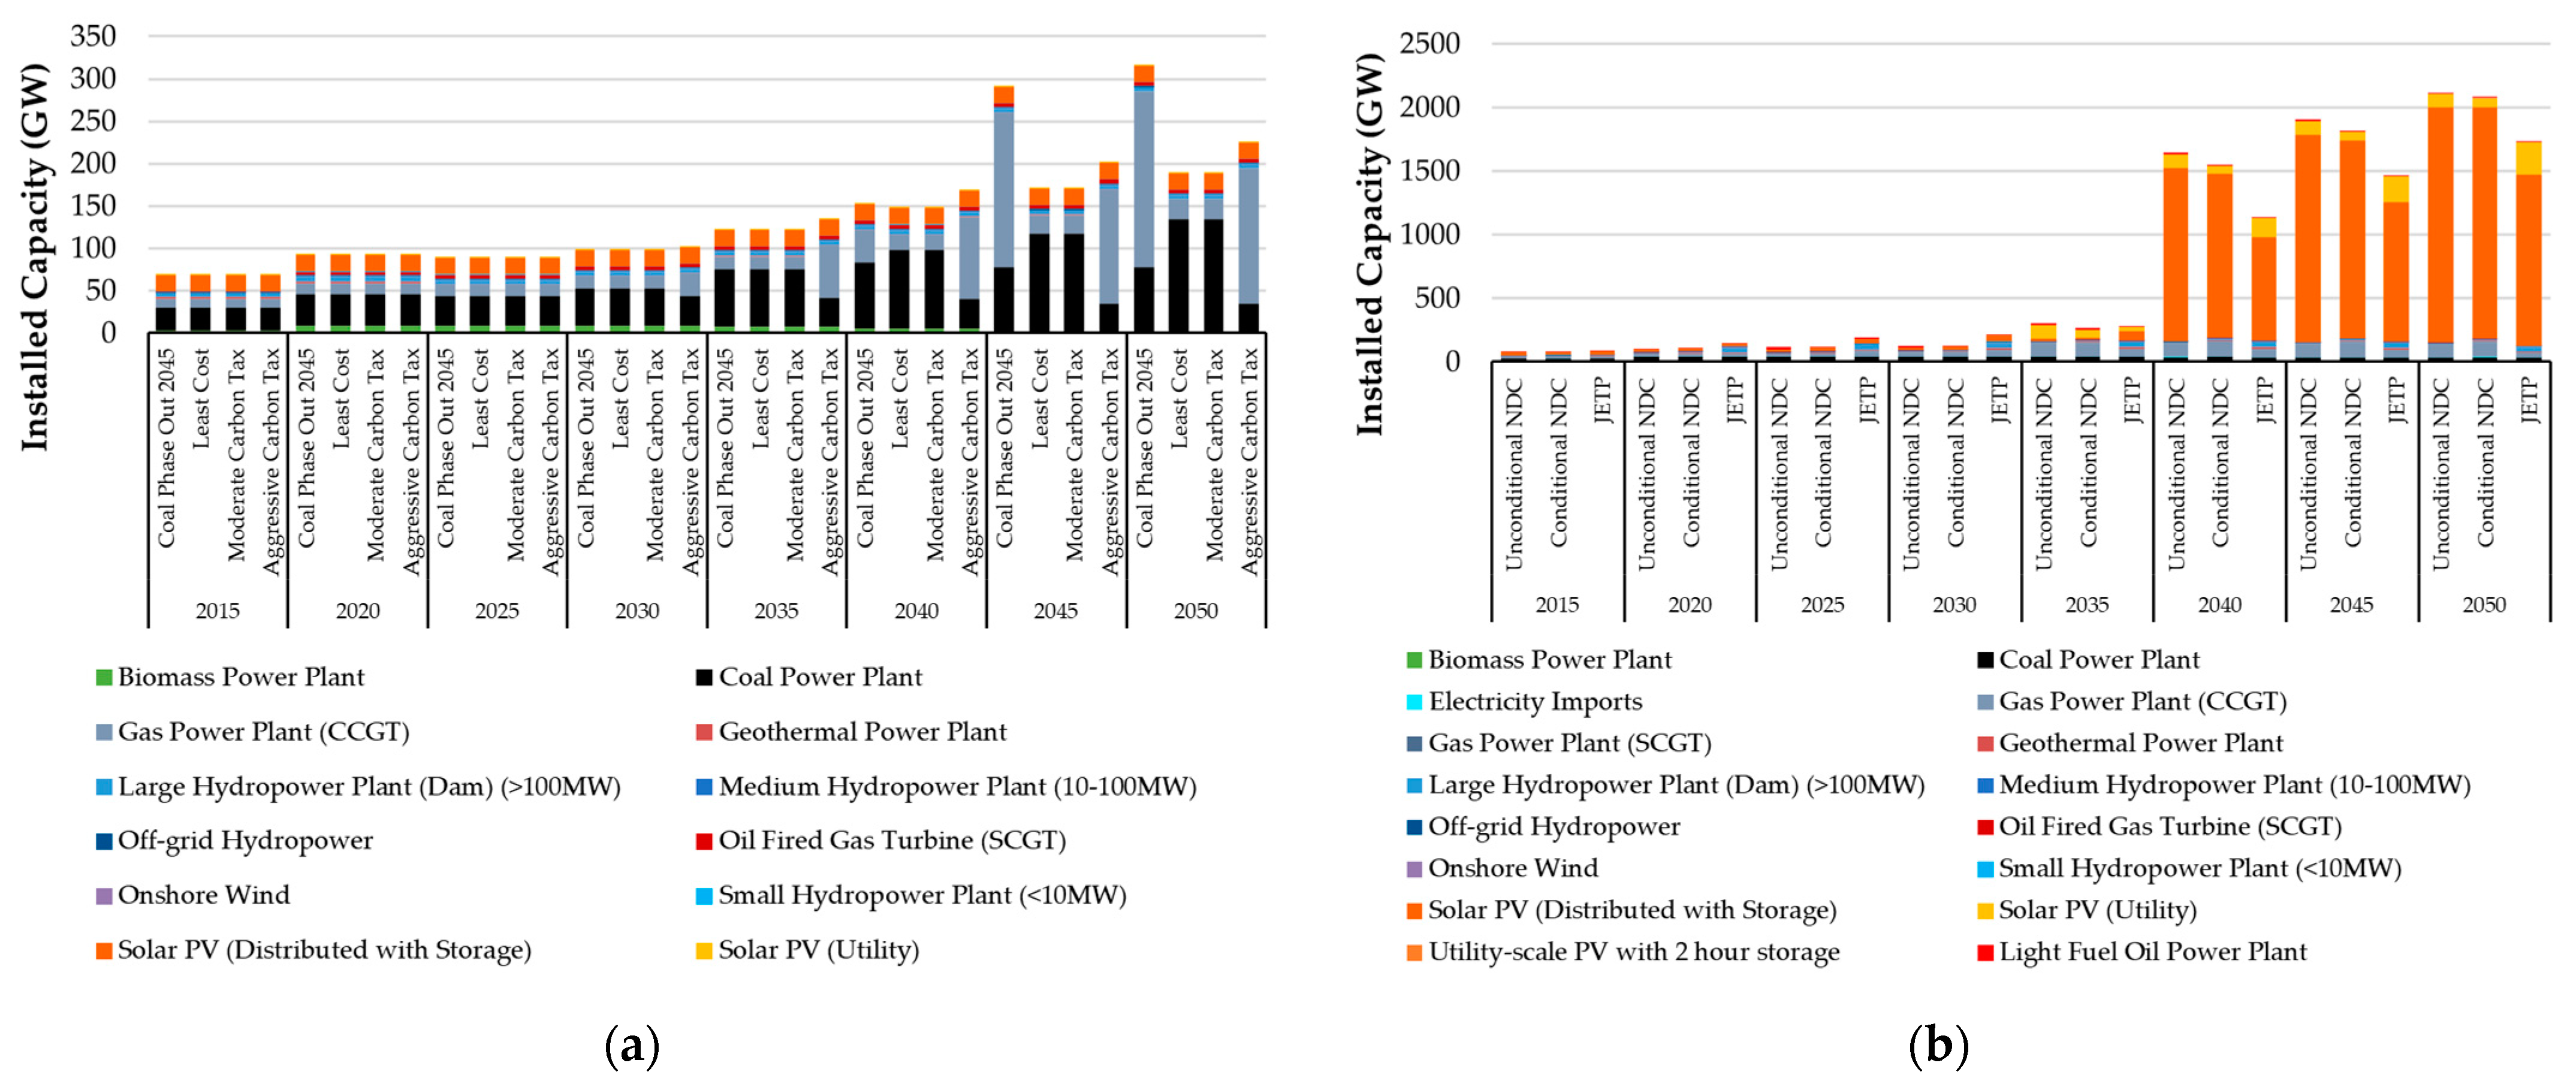
3.2. Installed Capacity

The total power generation capacity increases across all the scenarios, as illustrated on Figure 6, with the highest growth rate in the Aggressive Carbon Tax and Coal Phase-Out scenario. This growth spans from 13 GW in 2030 to 160 GW in 2050, driven by limitations of electricity generation from coal plants in 2045, and, as the alternative, a huge natural gas employment to meet the growing electricity demand. Yet, the highest coal capacity is evident in the Least Cost and Moderate Carbon Tax scenarios, peaking at 134 GW in 2050.
Solar PV with storage capacity maintains a consistent value of 19 GW throughout the modelling period in the Least Cost, Coal Phase Out, and Carbon Tax scenarios. In the NDC and JETP scenario, the model chooses solar technology as the alternative in achieving the targets when there is a constraint in electricity generation by CFPPs. Thus, the capacity of solar power increases significantly in 2040, dominating the electricity system and potentially serving as reserves for electricity generation. Solar technology’s prioritisation is likely influenced by Indonesia’s huge solar resource potential year-round, given its location along the equator. As for the Aggressive Carbon Tax scenario, the coal capacity remains constant from 2025, which implies that a more aggressive carbon tax rate may limit the capacity and investment for CFPPs.

3.3. CO2 Emissions

The Moderate Carbon Tax and Coal Phase-Out scenario has a similar emission result throughout the period with the Least Cost scenario, peaking at 2300 MtCO2 in 2050, the highest overall emissions compared to the other scenarios. This suggests that Indonesia’s proposed carbon tax rate will lead to an insignificant emission reduction, and a greater emission reduction can only be achieved with earlier CFPP retirement. On the contrary, implementing the Aggressive Carbon Tax scenario alone reduces the overall emissions by 13% compared to the Least Cost scenario, to around 1800 MtCO2 by 2050.
The NDC and JETP scenarios reduce the overall emissions by 55% and 52%, respectively, compared to the Least Cost scenario. In addition, both NDCs have similar emission results, representing the lowest overall emissions compared to the other scenarios and a rapid decrease from 2030 due to the net zero emissions constraint, as shown in Figure 7. Hence, further emission reduction may be achieved through adopting a similar approach and incorporating a net zero emissions target into the JETP objectives.

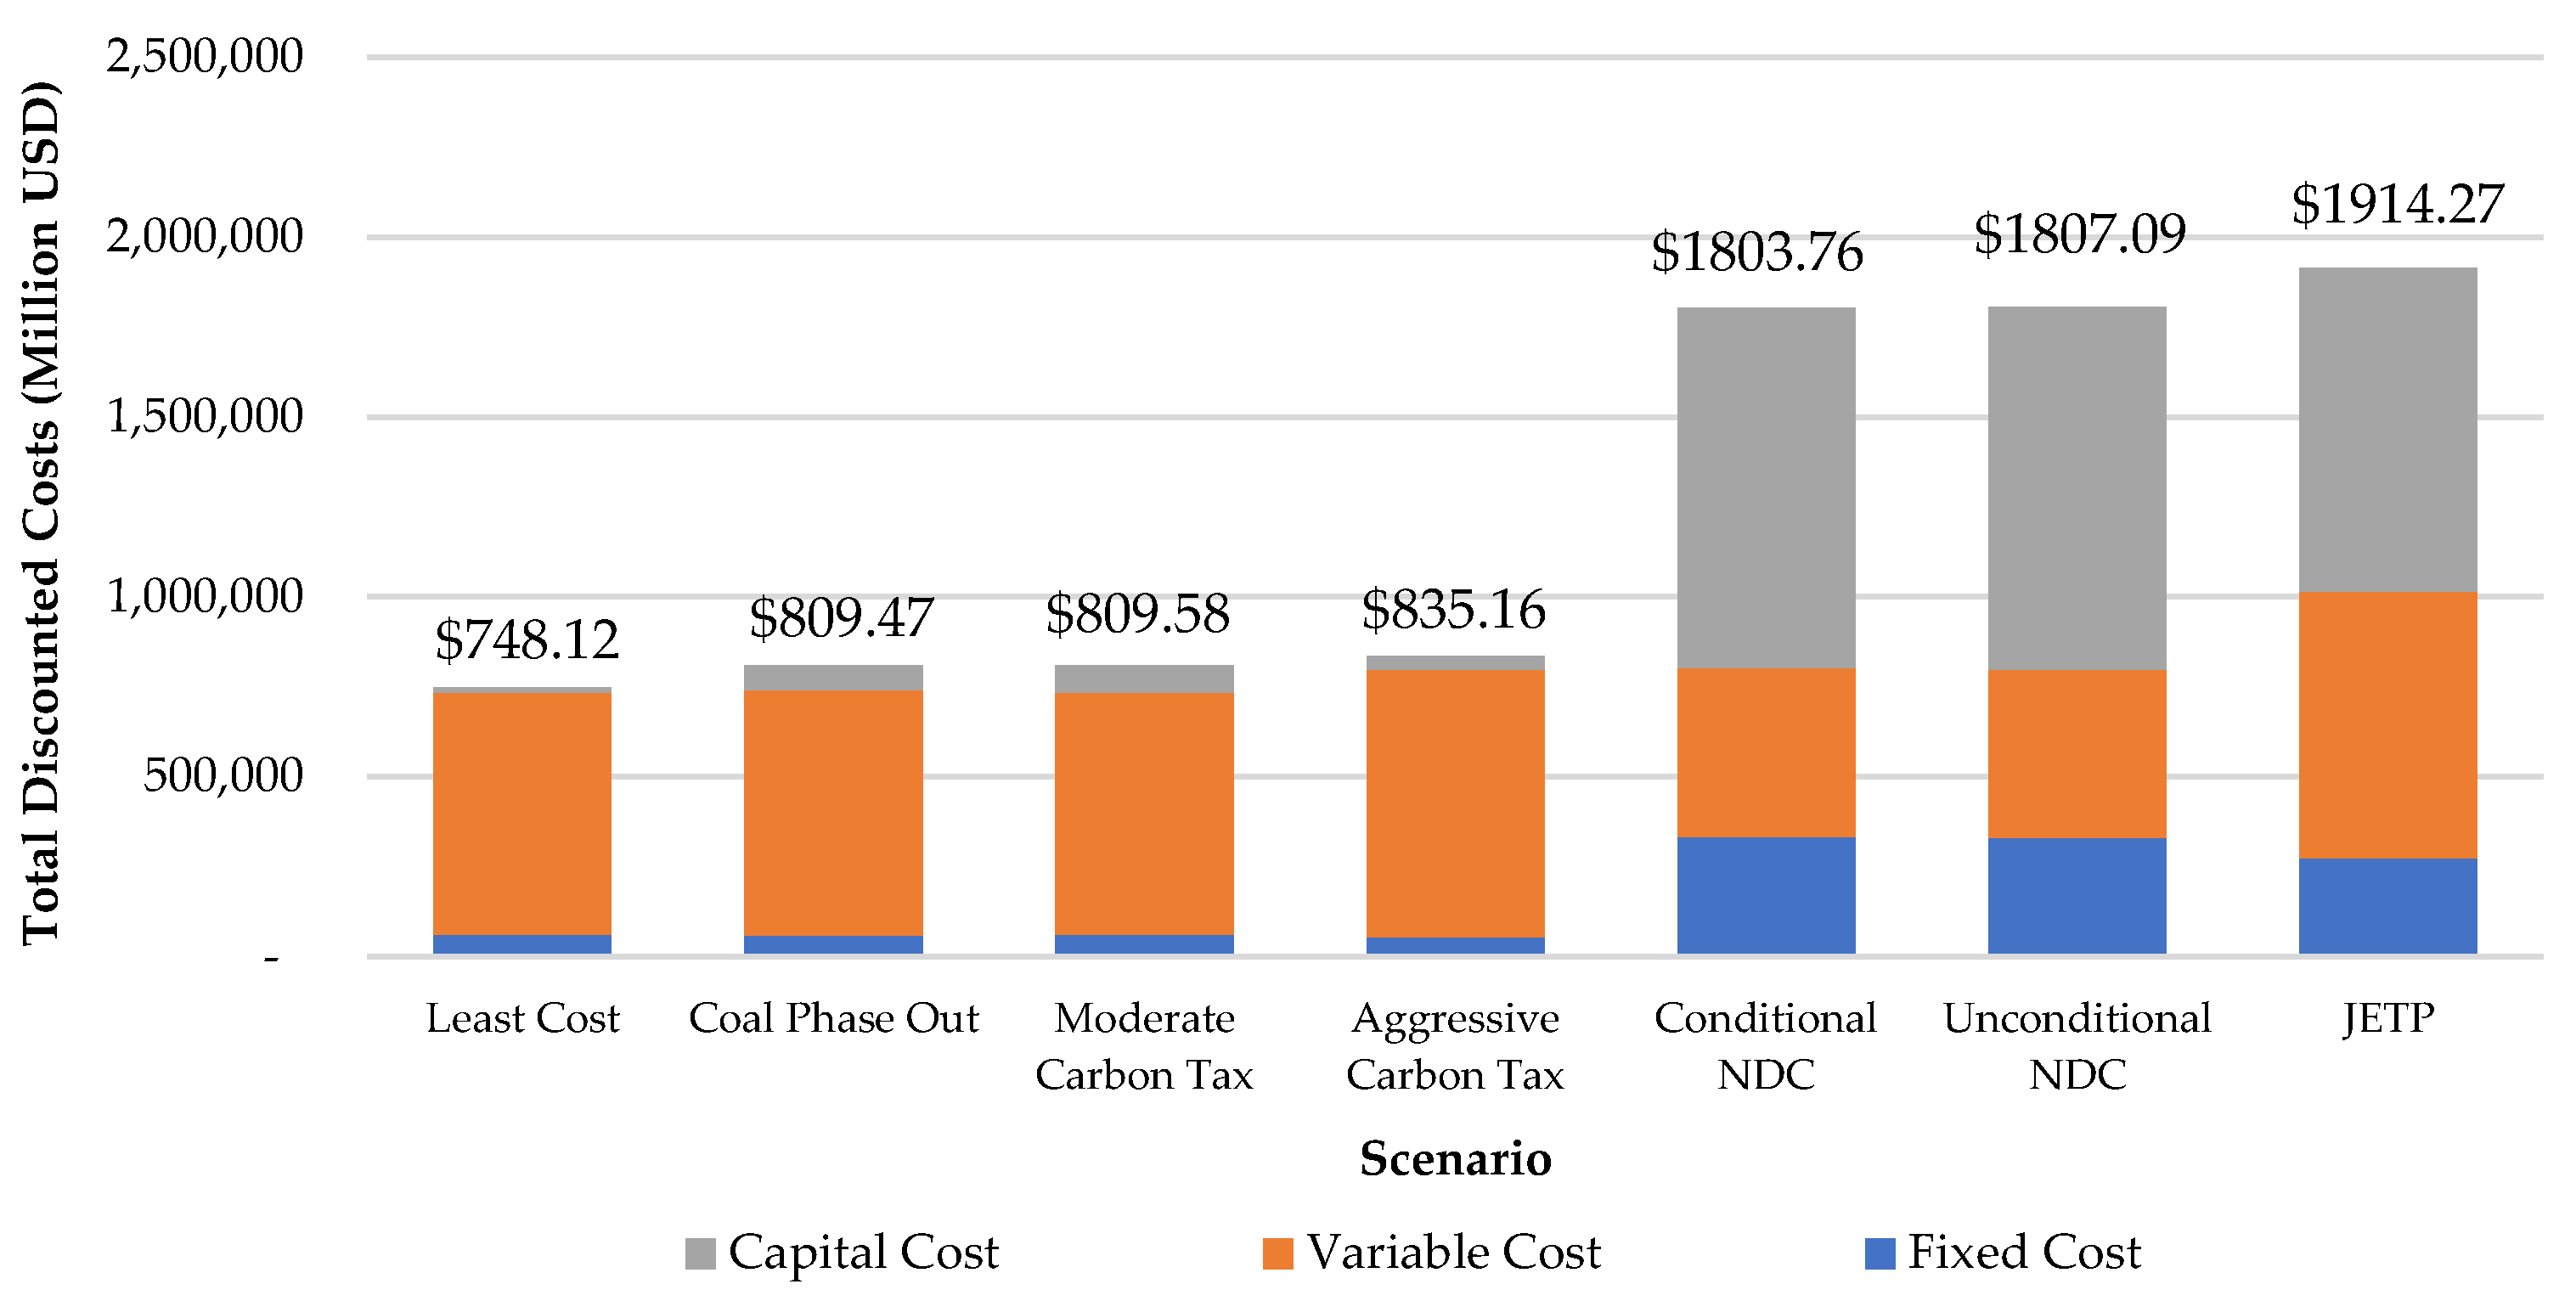
3.4. Investment and Cost

The Least Cost, Coal Phase-Out, and Carbon Tax scenarios that are still utilising fossil fuel power plants allocate 80% of the costs for variable parameters, owing to the fact that fuel cost is comparatively higher than implementing renewable energy technologies. On the contrary, adopting renewable energy may potentially lower the variable costs. The NDCs have the lowest variable cost compared to the other scenarios (USD 200 billion less than the Least Cost scenario) by adding the net zero emissions constraint and deploying huge renewable energy technologies in 2050.
In 2050, the allocation of 88% fixed operating costs in the Least Cost scenario is directed toward fossil fuel, a stark contrast to the 5% allocation in the JETP scenario. During the same period, the Aggressive Carbon Tax scenario exhibits the lowest fixed cost at USD 6 billion, presenting a notable difference of over USD 50 billion from the scenario with the highest fixed cost, the NDCs and JETP.
In the NDC and JETP scenarios, 50% of the cost accounts for the capital investment of cleaner energy, primarily allocated to develop solar technology. In addition, the overall cost is doubled compared to the Least Cost, Coal Phase-Out, and Carbon Tax scenarios. However, with the utmost goal of achieving a just energy transition, the development of renewable energy is crucial albeit requiring a huge capital cost to develop the technology and expand the capacity. Therefore, investment funds from the JETP play a vital role for Indonesia. Total cost of modelled scenarios is illustrated in Figure 8.

4. Discussion

Findings and Policy Insights

The main barrier to a just energy transition in Indonesia has been the country’s continued coal regime, with minimal efforts made to end it. Consequently, renewable energy technologies in Indonesia remain costly, making them non-competitive with fossil fuel prices. This is primarily attributed to the political barriers linked with the stable regime of fossil fuel-based energy, leading to huge fossil fuel subsidy, the reliance on imported fuel, the technical complexities of grid integration in this country with the archipelagic geographical situation, and perceptions of high risk.
The JETP targets included in the modelled scenario are renewable energy share, emission reduction, and the early retirement of CFPPs, in which 2035 is chosen as a more ambitious target compared to the Coal Phase-Out 2045 scenario. Despite excluding the net zero emissions target, this scenario achieves a 19% reduction in emissions by 2030 and a 52% reduction by 2050. Additionally, it surpasses the renewable energy share target, reaching 43% by 2030 (21% solar power, 12% hydropower, and 10% geothermal power).
Based on the modelling results, if the energy system is focused on the Least Cost scenario without adopting any additional decarbonisation measures, Indonesia will not achieve its NDC objectives for the power sector by 2030. In the Coal Phase-Out scenario, the findings show an increase in natural gas power generation and capacity, which is another fossil fuel energy source that also emits a high emission ratio. Furthermore, the model chooses renewable energy technologies, including solar power, geothermal power, and hydropower. This supports the insight from Handayani et al. (2022), Reyseliani et al. (2022), and PLN’s renewable energy targets of energy transition in Indonesia [51,52]. Particularly, solar technology with a huge storage capacity is deployed massively to meet the increasing demand, as stated in Reyseliani and Purwanto (2021) [17].
Solar technology, the biggest renewable energy source potential in Indonesia [48], accounts for almost 75% of the electricity mix in 2050 in the NDC and JETP scenarios. Both scenarios imply that switching to renewable energy technology would come at a significant capital cost—even the expenditure is double that of the Least Cost scenario. This emphasises the need for substantial investment. And with the JETP, Indonesia needs to accelerate and prioritise the adoption of renewable energy technologies in the short term.
In comparison to other countries, Indonesia’s proposed carbon tax rate (USD 1.98/tCO2e) is relatively lower than the global average. For instance, Japan sets it at USD 2.17/tCO2e, Singapore at USD 3.77/tCO2e, Denmark at USD 26.53/tCO2e, and Finland at USD 57.64/tCO2e [53]. This suggests that Indonesia has the potential to implement a more aggressive carbon tax rate. And by implementing Denmark’s carbon tax rate through scenario 4 (Aggressive Carbon Tax), it is evident that Indonesia may lower the emissions from the power sector by 13% in 2050. This may be levied in Indonesia as an additional measure of the existing decarbonisation targets.
Considering the broader effects of coal decommissioning on businesses, society, and the overall economy, it is pivotal to minimise expenditure and maximise emission reduction. Thus, three suggested short- and medium-term policies are as follows:
  • Early CFPP retirement through a policy-based closure, a strategy employed in successful extensive coal decommissioning practices in the UK and US [54]; such policy should be supported with cost-effective mechanisms (as it will drive social reforms, such as employment shift and fostering a significant transition to a green job revolution), compliance to just transition principles, reforming coal subsidies, and adopting a transparent governance system, the cancellation of CFPP construction, and repurposing existing CFPPs. Indonesia’s current CFPP early retirement plan (three CFPPs with a total capacity of 1 GW by 2030 and a coal phase-out in 2050) [55] is insufficient to reach net zero emissions by 2050. And despite requiring the substantial expense of redevelopment and demolition, opting for early CFPP retirement is a more reasonable choice, especially when considering the long-term consequences of owning a stranded asset.
  • Levy a more ambitious carbon tax rate: As Denmark’s rate (USD 26.53/tCO2e) is estimated to successfully lower emissions by 13% by 2050, which aligns with Hartono et al.’s (2023) suggestion of a USD 28.88/tCO2e carbon tax rate in Indonesia [56]. Moreover, interventions on the macroeconomic scale will be crucial for the success of the transition [57]. Although implementing carbon pricing may have drawbacks on other sectors such as consumption and employment, this should be implemented alongside increased investments in the expansion of renewable energy technologies.
  • Accelerate investment in solar technology and storage infrastructure: Powering beyond coal would necessitate a dependable and secure energy supply to fulfil the demand. Indonesia’s vast renewable energy potential should serve as the backbone of this transition. Because of its geographical condition as an archipelagic nation, Indonesia has to ratify supporting regulations and allocate funds to enhance grid connectivity, ensure grid stability and flexibility, and also expand battery storage capacity to further maximise solar power’s enormous potential throughout the year. Other research [32] supports this notion, recommending government prioritisation in the short term to prevent larger expenditures in the future. Furthermore, this policy may initiate a multiplier effect on investment and encourage behavioural change for a just energy transition.

5. Conclusions

Through a cost-optimisation energy modelling tool in achieving NDC and JETP targets, this study models several decarbonisation and energy transition scenarios to lower Indonesia’s dependence on fossil fuel and to achieve net zero emissions by 2050 or sooner. The scenarios are Least Cost, Coal Phase-Out, Carbon Tax, NDC, and JETP.
With the Least Cost and Moderate Carbon Tax scenario producing a similar overall analysis result, a more aggressive carbon tax rate should be levied. The assessed tax rate (USD 26.53/tCO2e) may reduce carbon emissions by 13% by 2050. Furthermore, the Coal Phase-Out scenario resulted in a similar renewable energy percentage in the electricity mix as the Least Cost and Carbon Tax scenarios, with an addition of significant natural gas generation starting from 2045 as the substitute to coal. In terms of cost, the NDC and JETP scenarios are more costly than the other scenarios due to the huge capital cost required for replacing coal with renewable energy technologies, exceeding the Least Cost scenario’s cost by approximately USD 1.1 trillion.
With a least-cost approach, the model produces an ideal electricity mix of the JETP scenario in 2030 as follows: 48% natural gas, 21% solar, 12% hydropower, 10% geothermal, 7% biomass, 2% oil, and 0.03% onshore wind. Meanwhile, the proposed electricity mix in 2050 includes 76% solar, 20% hydropower, 3% natural gas, and 1% geothermal. Thus, this study emphasises the future potential of solar power, geothermal power, and hydropower deployment with the integration between transmission grids, considering Indonesia’s enormous renewable energy potentials in different islands and regions.
The analysis and comparison of the various results indicates that achieving Indonesia’s NDC and JETP targets necessitates significant investments in renewable energy technologies which will eventually replace existing fossil fuel technologies. Despite that, maintaining the investment in fossil fuel technologies also requires a huge operational and maintenance cost. Thus, investment funds from the JETP and a comprehensive just energy transition plan and framework are crucial. To conclude, the suggested key emission reduction pathways for Indonesia include implementing an aggressive carbon tax rate, accelerating coal phase out, and prioritising solar technology investment.
Predicting the future costs, prices, and societal acceptance of new and renewable technologies is a complex task. Due to being a highly evolving sector, the modelling conclusion in this study, which is based on existing regulations, might change in the future. Future research on power transmission grids, other off-grid power plants, social cost, and sensitivity and flexibility analyses of the energy system impacted by the energy transition in Indonesia may be incorporated to address the limitations of this study.

Limitations and Opportunities for Further Research

This study acknowledges several limitations and opportunities for future research. Firstly, this study refers to power generation in Indonesia as a whole country and does not consider various transmission grids and several off-grid power plants, despite the archipelagic location of Indonesia. And with the focus of the study being the power sector, it does not include an analysis of other sectors such as transportation. Secondly, as the JETP initiative in Indonesia is an evolving area, this study only considers current targets. With the limitation of the software to produce a feasible model result relative to the net zero target, the JETP scenario in this study does not include a net zero constraint.
Thirdly, this study updates the techno-economic data from national institutions such as the MEMR and National Energy Agency of Indonesia to provide more precise, accurate, and consistent data instead of generic data from international agencies. Lastly, flexibility and sensitivity analyses are not conducted in this study, yet future studies may incorporate energy system flexibility analysis using additional open-source tools, such as FlexTool. Moreover, a social cost analysis may provide additional insights into just energy transition impacts in Indonesia.

Author Contributions

Conceptualization, L.D.H.; methodology, L.D.H.; formal analysis, L.D.H.; investigation, L.D.H.; data curation, L.D.H.; writing—original draft preparation, L.D.H.; writing—review and editing, L.D.H., R.Y., C.C., M.H., F.P.-N., S.O.-O. and Y.K.; supervision, M.H. and Y.K.; project administration, R.Y. All authors have read and agreed to the published version of the manuscript.

Funding

For this research, CCG contributed to funding the time dedication of the co-authors for the production of this material, and CCG funded the publishing fees associated with the publishing of this material (APC). Climate Compatible Growth (CCG) is a UK aid-funded project which aims to support investment in sustainable energy and transport systems to meet development priorities in the Global South.

Data Availability Statement

The data and model code used for this study are fully accessible and licensed under the MIT license. This data is available at Zenodo repository [46].

Acknowledgments

This material has been produced under the Climate Compatible Growth (CCG) programme, which brings together leading research organizations and is led out of the STEER centre, Loughborough University. CCG contributed by funding the time dedication of the co-authors for the production of this material, and CCG funded the publishing fees associated with the publishing of this material. CCG is funded by the Foreign, Commonwealth and Development Office (FCDO) of the UK government. However, the views expressed herein do not necessarily reflect the UK government’s official policies.

Conflicts of Interest

The authors declare no conflicts of interest.

U4RIA Compliance Statement

This work follows the U4RIA guidelines which provide a set of high-level goals relating to conducting energy system analyses in countries. This paper was carried out involving stakeholders in the development of models, assumptions, scenarios, and results (Ubuntu/Community). The authors ensure that all data, source code, and results can be easily found, accessed, downloaded, and viewed (retrievability), licensed for reuse (reusability), and that the modelling process can be repeated in an automatic way (repeatability). The authors provide complete metadata for reconstructing the modelling process (reconstructability), ensuring the transfer of data, assumptions, and results to other projects, analyses, and models (interoperability), and facilitating peer review through transparency (auditability).

References

  1. OECD. Active with Indonesia, France. 2019. Available online: https://www.oecd.org/indonesia/Active-with-Indonesia.pdf (accessed on 1 August 2023).
  2. PLN. Rencana Usaha Penyediaan Tenaga Listrik (RUPTL) PT PLN–National Electricity Supply Business Plan of 2021–2030, PLN (State Electricity Company), Jakarta. 2021. Available online: https://web.pln.co.id/statics/uploads/2021/10/ruptl-2021-2030.pdf (accessed on 1 August 2023).
  3. IEA. An Energy Sector Roadmap to Net Zero Emissions in Indonesia, IEA Publications, International Energy Agency, France. 2022. Available online: https://iea.blob.core.windows.net/assets/b496b141-8c3b-47fc-adb2-90740eb0b3b8/AnEnergySectorRoadmaptoNetZeroEmissionsinIndonesia.pdf (accessed on 1 August 2023).
  4. Hamdi, E.; Adhiguna, P. Indonesia Wants to Go Greener, but PLN Is Stuck with Excess Capacity from Coal-Fired Power Plants; Institute for Energy Economics and Financial Analysis: Cleveland, OH, USA, 2021; Available online: https://ieefa.org/sites/default/files/resources/Indonesia-Wants-to-Go-Greener-but-PLN-Is-Stuck-With-Excess-Capacity_November-2021.pdf (accessed on 1 August 2023).
  5. MEMR. Handbook of Energy and Economic Statistics of Indonesia; Ministry of Energy and Mineral Resources: Jakarta, Indonesia, 2022; Available online: https://www.esdm.go.id/assets/media/content/content-handbook-of-energy-and-economic-statistics-of-indonesia-2021.pdf (accessed on 1 August 2023).
  6. BPS. Energy Balances of Indonesia 2017–2021; BPS-Statistics: Indonesia, Jakarta, 2023; Available online: https://www.bps.go.id/id/publication/2023/02/07/3e4c4125bdafee25433e3da0/neraca-energi-indonesia-2017-2021.html (accessed on 1 August 2023).
  7. Rahman, A.; Dargusch, P.; Wadley, D. The political economy of oil supply in Indonesia and the implications for renewable energy development. Renew. Sustain. Energy Rev. 2021, 144, 111027. [Google Scholar] [CrossRef]
  8. Ichsan, M.; Lockwood, M.; Ramadhani, M. National oil companies and fossil fuel subsidy regimes in transition: The case of Indonesia. Extr. Ind. Soc. 2022, 11, 101104. [Google Scholar] [CrossRef]
  9. Ordonez, J.A.; Jakob, M.; Steckel, J.C.; Fünfgeld, A. Fünfgeld, Coal, power and coal-powered politics in Indonesia. Environ. Sci. Policy 2021, 123, 44–57. [Google Scholar] [CrossRef]
  10. MEF. Laporan Inventarisasi Gas Rumah Kaca (GRK) dan Monitoring, Pelaporan, dan Verifikasi (MPV)–Inventory Report of GHG and MRV; Ministry of Environment and Forestry: Jakarta, Indonesia, 2022; Available online: https://signsmart.menlhk.go.id/v2.1/app/frontend/pedoman/detail/44 (accessed on 1 August 2023).
  11. Tran, H.M.; Tsai, F.-J.; Lee, Y.-L.; Chang, J.-H.; Chang, L.-T.; Chang, T.-Y.; Chung, K.F.; Kuo, H.-P.; Lee, K.-Y.; Chuang, K.-J.; et al. The impact of air pollution on respiratory diseases in an era of climate change: A review of the current evidence. Sci. Total. Environ. 2023, 898, 166340. [Google Scholar] [CrossRef] [PubMed]
  12. Rokhmawati, A.; Sugiyono, A.; Efni, Y.; Wasnury, R. Quantifying social costs of coal-fired power plant generation. Geogr. Sustain. 2023, 4, 39–48. [Google Scholar] [CrossRef]
  13. JakartaPost. False Pollution Solutions. 2023. Available online: https://www.thejakartapost.com/opinion/2023/08/19/false-pollution-solutions.html (accessed on 1 August 2023).
  14. Muthiariny, D.E.; Arkyasa, M. Air Pollution Top 5 Causes of Death in Indonesia, Says Expert. 2023. Available online: https://en.tempo.co/read/1764100/air-pollution-top-5-causes-of-death-in-indonesia-says-expert# (accessed on 1 August 2023).
  15. Sarjiya, R.F.; Setya Budi, L. Putra Multanto, Achieving New and Renewable Energy Target: A Case Study of Java-Bali Power System, Indonesia; IEEE: Piscataway, NJ, USA, 2020; pp. 560–565. [Google Scholar] [CrossRef]
  16. Gupta, K. Techno-Economic Analysis of Implementing Energy-Efficiency and Alternative Fuels in Indonesia Using OSeMOSYS; KTH Royal Institute of Technology: Stockholm, Sweden, 2020; Available online: https://www.diva-portal.org/smash/get/diva2:1466950/FULLTEXT01.pdf (accessed on 1 August 2023).
  17. Reyseliani, N.; Purwanto, W.W. Pathway towards 100% renewable energy in Indonesia power system by 2050. Renew. Energy 2021, 176, 305–321. [Google Scholar] [CrossRef]
  18. Paiboonsin, P.; Oluleye, G.; Yeganyan, R.; Tan, N.; Cannone, C.; Howells, M. Pathways to clean energy transition in Indonesia’s electricity sector with OSeMOSYS modelling (Open-Source Energy Modelling System). Energies. 2024, 17, 75–93. [Google Scholar] [CrossRef]
  19. World Bank. Just Transition For All: The World Bank Group’s Support to Countries Transitioning away from Coal. 2023. Available online: https://www.worldbank.org/en/topic/extractiveindustries/justtransition (accessed on 30 July 2023).
  20. UNDP. How Just Transition Can Help Deliver the Paris Agreement, New York. 2022. Available online: https://climatepromise.undp.org/sites/default/files/research_report_document/Just%20Transition%20Report%20Jan%2020.pdf (accessed on 1 August 2023).
  21. Commission, E. The Just Transition Mechanism: Making Sure No One Is Left Behind: The European Green Deal; European Commission: Brussels, Belgium, 2020. [Google Scholar] [CrossRef]
  22. Babayomi, O.O.; Dahoro, D.A.; Zhang, Z. Affordable clean energy transition in developing countries: Pathways and technologies. iScience 2022, 25, 104178. [Google Scholar] [CrossRef]
  23. IISD. Making the Leap: The Need for Just Energy Transition Partnerships to Support Leapfrogging Fossil Gas to a Clean Renewable Energy Future; International Institute for Sustainable Development (IISD): Winnipeg, MB, Canada, 2022; Available online: https://www.iisd.org/system/files/2022-11/just-energy-transition-partnerships.pdf (accessed on 1 August 2023).
  24. Colenbrander, S.; Gouldson, A.; Sudmant, A.H. Papargyropoulou, The economic case for low-carbon development in rapidly growing developing world cities: A case study of Palembang, Indonesia. Energy Policy 2015, 80, 24–35. [Google Scholar] [CrossRef]
  25. Sambodo, M.T.; Yuliana, C.I.; Hidayat, S.; Novandra, R.; Handoyo, F.W.; Farandy, A.R.; Inayah, I.; Yuniarti, P.I. Breaking barriers to low-carbon development in Indonesia: Deployment of renewable energy. Heliyon 2022, 8, e09304. [Google Scholar] [CrossRef]
  26. Simarmata, H.A.; Dimastanto, A.; Santoso, S.I.; Kalsuma, D. Institutional Barriers of Low Carbon Development Planning in Indonesian Small Cities. Low Carbon Econ. 2014, 5, 105–116. [Google Scholar] [CrossRef]
  27. Marquardt, J. A Struggle of Multi-level Governance: Promoting Renewable Energy in Indonesia. Energy Procedia 2014, 58, 87–94. [Google Scholar] [CrossRef]
  28. Ordonez, J.A.; Fritz, M.; Eckstein, J. Coal vs. renewables: Least-cost optimization of the Indonesian power sector. Energy Sustain. Dev. 2022, 68, 350–363. [Google Scholar] [CrossRef]
  29. Ministry of Finance of Indonesia. Informasi APBN 2023 (Annual State Budget Spending 2023); Ministry of Finance of Indonesia: Jakarta, Indonesia, 2023; Available online: https://media.kemenkeu.go.id/getmedia/6439fa59-b28e-412d-adf5-e02fdd9e7f68/Informasi-APBN-TA-2023.pdf?ext=.pdf (accessed on 1 August 2023).
  30. Sekaringtias, A.; Verrier, B.; Cronin, J. Untangling the socio-political knots: A systems view on Indonesia’s inclusive energy transitions. Energy Res. Soc. Sci. 2023, 95, 102911. [Google Scholar] [CrossRef]
  31. Rahman, A.; Richards, R.; Dargusch, P.; Wadley, D. Pathways to reduce Indonesia’s dependence on oil and achieve longer-term decarbonization. Renew. Energy 2023, 202, 1305–1323. [Google Scholar] [CrossRef]
  32. Maulidia, M.; Dargusch, P.; Ashworth, P.; Ardiansyah, F. Rethinking renewable energy targets and electricity sector reform in Indonesia: A private sector perspective. Energy Rev. 2019, 101, 231–247. [Google Scholar] [CrossRef]
  33. Tanoto, Y.; Haghdadi, N.; Bruce, A.; MacGill, I. Reliability-cost trade-offs for electricity industry planning with high variable renewable energy penetrations in emerging economies: A case study of Indonesia’s Java-Bali grid. Energy 2021, 227, 120474. [Google Scholar] [CrossRef]
  34. Sumarsono, N.; Wahyuni, S.; Sudhartio, L. A paradigm shift of energy sources: Critical review on competitive dynamics of solar PV industry in Indonesia. Renew. Energy Focus 2022, 41, 236–245. [Google Scholar] [CrossRef]
  35. ILO. ILO Brief: Green Jobs and Just Transition Policy Readiness Assessment in the Energy Sector in Indonesia; International Labour Organization: Bangkok, Thailand, 2023; Available online: https://www.ilo.org/wcmsp5/groups/public/---asia/---ro-bangkok/documents/briefingnote/wcms_873081.pdf (accessed on 1 August 2023).
  36. Republic of Indonesia. Enhanced Nationally Determined Contribution Republic of Indonesia, UNFCCC, 2022. Available online: https://unfccc.int/sites/default/files/NDC/2022-09/23.09.2022_Enhanced%20NDC%20Indonesia.pdf (accessed on 1 August 2023).
  37. Singh, R.R.; Clarke, R.M.; Chadee, X.T. A just energy transition for a hydrocarbon rich SIDS. Energy 2023, 279, 128069. [Google Scholar] [CrossRef]
  38. Bazilian, M.; Rice, A.; Rotich, J.; Howells, M.; DeCarolis, J.; Macmillan, S.; Brooks, C.; Bauer, F.; Liebreich, M. Open source software and crowdsourcing for energy analysis. Energy Policy 2012, 49, 149–153. [Google Scholar] [CrossRef]
  39. Godínez-Zamora, G.; Victor-Gallardo, L.; Angulo-Paniagua, J.; Ramos, E.; Howells, M.; Usher, W.; De León, F.; Meza, A.; Quirós-Tortós, J. Decarbonising the transport and energy sectors: Technical feasibility and socioeconomic impacts in Costa Rica. Energy Strat. Rev. 2020, 32, 100573. [Google Scholar] [CrossRef]
  40. Howells, M.; Rogner, H.; Strachan, N.; Heaps, C.; Huntington, H.; Kypreos, S.; Hughes, A.; Silveira, S.; DeCarolis, J.; Bazillian, M.; et al. OSeMOSYS: The Open Source Energy Modeling System: An introduction to its ethos, structure and development. Energy Policy 2011, 39, 5850–5870. [Google Scholar] [CrossRef]
  41. Welsch, M.; Howells, M.; Bazilian, M.; DeCarolis, J.F.; Hermann, S.; Rogner, H.H. Modelling elements of Smart Grids–Enhancing the OSeMOSYS (Open Source Energy Modelling System) code. Energy 2012, 46, 337–350. [Google Scholar] [CrossRef]
  42. Howells, M.; Quiros-Tortos, J.; Morrison, R.; Rogner, H.; Godínez, G.; Angulo, J.; Ramos, E.; Gardumi, F.; Hülk, L. Energy system analytics and good governance-U4RIA goals of Energy Modelling for Policy Support. 2021; preprint. [Google Scholar] [CrossRef]
  43. Bank of Indonesia. BI 7-Day (Reverse) Repo Rate. 2023. Available online: https://www.bi.go.id/en/statistik/indikator/bi-7day-rr.aspx (accessed on 30 July 2023).
  44. Paiboonsin, P. OSeMOSYS Base SAND Kit: Indonesia. [Data set]. Zenodo 2023. [Google Scholar] [CrossRef]
  45. Ministry of Energy and Mineral Resources, Embassy of Denmark in Jakarta, Ea Energy. Analyses, Danish Energy Agency, Technology Data for the Indonesian Power Sector–Catalogue for Generation and Storage of Electricity, Ministry of Energy and Mineral Resources. 2021. Available online: https://ens.dk/sites/ens.dk/files/Globalcooperation/technology_data_for_the_indonesian_power_sector_-_final.pdf (accessed on 1 August 2023).
  46. Hersaputri, L.D. Techno-Economic Dataset for Energy System Modelling in Indonesia (v1.0), [Data set]. Zenodo 2023. [Google Scholar] [CrossRef]
  47. ADB. Sustainable Infrastructure Assistance Program: Technical Assistance for Energy RPJMN 2015–2019 (Energy Sector White Paper); Asian Development Bank: Mandaluyong, Philippines; Available online: https://www.adb.org/sites/default/files/project-documents//ino-energy-white-paper.pdf (accessed on 1 August 2023).
  48. DEN. Indonesia Energy Outlook 2022, Indonesia’s National Energy Council, Jakarta. 2022. Available online: https://den.go.id/publikasi/indonesia-energy-outlook (accessed on 1 August 2023).
  49. ERPS. Briefing: EU Progress on Climate Action–How Are the Member States Doing? ERPS–European Parliamentary Research Service: Brussels, Belgium, 2021; Available online: https://www.europarl.europa.eu/RegData/etudes/BRIE/2021/679106/EPRS_BRI(2021)679106_EN.pdf (accessed on 1 August 2023).
  50. JETP Indonesia. Just Energy Transition Partnership Indonesia: Comprehensive Investment and Policy Plan 2023; JETP Indonesia: Jakarta, Indonesia, 2023; Available online: https://jetp-id.org/storage/official-jetp-cipp-2023-vshare_f_en-1700532655.pdf (accessed on 10 December 2023).
  51. Handayani, K.; Anugrah, P.; Goembira, F.; Overland, I.; Suryadi, B.; Swandaru, A. Moving beyond the NDCs: ASEAN pathways to a net-zero emissions power sector in 2050. Appl. Energy 2022, 311, 118580. [Google Scholar] [CrossRef]
  52. Reyseliani, N.; Hidayatno, A.; Purwanto, W.W. Implication of the Paris agreement target on Indonesia electricity sector transition to 2050 using TIMES model. Energy Policy 2022, 169, 113184. [Google Scholar] [CrossRef]
  53. World Bank. Carbon Pricing Dashboard. 2023. Available online: https://carbonpricingdashboard.worldbank.org/map_data (accessed on 1 August 2023).
  54. Srinivasan, S.; Chattopadhyay, D.; Govindarajalu, C.; Zabidin, I. Business models for accelerating phase-out of coal based generation: Developing typologies and a discussion of the relative merits of alternative models. Energy Policy 2022, 35, 107185. [Google Scholar] [CrossRef]
  55. Ministry of Finance of Indonesia. CIF Accelerating Coal Transition (ACT): Indonesia Country Investment Plan (IP); Fiscal Policy Agency–Ministry of Finance of Indonesia: Jakarta, Indonesia, 2022; Available online: https://fiskal.kemenkeu.go.id/docs/CIF-INDONESIA_ACT_IP-Proposal.pdf (accessed on 1 August 2023).
  56. Hartono, D.; Indriyani, W.; Iryani, B.S.; Komarulzaman, A.; Nugroho, A.; Kurniawan, R. Carbon tax, energy policy, and sustainable development in Indonesia. Sustain. Dev. 2023, 31, 2332. [Google Scholar] [CrossRef]
  57. Chattopadhyay, D.; Bazilian, M.D.; Handler, B.; Govindarajalu, C. Accelerating the coal transition. Electr. J. 2021, 34, 106906. [Google Scholar] [CrossRef]
Figure 1. Electricity generation mix shares by energy source, 2021 (GWh, %) [6].
Climate 12 00037 g001
Figure 2. Share of supply of primary energy, 2011–2021 (%) [5].
Climate 12 00037 g002
Figure 3. Functional ‘blocks’ for OSeMOSYS implementation [40].
Climate 12 00037 g003
Figure 4. Reference energy system of Indonesia.
Climate 12 00037 g004
Figure 5. Annual electricity generation, 2015–2050 (pj). (a) Least cost, coal phase out, and carbon tax scenarios; (b) NDC and JETP scenarios.
Climate 12 00037 g005
Figure 6. Power plant capacity, 2015–2050 (gw). (a) Least cost, coal phase out, and carbon tax scenarios; (b) NDC and JETP scenarios.
Climate 12 00037 g006
Figure 7. Annual CO2 emissions of modelled scenarios, 2015–2050 (MtCO2).
Climate 12 00037 g007
Figure 8. Total discounted costs of modelled scenarios, 2015–2050 (Million USD).
Climate 12 00037 g008
Table 1. Total electricity demand between 2015 and 2050, with 5-year interval (PJ) [44].
Demand20152020202520302035204020452050
Electricity Demand777.911005.421206.801525.292000.872484.822952.493329.43
Table 2. Techno-economic data of technologies in Indonesia [44,45].
TechnologyCapital Cost (USD/kW)Fixed Cost (2020) (USD/kW/year)Variable Cost (2020) (USD/kWh)Efficiency (%)Lifetime (Years)
202020302050
Coal15301480143047.72.493030
CCGT69066061023.52.625525
SCGT77073068023.22.623425
Biomass20001820160047.603825
Geothermal45003870320057.50N/A30
Diesel80080078086.624025
Utility-scale Solar PV79056041014.40N/A35
Large Hydropower20802000185037.70N/A50
Medium Hydropower22902200204041.90N/A50
Small Hydropower270025902400530N/A50
Onshore Wind150012801080600N/A27
Offshore Wind13002980252072.60N/A27
Nuclear Power55005500550013803360
Utility-scale PV with 2 h Storage1869107981218.690N/A30
Onshore Wind with Storage24661737146398.650N/A30
Diesel with Standalone Generator (1 kW)150015001500386.624220
Solar PV (Distributed with Storage)21301756162642.620N/A41
Off-grid Hydropower21622100205564.860N/A40
Table 3. Total renewable energy potential and realisation [48].
Renewable EnergyPotential (GW)Realisation (GW)
Geothermal23.92.3
Bioenergy56.92.3
Wind154.90.2
Hydropower956.6
Solar32940.2
Disclaimer/Publisher’s Note: The statements, opinions and data contained in all publications are solely those of the individual author(s) and contributor(s) and not of MDPI and/or the editor(s). MDPI and/or the editor(s) disclaim responsibility for any injury to people or property resulting from any ideas, methods, instructions or products referred to in the content.

