1. Introduction
The prevalence of agricultural drought-induced food insecurity and overlapping vulnerability of livelihoods among livestock farmers in the drylands of South Africa is widely reported in the literature [
1,
2,
3]. This has continuously pushed research toward analyzing the significant drivers of food insecurities at various levels and scales in these contexts. In this vain, numerous models and approaches, including econometric modeling, a social network analysis and structural equation modeling, were adopted by scientists to explain the patterns of coping strategies [
2,
3,
4]. However, the lessons from these findings have focused on the broader lenses of resilience, coping and adaptation, while missing the integrated analysis of the social, economic and institutional pillars of coping with agricultural drought-induced food insecurity [
5,
6,
7,
8,
9]. Quandt [
10] reports that little research has been carried out on the diversity of agricultural drought-induced food insecurity coping strategies among smallholder farmers from two critical perspectives. These include the statistics and information on the status of indexed diversity and the fundamental drivers of coping strategies diversity, which is key in designing appropriate food insecurity coping strategies for small-scale farmers under drought conditions. This scantiness of information has increased the smallholder farmers’ vulnerability as they fail to prepare for, cope with and recover from agricultural drought-induced food insecurity exposure.
According to Onyeneke et al. [
11], coping shapes resilience, which refers to the agile propensity to respond to dynamic situational burdens. This is important in stressful situations such as agricultural droughts, where traditional strategies, depending on social networks and government food aid, are usually compromised. In light of persistent livelihood shocks, it is essential to consider the variance in coping responses among communities and households. As a starting point, this needs to be aligned with multidimensional concepts and long-term resilience. For example, Bahta [
1] analyzed the coping strategies adopted by smallholder livestock farmers during agricultural drought scenarios in the drylands of South Africa. The results pointed toward the disposal of livestock as the dominant coping strategy, followed by several options, including support from family and government aid. In his study, diversity was defined as the total weighted number of coping strategies used by the household against agricultural droughts. The analysis missed the need to explore the extent of the diversity of these coping strategies among farming households from an index that captures the community-wide coping mechanisms. Durrani et al. [
12] also presented a similar definition of diversity. They, thus, did not directly acknowledge the relationship between the diversity of coping strategies and the potential resilience emanating from the interaction of these strategies at the household and community levels. This is particularly important for Frances Baard district municipality’s rural communities in the Northern Cape province of South Africa, where social cohesion defines coping strategy. This paper bridges this gap and adopts a diversity index encompassing household and community dimensions in determining appropriate coping strategies for managing agricultural droughts in the drylands of South Africa.
Most research (e.g., Myeki et al. [
13]; Von Maltitz et al. [
14]) views resilience as the panacea to the challenges faced by rural farming communities, since they conceive of resilience as a set of binding arrangements. This is problematic (though critical) in that this analysis does not present any predominance patterns for particular coping strategies concerning developmental uncertainties. The concepts of diversity and evenness analysis can help deal with these shortfalls where the latter refers to the spread of particular coping strategies used by the communities and households to manage food insecurity shocks caused by agricultural droughts. This study argues that the core of food security decisions should not be entirely based on the individual decision maker’s coping responses. The community coping strategies basket from which individual strategies are drawn should also be considered as a central component in modeling the ability to cope. Therefore, the fundamental question remains as to how farmers select specific coping strategies in isolation or combination, thus, constructing a diversity package. At this stage, it is essential to acknowledge that these coping strategies need not be analyzed in isolation, since they are not practically mutually exclusive. This question, in turn, can be answered only from a developmental point of view, which embraces the indexed diversity dimension of agricultural food insecurity risks, as suggested in this study.
In the traditional literature, the core processes and competencies associated with resilience are mainly perceived to be the key foundation of coping with vulnerabilities. Worryingly, guided by this view, it is assumed that the individual’s resilience is entirely responsible for recovery from or completely avoiding undesirable outcomes from unfavorable conditions. Durrani et al. [
12] argue that, without resilience, these risky conditions would cause maladaptive developmental pathways. Accordingly, Maltou and Bahta [
15] proposed a conceptualization of resilience as a mix that presents a fit between farm-specific resources (e.g., capacities and attributes), social conditions (e.g., the extent of social support) and developmental challenges (e.g., food insecurity). This perspective, however, suggests some classified distinctions between the concepts of resilience and coping. This is further supported by Onyeneke et al. [
11]. They explored the resilience conditions and the associated contribution to sustainability using the orientation of farmer-adopted strategies targeted at addressing climate-change-induced risks.
The other researchers seemed to miss the observation determined by Caldwell and Boyd [
16], who related coping and resilience under drought conditions and concluded that these concepts were related and difficult to isolate. Their opinions, among others, posit coping from the angle of individual processes, triggering more complex and dynamic interactions under community-wide conditions. However, the more contemporary definition of coping, as presented by Riptanti et al. [
17], is anchored more on processes and not the traditional cooperative competencies through which individual decision makers manage uncertain conditions such as drought-induced food security. This study shifts from this conventional analysis into a significant milestone for coping research, since it determines a fundamental peculiarity between problem- and emotion-focused coping strategies in households and communities. This is the currently missing focus in coping and resilience studies; this study intends to bridge this gap. Due to these observations, this study measures the diversity of coping strategies. It identifies the driving factors for this diversity matrix using survey data from the Northern Cape Province in South Africa. In this regard, two fundamental questions are answered as to what factors affect the diversity of food insecurity coping strategies and whether farmers with a more diverse set of food security strategies experience less food insecurity.
2. Materials and Methods
This section highlights how the study was conducted. A study area description presents the context of the agricultural drought conditions and the associated food insecurity coping strategies. The sampling, data collection and analysis methods are also presented.
2.1. Study Site Description
The Northern Cape province of South Africa is situated in the northwest region of South Africa at 29.0467° S, 21.8569° E, with the highest altitude of 2156 m [
18]. It shares international borders with Botswana and Namibia, local borders with the Western and Eastern Cape provinces in the south and the Free State and Northwest provinces in the east. The Northern Cape Province experiences extreme temperature weather conditions, averaging 17.4 °C, and the lowest annual rainfall of 20 mm on the west to approximately 300 mm on the east. The province is prone to prolonged droughts, making it challenging to sustain agriculture-based livelihoods, especially given the limited availability of ground water resources during the driest periods in the summer period. This reduces the likelihood of utilizing the available ground water resources for irrigated agriculture due to the high cost of extraction and pumping. The region’s dry climate is accompanied by extreme evaporation due to the extreme heat, especially during the summer when the temperature peaks at 40 °C [
19]. This exposes the dominant water bodies that are used by livestock farmers to rapid depletion and exposure to extreme water shortages. The province is also characterized by the smallest population, accounting for only 2% of the country’s population, and the least population density of 2 persons/km
2.
Interestingly, the province’s total surface area of approximately 361,830 km
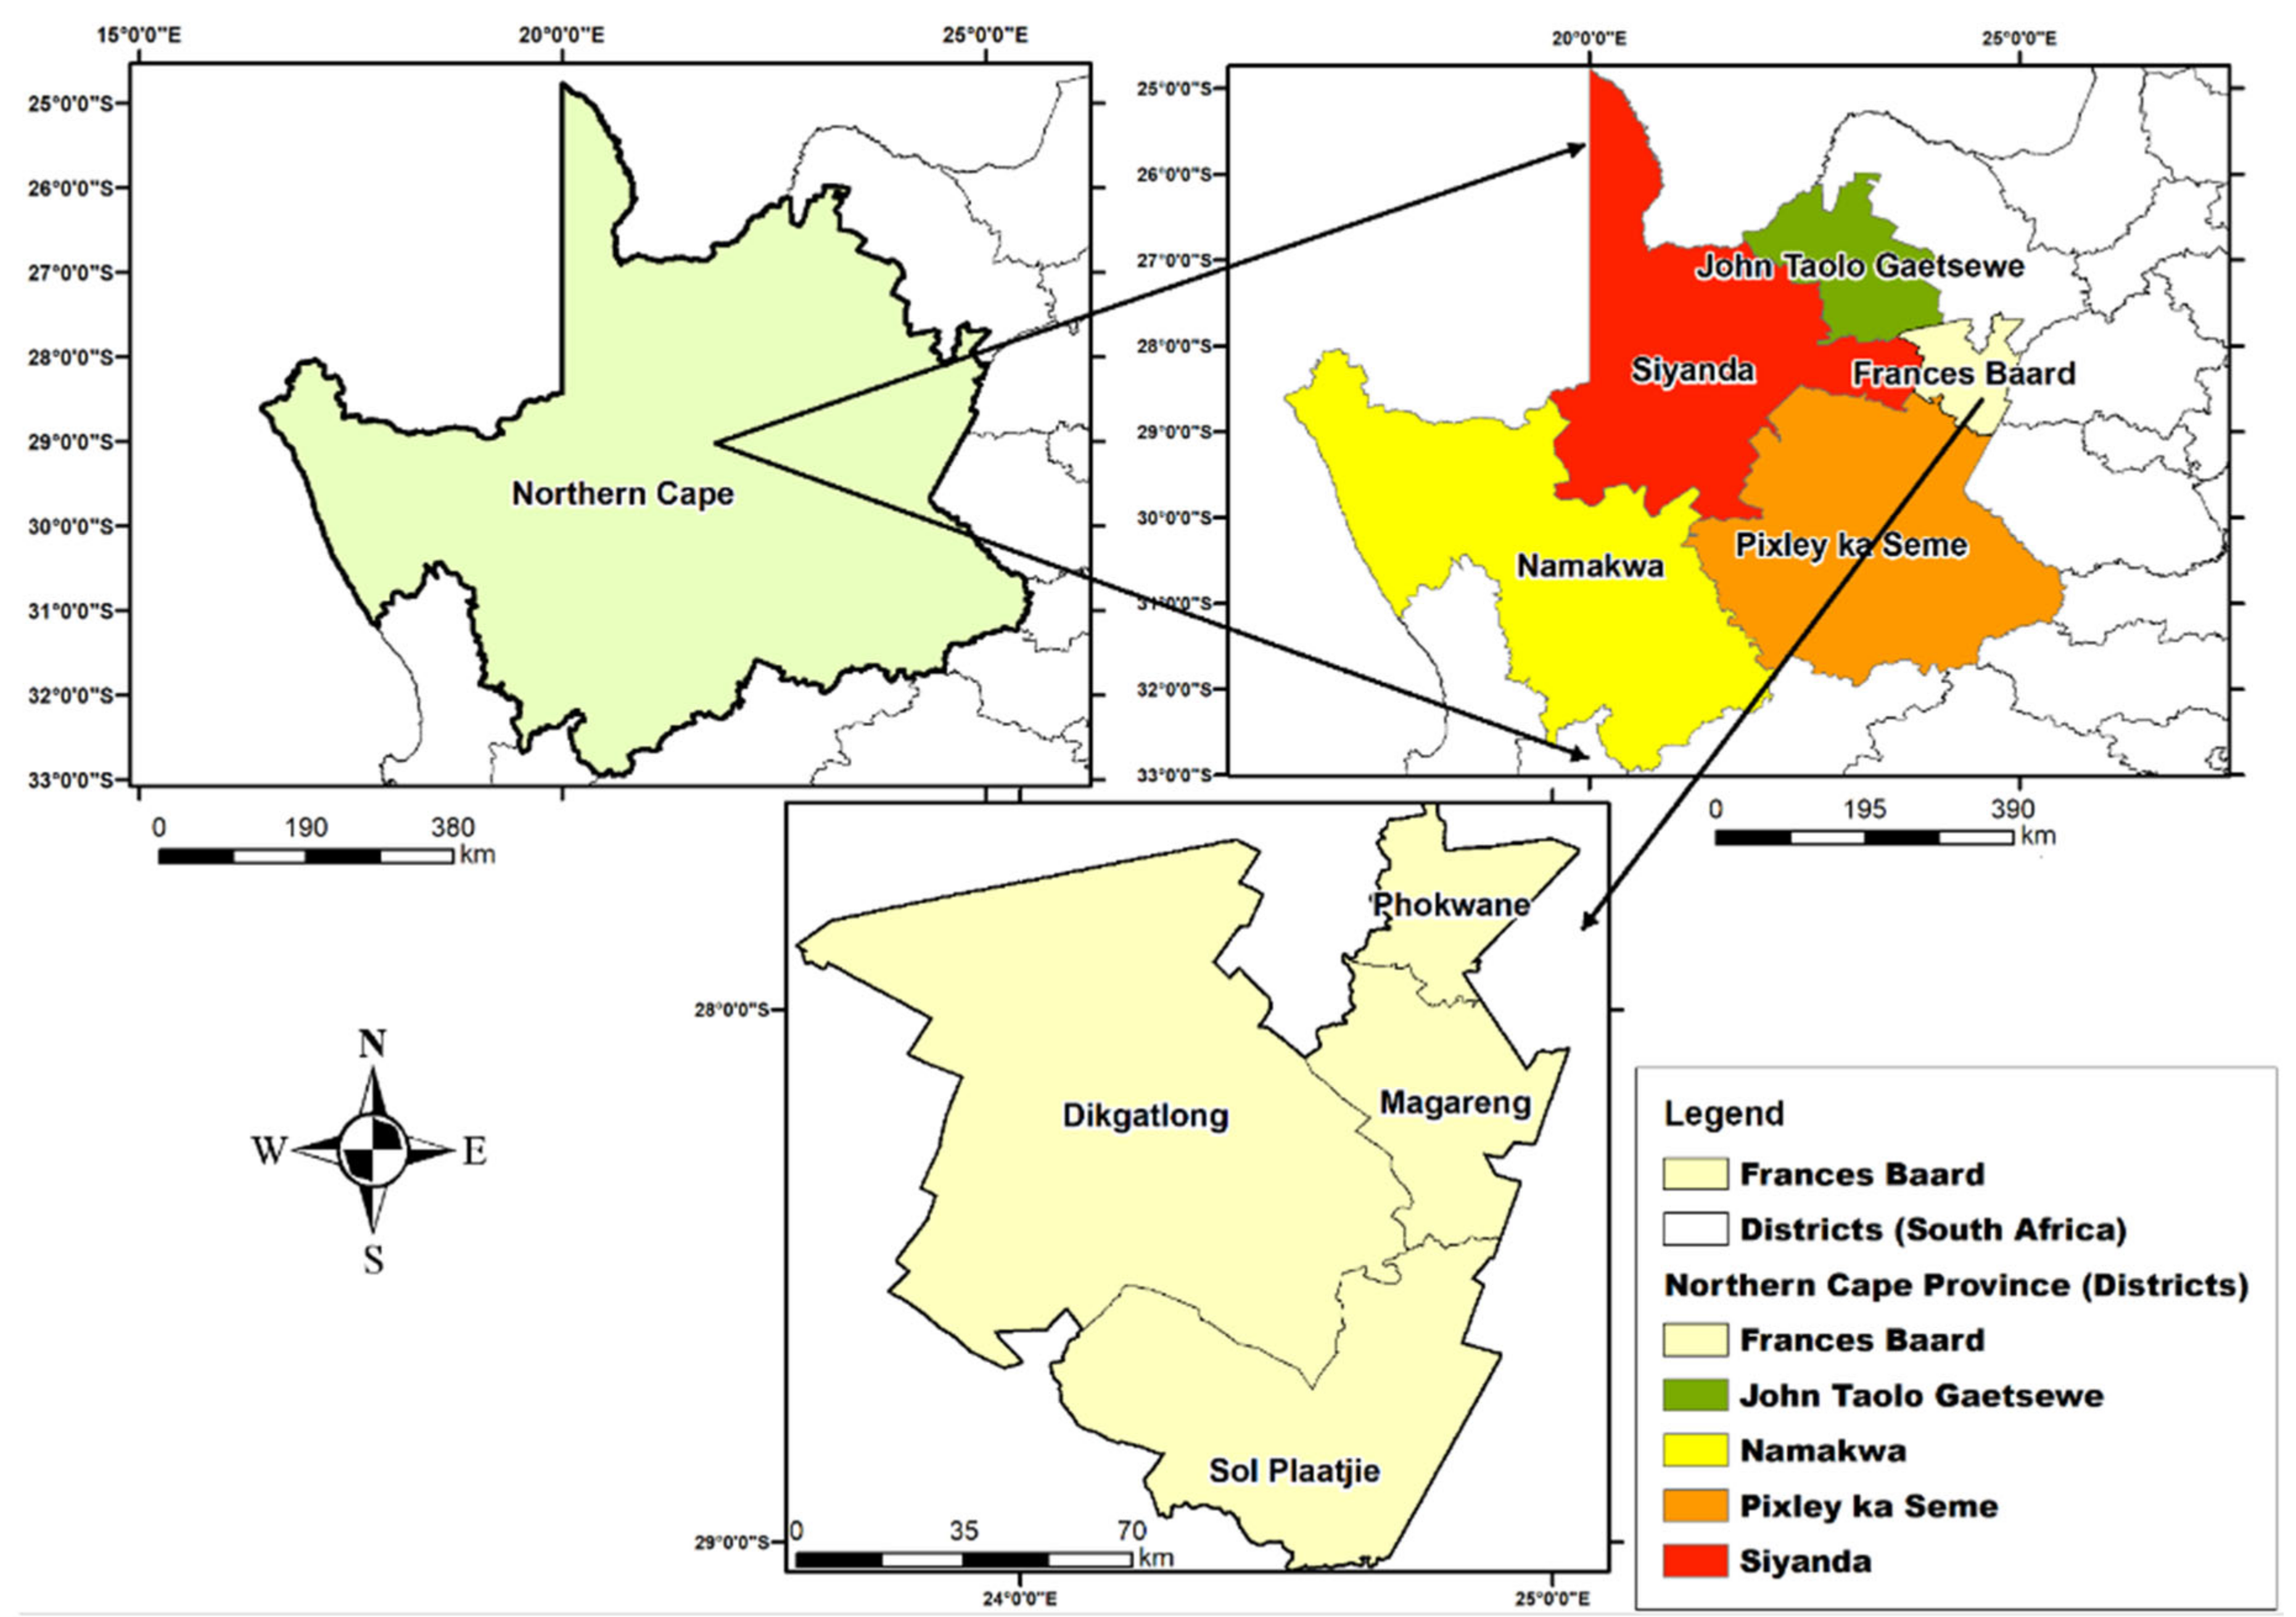
2 represents 30% of the country’s total area and, thus, is the largest province by surface area. The Northern Cape’s administrative government is divided into five districts with twenty-six local municipalities. Stats SA [
18] has reported significant changes in the population across the districts and municipalities in the past decades. The Frances Baard district municipality, located in the Northeastern part of the province, has 387,741 residents, accounting for 32.5% of the population. The municipality is the most densely populated in the province. A map of the Northern Cape Province and Frances Baard district municipality is shown in
Figure 1 below.
Regardless of the unfavorable climatic conditions, agriculture plays a central role and employs approximately 45,000 people in the Northern Cape. The sector represents 16% of total formal jobs and 40.3% of the province’s economic activities, thus, presenting breeding ground for poverty if agriculture fails due to climate-related conditions. It is also noted that due to the dominant sandy soils in the area, crop production cannot be viably sustained in the area. In this regard, livestock production dominates, with smallholder farmers mainly producing goats, sheep and cattle. Informal mining activities are also a source of livelihood, especially in rural municipalities.
2.2. Sampling and Data Collection
A mixed-method technique of data collection was used to meet the study’s objective, as informed by Sileyew [
21]. This approach was recommended since it integrates qualitative and quantitative methods and, thus, covers both the depth and breadth of the complex and intertwined coping strategies and food insecurity issues under agricultural drought conditions. The Northern Cape Province, Frances Baard district municipality, and the four local municipalities, namely, Dikgatlong, Magareng, Phokwane and Sol Plaatje, were purposively selected. The areas were active in agricultural production, focusing on smallholder livestock farming. The South African government also declared these locations as food insecurity disaster areas, offering the appropriate conditions for analyzing household food insecurity coping diversity under agricultural drought conditions. The Northern Cape Department of Agriculture, Forestry, and Fisheries (NDAFF) [
22] provided an inventory of the smallholder farmers in the municipalities. From this list, 878 smallholder livestock farmers were assisted by the NDAFF in 2020 to cope with the agricultural drought. These farmers formed the population for the study.
Table 1 below summarizes smallholder livestock farmers according to the local municipality.
The respondents for this study were selected as guided by the aforementioned multistage sampling approach. Informed by Glen et al. [
23], multistage sampling separated large populations into well-coordinated and targeted subgroups through well-structured phases to make the sampling process more representative. Cochran [
24] devised the sampling formula to determine the sample size. An initial sample size of 288 exceeded 5% of the population, and, as a rule of thumb, it was adjusted to 217 respondents using the Cochran correctional method. The study used primary data from smallholder livestock farmers in four district municipalities using a structured questionnaire in 2020 from 29 October to 11 December, as guided by the main research objectives. The data collection focused on the demographics of the smallholder livestock farming households and the various coping strategies they adopted to deal with food insecurity caused by agricultural droughts. Food consumption patterns and the likelihood of food insecurity among the families were gathered in the study. The anxiety about food insecurity and incidences of experiencing food insecurity conditions were tracked. These data were critical in unpacking the coping strategy diversity aimed at the farming households in the target areas and helping to inform the (re)designing of sustainable coping strategies in the wake of agricultural drought-induced food insecurity. The primary data from the smallholder livestock farmers were captured in the STATA version 13 and SPSS version 28 programs, cleaned, coded and analyzed.
2.3. Conceptual Framework
The study used a conceptual framework developed by the authors, as shown in
Figure 2. The factors influencing the diversity of coping with agricultural drought-induced food insecurity were estimated using latent variables, as shown by the observed variables. To achieve this, a well-selected set of observed variables was used to estimate this latent variable, which was cautiously interpreted for causality. A blended philosophical approach was adopted in this study to inform the conceptual framework and unravel the concept of agricultural drought-induced food insecurity coping strategies [
25]. This was structured around the theory of change and the inclusion of multiple stakeholders on the coping strategy formulation platforms. It also captured the choices determined by household and community-wide levels in the analysis. The theory of change models shaped how decision makers understood processes to produce results that contributed to achieving the final intended impacts. In this case, the decision was based on which combinations of coping strategies could be used by a household to cope with food insecurity caused by agricultural droughts. Mujeyi et al. [
8] also advocate for understanding the associated outcomes of the coping strategy matrix (diversity) on the household food security status as a critical step toward supporting the identified coping strategies. The study, therefore, adopted the HFIAS and transformed it into the categorical HFIAP indicator before relating it to the diverse coping strategies, while also exploring the causes of the coping strategy diversity. These relationships are shown in the conceptual framework (
Figure 2).
This study used a combination of lenses to understand the social, economic and institutional factors influencing the uptake of various coping strategies, represented by a categorical diversity variable classified into low, medium and high diversity. The relationships between these categories and the HFIAP categories were also assessed. Guided by the literature (e.g., Mujeyi et al. [
8]; Durrani et al. [
12]) and experiences from the study area,
Figure 2 below depicts a conceptual framework for strategies used to cope with agricultural drought-induced food insecurity. The framework also isolated the associated diversity drivers in managing food insecurity.
The hypothesized factors captured in the framework included the social factors (e.g., the household social capital, as suggested by Bahta and Myeki [
26], and institutional factors (e.g., credit constraints, as indicated by Ali et al. [
27]). The framework also captured economic factors (e.g., household income diversity, as reported by Musara and Musemwa [
2] and support mechanisms (e.g., development interventions, as highlighted by Patnaik and Das [
7]). The manipulation of these factors was explained in detail in the Materials and Methods Section. This study also acknowledged that multiple alternatives were available for managing drought-induced food insecurity as they emerged in the households and the wider community. However, their uptake and use by households and other stakeholders was stalled by factors depending on the significant driving problems (e.g., postharvest losses due to inadequate information and resources, as reported by Mukarumbwa et al. [
28] and Nohamba et al. [
29]; access to institutions, as noted by Poczta-Wajda et al. [
30]). As such, Rakotobe et al. [
4] postulated that the decision makers who used diverse coping strategies for managing food insecurity challenges remained low due to the numerous exogenous factors determining access to and the effectiveness of the available options, as presented in
Figure 2. This study explored this pathway for tracing the determinants of agricultural drought-induced coping strategy diversity in livestock farming communities.
2.4. Methods of Data Analysis
A farm-level analysis was adopted, with smallholder farmers being the core unit of the analysis. These decision makers were responsible for allocating resources in ways that influenced the diversity of the agricultural drought coping strategies they utilized. It was, therefore, appropriate to focus on these decision-making units and analyze the issues related to the food insecurity status as influenced by the chosen strategies using the lens of a diversity index.
2.4.1. Agricultural Drought Coping Strategy Diversity Index (CSDI)
The study identified the strategies used for coping with agricultural drought-induced food insecurity, as reported by the farmers. This helped to obtain insights into how the farmers’ contexts and community conditions affected the diversity of these strategies. The isolated projected variables included selling livestock, using alternative land, storing food, asking for animal food, looking for a job, migrating to other livelihood activities, raising drought-tolerant breeds, receiving relief grants, using savings and investments and leasing out their farms. An indicator variable, the agricultural drought food insecurity coping strategy (ADCS), was generated and transformed to create the variable for each farmer’s total number of strategies (TS) in Equation (1):
where “
” is the total number of strategies used by the farmer, “
n” is the number of available strategies for the whole community and “
” is the respective strategy used. This paper adapted the widely utilized ecological indices of diversity. It analyzed the diversity of agricultural drought coping strategies using the data on the shares of the strategies reported by farmers. The factors that determined the use of coping strategies also affected variation in the diversity index. These relationships were examined econometrically using the ordered logit regression (OLR) model, which was discussed later in the paper. Specifically, the Shannon–Weiner diversity index was used as a proxy for the dependent variable (
) and estimated using Equation (2):
where “
” is a measure of the extent of agricultural drought coping strategy diversity against food insecurity in the farming community and “
” is the total number of coping strategies used by households in the community. Strategy share is the proportion of using the strategies relative to the total number of strategies used in the farming community. The index was closely related to the number of strategies used and the evenness of their occurrence.
Guided by Leroy et al. [
31], a household food insecurity access score (HFIAS) was computed in Equation (3). This was transformed into the household food insecurity access prevalence (HFIASP), as reported by Coates et al. [
32].
where “
“is the score, “
” is the food insecurity occurrence observation and “
” is the frequency of occurrence. The “HFIAS” is a continuous access measure of the household’s food insecurity over the past 30 days. In this case, the score paid attention to consumption-related strategies during drought conditions and concerned the household members’ behavioral and psychological responses to food insecurity as they perceived it. As informed by Coates et al. [
32], the HFIAS was also categorized into food secure (0–6), mildly food insecure (7–14), moderately food insecure (15–20) or severely food insecure (21–24) to generate a household food insecurity access prevalence (HFIAP) status indicator. This was performed after acknowledging that the average HFIAS score was a continuous variable. Thus, it was highly susceptible to capturing smaller increments of changes over time as compared to the HFIAP. The household food insecurity classifications adopted above were based on the framework developed by Coates et al. [
32], with the schematic shown in
Figure 3 below.
The interval of standard deviation from mean (ISDM) index in Equations (4)–(6) was then used to classify and determine the diversity (CSDI) thresholds among small-scale livestock farmers [
33,
34]. Equations (4)–(6) show the equations that were used in the classification:
The CSDI was then treated as the dependent variable in the regression model with three ordered categories, since it accounted for the agricultural drought coping strategy groups. By implication, it was a richer variable to use in the analysis than treating the “TS” and “ADCS” separately. This index was one of this study’s major contributions to addressing food insecurity among households in agricultural drought-prone areas, such as the Northern Cape province of South Africa.
2.4.2. Aggregation-Identified Diversity into an Index
The diversity of the coping strategies for agricultural drought-induced food insecurity was estimated as outlined in earlier sections, where various coping strategies were determined in the first phase. In the second stage, the diversity of the identified agricultural drought-induced food insecurity coping strategies was aggregated into an index. Other researchers in similar studies, such as Schwarze and Zeller [
33], also applied the concept of calculating diversity indices. This study acknowledged that analyzing the diversity indices as absolute values did not provide evidence regarding factors that caused variations in these indices [
35]. It was important to explore factors influencing the diversity of agricultural drought-induced food insecurity coping methods among livestock farmers. This would help to influence policy and guide end users such as farmers and development agents. The approach used Equations (4)–(6) to generate three clusters of diversity. This implied developing an ordinal variable based on the diversity indices and then utilizing the ordered Logit model to trace the determining factors. However, objectively labeling the categories (e.g., lowly diverse, moderately diverse and highly diverse) was problematic, since there are no universally acceptable scaling criteria. The study utilized the most commonly used approach for diversity classification in social sciences, as reported by Gangadharappa et al. [
34].
Several options were considered for the data analysis. Motivated by Long and Freese [
36], a Tobit regression equation with a truncated continuous dependent variable (DCSI) was considered for the analysis. This may have resulted in a predicted output beyond the variable’s desired range. This was, however, a strong candidate, since this study also acknowledged that the dependent variable in the regression model did not have a normal distribution. As Wooldridge [
37] noted, traditional regression methods were unsuitable, since the variable’s censored distribution was partly continuous and partly discrete because of the mass of observations around zero. In this situation, the ordinary least square (OLS) analysis would also generate biased and inconsistent estimates of model parameters. This implied that ordinary least square (OLS) regression would be inappropriate, and an evaluation with an OLS regression would lead to subjective parameter estimates [
38].
Seven dimensions, namely, social, financial, institutional, the dominant orientation of production, decision makers’ time-constructed perception, the prevalence of drought exposure and external support, were used to trace the determinants of the small-scale farmers’ coping diversity. The dimensions were measured using indices derived from the literature and listed in
Table 1 [
1,
17]. This study noted that the indices had different scales, and, as such, they were initially standardized using weights generated from Equation (7):
where ”
” is the value for the variables for each respondent and “
” and “
” are the minimum and maximum values for the data, respectively. Using these weights, the composite indices were then computed after estimating and accounting for the weights of each of the seven sub-indices using SPSS version 28 software. The study acknowledged that in as much as the categories were informed through a deep review of the literature and designed within the context of the study area, these may still need to be verified through prototype cases.
Equations (8)–(14) are the transformed variables for the social (Soc)-, economic (Eco)-, institutional (Int)-, orientation (Ori)-, perception (Perc)-, prevalence (Prev)- and support (SUP)-related factors. Soc, Eco, Int, Ori, Perc, Prev and Sup were the Likert scale-based questions for the stated corresponding factors, and WSoc, WEco, WInt, WOri, WPerc, WPrev and WSup were the weights generated from the questions using PCA. We acknowledged the possible lag implications of the perceptions on the decision-making processes for coping with agricultural droughts. This was especially so given the dynamic nature of the agricultural drought conditions, which could demand varied responses and coping mechanisms over time. However, the variable was captured considering the 4-year period whether the project was conducted in the Northern Cape Province and, thus, could be confidently stated to capture the lags and variabilities in agricultural drought conditions as reported by farmers. This caused the aggregated perception variable to be a more indicative measure of backward- and forward-positioned decision making based on the experiences.
The Stata package version 13 was then used to run the ordered logit model with categorized “WADCI” as the dependent variable. Based on the literature on food insecurity coping strategies in drought conditions, the study isolated several factors affecting the diversity of these strategies. Bahta [
1] reported that social and institutional capital factors had a dual effect (positive and negative) on the choice of coping strategies and resilience among livestock farmers. Access to information resources and credit lines, as reported by Schwarze and Zeller [
33] and Bahta et al. [
39], enhanced the farmers’ capacity to diversify their income sources and, hence, led to a reduced likelihood of food insecurity. Similarly, Durrani et al. [
12] noted that increased years of education were associated with practices that aim to cushion farmers from the risks of agricultural drought conditions. These farmers were more likely to adopt emerging innovations and good agricultural practices (GAPs). Increased levels of support, including training programs, access to assets and direct food packs, were reported to influence coping strategies under drought conditions [
8,
17,
26]. A detailed description of the dependent and independent variables used to explore the determinants of coping strategy diversity is presented in
Table 2 below. These variables included socioeconomic and production-inclined orientation characteristics of the farmer, institutional factors and other perception-based factors.
2.4.3. Empirical Modeling
The study explained the likelihood that smallholder livestock farmers would be exposed to different levels of diversity of agricultural drought coping strategies. To achieve this, the ordered logit model (also called the proportional odds model) was utilized. This type of logistic regression allowed for modeling the relationships between predictor variables and the propensity to be in each higher-ordered category in Equations (4)–(6). Informed by Cameron and Trivedi [
40], the study adopted robust standard errors for the parameter estimates. The categories for the dependent variable were rankings, so the coding numbers represented progressive increases in diversity. The ordered Logit was, therefore, presented as an index model for a single latent variable, “
”, which was unobservable and was observed as “
” when it crossed certain thresholds. Accordingly, the model was operationalized and specified in Equation (15) and used the conditions shown in Equation (16) as:
where “
” is the dependent variable; “
” is the latent variable, which is the perceived level of coping strategy diversity; “
” is the vector of observed demographic, socioeconomic, institutional and perception variables; “
” is a vector of parameters and “
” is a normally distributed error term with a zero mean and constant variance of “
” and explained through “
”. In this case, the probability that farmer “
” would fall in the diversity category “
” was expressed in Equation (17) as:
Since this study adopted the ordered Logit in favor of the ordered Probit [
41]. “
” is the logistic “cdf” given in Equation (18) as:
The ordered logit model with “
” alternative coping strategy diversity categories would have one set of coefficients with “
” intercepts and “
” sets of marginal effects. The marginal effect shows an increase in a regressor “
” on the probability of selecting alternative “
” and is expressed as Equation (19):
The marginal effect is expressed as a percentage that shows how each unit increase in the independent variable altered the probability of selecting an alternative “
”. The ordered Logit model’s proportional odds assumption (or the parallel regression assumption) states that the relationship of predictors to the odds of a response appearing in the next higher-order category is the same irrespective of which classes are compared. This study used the “
omodel” command in STATA to test for this assumption. Since
p = 0.239 (i.e.,
p > 0.05) (if the
p-value was <0.05, then running a generic multinomial logit regression would have been more appropriate), it was concluded that the assumption held for the data, and, as such, the ordered logit regression could be utilized [
37].
3. Results
This section presents the study findings on the socioeconomic attributes of the participants and the empirical results.
3.1. Socioeconomic Characteristics
Selected variables were summarized in this section.
Table 3 shows the interaction of gender, the location of the farmer and the diversity index clusters.
Results from the three-way table showed that, across the four municipalities, the female-headed households were generally less diverse in their food insecurity coping strategy baskets. The DiKgatlong municipality had the highest diversity of male-headed households, followed by Pokwane. There were no significant differences in the diversity distributions for Sol Platjiaa and Mgareng households under the male category. However, in Pokwane, the female-headed households were relatively mode diverse, with approximately 13% being accounted for in the moderate and high diversity categories as compared to the other three municipalities, where DiKgatlong accounted for 7%, Sol Platjiaa approximately 1.3% and Mgareng approximately 2.8%. This clearly showed the diverse distribution across the three clusters of diversity across the farming households based on their gender and location.
The food insecurity–diversity–location matrix was also explored, as shown in
Table 4 below. The motivation was to trace the relationships among these fundamental variables and gain insights into possible intervention strategies to alleviate food insecurity.
There was evidence in
Table 4 that the households with higher diversity were also food secure relative to their counterparts in the low diversification cluster. Additionally, most households across the four municipalities were relatively food secure or mildly food secure. For example, in Pokwane and DiKgatlong, households with moderate to high diversity accounted for 9% and 15.6% of food-secure households, respectively. A similar pattern was also observed for the mildly food-insecure category, where the contributions were reported as 11.55% and 11.9% in the same diversity clusters and locations, respectively. Sol Platjiaa and Mgareng had low levels of coping strategies and diversity. Still, cases of severe food insecurity were also limited, with approximately 4% and 1% of households reporting moderate to severe food insecurity, respectively. The findings exposed the narrowness and willingness of households to test other coping strategies utilized in the wider community. This created a breeding ground for opportunities to redesign coping strategies. From a policy angle, this could be supported to suit the local contexts and enhance the uptake of effective strategies at larger scales across locations.
3.2. Ordered Logit Regression Results
The results for the variables influencing the diversity of coping strategies used for managing food insecurity caused by agricultural droughts among smallholder livestock farmers are presented in
Table 5 below. The marginal effects of the independent variables were estimated for each of the three categories of coping diversity (low, medium and high) and incorporated the coefficients into meaningful interpretations. Results for the odds ratio (OR) are presented (in
Appendix A in
Table A1 and
Table A2).
Results in
Table 5 show that all the 217 observations were included in the analysis and the LR. The Chi-square had a value of 101.52 (
p = 0.000), meaning that the model fit the data well compared to the null. The pseudo-R-squared value was 0.2295, implying that approximately 23% of the variation in the dependent variable was explained by the independent variables included in the model.
The ordered logit regression results showed that the average number of years in school increased the likelihood of farmers experiencing low and moderate diversity by 0.8% and 1.2%, respectively, while reducing the chances of them falling in the high diversity cluster by 1.9%. This contrasted with a prior expectation, and could also be explained by the nature of the education system in South Africa, which does not adequately accommodate socially inclined coping strategies such as seeking food from relatives as acceptable in a modern economy. From a policy perspective, this motivates educationists to refocus the curriculum toward a long-term vision that places social networks at the core of coping mechanisms, given the country’s persistent occurrences of agricultural droughts. Awareness campaigns can also be supported by a policy position and change as the challenges emanating from droughts become more complex to manage. The process involves fitting these into the institutional systems of the households and communities.
The study’s findings showed that access to support in the form of cash reduced the likelihood of farmers using low and moderately diverse food insecurity coping strategies by 12% and 18.2%, respectively, while increasing the chances of a farmer experiencing high diversity by 30.2%. The ability of households to access cash support was a catalyst for accessing numerous coping strategies, such as buying food and investing in assets.
Table 5 shows that access to food had no effect on the low and moderately diverse coping strategy categories, but increased the chances of a farmer experiencing high diversity by 12.4%. This could inform policy decisions through advocacy for supporting these multidimensional processes, so that they are coordinated and linked together for enhanced effectiveness and co-management by different stakeholders.
Access to support in the form of training reduced the likelihood of farmers using low and moderately diverse coping strategies by 7.9% and 12%, respectively, while increasing the chances of a farmer experiencing high diversity by approximately 20%. This finding could be a strong foundation for motivating the expansion of training programs, especially in vulnerable communities, as supported by the government and private-sector players. Training that focuses explicitly on the best practices and combinations of coping strategies in the wake of droughts is a building block for the sustainable management of household food insecurity.
Support administered using access to asset pillars reduced the likelihood of farmers using low and moderately diverse coping strategies by 11.8% and 17.9%, respectively, while the variable had no significant effect on the high diversity cluster. These assets were essential for greasing other food-generating activities, such as in community gardens, where achieving income and nutrition needs was the desired outcome. In the same way of argument, the results showed that using savings and investments as coping strategies reduced the likelihood of farmers using low and moderately-diverse coping strategy by 9.2% and 13.9%, respectively, while increasing the chances of a farmer experiencing high diversity by approximately 23%. These magnitudes of effects were in the same range as the assets dimension, signaling similar relationships with the outcome variable. Some farmers could save the cash they receive as support, and recycle it for coping during the next phase when another drought occurs.
Farmers who had access to inputs had a lower likelihood of using low and moderately diverse coping strategies by 10.9% and 16.6%, respectively, while increasing their chances of a farmer experiencing high diversity by approximately 27.5%. This was also reported in
Table 5 for access to water resources, which reduced the likelihood of farmers using low and moderately diverse coping strategies by 7.5% and 11.4%, respectively, while increasing the chances of a farmer experiencing high diversity by approximately 18.9%. These two critical production factors determined a households’ ability to cope with food insecurity shocks triggered by drought conditions. However, farmers with access to inputs and water were less likely to be exposed to these vulnerabilities, because they had sufficient resources to produce food throughout the year.
Access to credit resources did not affect the low and moderately-diverse coping strategies categories, but increased the chances of a farmer experiencing high diversity by 17.6%. The results could directly impact policy decisions where credit portfolios are tuned to accommodate the marginalized smallholder farmers. This could strengthen the local and relatively informal systems through capacity building and seed funding, while also monitoring the requirements from formal procedures, especially concerning collateral and the cost of borrowing. This was also related to frequent droughts in the community, which reduced the likelihood of farmers using low and moderately-diverse coping strategies by 10.1% and 15.3%, respectively, while increasing the chances of a farmer experiencing high diversity by approximately 25.4%. This dimension was an important consideration in the implications of lagged perceptional orientation to the agricultural drought impacts on food security conditions. This was primarily because the frequent exposure to droughts shaped the perceptions and caused them to be more static, thus, creating the need to design diverse coping strategies based on past experiences and information about possible future drought patterns. The small-scale livestock farmers who experienced household food insecurity, especially in the severe cluster, would adopt the ‘learning by doing’ approach to codesign coping strategies with other community members over time, as influenced by the persistent experiences of these extreme conditions. In this regard, the aggregated perception variable accounted for the time effects and the continued exposure to food insecurity caused by agricultural droughts.
4. Discussion
The discussion placed the study findings in the broader body of knowledge on agricultural drought-induced food insecurity and the associated coping strategies. This was important, as this highlighted the significant contributions of the study to the body of knowledge on the aspects of agricultural diversity in drought-prone communities.
Reflecting on the observations from the study in terms of socioeconomic characteristics such as gender and location should help align tailor-made solutions given by the conditions of the communities, as suggested by Onyeneke et al. [
11]. This could be a vital pathway for cohesion among the various stakeholders involved in the agricultural drought coping strategies and enhance food security in ways that accommodate local knowledge and modern science technologies. A vital lesson from this finding was that there is no ‘one size fits all’ agricultural drought coping strategy for sustainable food security. Instead, the development practitioners must identify the specific characteristics of communities before recommending the course of action to follow. In support of this viewpoint, Musara and Musemwa [
2] also reported a similar trend with the uptake of sorghum high-yielding varieties as an agricultural drought coping strategy in the drylands of Zimbabwe.
The lessons were important for smallholder livestock farmers in the Northern Cape province of South Africa as they formulated strategies based on existing strengths. The farmers could then codesign operating arrangements that strengthened options for coping with agricultural droughts for food security. Rakotobe et al. [
4] downplayed the gender-based variations in coping strategies in a cyclone coping study. They reported that, given the mixed decision-making systems in the smallholder sectors, it became difficult to accurately decompose the effect of gender regardless of the location and time considerations. This was an important insight, given the social stereotypes associated with the gender variable in the rural areas of the Northern Cape province of South Africa. Gender mainstreaming must, therefore, also take center stage in designing and scaling up effective coping strategies if food security is to be attained in agricultural drought-exposed communities today and in the future.
The food security coping strategy diversity nexus showed a positive correlation. A similar outcome was also reported by Riptanti et al. [
17] in the drylands of Indonesia through the perspective of opening avenues for practical implications in monitoring the effectiveness of the adopted coping strategies, and not necessarily their abundance or diversity. Schwarze and Zeller [
33] also reported the need for enhancing the diversity of income sources to enhance food security in drought-vulnerable smallholder communities. In this view, the absence of safety nets, such as usable groundwater resources for irrigation during the peak periods of surface water shortages in the Northern Province of South Africa, further diminished the potential of farmers to perform all-year-round agricultural activities. This was mainly so for crop production, which dominantly failed to generate food for households, let alone surplus for sale. These insights, therefore, reinforced the contributions provided by this study in advocating for understanding and realigning coping strategy diversity from an index orientation. The study findings also reinforced the need to unlock opportunities for well-managed crop–livestock integrated farming systems, which were, however, more hinged on livestock production. If these opportunities for balancing the opportunity cost of investing in irrigated agriculture for enhancing crop production using income from livestock enterprises can be unlocked, then localized multiple value chains can be supported, thus, increasing the diversity of coping strategies during droughts.
In terms of education, Durrani et al. [
12] also observed a similar pattern in a study in Pakistan, where indigenous coping strategies were not perceived as effective in dealing with risks during drought conditions. Using awareness campaign programs within schools and broader communities to encourage people to embrace the utilization of marginalized strategies, which are shunned by the communities, could be a panacea to enhance the diversity of coping, while also reducing incidences of food insecurity. Couzin-Frankel [
42] also noted that the education systems must be responsive to the needs of societies, such as designing localized mechanisms to cope with droughts through the uptake of innovations at larger scales. This orientation places the need to understand whether if climate change was not an issues in the study area, would different food insecurity conditions be observed. Guided by the ‘
learned perceptions’ and the potential of expanding and commercializing livestock systems, there are higher chances that farmers would be more resilient without the climate change shocks, since, currently, most of them are small farmers with islands of emerging and commercial farmers.
When focusing on support using cash transfers, Schwarze and Zeller [
33] reported similar findings in an income diversification study. They recommended that households had alternative income flows to support coping and resilience. This finding incentivizes the government to adopt and scale up the cash grants model in supporting households domiciled in South Africa’s drylands. Onyeneke et al. [
11] reported that the over-dependency on cash handouts creates a dependency syndrome that stalls innovation in terms of adaptation, coping and resilience. Suppose this latter facet manifests in the communities. In that case, the smallholder livestock farmers would most likely be locked in the current conditions of low coping strategy diversity and exposure to food insecurity, especially given the persistence of drought in the study area.
Abate and Addis [
43] also reported the potential of tailor-made training programs in a marketing study for smallholder sheep production in a drought-sensitive community. Their argument was based on the need to provide capacity for the farmers to respond to food insecurity outcomes using market-based approaches. Poczta-Wajda et al. [
30] were, however, of a different opinion, and noted that training on its own was not enough to guarantee food security in drought-prone areas, but, instead, interventions that were targeted at changing the attitudes of value chain stakeholders. Bahta and Myeki [
25] also reported the need to support livestock farmers in the Northern Cape province of South Africa with assets to enhance resilience and cope with drought conditions. They argued that these assets have a spillover effect that goes beyond coping with food insecurity during droughts and allows smallholder livestock farmers to produce and sustain the other livelihood-supporting value chains commercially.
Musara and Musemwa [
2] also reported that access to inputs was a strong driver of food security. They noted that sorghum farmers who had access to high-yielding varieties were relatively more food secure even in drought conditions. Therefore, this finding was an eye-opener in terms of supporting coping strategies for diversity by farmers with the likelihood of experiencing drought-induced food insecurity using emerging innovations around inputs and water rights for the farmers. Kehinde et al. [
44] alluded to this and suggested that land and water rights are fundamental property rights that sustain the ability of vulnerable households to cope during times of shock. All these observations point toward the need for the governments to realign the property rights regimes with the prevailing (and anticipated) conditions in the drylands, where food insecurity is expected due to recurrent droughts. This can then be scaled up to other geographical areas and benefit those in the wetter areas to support the national food security agenda.
Ali et al. [
27] also argued that access to credit directly influences farm productivity, which, according to Kruke [
45], supports a household’s ability to cope with droughts. The formal and informal credit combo used in the Northern Cape Province farming communities in South Africa presents enormous opportunities to create a sustainable cushion for farmers not easily eroded by drought conditions. According to Caldwell and Boyd [
16], this supports a new dimension of looking at coping strategies as the lens moves from individual households to communities. The marginal effects show high values, meaning that these may be important factors to focus on in managing food insecurity by adopting diverse coping strategies during drought conditions.
5. Conclusions
The study concluded that there was a strong justification for using consolidated indicators of agricultural drought coping strategy diversity to properly model factors affecting food security conditions among smallholder livestock farmers. There is, therefore, a need to holistically consider the development of coping strategy baskets as a whole, and not concentrate on individual household strategies. This implies that development agents must adopt a more community-wide approach rather than the narrower household-level support dimensions. To achieve this, stakeholders along the smallholder livestock value chain must constantly codesign blended coping strategies based on the available universal pack as guided by drought and non-drought conditions. The ordered logit regression model showed that social (e.g., education), economic (e.g., yield), institutional (e.g., credit) and overlapping (frequency of exposure to drought) determinants affected the household food insecurity coping strategy diversity.
In this context, to avoid the cobra effect, it was highly recommended that there should be policy realignments that target the awareness of the impacts of a laissez-faire mentality to managing vulnerability to drought-triggered food insecurity. The most commonly observed cluster was the one related to support mechanisms. Government and private-sector players must design implicit packages and channel them to the sampled communities. At the same time, lessons could also be used for further studies regarding scaling up and scaling out efforts in other similar communities in South Africa.
This study used cross-sectional data and may not have adequately captured the time differences and coping strategies under different drought conditions. Thus, there is a need to use longitudinal data in these analyses, increase the sample size and include more explanatory variables. However, understanding the conditions in the study area is an effort that has continued for the past four years, and, thus, most of the variables, including perception, were structured to account for the time effects using aggregation, weighting and indexing techniques. It is important to note that given the climate variability taking place in the region and study area, the results of the analysis, though robust to time effects, could still be refined with a panel data series.


