Article

Assessing the Emissions Related to European Households’ Expenditures and Their Impact on Achieving Carbon Neutrality

1
Global Sustainability Institute, Anglia Ruskin University, Cambridge CB1 1PT, UK
2
The Club of Rome, 8400 Winterthur, Switzerland
*
Author to whom correspondence should be addressed.
Climate 2023, 11(10), 203; https://doi.org/10.3390/cli11100203
Submission received: 9 September 2023 / Revised: 30 September 2023 / Accepted: 4 October 2023 / Published: 10 October 2023
(This article belongs to the Special Issue Climate: 10th Anniversary)

Abstract

:
The European Green Deal comprises various policy initiatives with the goal of reaching carbon neutrality by 2050. The “Fit for 55 packages” include the Social Climate Fund, which aims to help, among others, vulnerable households and transport users meet the costs of the green energy transition. Thus, analyzing households’ expenditures and the associated carbon emissions is crucial to achieving a net-zero society. In the present study, we combine scenarios of households’ expenditures according to the Classification of Individual Consumption According to Purpose with economic decoupling scenarios to assess, for the first time, the European carbon budget allocation on a consumption basis. Expenditure projections based on socioeconomic scenarios were calculated using the Bayesian structural time series, and the associated emissions were estimated through the greenhouse gas intensity of the Gross Domestic Product. The model can be used to report the carbon budget of households and monitor the effectiveness of the measures funded by the Social Climate Fund. However, the emissions burden obtained by means of averaged greenhouse gas intensity of Gross Domestic Product results in a rough approximation of outcomes, and more accurate indicators should be developed across the member states.

1. Introduction

With the Green Deal and long-term strategy, the European Union (EU27) has binding targets of reducing greenhouse gas (GHG) emissions by at least 55% by 2030 compared to the 1990 baseline and achieving carbon neutrality by 2050. To approach these targets, it is important to fully understand households’ expenditures, as household consumption is a major driver of total emissions. Households contribute to global warming substantially with both direct and indirect emissions, with the former associated with the direct use of fossil fuels and the latter with the emissions embodied in purchased goods and services. For these reasons, householders are targeted by the Social Climate Fund (SCF) [1] within “Fit for 55 packages” [2]. With direct support to income, SCF aims to help vulnerable households and transport users meet the costs of the green energy transition. Each member state (MS) reports on SCF in their National Energy and Climate Plans (NECPs); however, according to the investigation from Perissi and Jones [3], the social impact evaluation in the transition is still limited across the MSs.
In our study, we investigate EU households’ expenditures and aim to assess the associated emissions burden to give some insight into how to prioritize the SFC resources allocation to support decarbonization across the EU27. We propose a preliminary assessment of the EU carbon budget associated with the evolution of expenditures to quantify expenditures’ impact on decarbonization. Carbon budgeting is a constraint for policymakers who should consider the same importance of cutting emission targets as cutting emission rates alone. Not setting carbon budgets at regional levels implies the 2 °C global warming target agreed upon in the Paris Agreement may not be met as a temperature limit concerns the cumulative emissions stocked in the atmosphere [4]. Our investigation also provides some insight into how household expenditures are distributed and could evolve across the European Union (EU27) by 2050.
Numerous recent articles have considered the issue of measuring emissions from a consumption perspective. For instance, a recent study of “household metabolism” [5] reports an integrated model of natural resources entering and leaving households or forecast scenarios to 2030 for UK household expenditures and associated GHG emissions [6], while Davis and Caldeira [7] present a global consumption-based CO2 emissions inventory and calculations of associated consumption-based energy and carbon intensities. Finally, Munksgaard and Pedersen [8] compared total emissions based on consumption and production perspectives and developed the concept of ‘carbon dioxide trade balance’. More recent papers illustrate the significant amount of CO2 embedded in foreign trade [9].
In the present study, we investigate the evolution of European Union households’ aggregated expenditures according to the Classification of Individual Consumption According to Purpose (COICOP) categories to identify which categories are associated with the highest levels of GHGs and should be targeted in designing policies to achieve the greatest future emissions reductions. The study considers the expenditure projections in three possible scenarios for 2050: (1) business as usual (BAU), (2) higher expenditures compared to BAU, and (3) lower expenditure scenarios compared to BAU. Expenditure projections are forecast using a Bayesian structural time series model.
The previous projections are transformed in emissions burden through the use of Greenhouse Gas (GHG) intensity of GDP of each MS of the EU27. The obtained carbon emissions account for direct and indirect emissions of consumers in each country (each country has a different carbon intensity of GDP). Thus, the hypothesis on how the economy will decarbonize in the future is necessary to explore the impact of consumer emissions to achieve carbon neutrality. Here, three possible economic decoupling scenarios are considered as GHG intensity of GDP: (1) an exponential decoupling based on historical data of EU emissions and GDP resulting in a decarbonization rate of −4% per year (BAU −4%); (2) a slower exponential decoupling of −2% per year (high −2%); (3) a sharper linear decoupling from 2022 which considers the achievement of a total decarbonized GDP in 2050 (low, linear).
The final household emissions burdens related to expenditure scenarios that we will assess in this paper are the following: (1) BAU expenditure with exponential GHG/GDP decoupling −4% year; (2) BAU expenditure with exponential GHG/GDP decoupling −2% year; (3) BAU expenditure with linear GHG/GDP decoupling; (4) higher expenditures compared to BAU with exponential GHG/GDP decoupling −4%; (5) higher expenditures compared to BAU with exponential GHG/GDP decoupling −2%; (6) higher expenditures compared to BAU with linear GHG/GDP decoupling; (7) lower expenditure scenarios compared to BAU with exponential GHG/GDP decoupling −4%; (8) lower expenditure scenarios compared to BAU with exponential GHG/GDP decoupling −2%; and (9) lower expenditure scenarios compared to BAU with a linear decrease of GHG/GDP decoupling. We, therefore, take the GHG emissions by expenditure scaled according to the share of GDP as a first assessment of the emissions burden related to households’ expenditures.
A lot of research struggles to assess the carbon footprint of individual products (see, for instance, the cases of rye bread [10] or beet sugar [11]). Unfortunately, the same accuracy cannot be provided for every product across the EU. This is why, for instance, to investigate sustainable development [12], researchers, policymakers, and international organizations have taken carbon emissions intensity of GDP, measured as the ratio of GHG to GDP, as a starting-point indicator to assess emissions performance at an aggregated level. Following the same approach, combining scenarios on expenditures with scenarios on GDP decoupling, this study assesses, for the first time, the potential EU27 carbon budget [13,14] erosion associated with the evolution of households’ expenditures.
This paper is organized as follows. Section 2 explains the method to implement expenditure projections and the associated GHG emissions. This is followed by Section 3, which reports a description and discussion of the state-of-the-art expenditures, their future projections, and the results of the emissions related to those future expenditures. Conclusions are summarized in Section 4.

2. Materials and Methods

Several approaches are possible to study the patterns of emissions in households’ expenditures. To study future pathways, here, we choose a first approximation of calculating the carbon emissions burden of EU27 households’ expenditures using MS GHG intensity of GDP. The authors are aware this methodology does not provide the actual carbon emissions of the household expenditures but merely allocates a portion of the overall GHG emissions based on the intensity of the GDP emissions. Not all categories with high expenditure are associated with higher GHG emissions as they may have lower GHG intensity, and not all categories with low expenditure are associated with lower GHG emissions as they may have a higher GHG intensity. For example, a finance service could have higher expenditures and lower carbon emissions than international travel, which may have (on average) lower expenditures but higher carbon emissions. Nevertheless, as a first approximation, we believe that this paper allows the method to be tested, and it can be followed up with further studies that allocate more appropriate carbon intensities for each household expenditure. Moreover, the assessment of the emissions associated with household consumption allows for monitoring the achievement of ecological–economic decoupling under the European Green Deal, which is an aggregated target [15].
Data for the household expenditures were categorized according to COICOP [16] sectors. COICOP future expenditure projections based on socioeconomic scenarios were calculated using the Bayesian structural time series (BSTS) model [17]
exp t = β 0 + β 1   p r i c e + β 2   i n c o m e + β 3   e x n e f + ε t
Equation (1) represents a structural time series model that has a direct interpretation of COICOP expenditures in terms of the linear combination of β 1 prices, β 2 households’ income, and β 3 , an underlying trend that represents exogenous non-economic factors (ExNef). β i are the linear regression coefficients. εt is a series of independent Gaussian disturbances with a mean of 0 and variance σ2. Equation (1) is implemented with Matlab®, using a “bayeslm” function [18], which allows for calculating the regression coefficients distribution from historical data, specifically, the historical COICOP expenditures [16], incomes [19], and prices of consumer goods and services purchased by Euro-area households [20] are from Eurostat. The regression coefficients from historical data obtained with bayesalm were taken as the best estimation to be used again in Equation (1) to then project the expenditures from 2020 to 2050.
ExNef terms were introduced and discussed in the STS model of Chitnis et al. [6] as a stochastic term that allows for greater uncertainty in future expenditure projections. However, data on ExNef, which represent factors such as technical progress, changes in consumer tastes and preferences, socio-demographic and geographic factors, lifestyles, and values, are not traceable nor measurable by suitable indexes, as we would need to know how behaviors change in the future. They still remain an aggregate contribution to be extrapolated, and while the policy is increasingly focused on behavior change, it is difficult to predict impacts and when they will occur. For this reason, the authors opted to consider the underlying trend as a simple extrapolation of historical yearly data, which results in an increasing linear trend.
Finally, expenditure projections are placed in relation to emission projections. The considered emissions are based on the consumption of goods and services within the EU27, i.e., the emissions embedded in imports and the subtracted emissions from exports. This approach aims to prevent double emissions counting. In evaluating this impact, 3 GDP decarbonization [21] trajectories have been explored in terms of the GHG intensity of GDP, estimated according to Randers [22]. This estimation shows the EU has averaged an annual improvement rate of around 4% since 1995. The second scenario considers a GHG/GDP ratio declining slower than BAU, −2% per year; the third scenario considers a linear projection of GDP decarbonization to be completed by 2050. Then, the expenditures’ carbon budgets associated with the economic scenarios are evaluated as the area underneath the emission trajectories associated with the expenses and discussed with a focus on achieving the 2030 carbon reduction objectives and the 2050 carbon neutrality objective.

3. Results

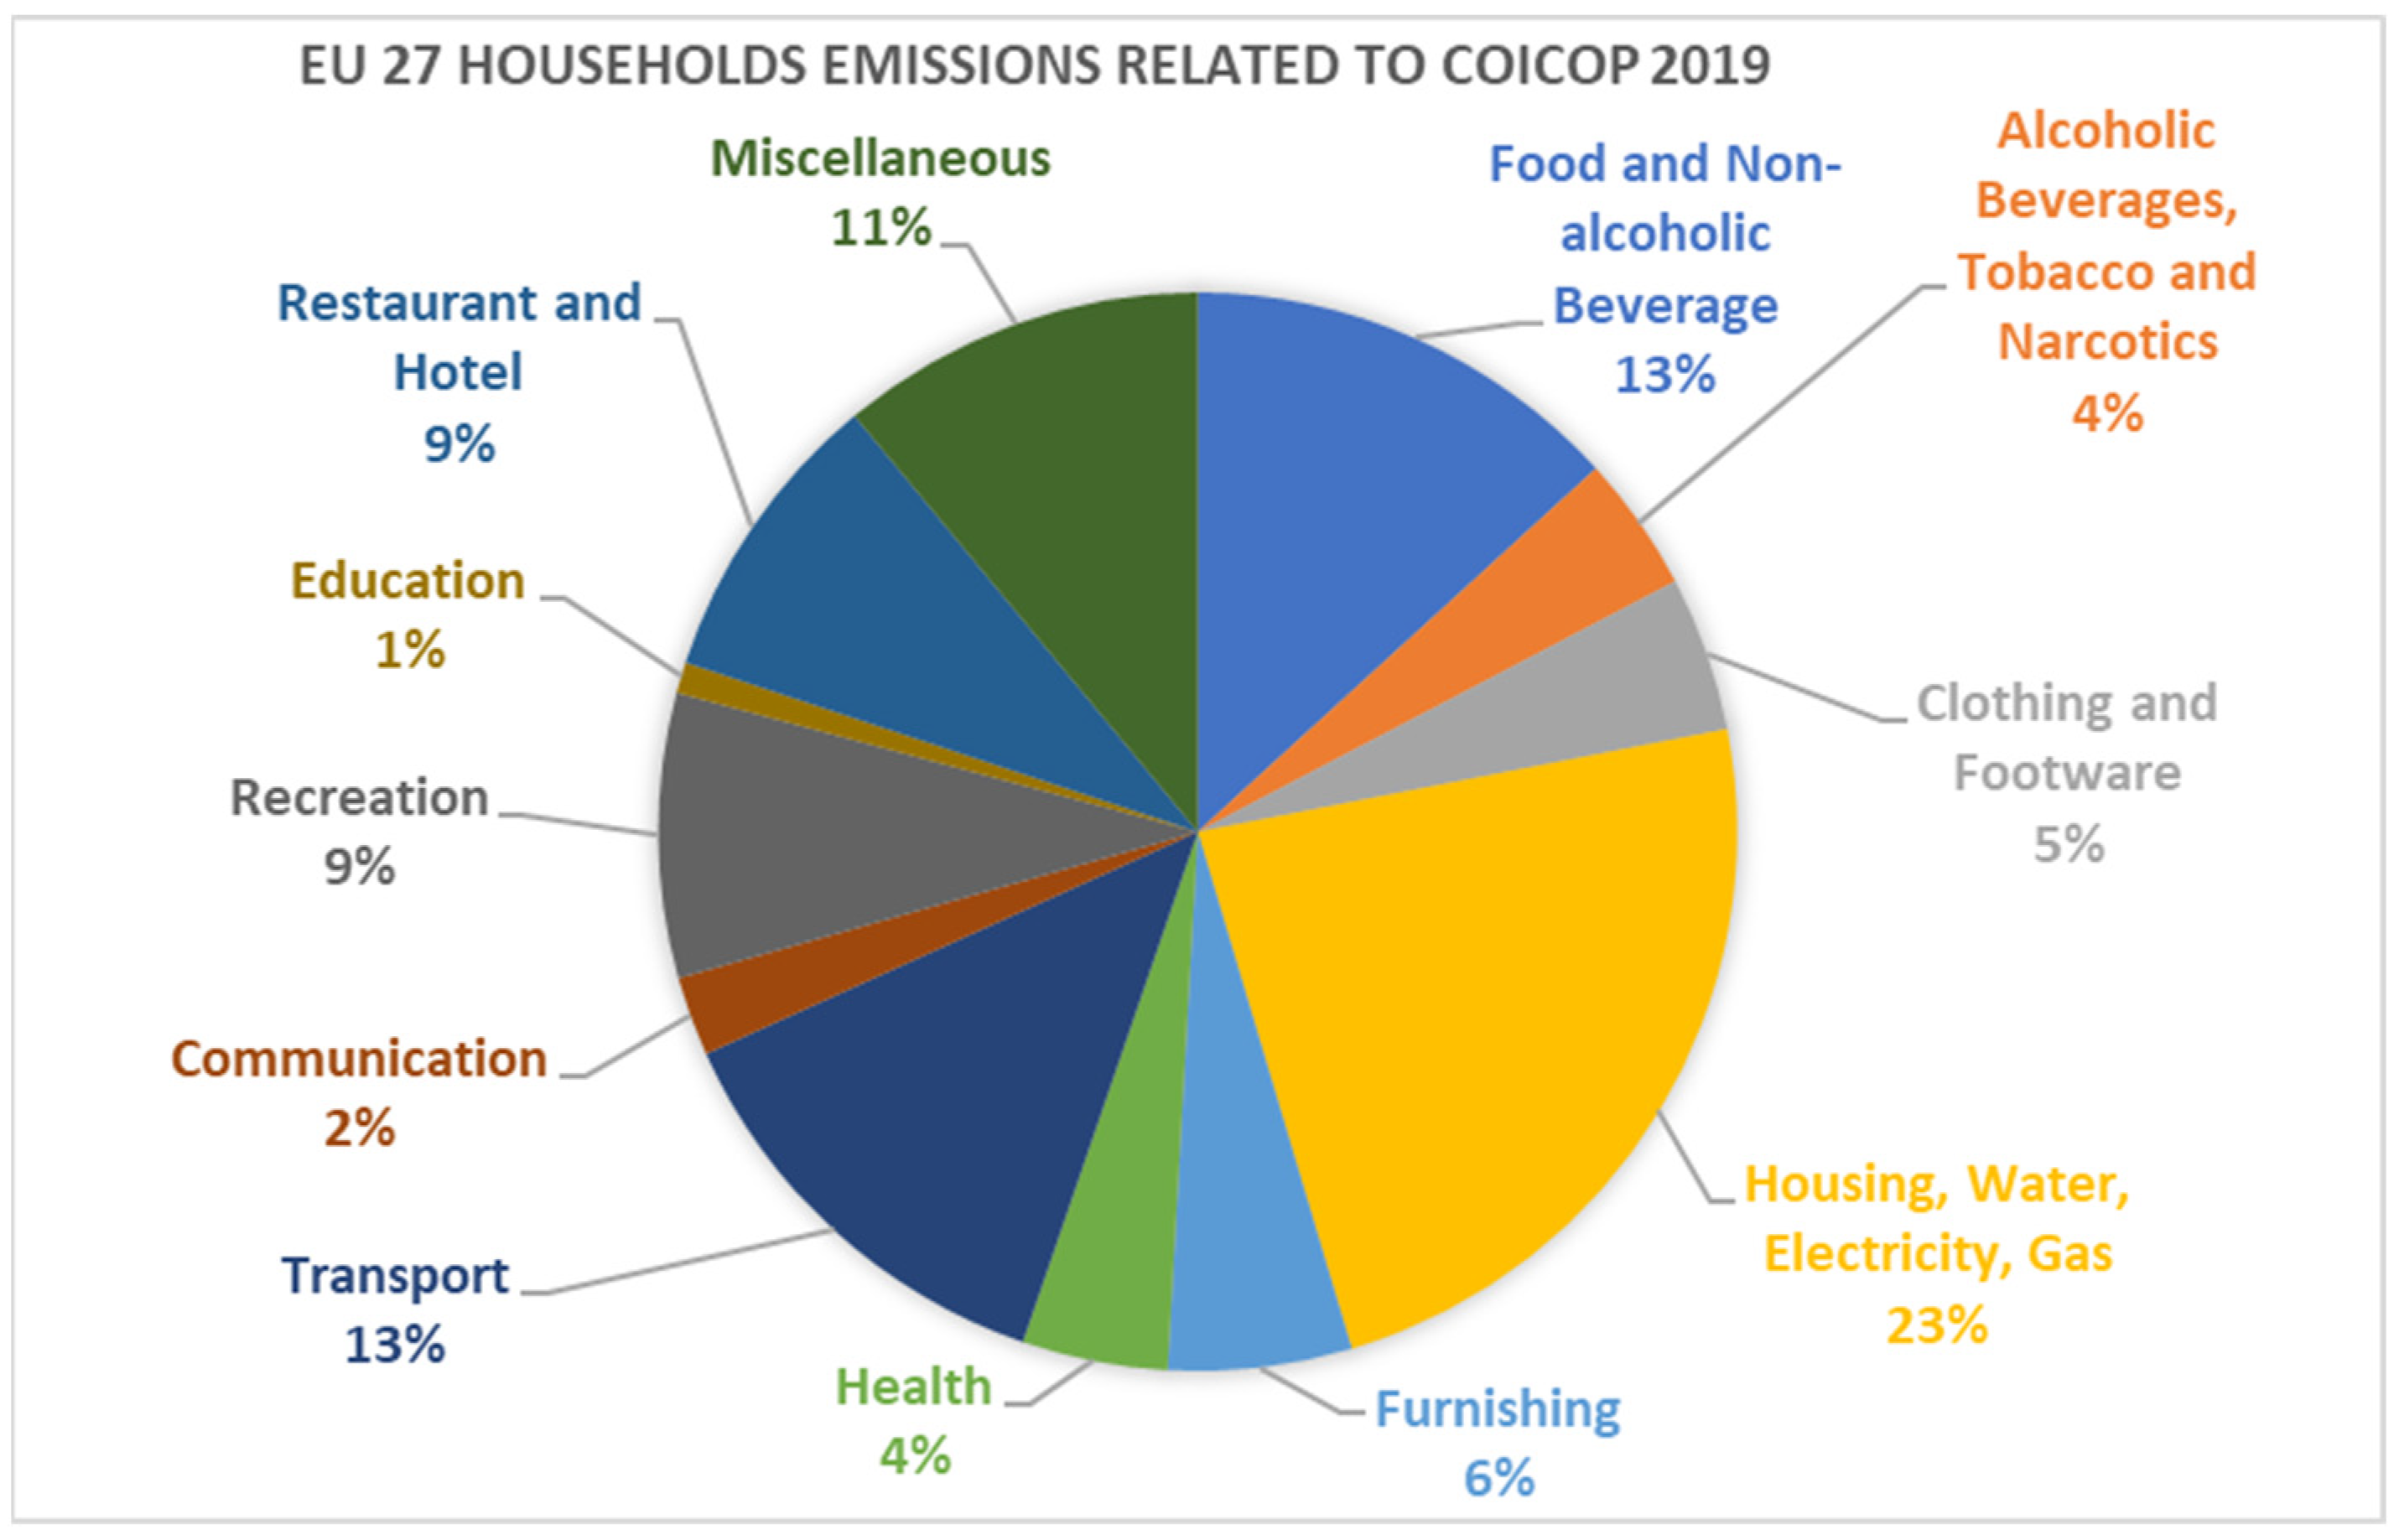
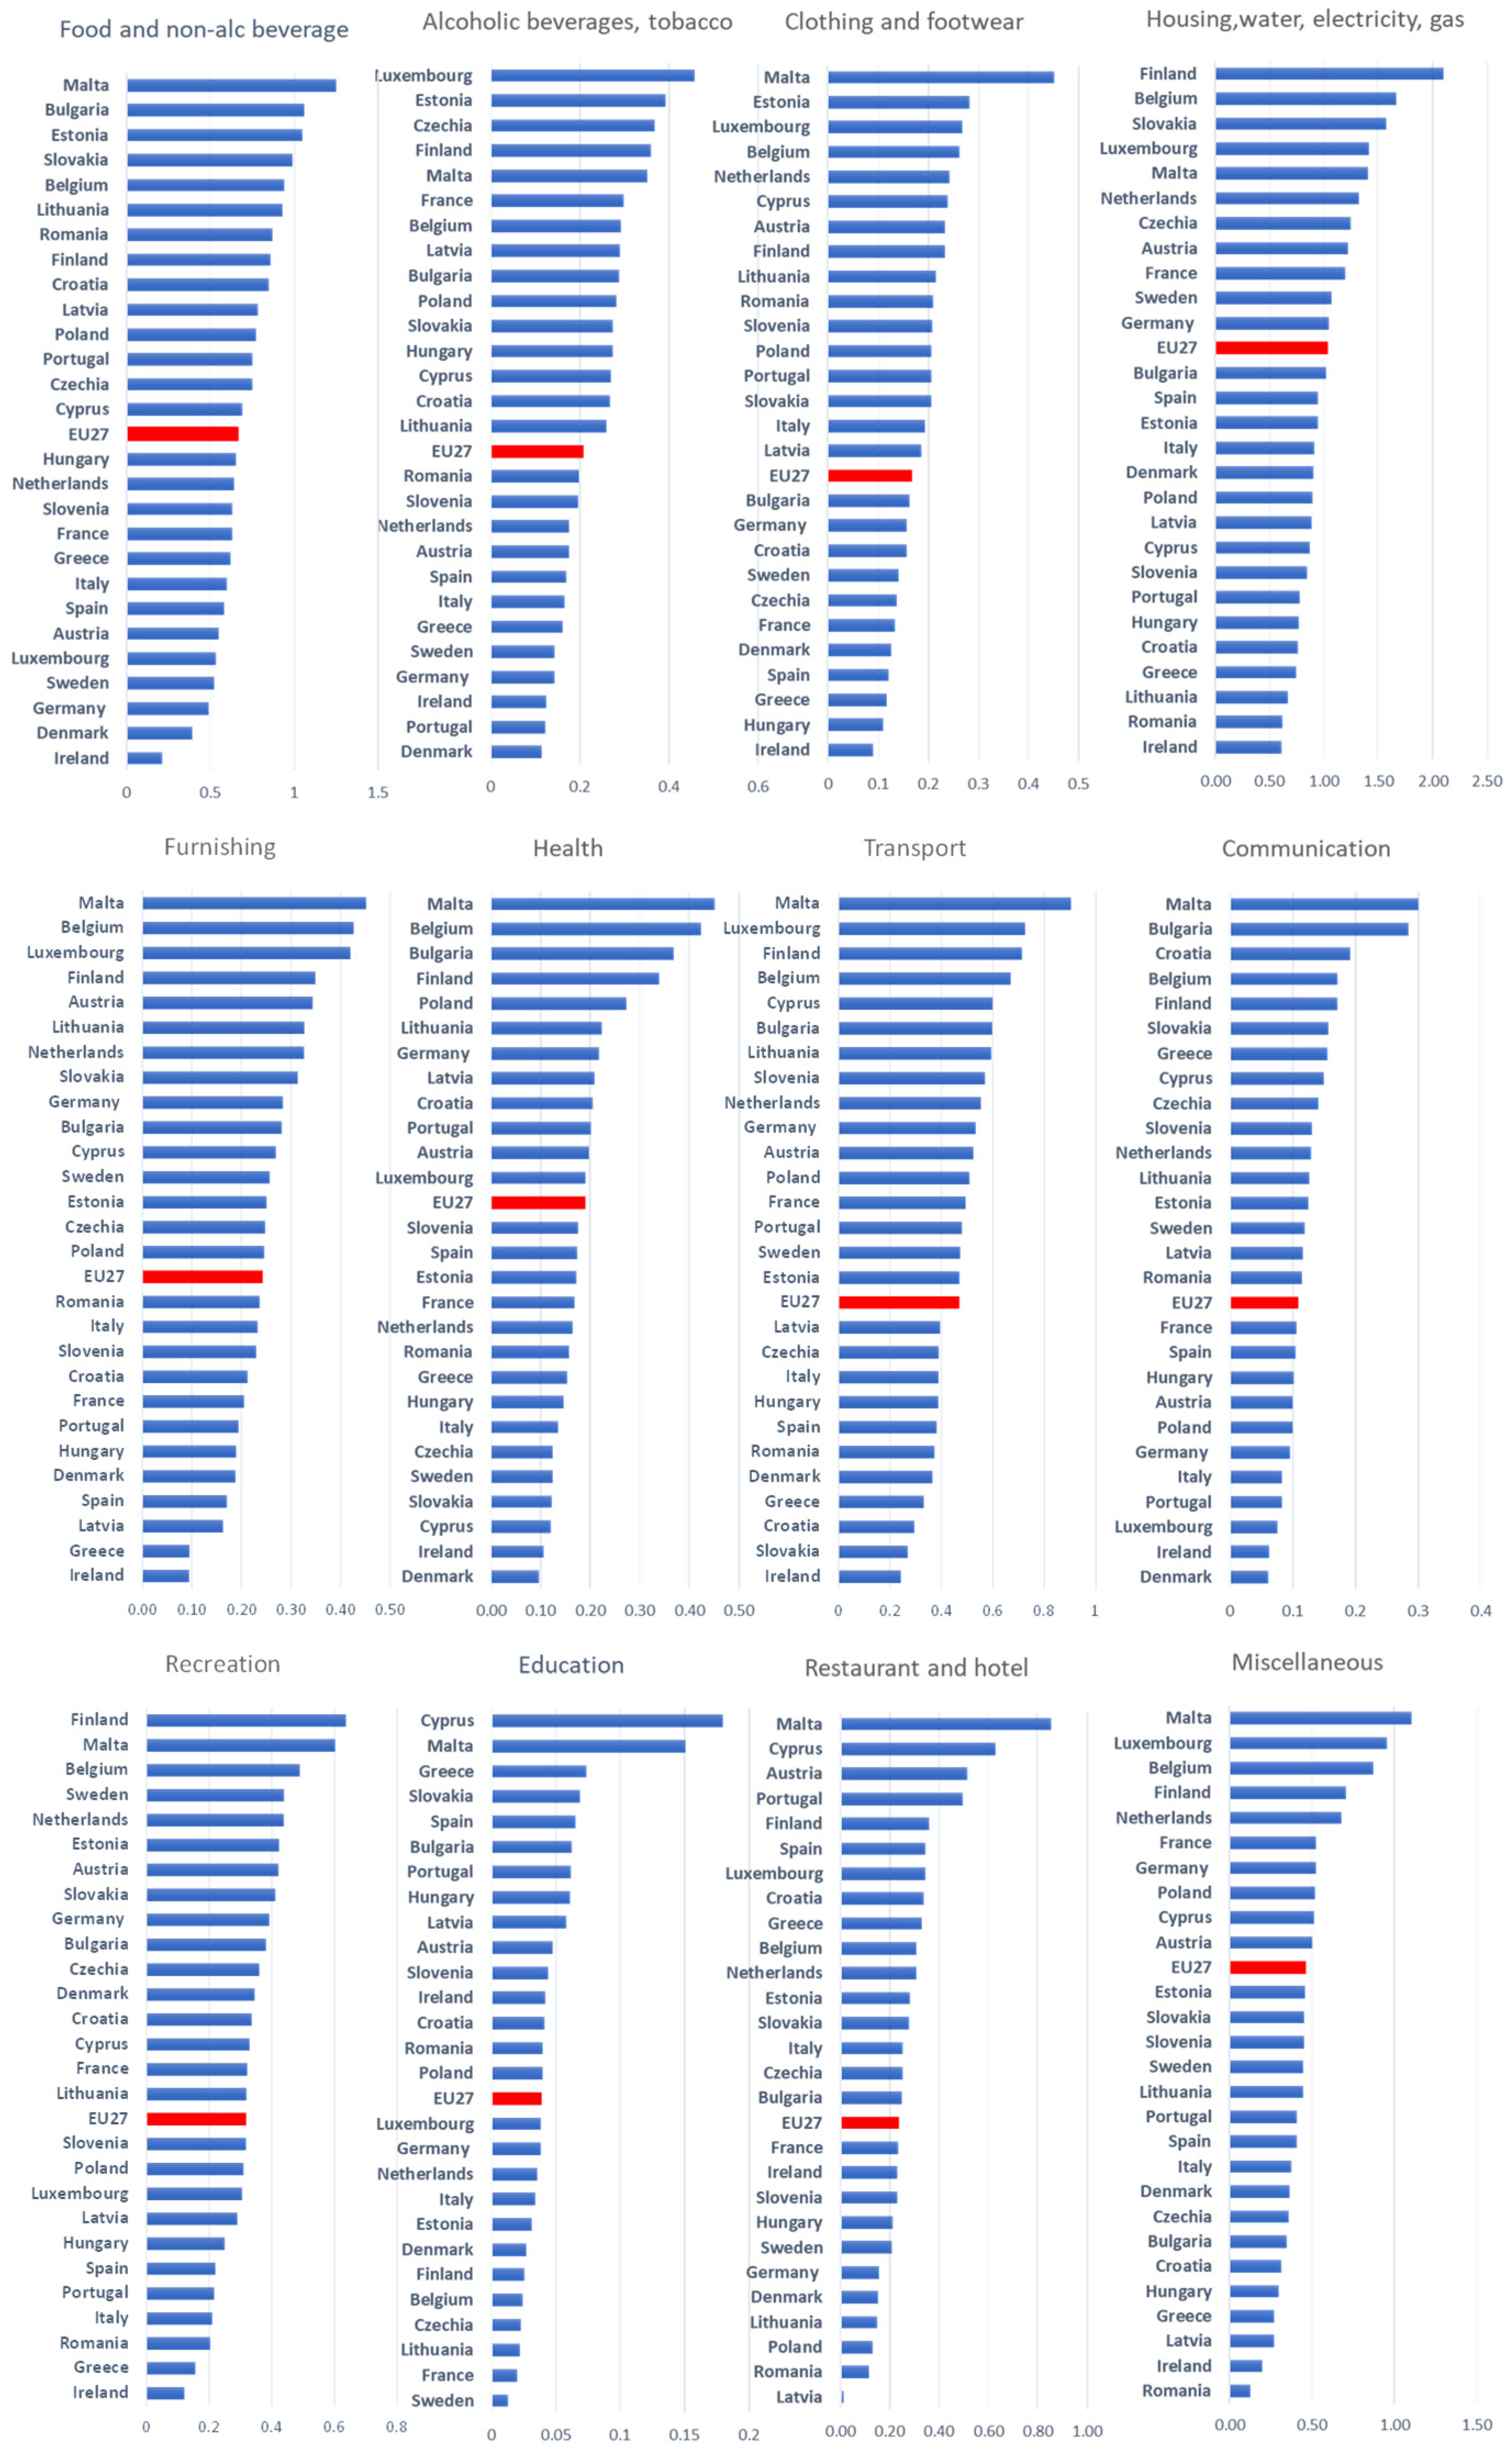
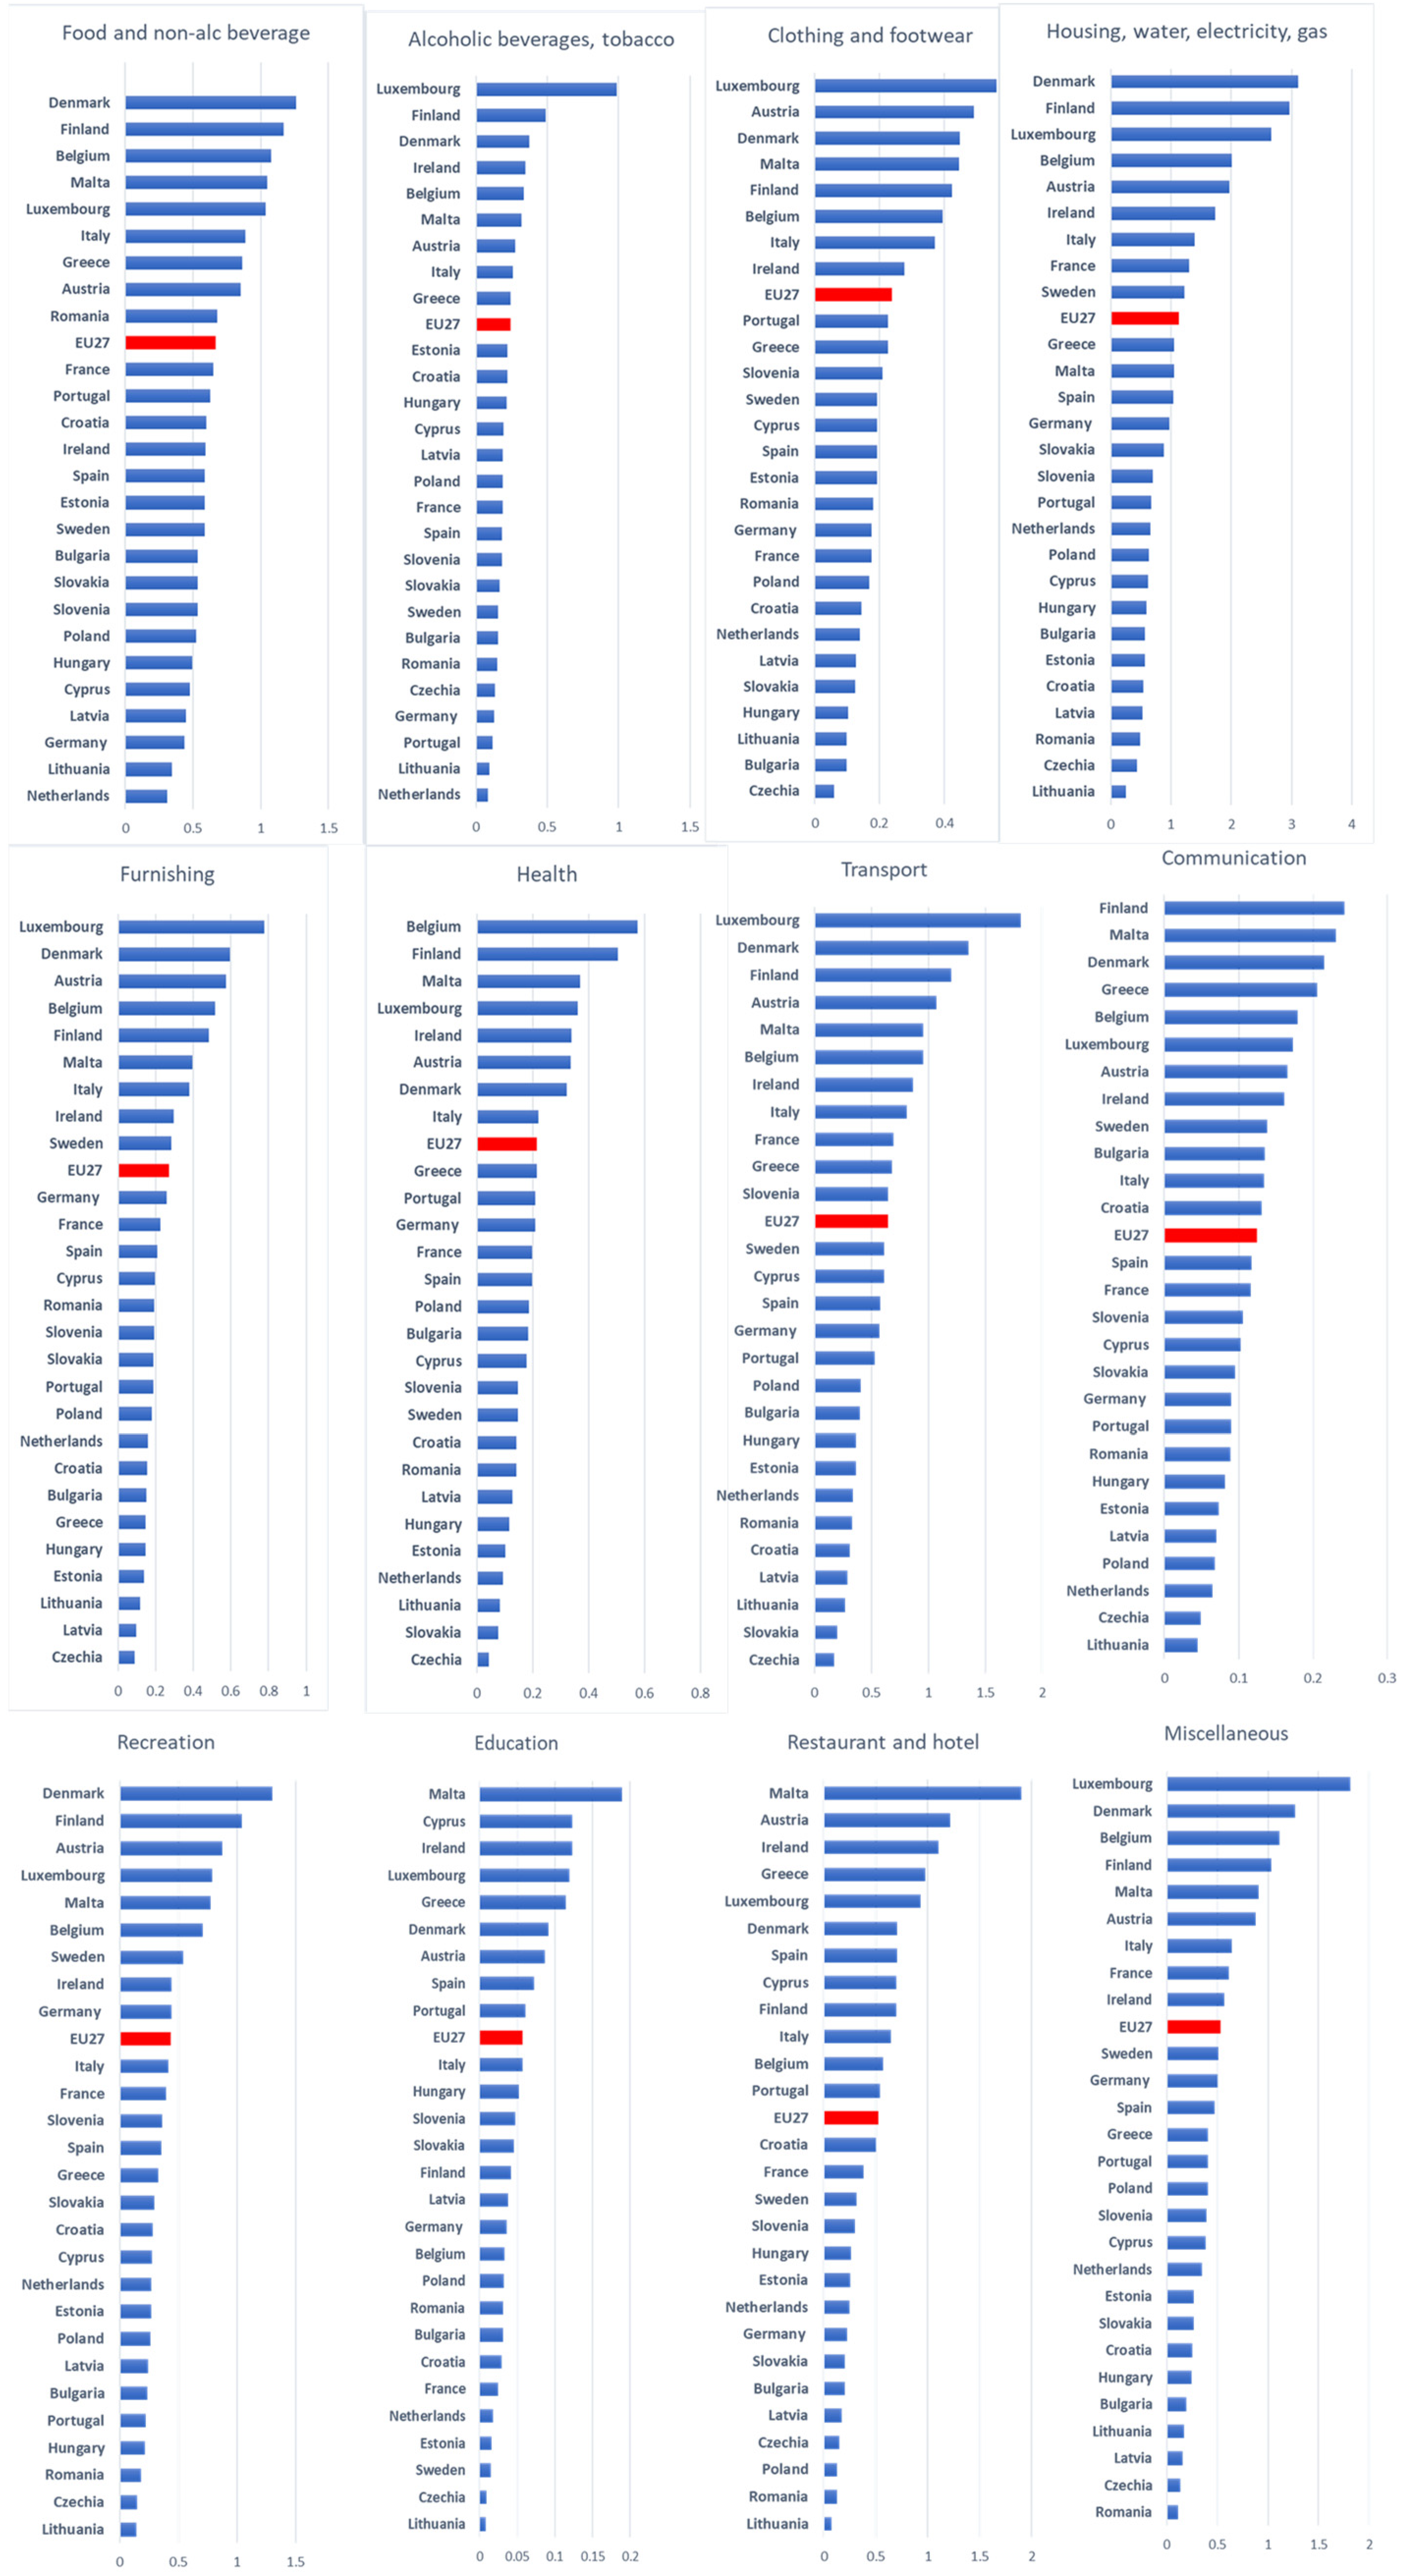
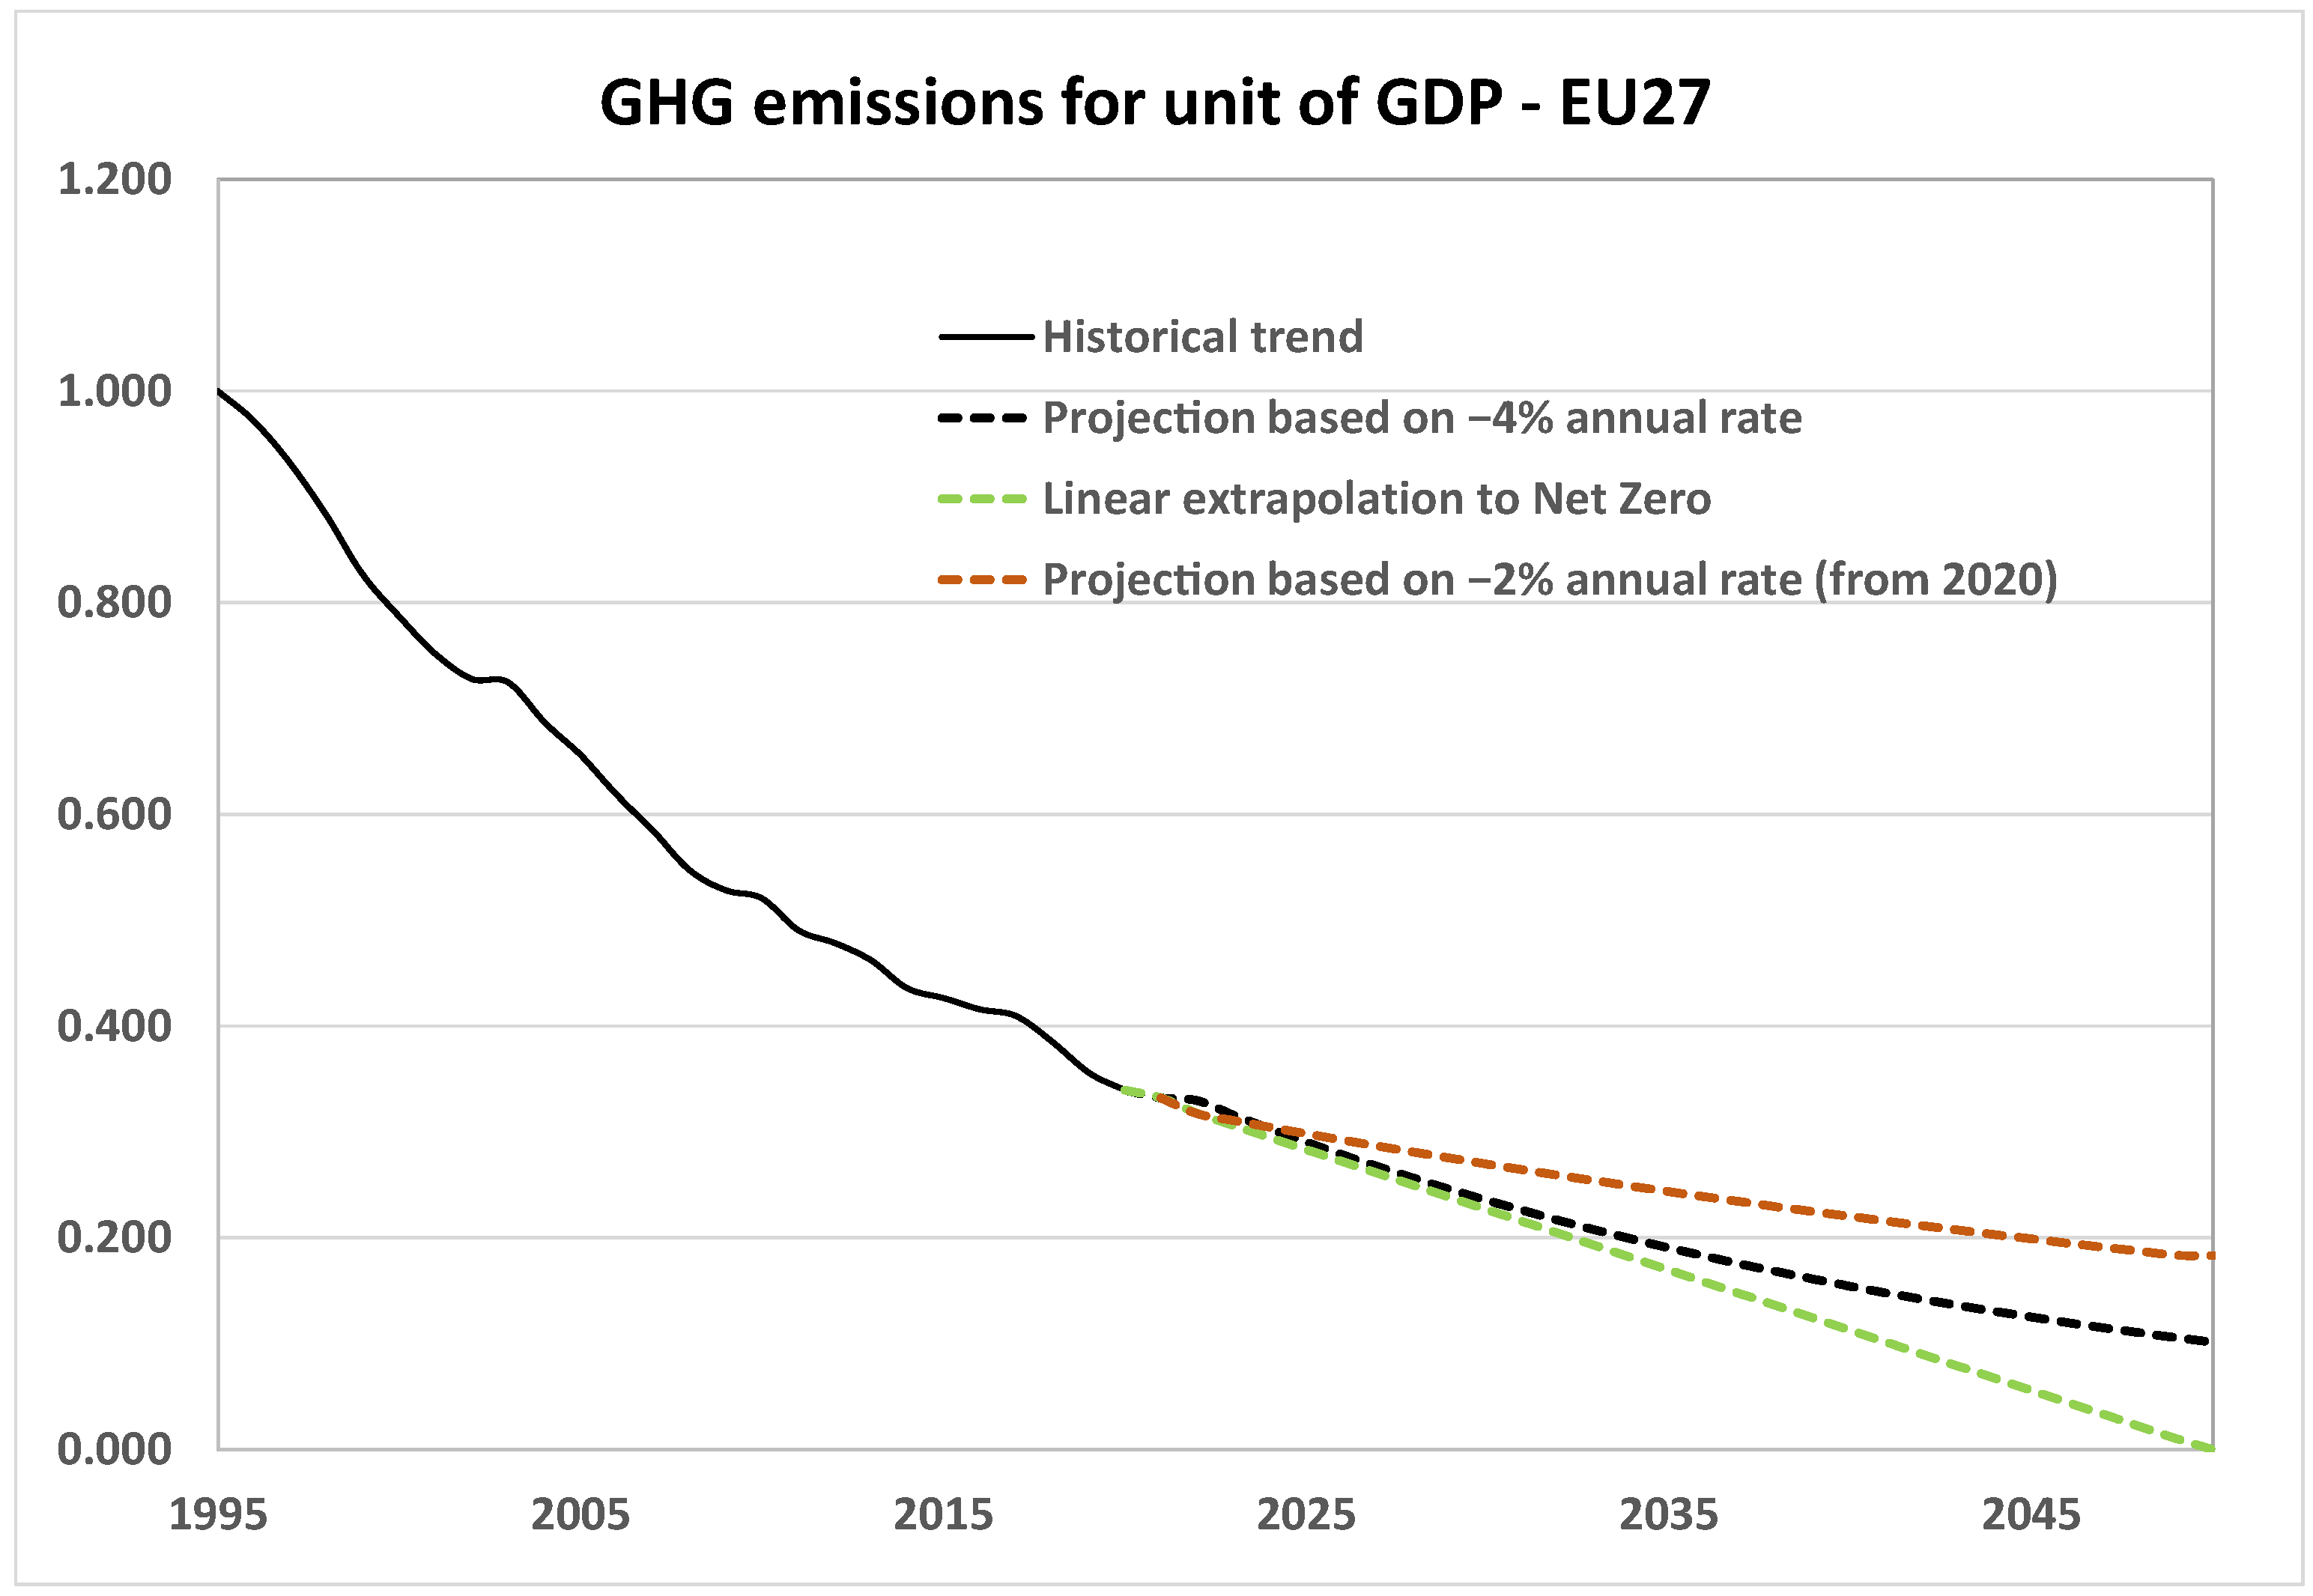
3.1. Assessment EU27 COICOP Expenditures vs. Emissions Intensities of GDP

Household expenditures for COICOP sectors in 2019 [16] are reported in the Appendix (Table A1). To estimate the emissions associated with those expenditures, we adopt the approximation of GHG intensity of GDP by member states [23] for the year 2019 (Appendix, Table A2). Then, the MSs’ emissions by each expenditure category were summed to obtain the distribution of emissions related to expenditures of COICOP categories aggregated for EU27 (Appendix, Table A3). Results are shown in Figure 1.
It must be noted that GDP intensity can be very different between different countries [14], and as a consequence, the same product can have very different associated emissions, as discussed by Ivanova et al. [24], who developed an inventory of carbon footprints associated with household consumption for 177 regions in 27 EU countries. More recently, Ivanova and Wood [25] combined the use of expenditure data with GHG emission intensities derived through multiregional input–output analysis to capture differences in consumption and carbon trends between the highest and the lowest EU emitters. To our knowledge, none of these studies assesses how the average household expenses for the European region can impact an EU carbon budget in compliance with the Green Deal objectives, which is the main aim of this paper and will be discussed in Section 3.3 and Section 3.4.
As a further point, households’ expenditures are not expected to decrease in the future, and, most likely, neither will the associated energy (if not for some energy efficiency breakthrough or efficiency policy), while it is instead expected that emissions related to energy consumption/expenditures will be progressively reduced to achieve a carbon neutral society. Figure 2 reports the energy consumption by household in each MS and across the COICOP categories (Table A4). Food, Transport, and Housing remain the highest energy consumption expenses per household across all the countries, as also obtained by Ivanova et al. [24]. For Housing, most of the countries that exhibit energy higher than the EU27 average are mainly (but not all) from Northern Europe.
Different conclusions are obtained if we look at the combination of individual households’ expenses with GHG intensity of GDP (Figure 3, Table A5).
While EU27 cannot show significative differences in energy and emissions burdens in terms of % per COICOP categories, the analysis between energy/expenditures vs. emissions/expenditure at the country level shows that a higher number of member states surpassed the averaged EU27 energy consumption, while the averaged EU27 carbon emissions are surpassed by a smaller number of member states (Figure 3). Thus, some of the higher COICOP expenditures combined with higher GHG intensity of GDP for a smaller number of countries drive up the emission burden for the whole EU, while energy intensity (regardless of the associated emissions) of the expenditures results more evenly distributed across the European Union. This means that economic decoupling [14] of a smaller number of countries is a fundamental target to be prioritized by a top–down policy action. This action mainly regards private sectors with the support of government intervention, as recently highlighted within the EEIST project [26], in compliance with the mission of the JTF.
The emissions related to COICOP expenses can also be influenced and driven by other types of intervention, such as the circular economy and increasing environmental awareness to bring about behavioral change. This is evident when exploring the recent surveys [27] from the “Special Eurobarometer 501: “Attitudes of European citizens towards the Environment” survey data Eurobarometer 92.4 (EB 94.2), which is a follow-up from the “Special Eurobarometer 468” survey data Eurobarometer 88.1 (EB 88.1), October 2017. In both surveys, citizens were invited to answer about their behavioral attitude in taking action to tackle several environmental issues (reducing the use of plastics/packages, awareness towards ecolabels, quality and ways of tackling air pollution, mobility habits, etc.).
In comparing the two surveys (Figure 4), significant changes in citizen behaviors were detected across almost all the categories between 2017 and 2019. Mobility habits have not changed a lot between 2017 and 2019, even though citizens declared a desire to reduce their use of cars. More detectable changes are seen in using products: citizens have improved their efforts in reducing the use of plastics and packaging and paying attention to green labeling. Energy and water saving were also improved in 2017–2019. In the latest survey (2019), the introduction of activities such as recycling and repairs and how people have started to consider opportunities for a “second life” for products are notable. These activities might also represent a new category of expenses to be incentivized over buying new products. Another interesting category is that of sustainable food, with several citizens preferring to buy local food. Moreover, the “Speaking” section also shows how awareness about environmental issues is rising across genders and ages.
Based on the previous scenarios, our study follows with an investigation of the composition of the expenditures of the EU27 as a whole and how those can vary with prices, incomes, on which the household’s capacity of expenditure relies, and some exogenous factors, as explained in the Materials and Methods section. Then, the cumulative emission impact between 2020 and 2050 is compared with the 2050 carbon budget estimated for EU27.

3.2. Assumptions in Households’ Expenses Scenarios Projections

In this section, Equation (1) is used to construct quantitative scenarios by making assumptions for households’ disposable income, prices, and ExNEF. Forecasts on future expenditures are explored within three scenarios: ‘higher expenditure’, ‘business as usual’, and ‘lower expenditure’, within the categories all-COICOP, housing, food, and transport in EU27.
Business as usual: Future expenditures are forecasted with the assumptions for the growth in real household disposable income, prices, and ExNEF based on the historical trend.
Higher expenditures: In this scenario, real household disposable income grows faster than in the BAU scenario, and the real price decreases. In addition, ExNef is higher than in the BAU scenario. These assumptions aim to simulate an accentuated economic growth scenario in comparison to BAU, a scenario based on the unconditional exploitation of resources (without considering resources as limited), less environmental awareness in governments and individuals, and/or a slowdown in technical progress (ExNef).
Lower expenditures: In this scenario, real household disposable income is lower than in the BAU scenario due to the assumption of caps on income/wealth [28], and real price growth is higher (higher energy/input taxes to favor implementation of new energy infrastructures). ExNef is lower due to an acceleration in technical progress. These assumptions aim to simulate an optimal transition scenario where governments and individuals assume best practices to reduce expenditures.
To simulate higher and lower expenditures in the future, prices are increased +1%/−1% per year in the lower/higher expenditure scenarios; income is increased −1%/+1% a year in the lower/higher expenditure scenarios; ExNef slopes are increased −0.5%/+0.5% in the lower/higher scenarios These assumptions do not pretend to be an effective forecast for future expenditures, rather they aim to define expenditures’ boundaries so that an expenditures carbon footprint can be quantified and discussed.

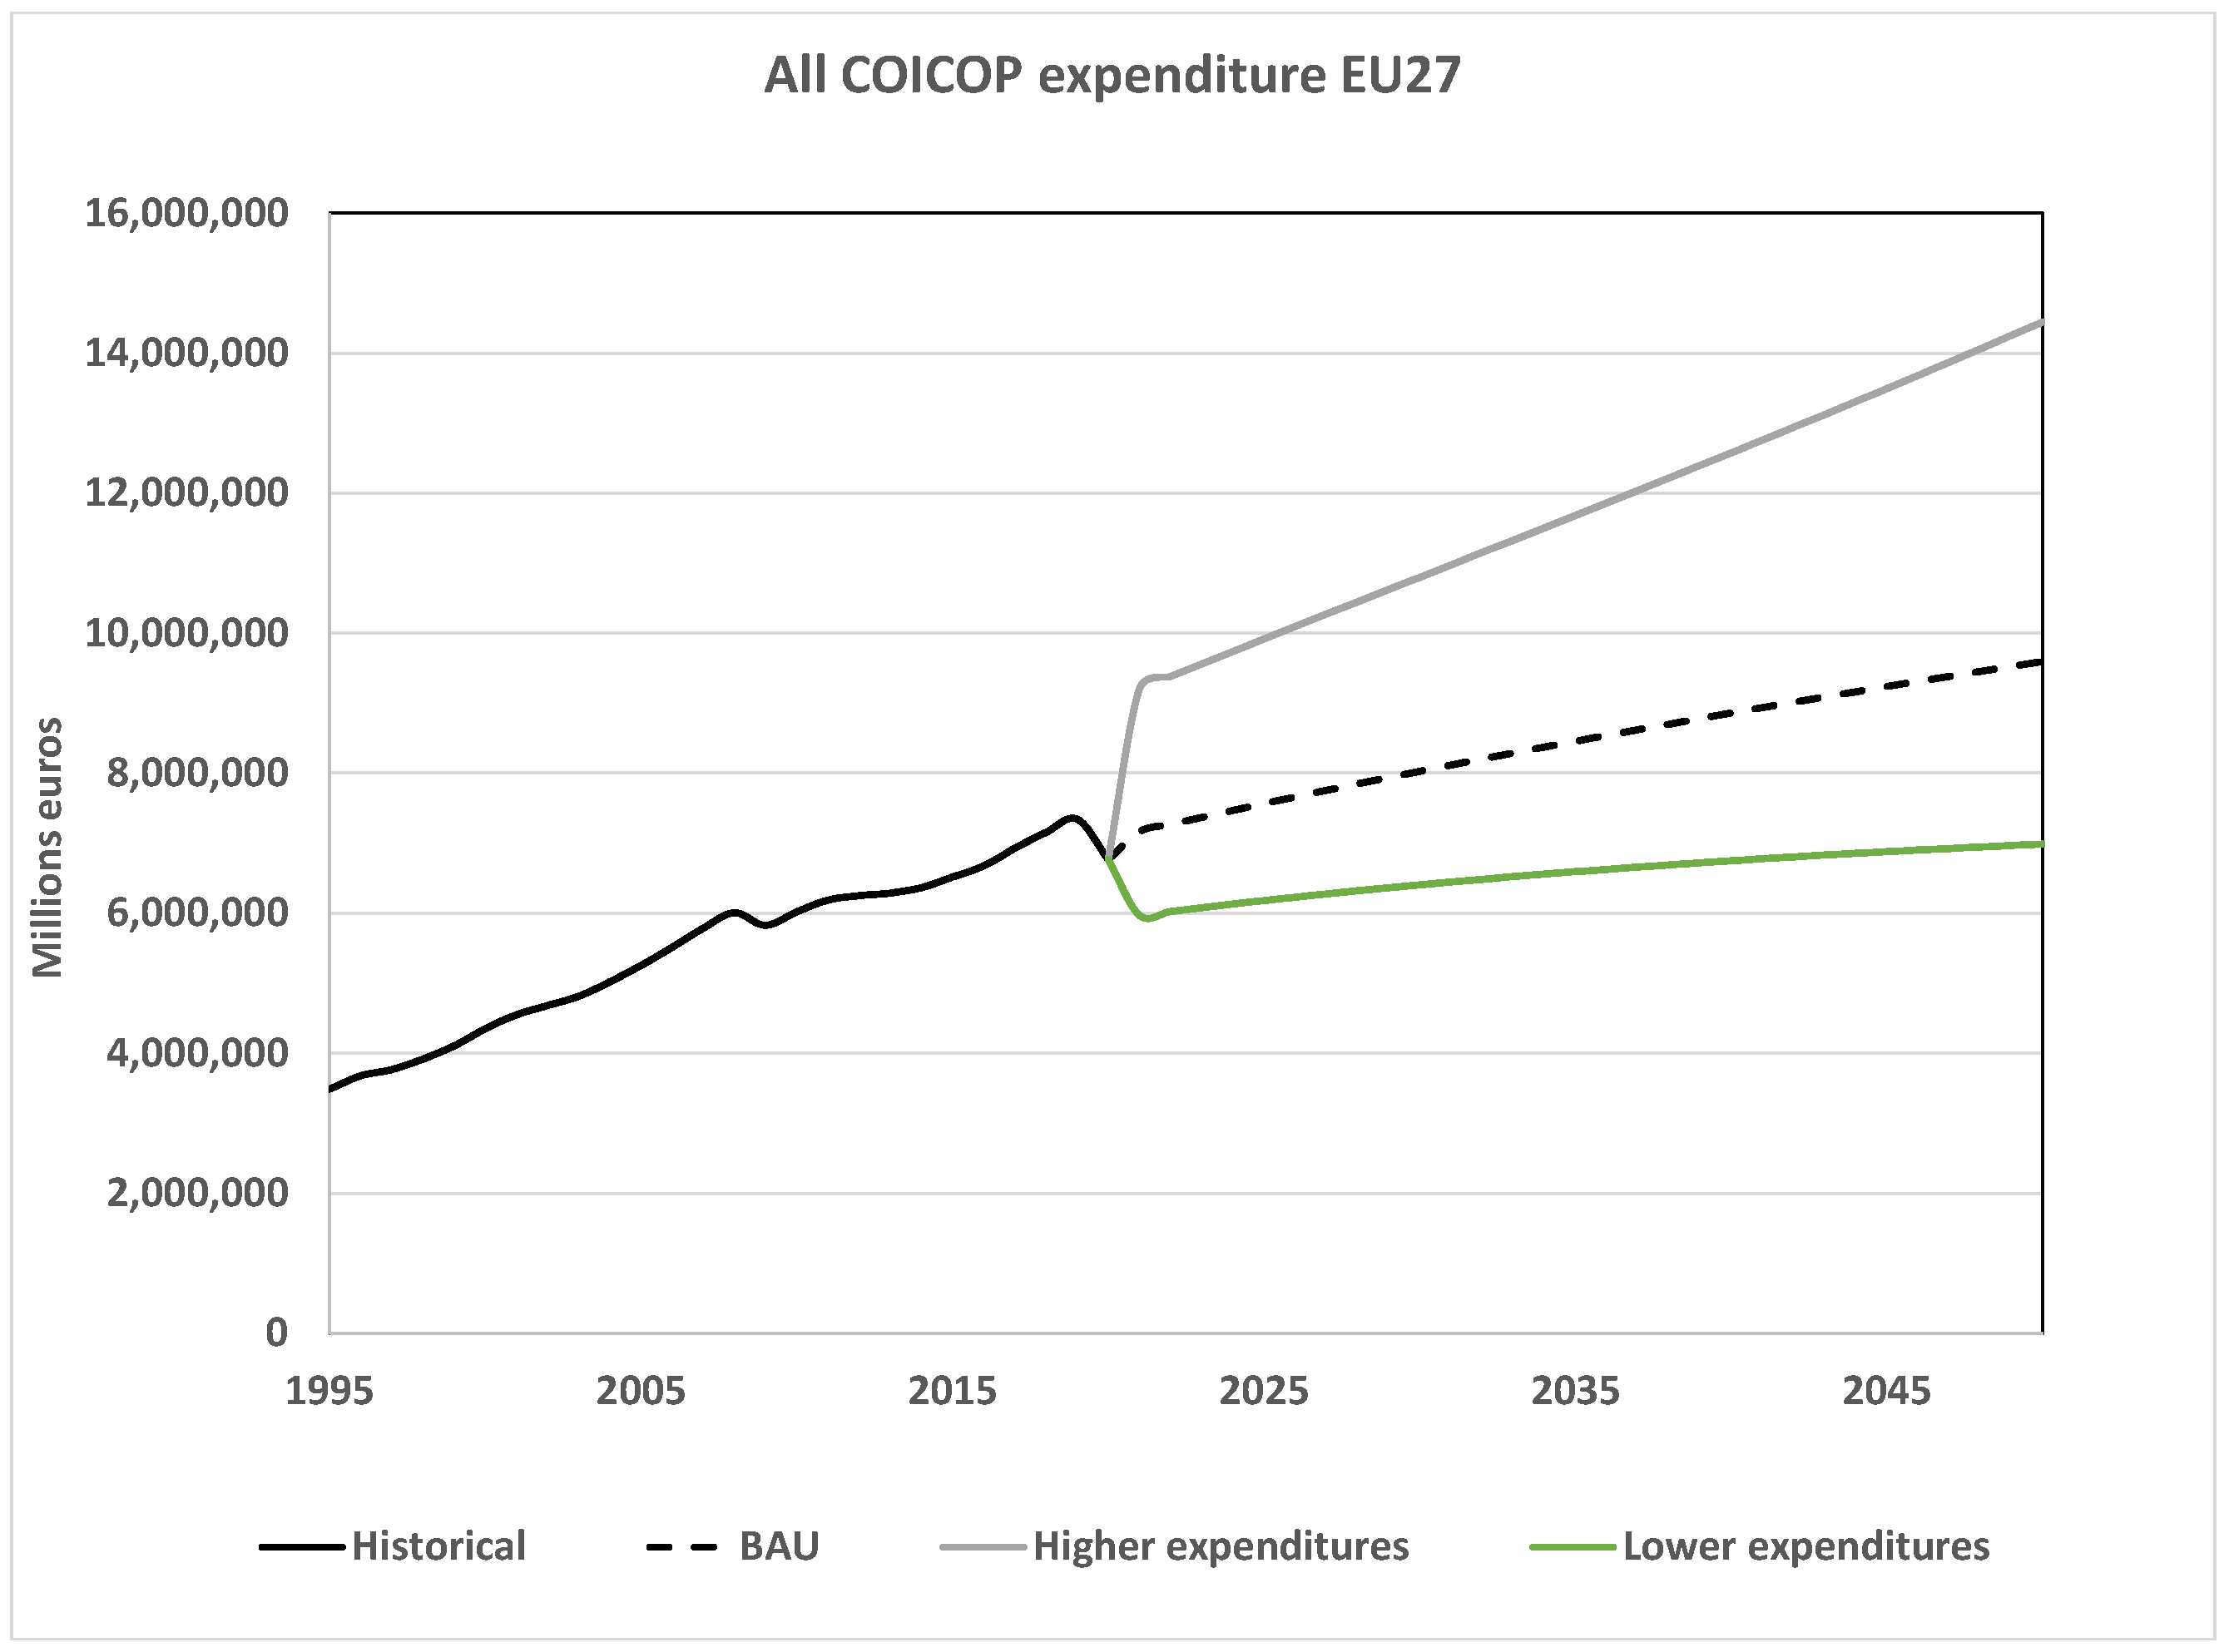
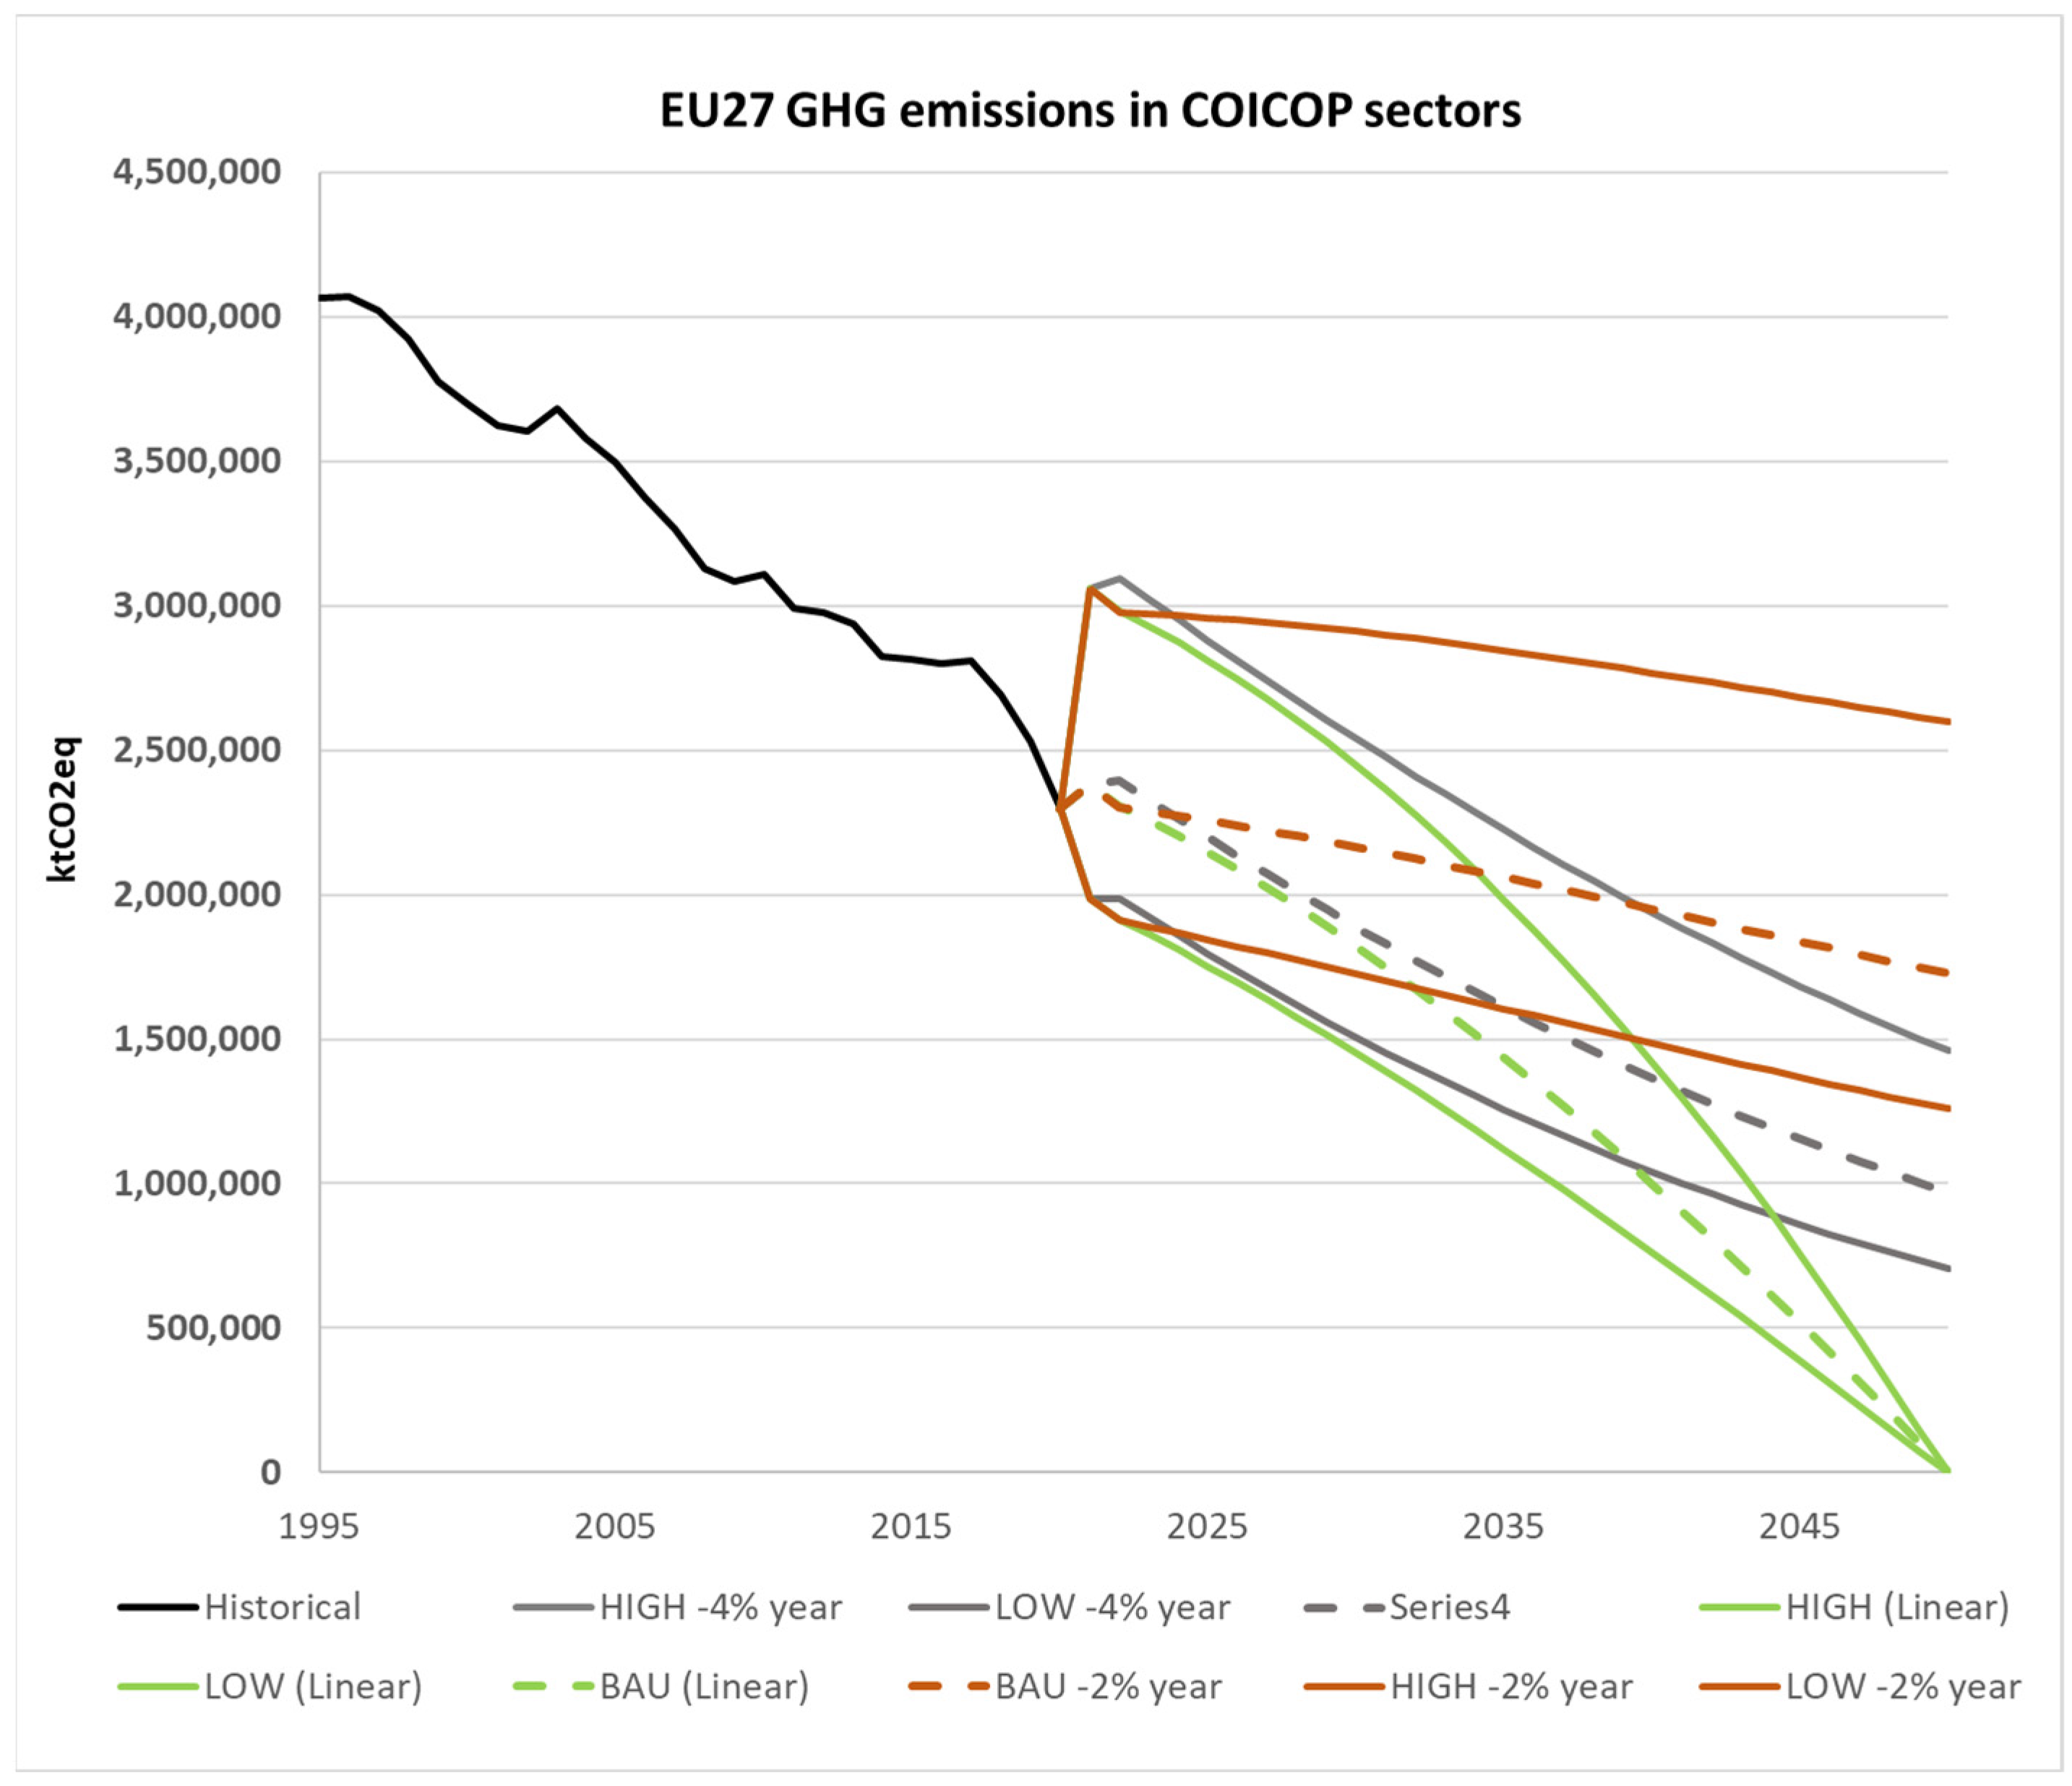
3.3. EU 27 COICOP (All Categories) Projections

In this section, scenarios of aggregated COICOP sectors for EU27 are discussed. Expenditures are from Eurostat, as are prices [20] and incomes [19].
Figure 5 reports the estimation of the expenditure projections for all EU27 COICOP sectors up to 2050 within all the scenarios (BAU, higher expenditure, lower expenditure). As a result, the EU27 all-COICOP expenditures composition is based on 51% for price, 46% for income, and 3% for ExNef, evidencing that no breakthrough has perturbed the continuous growth in households’ expenditures since the 1980s.
To assess the emissions embedded in household expenditures, we considered three GDP decoupling scenarios: BAU follows the current EU average annual decoupling improvement rate of around 4% GHG intensity of GDP since 1995. High emissions scenarios report an annual decoupling improvement rate lower than BAU of 2% from 2022. This scenario intends to simulate the persistence of the insufficient commitments [3] promised by the member states in their National Energy and Climate Plans and Long Strategy Plans to put the EU on the right path to 2030 and 2050 decarbonization objectives. The low emissions scenario considers a linear projection of GDP decarbonization, simulating that all the possible efforts/synergies will be employed by the member states to complete decarbonization by 2050 (Figure 6).
Based on the emissions intensity of EU GDP according to the projections in Figure 6, we can assess emission trajectories and a carbon budget associated with the household expenditures in Figure 5 in the BAU, lower, and higher expenditures scenarios. The results are in Figure 7.
The emission intensity of GDP (grey lines scenarios), which accounts for a GDP decarbonization rate of −4% per year, does not lead to complete decarbonization of the expenditure by 2050 with a budget that ranges from 64 GtCO2eq, 47 GtCO2eq, and 37 GtCO2eq, respectively, in the higher, BAU, and lower expenditure scenarios. Recent studies [13,29,30] assessed that the total carbon budget for EU27 from 2020 to 2050 to achieve complete decarbonization by 2050 and the Green Deal intermediate targets within the 2 °C scenario is around 60 GtCO2eq. And considering that household consumption behaviors are responsible for 72% of global greenhouse gas emissions [31], a percentage that can rise higher for consumption-based countries like the UK [32] and, similarly, for the MSs, the carbon budget associated with household consumption in EU27 should not surpass 42 GtCO2eq. Our study shows that sticking with a business-as-usual rate for both emissions intensity of GDP and household expenditure rate leads to cumulative emissions of 47 GtCO2eq, and, therefore, the EU will not achieve complete decarbonization by 2050 and will fail to meet the Paris Agreement commitment.
The situation becomes worse if we consider the high emission intensity of GDP scenario projections with 46, 59, and 82 GtCO2eq of consumed budget in lower, BAU, and higher expenditure scenarios, respectively. Lower GDP emission intensity decarbonization represents the optimal path, with 30, 38, and 50 GtCO2eq of consumed budget in lower, BAU, and higher expenditures scenarios. However, the higher expenditure scenario result is out of the budget, and, therefore, even with lower GDP emissions intensity, going forward, household expenditure projections should, at worst, follow a business-as-usual trajectory.
We, therefore, see that the appropriate use of SFC is required to support the EU in either achieving a faster improvement in GHG emissions intensity of the GDP or in keeping household expenditure projections down. This strategy, delivered through a partnership between economic sectors, households, and government to maximize the likelihood of attaining the low expenditure–high GDP decoupling scenario in a just and equitable manner, should be carefully planned and monitored at the MS level.

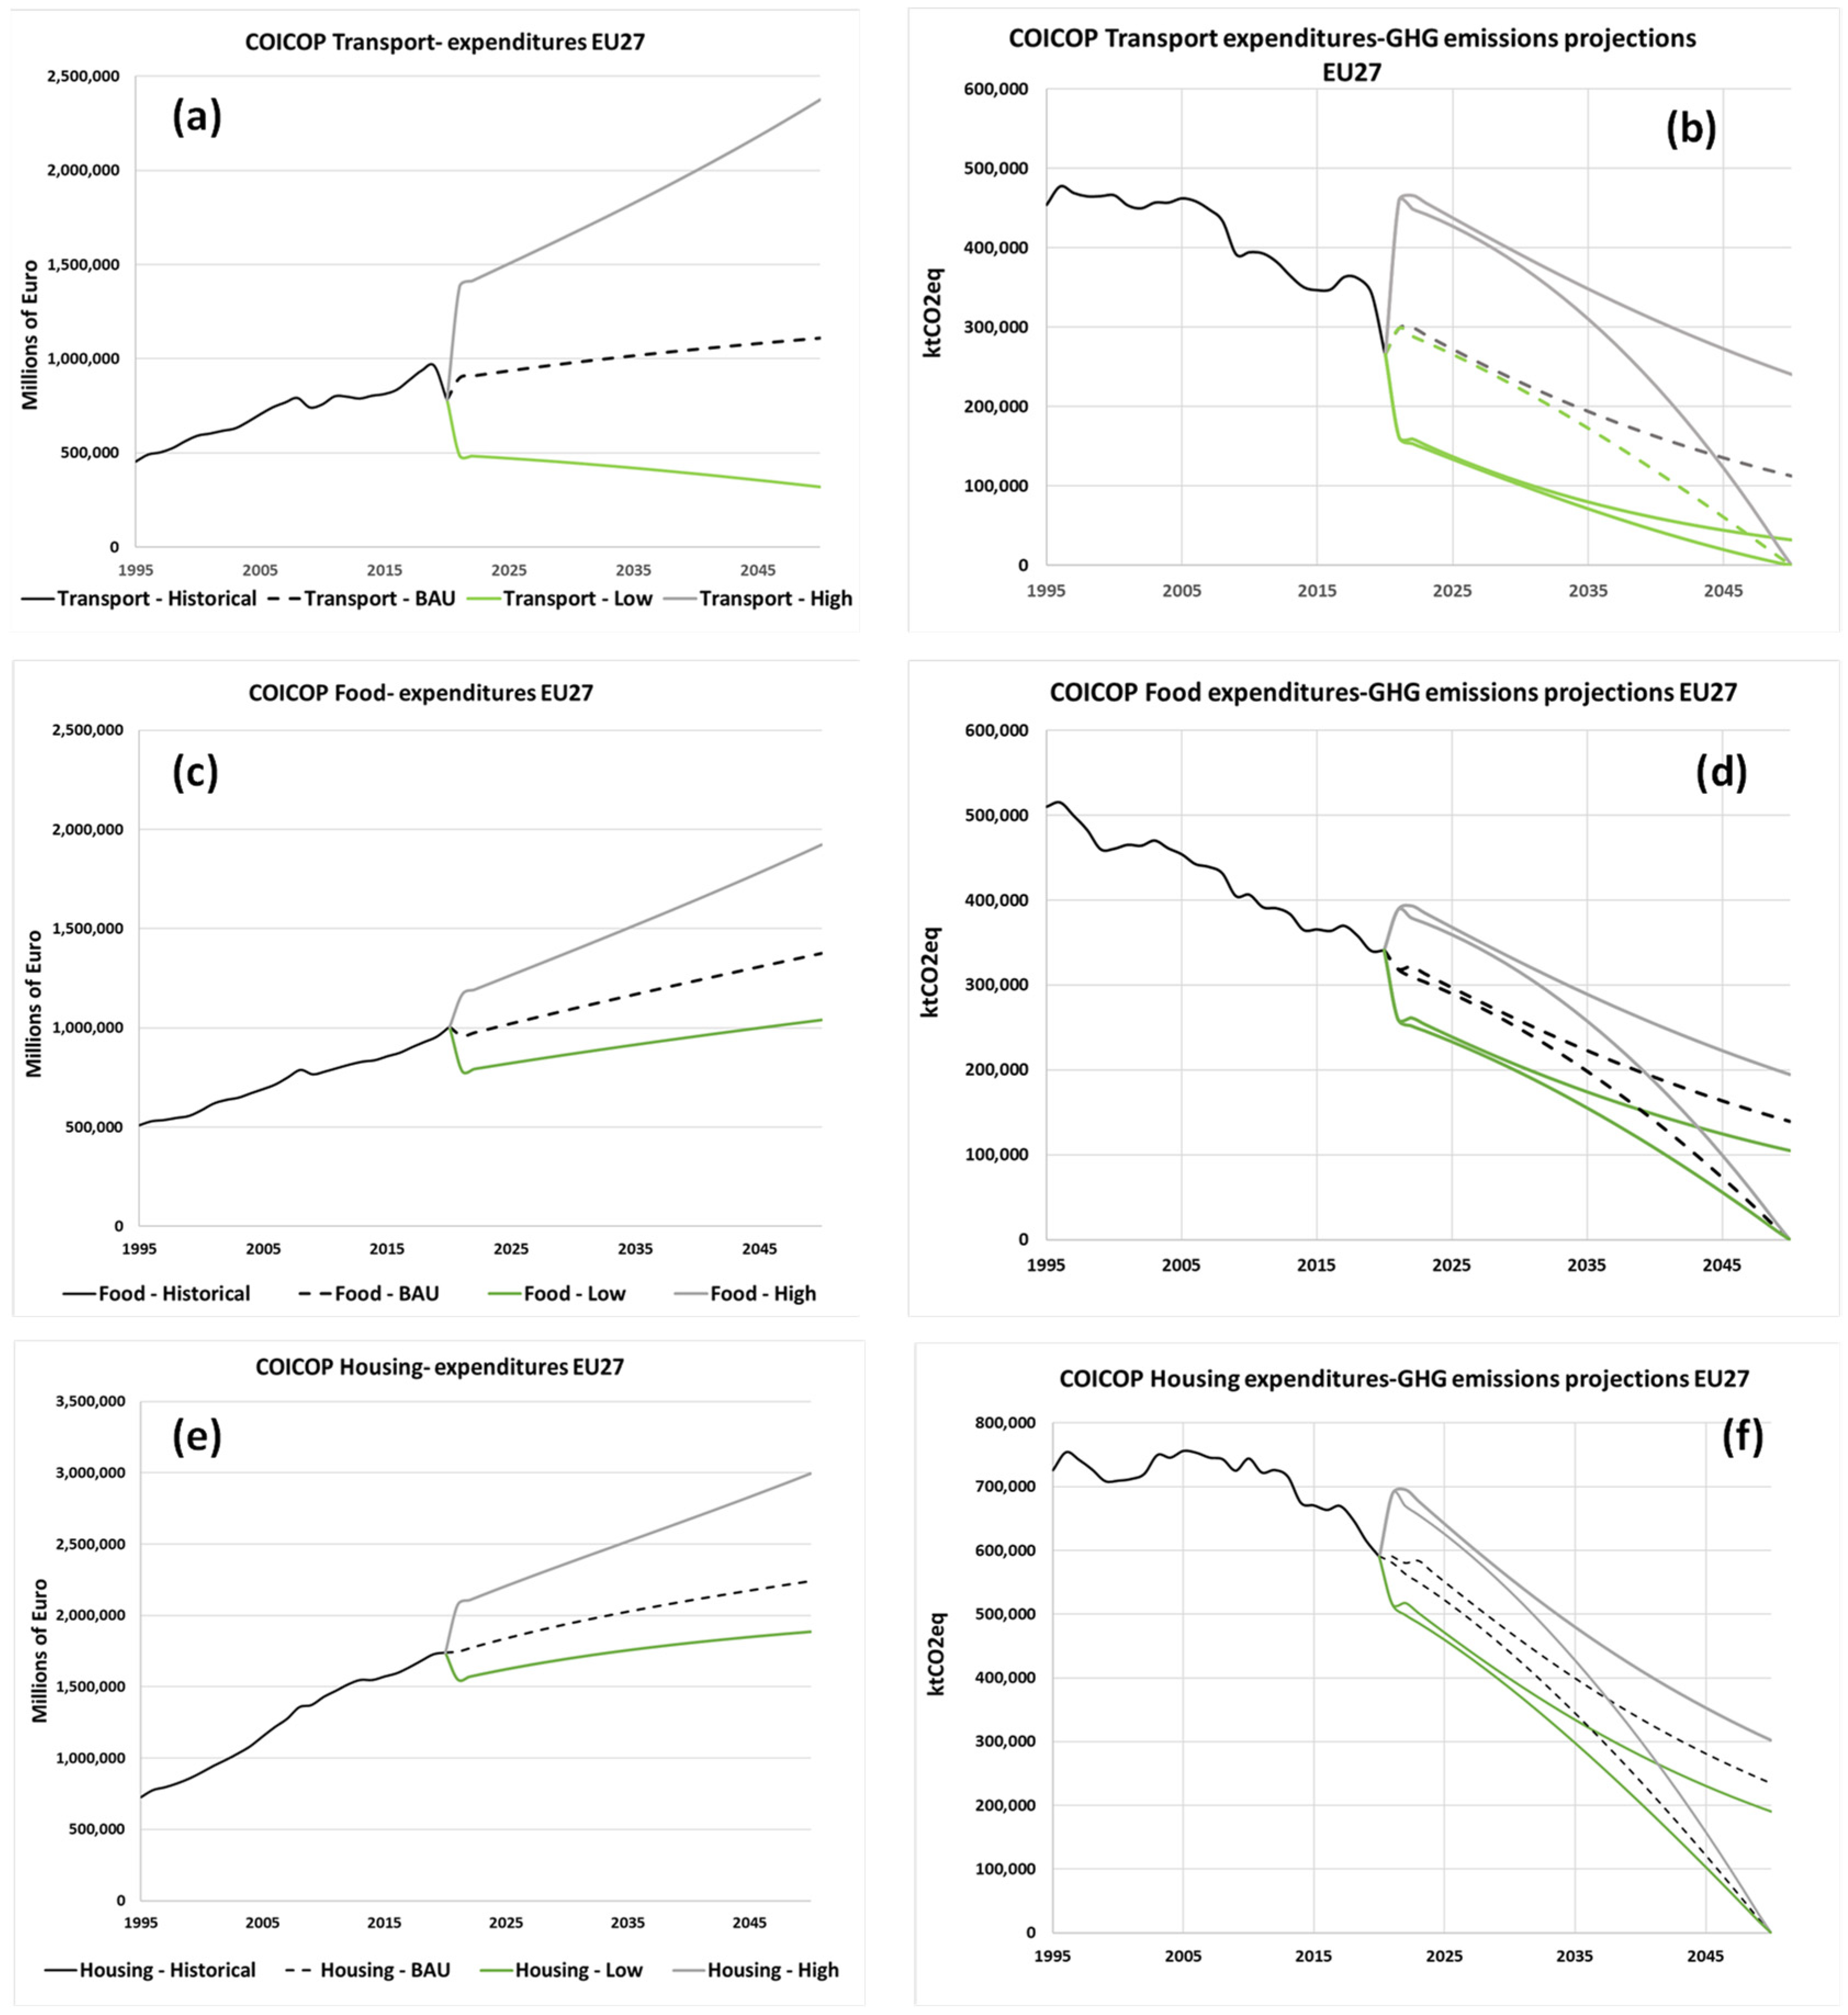
3.4. EU 27 COICOP Projections for Transport, Food, and Housing

An investigation of the emissions related to the Transport, Food, and Housing sectors is proposed to assess the relative impact of those categories vs. the total COICOP expenses discussed at Section 3.3. Due to the scenario assuming −2% year of GDP decoupling not achieving the Paris target under any assumptions, the analysis for Transport, Food, and Housing will be conducted for the GDP decoupling scenarios low (linear) and BAU (−4% year). Figure 8 shows the expenditure projections for the Transport, Food, and Housing categories. The analysis of the obtained linear regression coefficients in each category shows that, across all three categories, income plays again a dominant role in composing the expenditure’ historical structures, with a higher contribution for transport, where income represents more than 50% of the expenditure, while prices account for around 30% and ExNef around 15%.
For Food and Housing, income weighs around 40%, while prices are around 30%, and the influence of the historical ExNef is about 30%.
Transport expenditures and emissions are the most uncertain with regard to projections. Whereas Engel’s Law [33] predicted a regular drop in the relative importance of food as income grows, no trend has been observed for the influence of income on transport expenditures. Expenditures related to transport are usually assessed by country-level variables such as urbanization [34], car ownership [35], and aging of the population [36]. For instance, Europe’s level of urbanization is expected to increase to approximately 83.7% in 2050 [37], with energy fuel prices playing a dominant role in guiding households’ expenses [38].
Across the EU27 member states, specific support should be targeted at each of these variables to reduce transport emissions, including direct income support for electric vehicles, which can help in accelerating the switch to fully electric mobility [39,40], accelerating the internal combustion engine phase out [41] and increasing the use of alternative fuels for cars [42]. This is included in the ExNef term, related to accelerating innovation and introducing a breakthrough in transport technology, which was less relevant in the historical picture, as “household transport” has not experienced a real alternative since the 1980s. As ExNef deals with innovation, it can assess the effectiveness of JTF, which supports the economic diversification and reconversion of the territories by means of research and innovation and the creation of new firms (for instance, producing fuel cells and batteries and their recycling [43]). This also shows that any policy that foresees a synergy between the two funds (JTF and SCF) could optimize the outcomes of the intervention on income and innovation.
Transport emissions are 10 GtCO2eq, 5.9 GtCO2eq, and 2.7 GtCO2eq, respectively, in the higher, BAU, and lower expenditure scenarios, considering a GDP exponential decoupling and partial decarbonization by 2050. With sharper decarbonization of the GDP in the linear scenario, the budgets lower to 8.1, 4.8, and 2.3 GtCO2eq, respectively, in the higher, BAU, and lower expenditure scenarios.
With regard to Food expenditures, the historical composition considers almost the same weight for both prices and income, around 40% each. In this case, prices play a more dynamic role in the expenditures as well as in showing a more accentuated contribution to underlying trends, as income for EU27 has an almost stable increase in the considered series of data since 2005. On the side of the emissions related to household expenditures, Food has a range from 8.6 GtCO2eq, 6.7 GtCO2eq, and 5.3 GtCO2eq, respectively, in the higher, BAU, and lower expenditure scenarios, considering a GDP exponential decoupling and partial decarbonization by 2050. With sharper decarbonization of the GDP in the linear scenario, the budget is lowered to 6.9, 5.4, and 4.3 GtCO2eq, respectively, in the higher, BAU, and lower expenditure scenarios.
Housing expenditure composition is very similar to Food, showing the same weight on price and income and more contribution in ExNEF in comparison to transport expenditures. Housing has a range of 15 GtCO2eq, 11 GtCO2eq, and 10 GtCO2eq, respectively, in the higher, BAU, and lower expenditure scenarios, considering a GDP exponential decoupling and partial decarbonization by 2050. With sharper decarbonization of the GDP in the linear scenario, the budget is lowered to 12, 9.5, and 8.3 GtCO2eq, respectively, in the higher, BAU, and lower expenditure scenarios. However, this assessment is an aggregated result as the Housing category includes housing cost, energy cost, and cost related to house maintenance, which have undergone very different trajectories in the past and may be expected to continue in the future along unique pathways. As expected, Housing plays the dominant role with higher emissions in comparison to the other two categories even though, together with food, it is a sector where prices and household habits, as highlighted by the Eurobarometer surveys, can play a significant role in reducing the emissions of future expenditures with appropriate policy.

4. Conclusions

This paper describes how EU27 households’ expenditures in all-COICOP, Transport, Food, and Housing categories are estimated to vary in the future under three different expense scenarios: BAU, higher, and lower expenditures. These scenarios were explored to give a first assessment of the emission burden related to those future expenditures, obtained considering the approximation of GHG intensity of GDP by member states. The emission burden has been estimated by assessing the carbon budget associated with the households’ expenditure projections to be compared with the EU27 carbon budget. The investigation aims to support the design of policies and mitigation actions concerning the use of the Social Climate Fund and Just Transition Fund to reduce emissions across EU27.
The investigation highlights that higher COICOP expenditures combined with higher GHG intensity of GDP for a smaller number of countries drive up the emission burden for the whole EU, while energy intensity (regardless of the associated emissions) of the expenditures results in more evenly distributed emissions across the European Union. This means that the economic decoupling of this smaller number of countries is a fundamental target to be prioritized by the Just Transition Fund.
Investigation on EU27 all-COICOP expenditures shows that the related carbon budgets calculated adopting the approximation of GHG intensity of GDP means that it is likely that the current trajectory of improvements in the GHG intensity of GDP across the EU coupled with the current trajectory of household expenditures will result in the EU missing its Green Deal objectives related to the Paris Agreement. This evaluation suggests that further decarbonization potential embedded in consumer behavior, alongside improvements in industrial efficiency, is required.
The carbon budgeting approach adopted in our study can support the definition of country- and COICOP-sector-specific carbon reduction objectives, as these are currently not yet set. The proposed mathematical model for households’ expenditure projections can be used to report the carbon budget of households and, in this sense, monitor the effectiveness of the measures funded by the Social Climate Fund (SCF) and the Just Transition Fund (JTF). However, the emissions burden obtained by means of averaged GHG intensity of the GDP results in a rough approximation of outcomes, and more accurate (sector or even product level) indicators should be developed across the EU member states.

Author Contributions

Conceptualization, I.P. and A.J.; methodology, I.P.; software, I.P.; validation, I.P., A.J. and D.N.; formal analysis, I.P. and D.N.; investigation, I.P.; resources, I.P.; data curation, I.P. and A.J.; writing—original draft preparation, I.P.; writing—review and editing, A.J. and D.N.; visualization, I.P.; supervision, A.J.; funding acquisition, I.P. and A.J. All authors have read and agreed to the published version of the manuscript.

Funding

This research was funded by the PLEDGES project—European Union’s Horizon 2020 MSCA IF GA ID: 101023109.

Data Availability Statement

The data presented in this study are available in Appendix A.

Conflicts of Interest

The authors declare no conflict of interest.

Appendix A

Table A1. Households’ expenditures for COICOP sectors in 2019 (Eurostat).
Expenditure
2019
(Million Euro)
Food and Non-Alcoholic BeveragesAlcoholic Beverages, Tobacco and NarcoticsClothing and FootwearHousing, Water, Electricity, GasFurnishingHealthTransportCommunicationRecreationEducationRestaurant and HotelMiscellaneous
Belgium29,687.69289.910,895.055,410.114,171.615,843.326,272.94944.319,468.8922.915,713.830,675.2
Bulgaria7076.22037.21307.27567.51996.22449.35258.81794.83147.2407.32641.72534.2
Czechia16,306.08412.23848.528,197.45611.32614.110,927.33105.09610.9560.39609.28418.5
Denmark16,247.74804.65785.340,048.27657.54153.917,406.42780.316,833.01179.29107.216,344.4
Germany185,729.055,310.074,602.0412,194.0109,327.088,880.0241,477.038,276.0186,765.015,434.094,806.0214,228.0
Estonia2626.0995.5855.52537.7609.8455.41610.9326.21203.671.61130.51198.6
Ireland8787.45108.94082.225,590.14367.64981.012,756.72388.36523.11811.516,248.38344.4
Greece22,086.76249.75756.726,722.43756.25476.817,350.05242.48333.22907.724,917.310,374.6
Spain92,610.028,870.030,180.0162,803.033,158.030,966.091,065.018,488.055,454.011,426.0110,846.073,814.0
France166,478.048,055.044,950.0333,678.058,301.050,585.0178,590.029,870.0100,967.06184.097,725.0156,397.0
Croatia7228.92651.11739.56455.51888.71698.13718.61578.13420.3357.86050.22998.5
Italy155,140.345,715.064,991.5244,254.566,505.838,439.8141,238.423,406.972,984.89935.4112,975.4111,788.1
Cyprus1864.6761.2755.22404.2774.6695.42393.1403.01087.8484.42755.31506.3
Latvia3211.81360.0903.13775.3686.6903.52072.6497.31699.2271.91210.81129.0
Lithuania5950.11684.61705.84406.72055.91391.04609.7774.22433.9146.81308.72882.7
Luxembourg1872.91778.61014.24812.11402.1652.53276.3312.31418.5215.51674.93273.2
Hungary12,623.65457.62622.315,158.03722.82925.09229.82071.75474.01340.86586.26209.8
Malta914.5276.0386.9909.9342.8321.1832.0201.1673.6164.41656.3791.6
Netherlands39,807.010,548.017,859.084,655.020,319.011,735.042,973.08299.034,591.02307.031,098.044,671.0
Austria19,821.76456.911,461.745,901.813,390.77839.924,904.93870.020,330.62029.828,279.720,499.3
Poland49,977.918,290.815,995.560,985.717,270.817,840.838,808.46471.125,034.63046.211,892.138,653.0
Portugal23,558.24472.68512.025,433.97036.07898.419,926.73380.88377.12284.320,449.715,276.4
Romania34,214.77502.19091.424,585.79802.07036.816,566.34465.79125.81554.56166.75647.3
Slovenia3714.21258.41454.54893.41348.11026.04502.9738.32519.6331.82083.42726.8
Slovakia9141.62858.82159.215,144.03220.31315.03450.11641.45036.5779.13431.24588.8
Finland13,689.05742.04945.034,731.05638.05909.014,060.02832.012,189.0483.08172.012,077.0
Sweden25,586.26853.08428.953,504.512,376.46412.926,673.86046.823,580.1636.013,891.522,399.4
EU27955,886292,799336,2881,726,759406,736320,445961,951174,205638,28267,273642,427819,447
Table A2. EU27 GHG intensity of GDP (UNECE) and emissions by sectors for each country and for EU27. EU27 emissions are obtained by summing columns of emissions by sector from each member state.
Expenditure
2019
(Million Euro)
GHG Intensity
of GDP
Food and Non-Alcoholic BeveragesAlcoholic Beverages, Tobacco and NarcoticsClothing and FootwearHousing, Water, Electricity, GasFurnishingHealthTransportCommunicationRecreationEducationRestaurant and HotelMiscellaneous
Belgium0.1785284.41653.61939.39863.02522.52820.14676.6880.13465.4164.32797.15460.2
Bulgaria0.2171535.5442.1283.71642.1433.2531.51141.2389.5682.988.4573.2549.9
Czechia0.0751223.0630.9288.62114.8420.8196.1819.5232.9720.842.0720.7631.4
Denmark0.2023282.0970.51168.68089.71546.8839.13516.1561.63400.3238.21839.73301.6
Germany0.09517,644.35254.57087.239,158.410,386.18443.622,940.33636.217,742.71466.29006.620,351.7
Estonia0.143375.5142.4122.3362.987.265.1230.446.6172.110.2161.7171.4
Ireland0.1291133.6659.0526.63301.1563.4642.51645.6308.1841.5233.72096.01076.4
Greece0.1813997.71131.21042.04836.8679.9991.33140.4948.91508.3526.34510.01877.8
Spain0.12011,113.23464.43621.619,536.43979.03715.910,927.82218.66654.51371.113,301.58857.7
France0.11819,644.45670.55304.139,374.06879.55969.021,073.63524.711,914.1729.711,531.618,454.8
Croatia0.121874.7320.8210.5781.1228.5205.5450.0191.0413.943.3732.1362.8
Italy0.14923,115.96811.59683.736,393.99909.45727.521,044.53487.610,874.71480.416,833.316,656.4
Cyprus0.085158.564.764.2204.465.859.1203.434.392.541.2234.2128.0
Latvia0.121388.6164.6109.3456.883.1109.3250.860.2205.632.9146.5136.6
Lithuania0.078464.1131.4133.1343.7160.4108.5359.660.4189.811.5102.1224.9
Luxembourg0.145271.6257.9147.1697.8203.394.6475.145.3205.731.2242.9474.6
Hungary0.1622045.0884.1424.82455.6603.1473.91495.2335.6886.8217.21067.01006.0
Malta0.229209.463.288.6208.478.573.5190.546.1154.337.6379.3181.3
Netherlands0.0622468.0654.01107.35248.61259.8727.62664.3514.52144.6143.01928.12769.6
Austria0.1713389.51104.11960.07849.22289.81340.64258.7661.83476.5347.14835.83505.4
Poland0.1527596.62780.22431.39269.82625.22711.85898.9983.63805.3463.01807.65875.3
Portugal0.1082544.3483.0919.32746.9759.9853.02152.1365.1904.7246.72208.61649.9
Romania0.1495098.01117.81354.63663.31460.51048.52468.4665.41359.7231.6918.8841.4
Slovenia0.131486.6164.9190.5641.0176.6134.4589.996.7330.143.5272.9357.2
Slovakia0.1191087.9340.2256.91802.1383.2156.5410.6195.3599.392.7408.3546.1
Finland0.2353216.91349.41162.18161.81324.91388.63304.1665.52864.4113.51920.42838.1
Sweden0.1273249.4870.31070.56795.11571.8814.43387.6767.92994.780.81764.22844.7
EU27 121,89937,58142,698215.99950,68240,242119,71521,92378,6058,52782,340101,131
Table A3. The 2020 energy consumption (ktoe) for EU27 member states and EU27 as a whole split by the COICOP sector.
2020 Energy Consumption (MJ)Food and Non-Alcoholic BeveragesAlcoholic Beverages, Tobacco and NarcoticsClothing and FootwearHousing, Water, Electricity, GasFurnishingHealthTransportCommunicationRecreationEducationRestaurant and HotelMiscellaneous
Belgium4.611.431.298.152.092.083.280.842.400.121.514.26
Bulgaria3.050.830.472.930.811.061.720.821.100.180.721.00
Czechia3.611.770.665.991.190.601.870.681.730.111.211.72
Denmark1.010.300.332.360.490.250.950.160.900.070.400.95
Germany19.75.776.3742.1411.478.7721.553.8615.861.546.3521.14
Estonia6.690.250.180.600.160.110.300.080.270.020.180.29
Ireland0.400.240.171.160.180.200.460.120.230.080.440.37
Greece2.870.750.543.410.440.711.530.720.720.341.521.25
Spain11.03.202.2917.803.223.297.211.974.141.236.497.70
France19.29.034.0236.236.225.1014.973.249.730.617.0815.91
Croatia1.240.390.231.110.310.300.430.280.490.060.490.46
Italy15.614.345.0623.666.063.5010.122.185.480.886.579.78
Cyprus0.230.090.080.290.090.040.200.050.110.060.210.17
Latvia0.670.250.160.760.140.180.340.100.250.050.010.23
Lithuania1.250.350.290.900.440.300.800.170.430.030.200.60
Luxembourg0.140.120.070.370.110.050.190.020.080.010.090.25
Hungary2.671.130.453.160.780.601.600.421.030.250.871.23
Malta0.250.070.090.280.090.090.180.060.120.030.170.22
Netherlands5.111.401.9210.462.591.304.391.033.480.282.435.36
Austria2.180.700.934.861.370.792.090.401.680.192.052.00
Poland11.164.113.0113.003.583.987.411.464.510.581.917.53
Portugal3.070.500.843.150.790.821.950.340.880.252.011.66
Romania6.541.491.584.661.781.182.800.861.530.300.870.92
Slovenia0.580.180.190.770.210.160.520.120.290.040.210.41
Slovakia2.030.560.423.210.640.250.550.320.840.140.570.92
Finland2.360.990.645.760.960.931.960.471.750.070.991.94
Sweden2.910.800.785.941.430.692.630.662.440.071.162.48
EU27130.1641.0333.08203.1147.6237.3292.0121.4362.467.6046.7090.74
Table A4. The 2020 energy consumption per household (toe) for EU27 member states and EU27 as a whole split by the COICOP sector.
2020 Energy Consumption/Household (Toe)Food and Non-Alcoholic BeveragesAlcoholic Beverages, Tobacco and NarcoticsClothing and FootwearHousing, Water, Electricity, GasFurnishingHealthTransportCommunicationRecreationEducationRestaurant and HotelMiscellaneous
Belgium0.940.290.261.660.430.420.670.170.490.020.310.87
Bulgaria1.060.290.161.020.280.370.600.280.380.060.250.35
Czechia0.750.370.141.250.250.120.390.140.360.020.250.36
Denmark0.390.120.130.910.190.100.360.060.350.030.150.36
Germany0.490.140.161.040.280.220.530.100.390.040.160.52
Estonia10.480.390.280.940.250.170.470.130.420.030.280.45
Ireland0.210.130.090.610.090.100.240.060.120.040.230.19
Greece0.620.160.120.740.100.150.330.160.160.070.330.27
Spain0.580.170.120.940.170.170.380.100.220.070.340.41
France0.630.300.131.200.210.170.490.110.320.020.230.53
Croatia0.850.270.160.760.210.210.290.190.340.040.340.31
Italy0.600.170.190.910.230.130.390.080.210.030.250.38
Cyprus0.690.270.240.870.270.120.600.150.330.180.630.51
Latvia0.780.290.190.880.160.210.390.120.290.060.010.27
Lithuania0.930.260.220.670.330.220.590.130.320.020.150.45
Luxembourg0.530.460.271.410.420.190.730.080.310.040.340.95
Hungary0.650.270.110.770.190.150.390.100.250.060.210.30
Malta1.250.350.451.400.450.450.900.300.600.150.851.10
Netherlands0.640.180.241.320.330.160.550.130.440.040.310.68
Austria0.550.180.231.220.340.200.520.100.420.050.510.50
Poland0.770.280.210.890.250.270.510.100.310.040.130.52
Portugal0.750.120.210.770.190.200.480.080.220.060.490.41
Romania0.870.200.210.620.240.160.370.110.200.040.120.12
Slovenia0.630.200.210.840.230.180.570.130.320.040.230.45
Slovakia0.990.270.211.570.310.120.270.160.410.070.280.45
Finland0.860.360.232.100.350.340.710.170.640.030.360.71
Sweden0.520.140.141.070.260.120.470.120.440.010.210.45
EU27 average household0.660.210.171.040.240.190.470.110.320.040.240.46
Table A5. The 2020 GHG emissions per householder (GtCO2eq) for EU27 member states and EU27 as a whole split by the COICOP sector.
2020 GHG/Household
(GtCO2eq)
Food and Non-Alcoholic BeveragesAlcoholic Beverages, Tobacco and NarcoticsClothing and FootwearHousing, Water, Electricity, GasFurnishingHealthTransportCommunicationRecreationEducationRestaurant and HotelMiscellaneous
Belgium1.080.340.402.010.510.580.950.180.710.030.571.11
Bulgaria0.530.150.100.570.150.180.400.140.240.030.200.19
Czechia0.250.130.060.440.090.040.170.050.150.010.150.13
Denmark1.260.370.453.100.590.321.350.221.300.090.711.27
Germany0.440.130.180.970.260.210.570.090.440.040.220.50
Estonia0.590.220.190.570.140.100.360.070.270.020.250.27
Ireland0.590.350.281.730.300.340.860.160.440.121.100.56
Greece0.870.240.231.050.150.210.680.210.330.110.980.41
Spain0.590.180.191.030.210.200.580.120.350.070.700.47
France0.650.190.181.300.230.200.700.120.390.020.380.61
Croatia0.600.220.140.530.160.140.310.130.280.030.500.25
Italy0.890.260.371.400.380.220.810.130.420.060.650.64
Cyprus0.470.190.190.610.200.180.610.100.280.120.700.38
Latvia0.450.190.130.530.100.130.290.070.240.040.170.16
Lithuania0.340.100.100.260.120.080.270.040.140.010.080.17
Luxembourg1.040.980.562.660.780.361.810.170.790.120.931.81
Hungary0.500.210.100.600.150.110.360.080.210.050.260.24
Malta1.050.320.441.050.390.370.960.230.770.191.900.91
Netherlands0.310.080.140.660.160.090.340.060.270.020.240.35
Austria0.850.280.491.970.570.341.070.170.870.091.210.88
Poland0.520.190.170.640.180.190.410.070.260.030.120.40
Portugal0.630.120.230.680.190.210.530.090.220.060.540.41
Romania0.680.150.180.490.190.140.330.090.180.030.120.11
Slovenia0.530.180.210.700.190.150.650.110.360.050.300.39
Slovakia0.530.170.130.880.190.080.200.100.290.050.200.27
Finland1.170.490.422.970.480.511.200.241.040.040.701.03
Sweden0.580.160.191.220.280.150.610.140.540.010.320.51
EU27 average household0.670.240.241.130.270.220.640.120.440.060.530.53

References

  1. European Commission Social Climate Fund 2021. Available online: https://climate.ec.europa.eu/eu-action/social-climate-fund (accessed on 3 October 2023).
  2. Schlacke, S.; Wentzien, H.; Thierjung, E.-M.; Köster, M. Implementing the EU Climate Law via the ‘Fit for 55’ Package. Oxf. Open Energy 2022, 1, oiab002. [Google Scholar] [CrossRef]
  3. Perissi, I.; Jones, A. Investigating European Union Decarbonization Strategies: Evaluating the Pathway to Carbon Neutrality by 2050. Sustainability 2022, 14, 4728. [Google Scholar] [CrossRef]
  4. Perissi, I.; Jones, A. PLEDGES Model: An Innovative Tool to Manage Carbon Budget across the EU27 Member States. In Proceedings of the 11th Simulation Workshop, SW 2023, Southampton, UK, 27–29 March 2023; pp. 150–161. [Google Scholar]
  5. Kissinger, M.; Damari, Y. Household Metabolism: Integrating Socio-Economic Characteristics and Lifestyles on Individual and National Scales as a Mean for Advancing Environmental Management. J. Environ. Manag. 2021, 279, 111526. [Google Scholar] [CrossRef] [PubMed]
  6. Chitnis, M.; Druckman, A.; Hunt, L.C.; Jackson, T.; Milne, S. Forecasting Scenarios for UK Household Expenditure and Associated GHG Emissions: Outlook to 2030. Ecol. Econ. 2012, 84, 129–141. [Google Scholar] [CrossRef]
  7. Davis, S.J.; Caldeira, K. Consumption-Based Accounting of CO2 Emissions. Proc. Natl. Acad. Sci. USA 2010, 107, 5687–5692. [Google Scholar] [CrossRef] [PubMed]
  8. Munksgaard, J.; Pedersen, K.A. CO2 Accounts for Open Economies: Producer or Consumer Responsibility? Energy Policy 2001, 29, 327–334. [Google Scholar] [CrossRef]
  9. Hartl, A. The Effects of the Kyoto Protocol on the Carbon Trade Balance. Rev. World Econ. 2019, 155, 539–574. [Google Scholar] [CrossRef]
  10. Jensen, J.K.; Arlbjørn, J.S. Product Carbon Footprint of Rye Bread. J. Clean. Prod. 2014, 82, 45–57. [Google Scholar] [CrossRef]
  11. Klenk, I.; Landquist, B.; Imana, O. The Product Carbon Footprint of EU Beet Sugar (Part II). Zuckerind. Sugar Ind. 2012, 137, 213–221. [Google Scholar] [CrossRef]
  12. Pan, X.; Uddin, M.K.; Ai, B.; Pan, X.; Saima, U. Influential Factors of Carbon Emissions Intensity in OECD Countries: Evidence from Symbolic Regression. J. Clean. Prod. 2019, 220, 1194–1201. [Google Scholar] [CrossRef]
  13. Perissi, I.; Falsini, S.; Bardi, U.; Natalini, D.; Green, M.; Jones, A.; Solé, J. Potential European Emissions Trajectories within the Global Carbon Budget. Sustainability 2018, 10, 4225. [Google Scholar] [CrossRef]
  14. Perissi, I.; Jones, A. Influence of Economic Decoupling in Assessing Carbon Budget Quotas for the European Union. Carbon Manag. 2023, 14, 2217423. [Google Scholar] [CrossRef]
  15. Noonan, E. Decoupling Economic Growth from Environmental Harm, EPRS: European Parliamentary Research Service. Belgium. Available online: https://policycommons.net/artifacts/1336830/decoupling-economic-growth-from-environmental-harm/1944346/ (accessed on 3 October 2023).
  16. Eurostat Classification of Individual Consumption by Purpose (COICOP). Available online: https://ec.europa.eu/eurostat/databrowser/view/NAMA_10_CO3_P3__custom_2475995/default/table (accessed on 30 September 2022).
  17. Qiu, J.; Jammalamadaka, S.R.; Ning, N. Multivariate Bayesian Structural Time Series Model. J. Mach. Learn. Res. 2018, 19, 2744–2776. [Google Scholar]
  18. Matlab® “bayeslm”—MATLABCreate Bayesian Linear Regression Model Object. Available online: https://it.mathworks.com/help/econ/bayeslm.html (accessed on 3 October 2022).
  19. Eurostat the Real Gross Disposable Income of Households per Capita (Index = 2008). Available online: https://ec.europa.eu/eurostat/databrowser/view/TEPSR_WC310/bookmark/table?lang=en&bookmarkId=db91473b-7823-4bd9-8112-e4ab26468efd (accessed on 30 September 2022).
  20. Eurostat HICP—Annual Data (Average Index and Rate of Change). Available online: https://ec.europa.eu/eurostat/databrowser/view/PRC_HICP_AIND__custom_3423965/default/table (accessed on 30 September 2022).
  21. Vadén, T.; Lähde, V.; Majava, A.; Järvensivu, P.; Toivanen, T.; Hakala, E.; Eronen, J.T. Decoupling for Ecological Sustainability: A Categorisation and Review of Research Literature. Environ. Sci. Policy 2020, 112, 236–244. [Google Scholar] [CrossRef] [PubMed]
  22. Randers, J. Greenhouse Gas Emissions per Unit of Value Added (“GEVA”)—A Corporate Guide to Voluntary Climate Action. Energy Policy 2012, 48, 46–55. [Google Scholar] [CrossRef]
  23. United Nations. Global SDG Database Carbon Dioxide Emissions per Unit of GDP. Available online: https://w3.unece.org/SDG/en/Indicator?id=28 (accessed on 7 October 2022).
  24. Ivanova, D.; Vita, G.; Steen-Olsen, K.; Stadler, K.; Melo, P.C.; Wood, R.; Hertwich, E.G. Mapping the Carbon Footprint of EU Regions. Environ. Res. Lett. 2017, 12, 054013. [Google Scholar] [CrossRef]
  25. Ivanova, D.; Wood, R. The Unequal Distribution of Household Carbon Footprints in Europe and Its Link to Sustainability. Glob. Sustain. 2020, 3, e18. [Google Scholar] [CrossRef]
  26. Diaz Anadon, L.; Jones, A.; Peñasco, C.; Sharpe, S. Ten Principles for Policymaking in The Energy Transition: Lessons from Experience 2022. Available online: https://eeist.co.uk/eeist-reports/ten-principles-for-policy-making-in-the-energy-transition/ (accessed on 3 October 2023).
  27. Directorate-General for Communication Special Eurobarometer 501: Attitudes of European Citizens towards the Environment. Available online: http://data.europa.eu/88u/dataset/S2257_92_4_501_ENG (accessed on 11 May 2022).
  28. Buch-Hansen, H.; Koch, M. Degrowth through Income and Wealth Caps? Ecol. Econ. 2019, 160, 264–271. [Google Scholar] [CrossRef]
  29. Duscha, V.; Denishchenkova, A.; Wachsmuth, J. Achievability of the Paris Agreement Targets in the EU: Demand-Side Reduction Potentials in a Carbon Budget Perspective. Clim. Policy 2019, 19, 161–174. [Google Scholar] [CrossRef]
  30. Trio, W. Counting the Numbers: EU Carbon Budget Not Compatible with 1.5 °C Target 2022. Available online: https://www.airclim.org/sites/default/files/documents/21-airclim-briefing-counting-numbers-eu.pdf (accessed on 3 October 2023).
  31. Dubois, G.; Sovacool, B.; Aall, C.; Nilsson, M.; Barbier, C.; Herrmann, A.; Bruyère, S.; Andersson, C.; Skold, B.; Nadaud, F.; et al. It Starts at Home? Climate Policies Targeting Household Consumption and Behavioral Decisions Are Key to Low-Carbon Futures. Energy Res. Soc. Sci. 2019, 52, 144–158. [Google Scholar] [CrossRef]
  32. Maraseni, T.N.; Qu, J.; Zeng, J. A Comparison of Trends and Magnitudes of Household Carbon Emissions between China, Canada and UK. Environ. Dev. 2015, 15, 103–119. [Google Scholar] [CrossRef]
  33. Houthakker, H.S. An International Comparison of Household Expenditure Patterns, Commemorating the Centenary of Engel’s Law. Econometrica 1957, 25, 532–551. [Google Scholar] [CrossRef]
  34. Gao, Y.; Zhu, J. Characteristics, Impacts and Trends of Urban Transportation. Encyclopedia 2022, 2, 1168–1182. [Google Scholar] [CrossRef]
  35. Ostermeijer, F.; Koster, H.R.A.; van Ommeren, J.; Nielsen, V.M. Automobiles and Urban Density. J. Econ. Geogr. 2022, 22, 1073–1095. [Google Scholar] [CrossRef]
  36. Bardazzi, R.; Pazienza, M.G. Ageing and Private Transport Fuel Expenditure: Do Generations Matter? Energy Policy 2018, 117, 396–405. [Google Scholar] [CrossRef]
  37. European Commision. Developments and Forecasts on Continuing Urbanisation. Available online: https://knowledge4policy.ec.europa.eu/foresight/topic/continuing-urbanisation/developments-and-forecasts-on-continuing-urbanisation_en (accessed on 10 February 2023).
  38. Samsó, R.; de Blas, I.; Perissi, I.; Martelloni, G.; Solé, J. Scenario Analysis and Sensitivity Exploration of the MEDEAS Europe Energy-Economy-Environment Model. Energy Strategy Rev. 2020, 32, 100582. [Google Scholar] [CrossRef]
  39. Giansoldati, M.; Monte, A.; Scorrano, M. Barriers to the Adoption of Electric Cars: Evidence from an Italian Survey. Energy Policy 2020, 146, 111812. [Google Scholar] [CrossRef]
  40. Roşca, V.I. Costs a Pretty Penny: How Household Income Impacts upon Motorization in Europe and Raises Manufacturer Branding Challenges. Proc. Int. Conf. Bus. Excell. 2019, 13, 759–771. [Google Scholar] [CrossRef]
  41. Weiss, D.; Scherer, P. The Phase-out of the Internal Combustion Engine. In Mapping the Territorial Adaptation of Technological Trajectories; Routledge: Maastricht, The Netherlands, 2022; p. 22. ISBN 978-1-00-321364-2. [Google Scholar]
  42. Li, X.; Liu, C.; Jia, J. Ownership and Usage Analysis of Alternative Fuel Vehicles in the United States with the 2017 National Household Travel Survey Data. Sustainability 2019, 11, 2262. [Google Scholar] [CrossRef]
  43. Yu, X.; Li, W.; Gupta, V.; Gao, H.; Tran, D.; Sarwar, S.; Chen, Z. Current Challenges in Efficient Lithium-Ion Batteries’ Recycling: A Perspective. Glob. Chall. 2022, 6, 2200099. [Google Scholar] [CrossRef]
Figure 1. Distribution of emissions related to the households’ expenditures by COICOP sectors, obtained using the approximation of emissions intensity of GDP by member states in 2019.
Climate 11 00203 g001
Figure 2. Energy consumption per household linked to expenditures in COICOP sectors for EU27 MSs. Red bar indicates EU27 energy consumption average.
Climate 11 00203 g002
Figure 3. GHG emissions burden linked to households’ expenditures in COICOP sectors for EU27 MSs. Red bar indicates EU27 emissions average.
Climate 11 00203 g003
Figure 4. Comparing Eurobarometer survey EB 88.1 (2017) and EB94.2 (2019) on “Attitudes of European citizens towards the Environment”. EU citizens answered, Have you done any of the following in the past six months? The authors split responses into six categories: Mobility, Products, Saving, Recycling, Food, and Speaking.
Climate 11 00203 g004
Figure 5. All-COICOP expenditures in high (grey), BAU (dashed), and low (green) scenarios for EU27.
Climate 11 00203 g005
Figure 6. GHG emissions for a unit of GDP (index value 1995 = 1) for EU 27 projections based on exponential decrease of 4% annual rate (BAU), −2% annual rate in the hypothesis of higher expenditures scenarios, and linear extrapolation to net zero in the hypothesis of lower expenditure scenarios.
Climate 11 00203 g006
Figure 7. GHG emissions related to EU27 COICOP expenditure scenarios in two GHG intensity of GDP scenarios, considering −2% and −4% yearly decarbonization rates or linear decarbonization toward carbon neutrality in 2050.
Climate 11 00203 g007
Figure 8. GHG emissions related to EU27 COICOP expenditures scenarios in two GHG emissions per unit of GDP scenarios, considering −4% yearly decarbonization rate or linear decarbonization toward carbon neutrality in 2050. (a) households’ expenditures for transport (b) emissions linked to expenditures for transport; (c) households’ expenditures for food; (d) emissions linked to expenditures for food; (e) households’ expenditures for housing; (f) emissions linked to expenditures for housing.
Climate 11 00203 g008
Disclaimer/Publisher’s Note: The statements, opinions and data contained in all publications are solely those of the individual author(s) and contributor(s) and not of MDPI and/or the editor(s). MDPI and/or the editor(s) disclaim responsibility for any injury to people or property resulting from any ideas, methods, instructions or products referred to in the content.

