Article

Spatiotemporal Changes in Mean and Extreme Climate: Farmers’ Perception and Its Agricultural Implications in Awash River Basin, Ethiopia

1
Center for Environment and Development Studies, Addis Ababa University, Addis Ababa P.O. Box 1176, Ethiopia
2
Department of Geography and Environmental Studies, Wolaita Sodo University, Wolaita Sodo P.O. Box 138, Ethiopia
3
Water and Land Resource Center, Addis Ababa P.O. Box 3880, Ethiopia
4
International Water Research Institute, Mohammed VI Polytechnic University, Lot 660, Hay Moulay Rachid, Ben Guerir 43150, Morocco
5
Department of Mathematics and Statistical Sciences, Botswana International University of Science and Technology, Private Bag 16, Palapye 10071, Botswana
6
Hailemariam and Roman Foundation, Addis Ababa P.O. Box 27858, Ethiopia
*
Author to whom correspondence should be addressed.
Climate 2022, 10(6), 89; https://doi.org/10.3390/cli10060089
Submission received: 11 May 2022 / Revised: 6 June 2022 / Accepted: 13 June 2022 / Published: 20 June 2022
(This article belongs to the Special Issue Climate and Weather Extremes)

Abstract

:
The increase in the intensity and frequency of climate extremes threatens socioeconomic development. This study examines variability of mean and extreme climate, farmers’ perception of the changes, and impacts in the Awash River Basin. Daily rainfall and temperature data were used to analyze 23 extreme climate indices. The Mann–Kendall test was used to assess the magnitude and significance of the changes. Results show an increase in minimum (0.019–0.055 °C/year) and maximum temperatures (0.049–0.09 °C/year), while total rainfall is on a downward trend (from −3.84 mm/year to −10.26 mm/year). Warm extreme temperature indicators, including warmest day (TXx), warmest night (TNx), warm day (TX90p), warm night (TN90p), and warm spell duration indicator (WSDI), show a significant increasing trend (p < 0.05). Nevertheless, except the tepid–cool humid agroecology zone, cold extreme temperature indicators in cool days (TN10p), cool nights (TX10p), and cold spell duration (CSDI) are declining. Extreme precipitation indices, including maximum 1-day precipitation amount (RX1day), count of days when precipitation ≥10 mm (R10 mm), maximum 5-day precipitation amount (RX5day), count of days when precipitation ≥20 mm (R20mm), very wet days (R95p), extreme wet days (R99p), and total precipitation (PRCPTOT), show a decreasing trend. The perception of most farmers’ on climate change and climate extremes agreed with climate records. The major impacts perceived and asserted over all agroecologies are food price inflation, crop productivity decline, crop pests and diseases spread, livestock disease increase, and the emergence of pests and weeds. The increasing trend in extreme warm temperatures, decreasing trend in the cold extreme, and declining trend in precipitation indicators affected agricultural productivity and farmers whose livelihood depends on rainfed agriculture. This agroecology-specific study provides critical information to policymakers, decision makers, and farmers about the potential impacts of climate change and extreme events, leading to the development of agroecology-based adaptation measures.

1. Introduction

The influence of human activities has altered climate systems, resulting in the warming of both land and the atmosphere [1]. From pre-industrial (1850–1900) to current post-industrial (2006–2015) times, the mean land surface temperature (LST) and global mean surface temperature have increased by 1.53 °C and 0.87 °C, respectively [2]. Temperature and rainfall are vital weather variables; they influence most socio-economic activities in a given area. A shift in the mean of these variables threatens people whose livelihood depends on rainfed agriculture [3,4]. As global temperatures and precipitation continue to change, climate extremes are projected to increase in both intensity and frequency. Thus, understanding extreme precipitation and temperature events is important as their indicators, such as drought and flood, affect various socioeconomic activities [5].
Climate extreme events have received significant attention given the associated devastating impacts [6,7]. The events have come to be framed descriptively as driving adaptation and prescriptively as useful indicators that the climate is changing. Such information can be useful for adaptation planning [8]. Recent studies, e.g., [9,10,11], have revealed patterns and trends in extreme weather events over East Africa. Furthermore, droughts and storms have become much more frequent within the last three decades [12]. According to Funk et al. [13], continued warming in the Indian Ocean contributes to spring and summer droughts. Climate change is widely believed to be occurring in various parts of Ethiopia [14,15,16]. Observed changes in extremes in the country are dependent on the reliability and quantity of available data. However, there is low–medium confidence in extreme historical temperatures and heavy rainfall trends over most parts of Ethiopia because of a lack of empirical evidence. Meanwhile, extreme temperatures have risen in most parts of Ethiopia, where reliable data are available [17,18].
The development of internationally agreed-upon climate indices, such as the Expert Team on Climate Change Detection and Indices (ETCCDI), that represent more extreme aspects of climate, has promoted research in climate change. Ongoma et al. [9] used extreme climate indices to show a general decreasing rainfall trend at various significance levels in Kenya and Uganda. A study conducted in Ethiopia, Kenya, and Tanzania [19] reported an increasing daily and monthly temperature trend. Like other East African countries, Ethiopia is very vulnerable to climate change and variability due to its over-reliance on rainfed agriculture to sustain the economy. Changing rainfall patterns and frequent extreme events such as drought, flood, and hail have a greater negative impact on the biophysical environment, food security, and economic growth than long-term mean temperature and precipitation alteration alone [20,21]. Considering the country’s history of major climate disasters, conducting long-term trend and variability studies on what has changed in recent decades has contributed to agricultural productivity, and adaptation to and mitigation of climate change [22,23].
Furthermore, when looking at different biophysical setups in Ethiopia, a few researchers that have addressed the issue of climate extreme studies using indices obtained from the ETCCDI have yielded contradictory results. Teshome and Zhang [24] found that precipitation extents such as annual total precipitation (PRCPTOT), the number of heavy precipitation days (R10mm), and consecutive wet days (CWD) are decreasing. Kiros et al. [14] examined trends in 12 extreme indices in the Geba River Basin between 1971 and 2013. Precipitation indices such as the number of consecutive dry days (CDD), PRCPTOT, the number of days when precipitation is ≥10 mm, 20 mm, and 25 mm, the maximum precipitation amount over 1 and 5 days (RX1day and RX5day), and the simple daily intensity index (SDII), showed a decreasing pattern in the most of river basin stations. In contrast, most stations in the river basin show increasing trends in temperature indices, including the number of CWD and precipitation indices, such as very wet (R90p) and extreme wet days (R95p and R99p). Geremew et al. [25], in their study, examined an increasing trend in the mean annual number of CWD, the number of wet days (NWD), and the mean annual CDD at some stations in Northwest Ethiopia. Generally, various studies conducted across the country show varying outcomes, stressing the need for location-specific analysis. Recent studies conducted in various parts of the country confirmed an agroecology-based analysis that can benefit local climatic adaptation measures [18,26].
Recent studies in the Awash River Basin identified drought and flooding events [27], land use land cover transition [28,29], improper land-use practices [30], and deforestation [31] as key development challenges. Examining their characteristics across agroecologies in the basin is vital given the agricultural importance of extreme climate events. A comprehensive assessment of how various climate extremes change across the basin provide valuable information to stakeholders and decision makers. Essentially, climate change and extreme events perception are complex processes that encompass a range of psychological constructs, such as knowledge, beliefs, attitudes, and concerns about whether and how the climate is changing [32,33]. Perception is influenced and shaped, among other things, by an individuals’ characteristics, experience, information, and the cultural and geographic context in which they live [32,34,35]. Considering trends in farmers’ perceptions of climate change and extreme events is important. Failure to assess farmers’ beliefs on the impacts of climate change and their adaptation attitudes can result in ineffective and inefficient long-term adaptive measures [36,37].
Therefore, assessing trends in climate extremes based on data and farmer perceptions is critical to understanding its sectoral implications and developing adaptation strategies [38,39]. Evidence suggests that individual perceptions of climate change accompanied by climate extremes can influence beliefs, concerns, risk perceptions, mitigation, and adaptation behaviors [40,41]. Existing studies are primarily confined to the Blue Nile Basin, excluding analyses of areas where extreme climate trends occur in constrained spatial and temporal regions, such as in the Awash Basin [27,42]. Moreover, these studies have been undertaken with climatic data quality issues unrelated to local perception.
Consequently, studies do not comprehensively analyze the spatiotemporal variability in temperature and precipitation extremes across agroecologies basins. Studies of extreme climates and their characteristics are critical for applying integrated, climate-related policy formulation and implementation. Ethiopia has complex patterns of climate trends; microscale studies on the variability and trends of extreme weather events are critical for understanding local-scale indications of climate changes and designing context-specific adaptation interventions. The study’s objectives were to (1) analyze agroecology based on mean and extreme temperature and precipitation events from 1983 to 2016; (2) assess farmers’ perception of changes in mean climate and extreme events, and its agricultural implications, in the Awash-Awash subbasin.

2. Materials and Methods
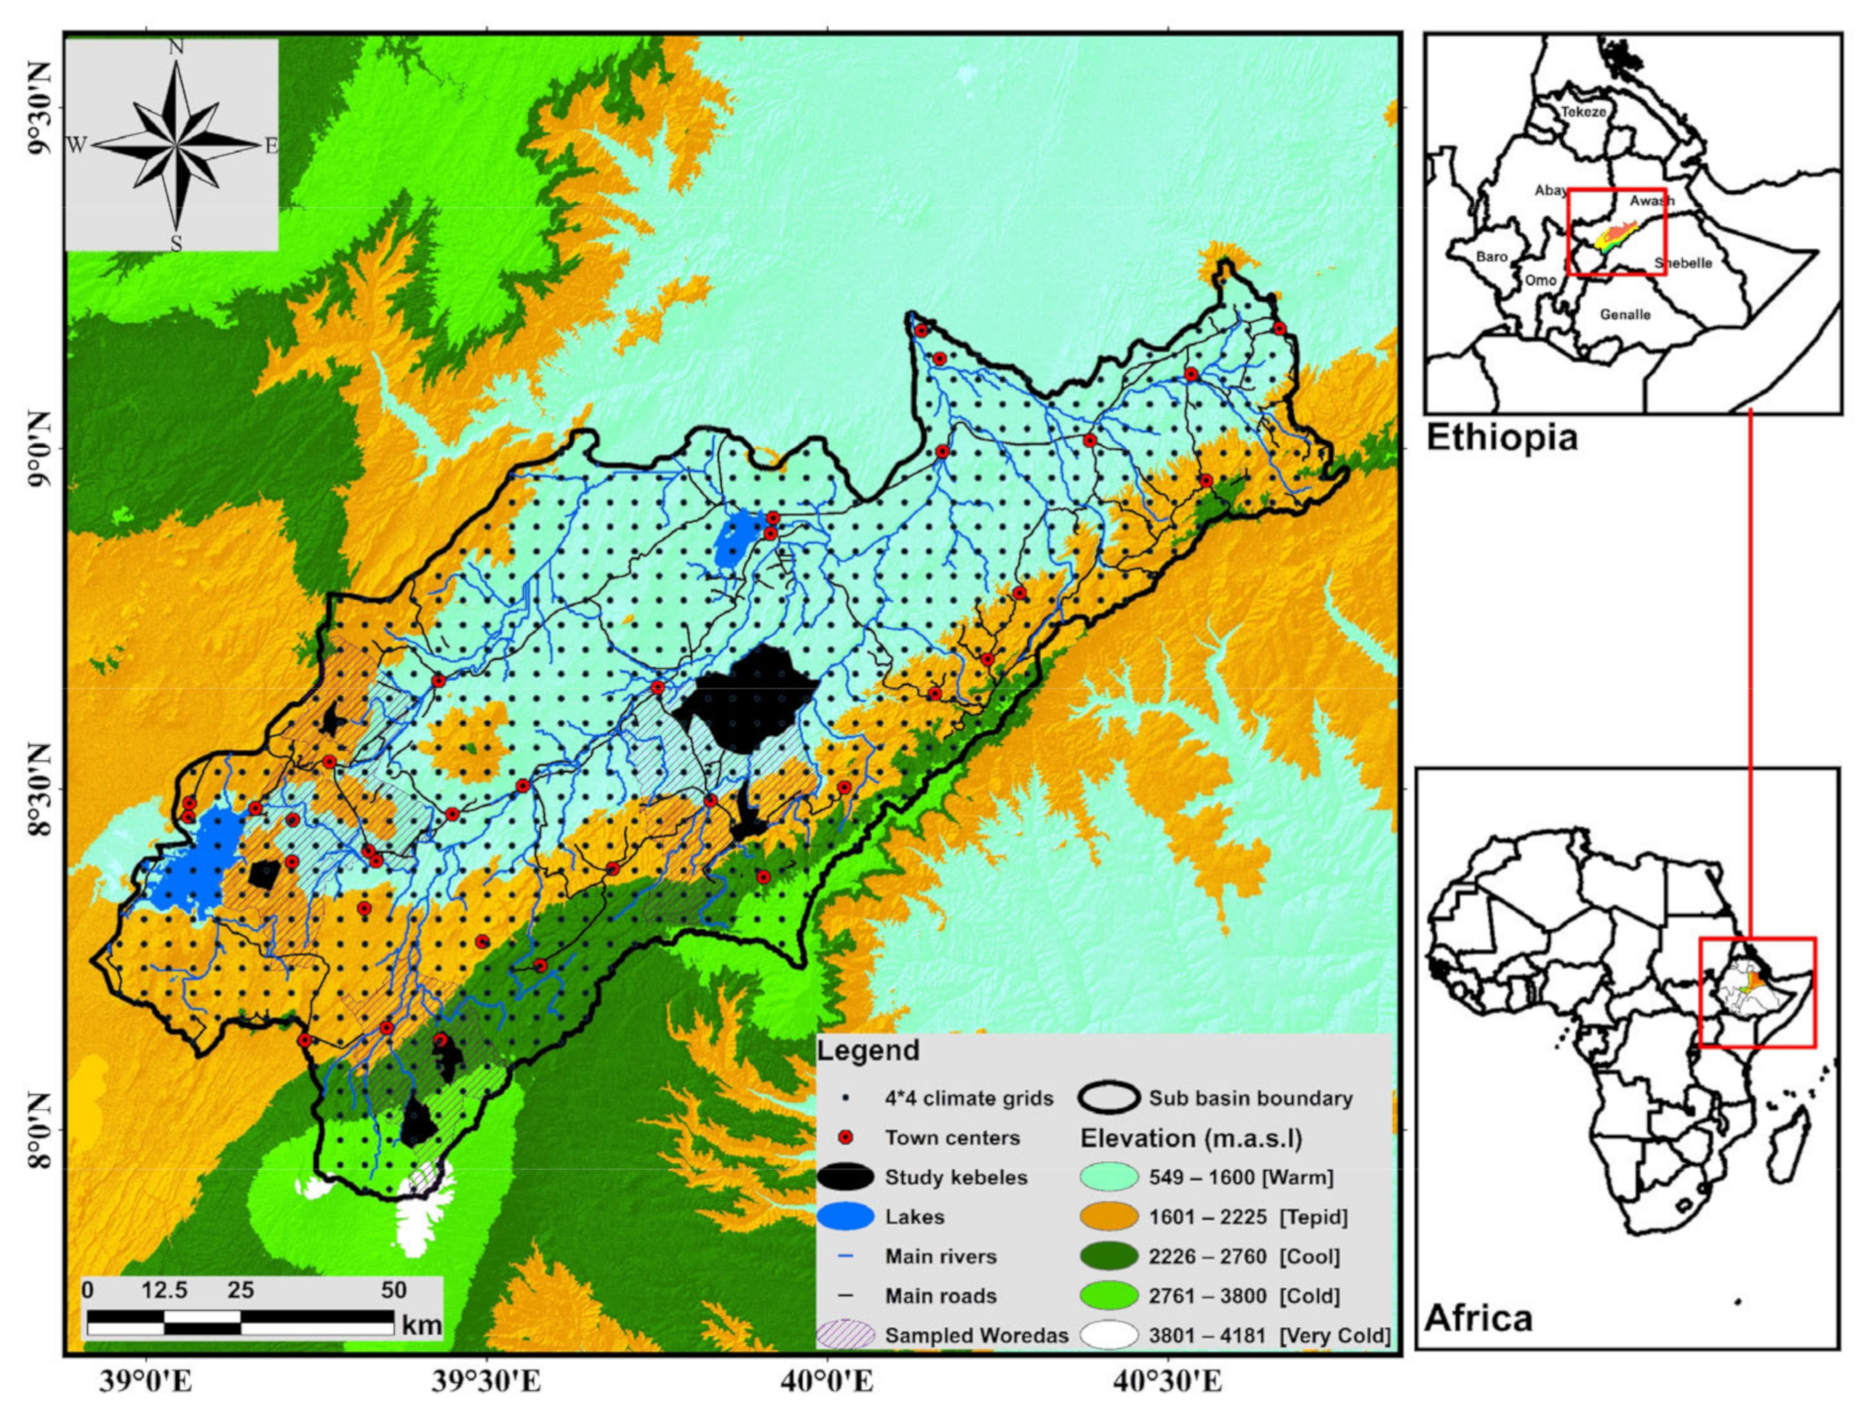
2.1. Study Area

The Awash at the Awash subbasin (hereafter Awash-Awash) is one of six major water resource planning areas classified according to the Awash River Basin’s hydrological, administrative, economic, and social boundaries. It has an area of 12,302.9 km2, located between latitudes 7°54′ N–9°16′ N and longitudes 38°55′ E–40°46′ E (Figure 1). The elevation of the subbasin ranges between 4191 and 744 m above sea level. Awash-Arba 1 and 2 and the Kaleta-Werenso rivers are the main rivers in the subbasin that contribute major flows to the Awash River Basin. The subbasin climate is influenced by the north–south shift of the Inter-Tropical Convergence Zone [43]. According to the Ethiopia National Meteorological Agency [44] classification system, hot–warm arid, tepid–cool sub-moist, tepid–cool moist, and hot–warm moist dominate the agroecological zone (AEZ) of the subbasin. According Köppen classification, hot semiarid climate (Bsh), tropical rainy climate (Aw), warm temperate rainy climate (Cfb), and warm temperate rainy climate (Cwb) dominate the subbasin [45]. The mean minimum and maximum temperatures are 14.1 and 28.6 °C, respectively, while the mean annual rainfall in the region is about 773 mm [29]. Cultivated land, and shrub and bushland cover about 67% and 19% of the subbasin, respectively. The subbasin is known for the presence of large-, medium-, and small-scale irrigated lands that make it one of the country’s economic centers. Seasonal and perennial crops are widely cultivated, ranging from cereals to vegetables, khat (Chata edulis), fruits, and sugarcane. The population of the subbasin was estimated to be 2,093,216 in 2007 and was projected to reach 2,718,638 by the year 2019 [29].

2.2. Data Types and Sources

2.2.1. Data Preparation, Quality Control, and Analysis of Extreme Climate Indices

The daily maximum and minimum temperature and precipitation records were sourced from the Enhancing National Climate Services (ENACTS) dataset (http://www.ethiomet.gov.et/ (accessed on 12 November 2021)). The dataset combines precipitation estimated from EUMET-SAT, temperature from NASA satellites, and ground observation from National Meteorological Agency (NMA) [46]. An observed dataset which running from 1983 to 2016 with a spatial resolution of 0.0375° × 0.0375° was provided by NMA. The ENACTS have demonstrated strong performance when considered at station locations throughout the country [22,46,47,48].
Basic quality control of the input data was carried out using ClimPACTv2, an R software package. The software and relevant documents of ClimPACT2 can be accessed from the website: https://github.com/ARCCSS-extremes/climpact2 (accessed on 12 November 2021). Artificial shifts in climate data series, homogeneity, and change points were checked and adjusted using RHtestsV4 and RHtests_dlyPrcp, R software packages for temperature and rainfall, respectively [49].
The Expert Team on Sector-specific Climate Indices (ET-SCI), was used to expand the generic ETCCDI [50]. The ET-SCI developed several sector-specific climate indices that consider agriculture, water, and health derived. A standard deviation of three (3) was used to detect the outliers, and some detected outliers were adjusted. The prepared time series dataset was used to compute 12 temperature, 10 rainfall indices, and a drought index in 6 Major Agroecology Zone (MAEZ) of the subbasin (http://etccdi.pacificclimate.org/list_27_indices.shtml (accessed on 12 November 2021)). These indices describe the frequency, amplitude, and persistence of extremes and have been used by many researchers, e.g., [51,52,53].

2.2.2. Socioeconomic Data and Method of Analysis

Agroecology-based classification was used to choose participants in the subbasin to obtain in-depth and diverse information on the perception of trends in climate change and extreme events. Qualitative data from nine key informant interviews (KII) (one development agent per village and one agriculture office expert per district, “woreda”) and six focus group discussions (FGD) (one per village) were used, as well as quantitative data from a household survey. The Awash-Awash subbasin was chosen as one of Ethiopia’s most environmentally vulnerable areas. Agroecological zone classification was used to identify and select three woredas and six villages from the subbasin. A simple random sampling technique was used to obtain individual farmers from lists of selected accessible villages. Following Kothari’s [54] formula, 384 households were chosen as sample respondents (Table S1). Climate change perceptions were gathered using closed and open-ended questionnaires and temperature and rainfall indicators. The household data were analyzed using STATA v.15 (StataCorp, College station, TX, USA), whereas data from KII were transcribed, summarized, and analyzed qualitatively. Finally, qualitative data from key informant interviews and FGD were used to triangulate, substitute, and supplement quantitative climatic data.

2.2.3. Standardized Precipitation–Evapotranspiration Index

The drought frequency was calculated based on the SPEI-12 index value categorization [27]. Drought frequency is obtained by dividing the number of years of drought occurrence by the total number of years under analysis and multiplying by 100% [55].

2.3. Climate Trend Analysis

The nonparametric tests have been widely used in climatic time series analysis due to their simplicity and suitability for data with outliers. The most commonly used nonparametric statistical tests in trend analysis are Mann-Kendall’s trend test [56,57] and Sen’s slope estimator [58]. The Mann-Kendall (MK) test is a nonparametric approach for testing the significance of monotonic trends, linear or nonlinear, in time series data. The method has been widely used to detect trends in hydrometeorological data [9,59]. MKtrend test is expressed by Equation (1):
S = i = 1 N 1 j = i + 1 N s g n x j x i
where S is MK test statistics, xi and xj are the sequential data values of the time series in the years i and j (j > i), respectively, and N is the length of the time series. A negative S value indicates a decreasing trend, and a positive value indicates an increasing trend in the data series.
The sign function sgn is given by Equation (2):
s g n x j x i = + 1   i f   x j > 0 0     i f     x j x i = 0 1     i f     x j x i < 0
If the data are independent and normally distributed, then the variance of the K statistic is given by Equation (3):
V a r   K = 1 18 P P 1 2 P + 5 i = 1 q d i ( d i 1 2 d i + 5
where P is the number of points, q is the number of tied groups in the dataset, and di is the number of data points in the ith tied group. A tied group is the sample data with the same value; there is zero difference between the compared values. The summation aspect of Equation (3) can be ignored if there are no tied groups.
The values of K and Var (K) will be used to compute the test statistic Z by Equation (4).
Z = K 1 V a r K   i f   K > 0 0                                     i f   K = 0 K + 1 V a r K   i f   K < 0
The Z value is used to calculate the statistically significant trend. A positive or negative value of Z represents an upward or downward trend, respectively. The null hypothesis is rejected at the significance level of 𝛼 if |Z| ≥ Z_(α/2), where Z_(α/2) is the critical value of the standard normal distribution with a probability exceeding α/2, and shows that the trend is significant. If |Z| < Zα/2, then the null hypothesis is accepted, and the trend is insignificant. A trend will be considered statistically significant if it is significant at the 95% confidence level. Sen’s slope estimator is applied when the trend is assumed to be linear, showing the quantification of changes per unit time (slope). It is given by Equation (5):
T s = x a x b a b
where Ts is the estimate at year xa, and xb are considered data values at the time a and b (a > s), correspondingly.

3. Results and Discussion

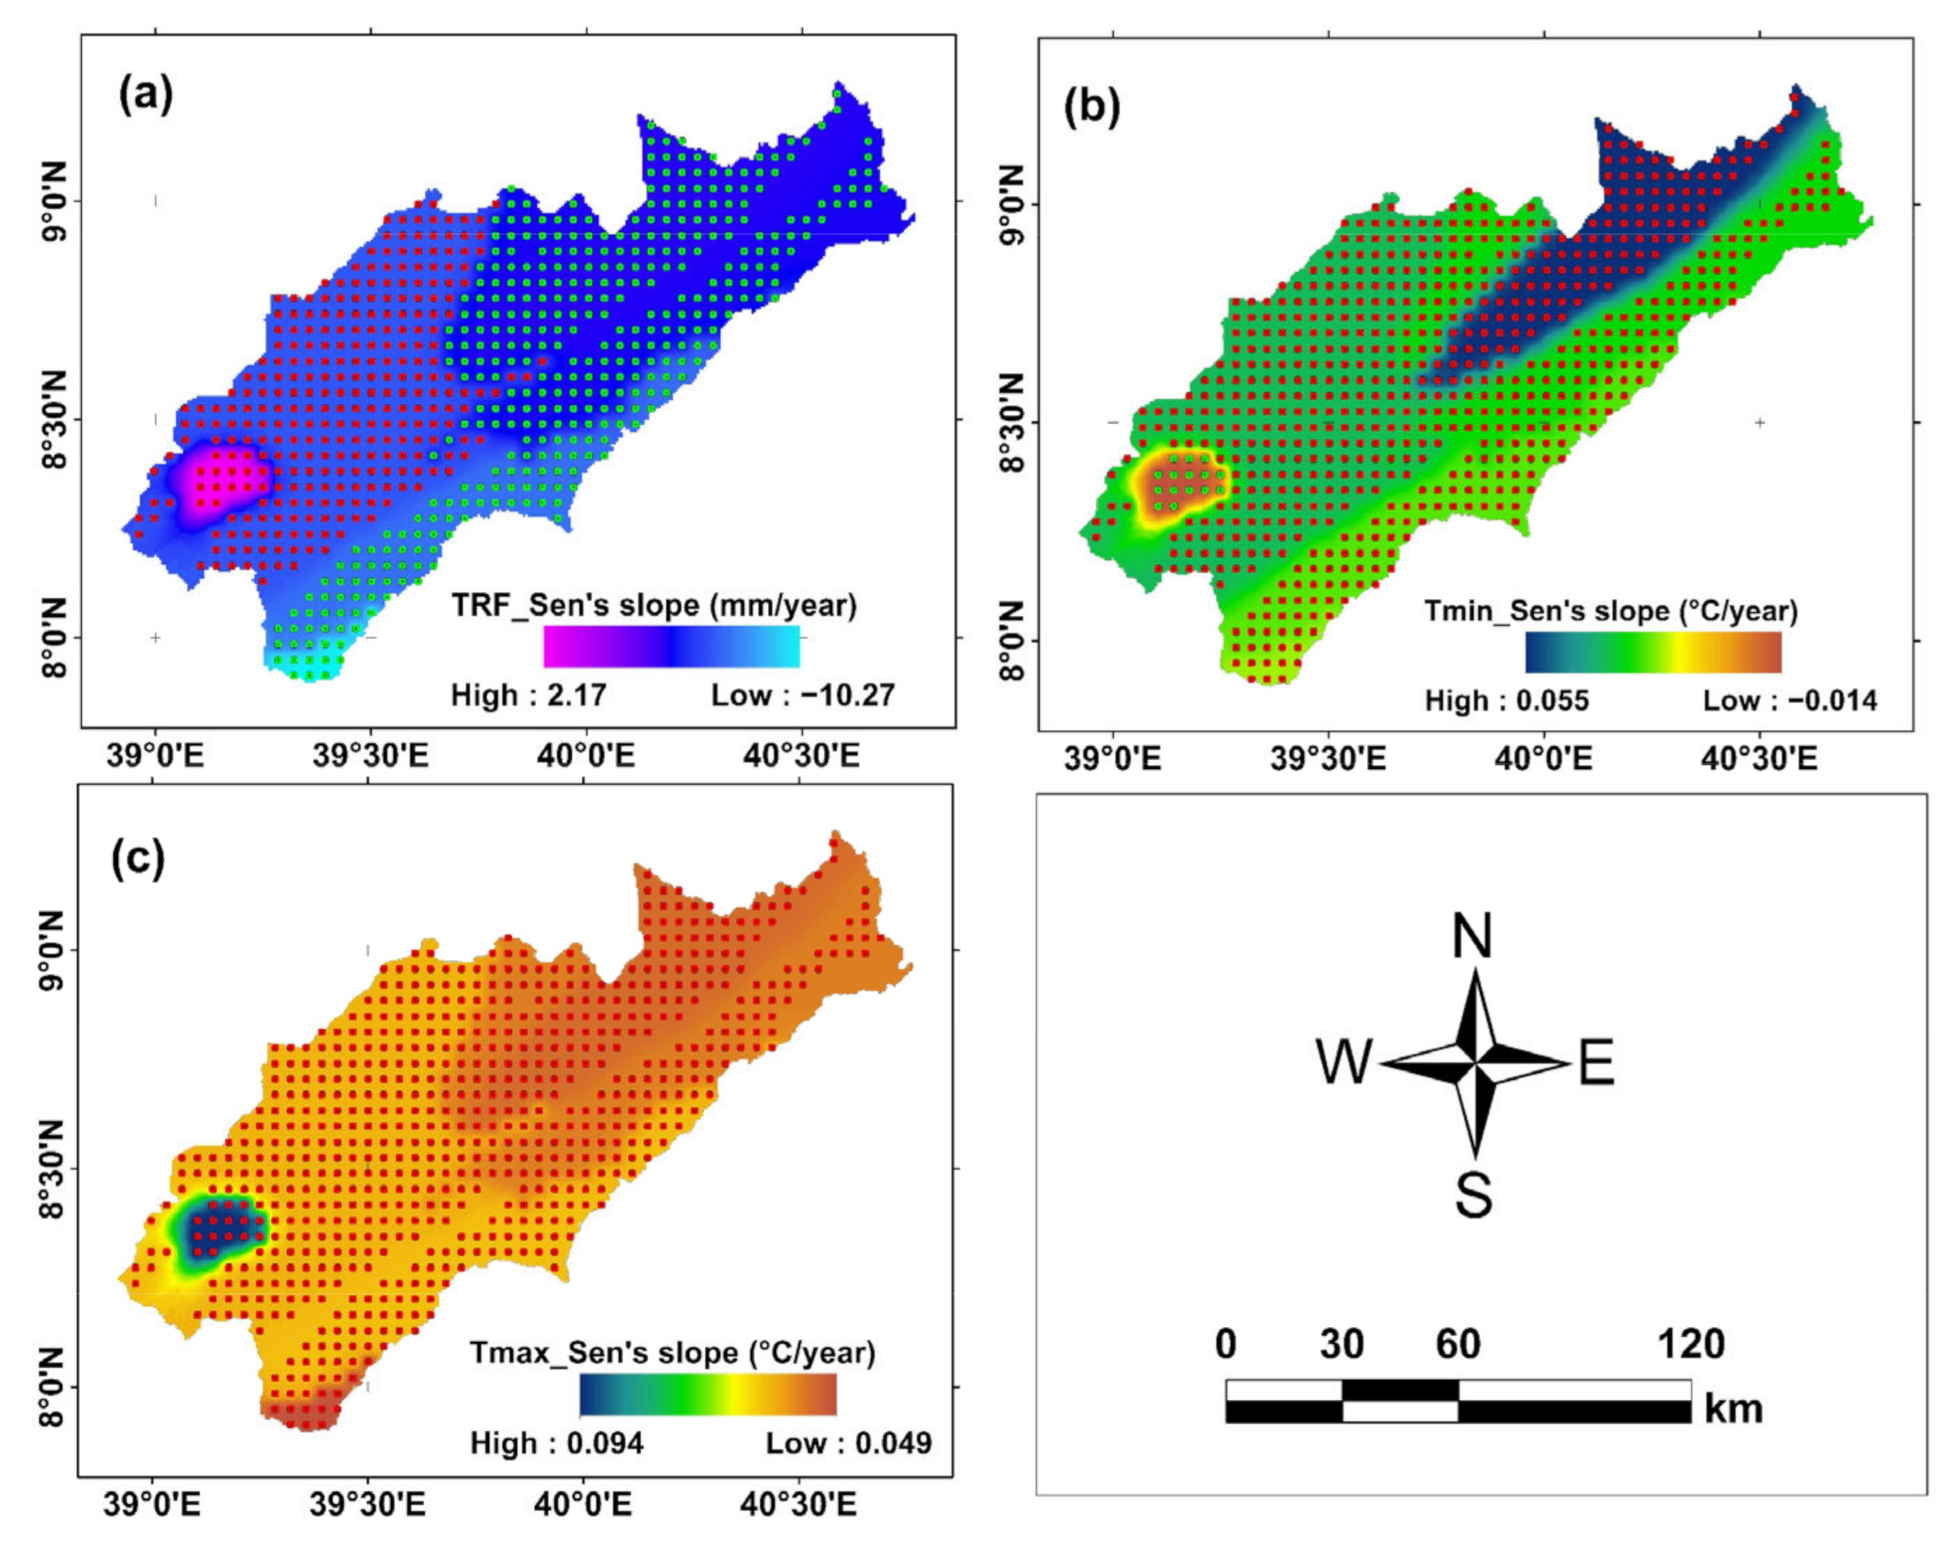
3.1. Observed Annual Trend in Mean Temperature and Rainfall

Observed changes in annual mean temperature and rainfall show a significant decrease in annual total precipitation (TRF) and an increase in minimum (Tmin) and maximum temperature (Tmax) between 1983 and 2016 (Figure 2 and Table 1). A significant and highest decreasing trend (−3.83 mm/year) in TRF was observed in hot–warm arid, while the lowest (−10.26 mm/year) is observed in cold–very cold AEZ. The trend in hot–warm semiarid AEZ shows an insignificant increase (2.16 mm/year) in TRF (Figure 2 and Table 1). Five out of the six AEZ tend to show a positive Tmin trend, with only one hot–warm semiarid station depicting an insignificant decreasing trend (Figure 2 and Table 1). The magnitude of change in the Tmin was reported to be highest and positive at 0.055 °C/year in the hot–warm arid and lowest at 0.019 °C/year. The trend in Tmax shows significant increase in all AEZs (p < 0.05). In relative terms, the magnitude of change was reported to be highest at 0.091 °C/year for the hot–warm semiarid and lowest at 0.054 °C/year for the hot–warm arid.
In general, annual trends in TRF observed in this agroecology are in line with previous studies conducted in different parts of Ethiopia. Worku et al. [52] reported a decrease of total rainfall in Alemketema and Mehalmeda stations in the Jema subbasin of the Blue Nile. Nasir et al. [60], in their study in the northwestern escarpment of Ethiopia, show a significant increase in Tmax and Tmin over the studied livelihood zone. Similar findings were reported by Shawul and Chakma [61] over Upper Awash. The change in mean maximum and minimum temperature is of concern, due to ripple effects on agriculture in general and crop productivity in particular [62]. Although the yield response to temperature varies among crop varieties, a significant increasing trend in mean minimum and maximum temperature can negatively affect crops through increasing evapotranspiration. This affects the cellular process related to crop growth, development, and lower crop yield [63].

3.2. Observed Annual Trend in Extreme Temperature

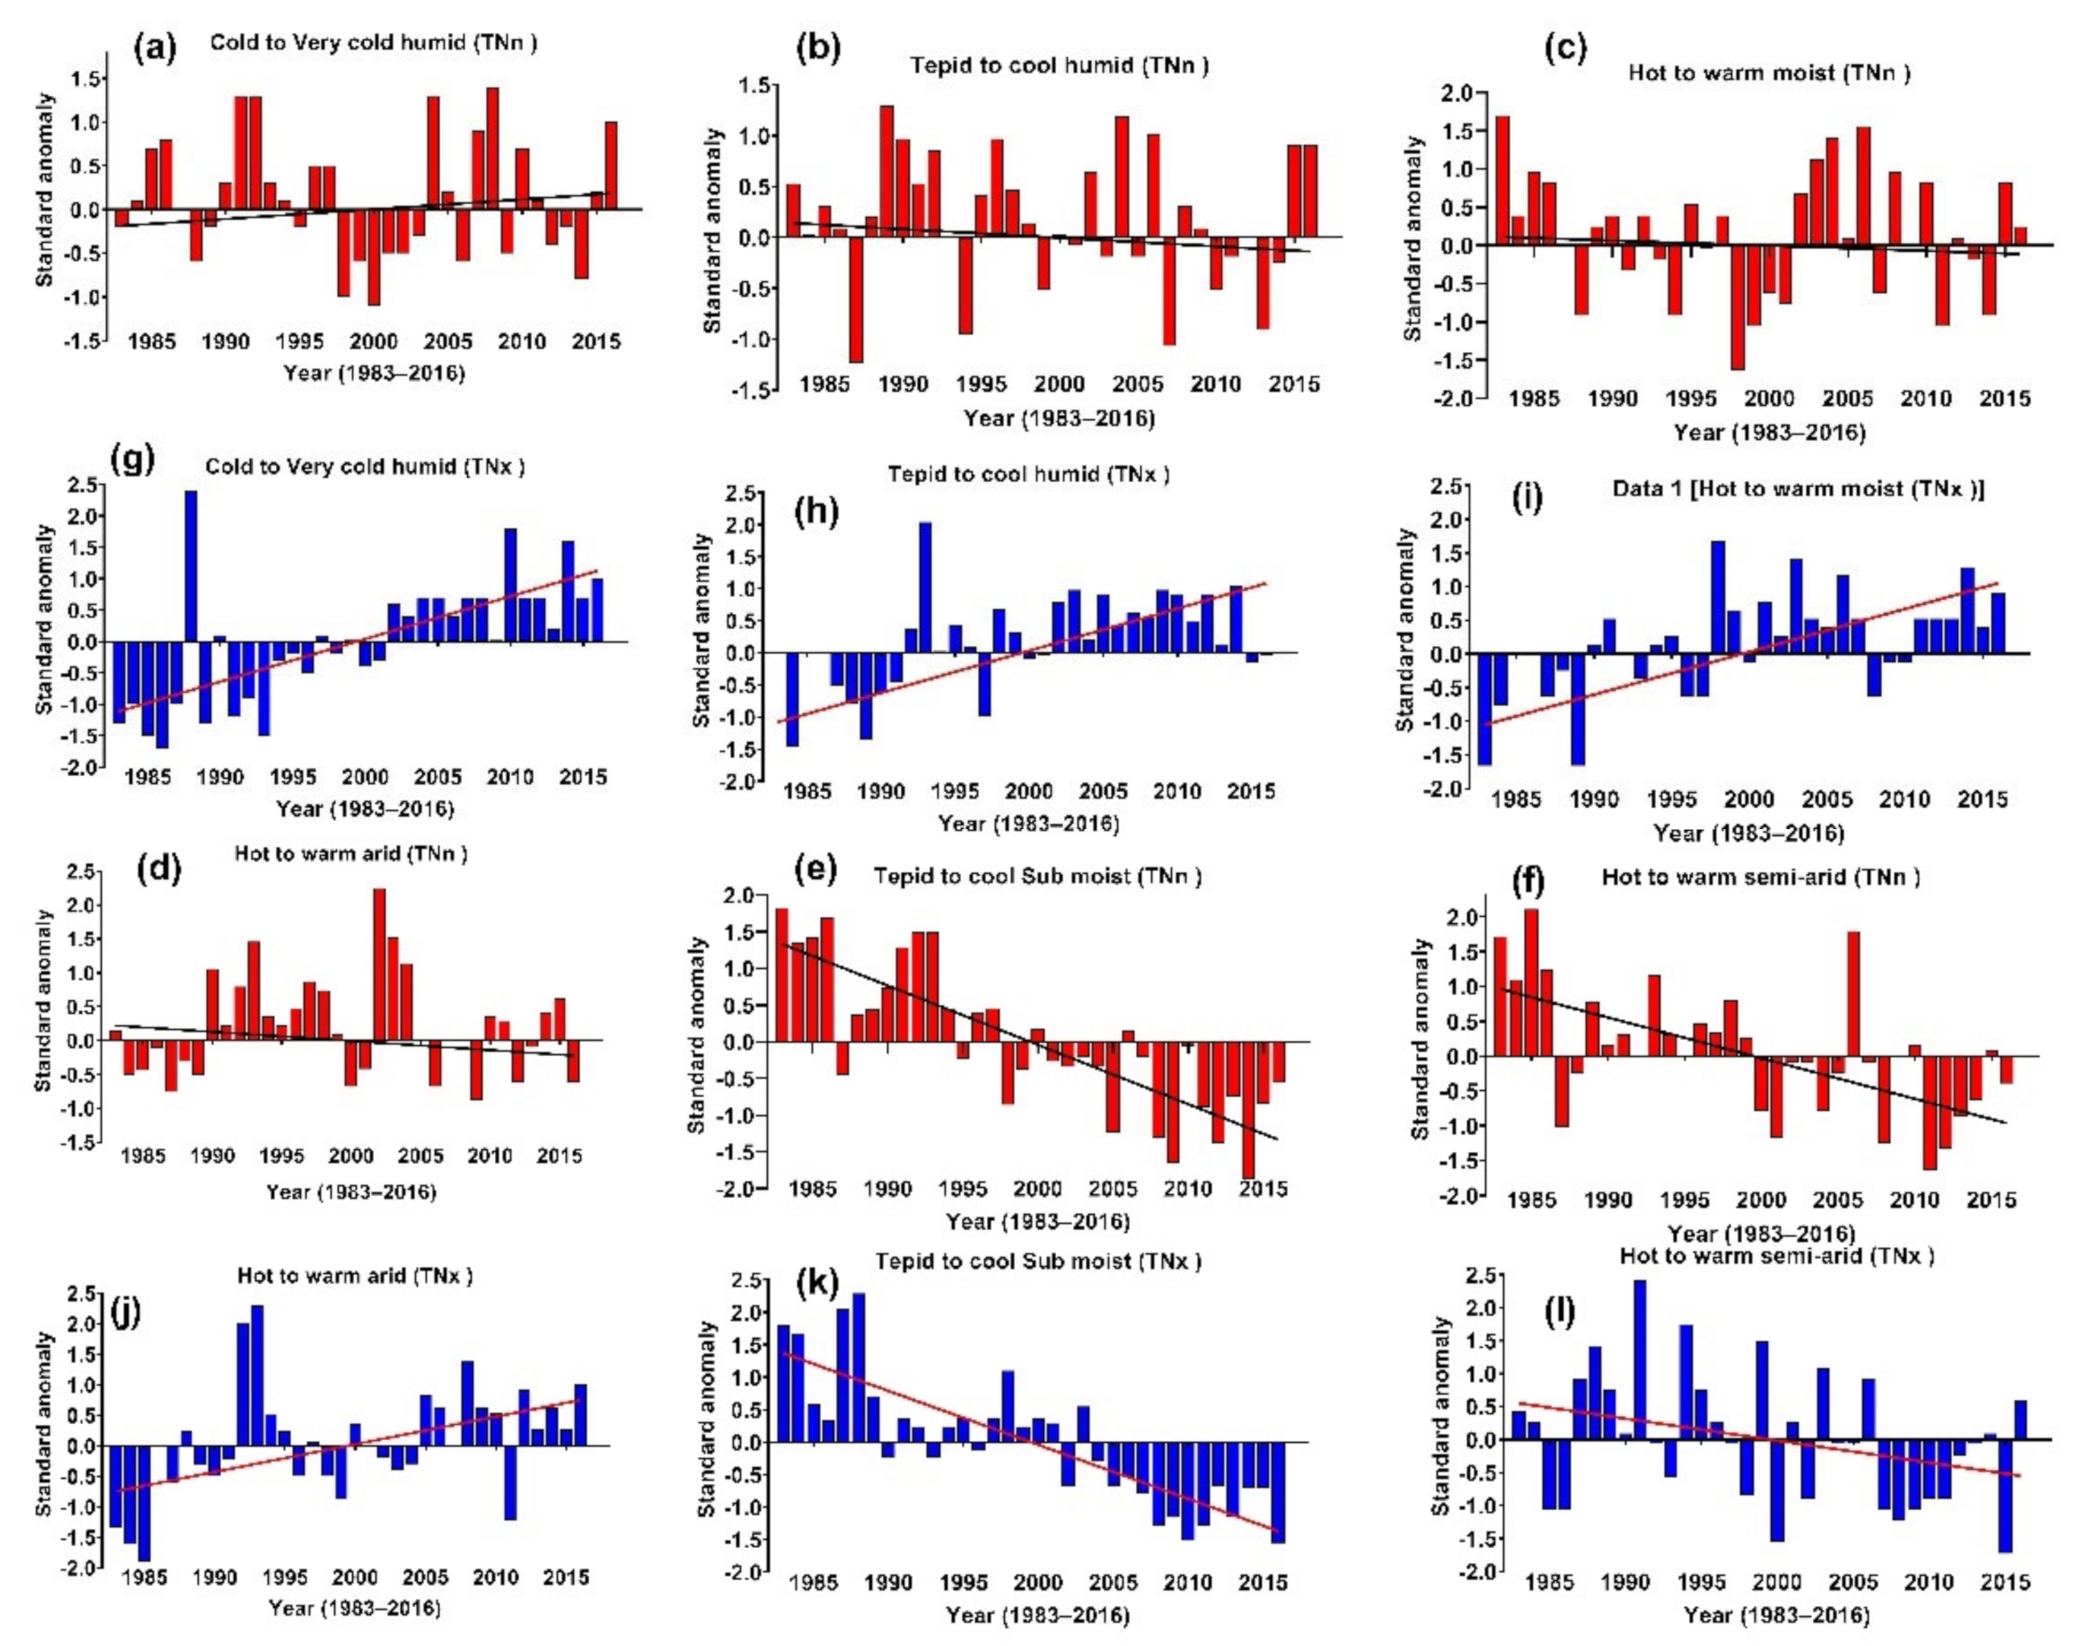
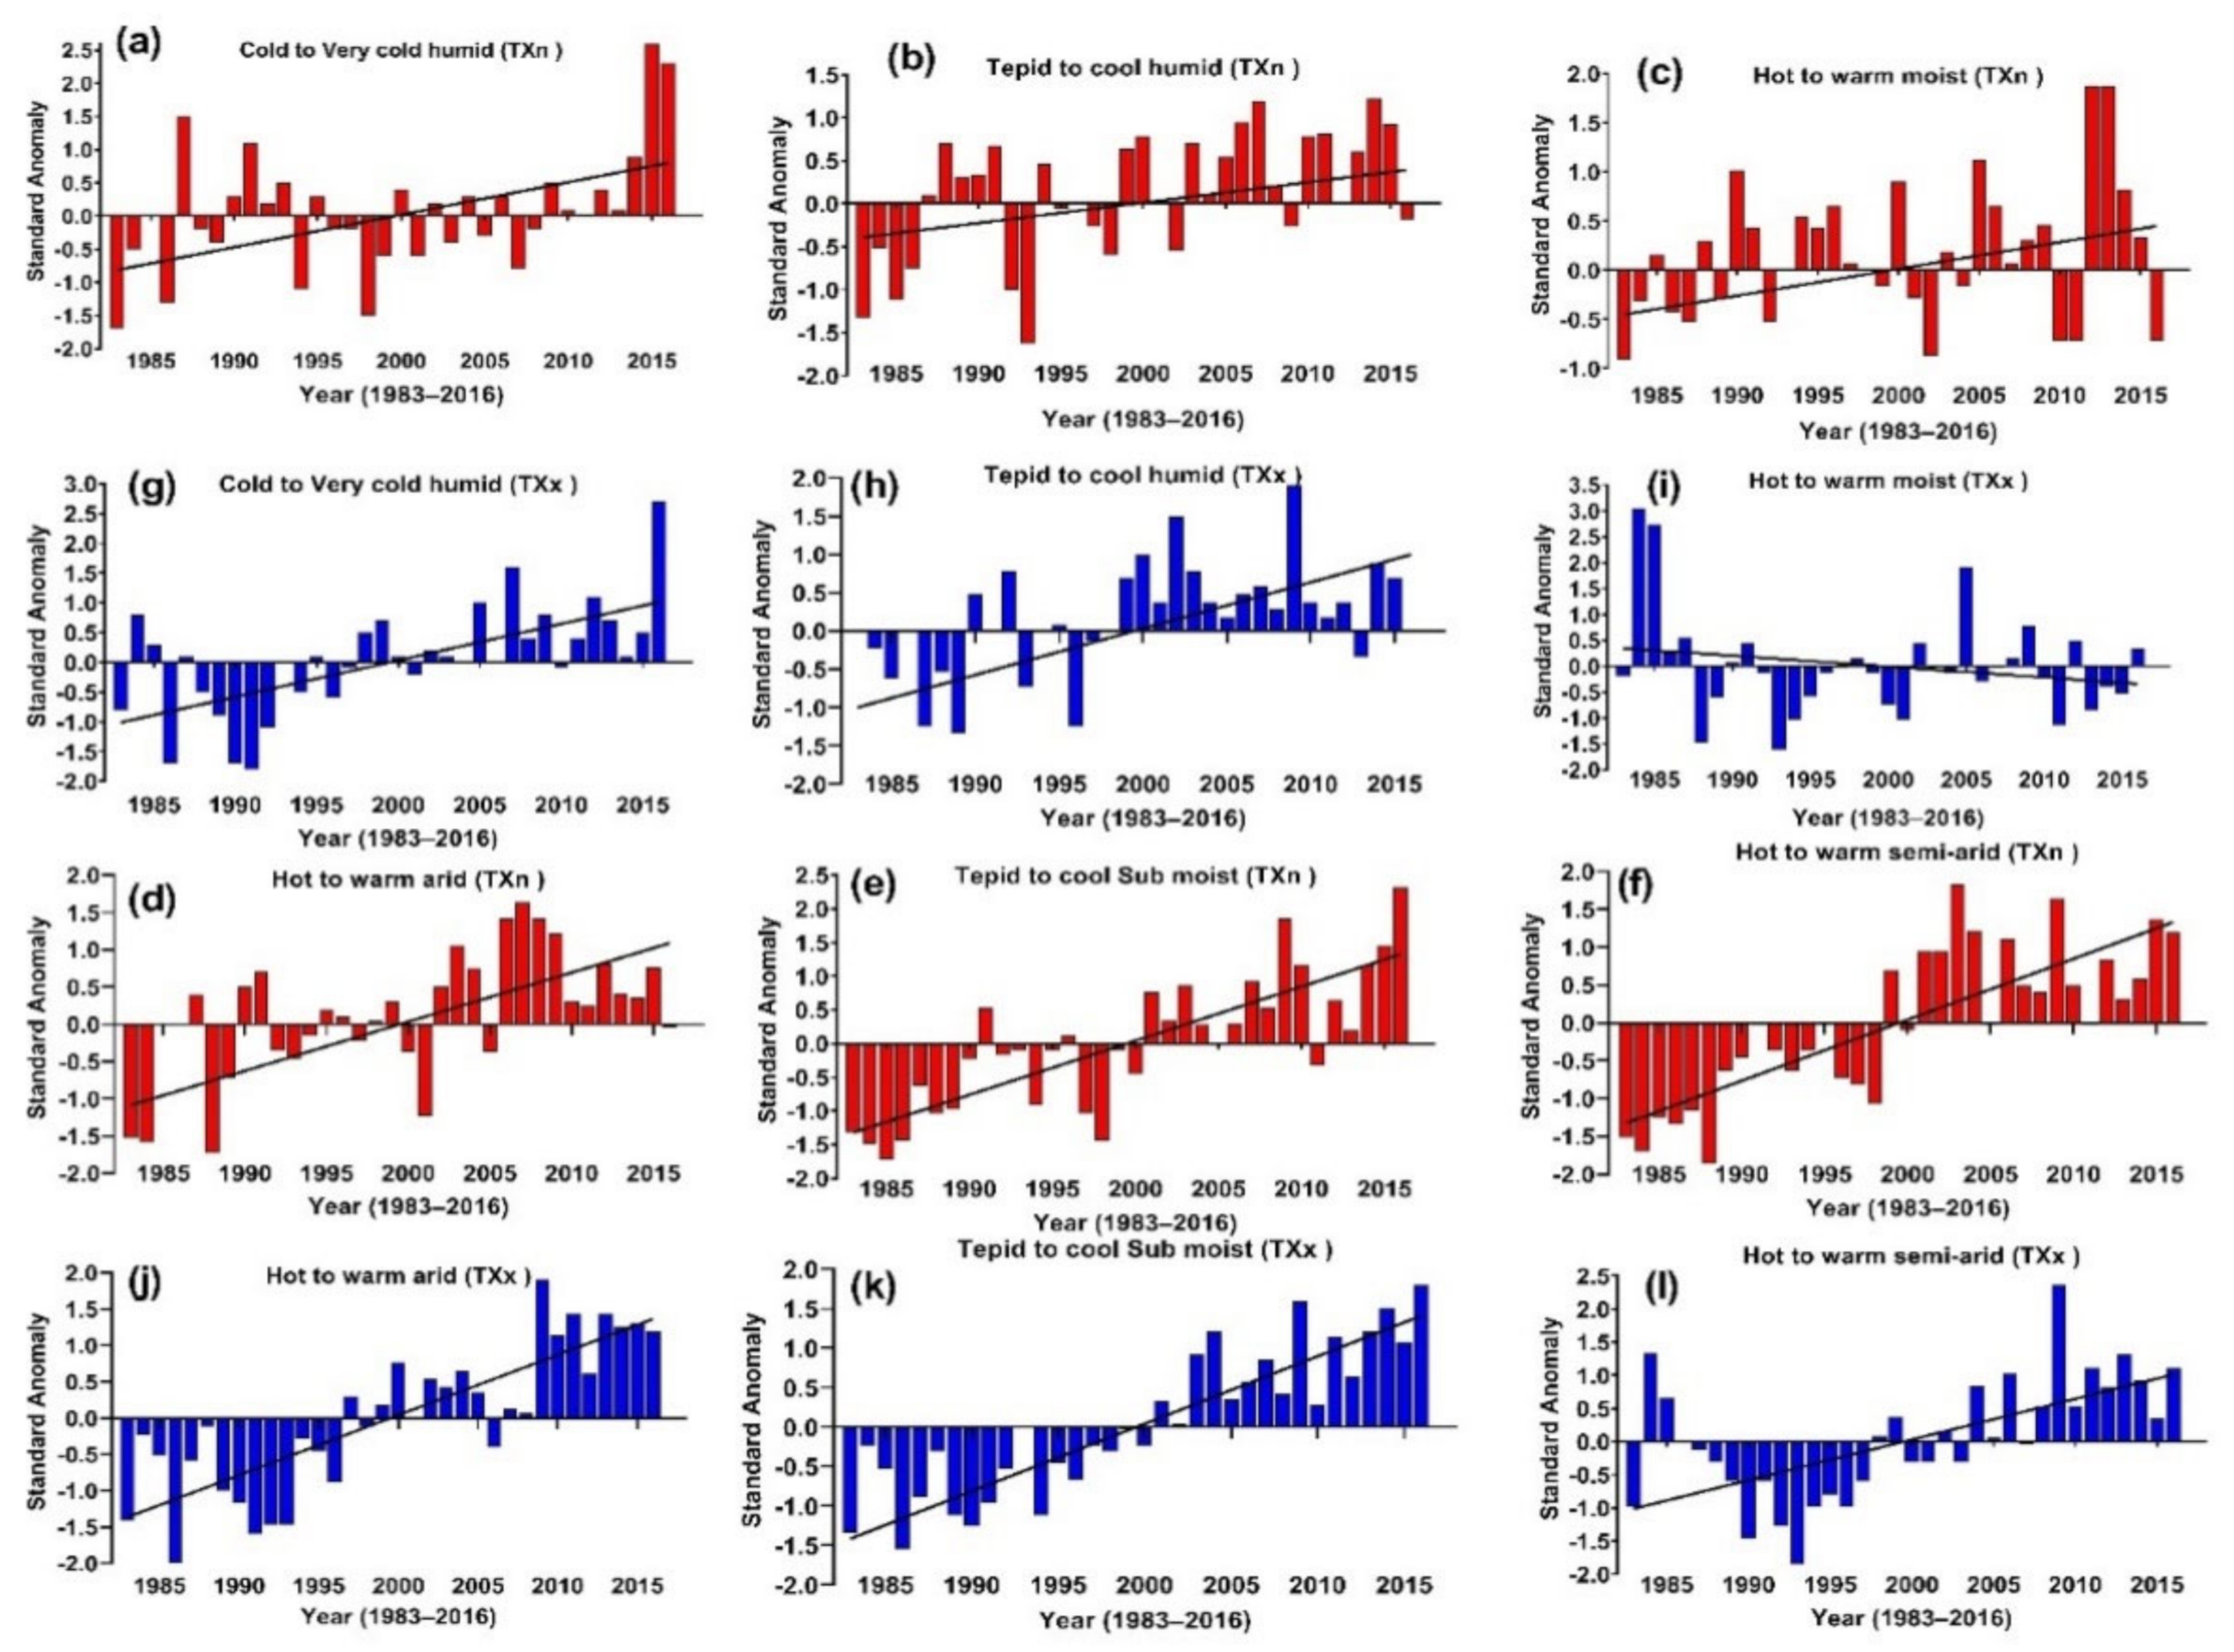
3.2.1. Coldest Night and Warmest Night

Table 2 shows the temporal trends of temperature extremes across agroecologies. The MK test revealed a significant decrease in TNn in hot–warm moist, tepid–cool sub-moist, and hot–warm semiarid AEZ. This indicated that TNn is likely to increase at a higher rate than the maximum temperature in many AEZs. The highest and negative −0.0730 °C/year (p < 0.001) trend in TNn was reported in the hot–warm moist. Except for hot–warm semiarid, the significantly increasing trend (p < 0.001) for TNx was observed in other AEZs. The magnitude of change was reported to be highest at 0.075 °C/year for the cold–very cold humid (Table 2). The highest positive value of TNx was observed in 1988, 1993, 1998, and 1993 (Figure 3g–j) for cold–very cold humid, tepid–cool humid, hot–warm moist, and hot–warm arid, respectively. However, tepid–cool sub-moist and hot–warm semiarid AEZ experienced the highest negative anomalies in 1988 and 1991, respectively (Figure 3i,k). Negative anomalies were commonly observed in the 1990s and 2000s for tepid–cool sub-moist and hot–warm semiarid (Figure 3e,f). The results suggest contrasting with recent studies conducted in different parts of the world [18,64,65], which showed an increasing trend in TNn. However, the same studies [18,65] reported a significant increase in TNx. The difference between results could result from differences in the extent of periods and area-conceptualization-based studies (i.e., agroecology vs. watershed). Furthermore, the significant increasing trends in TNx on most agroecologies are the clear indicator of a warming pattern in the subbasin, which could reduce agricultural production [66].

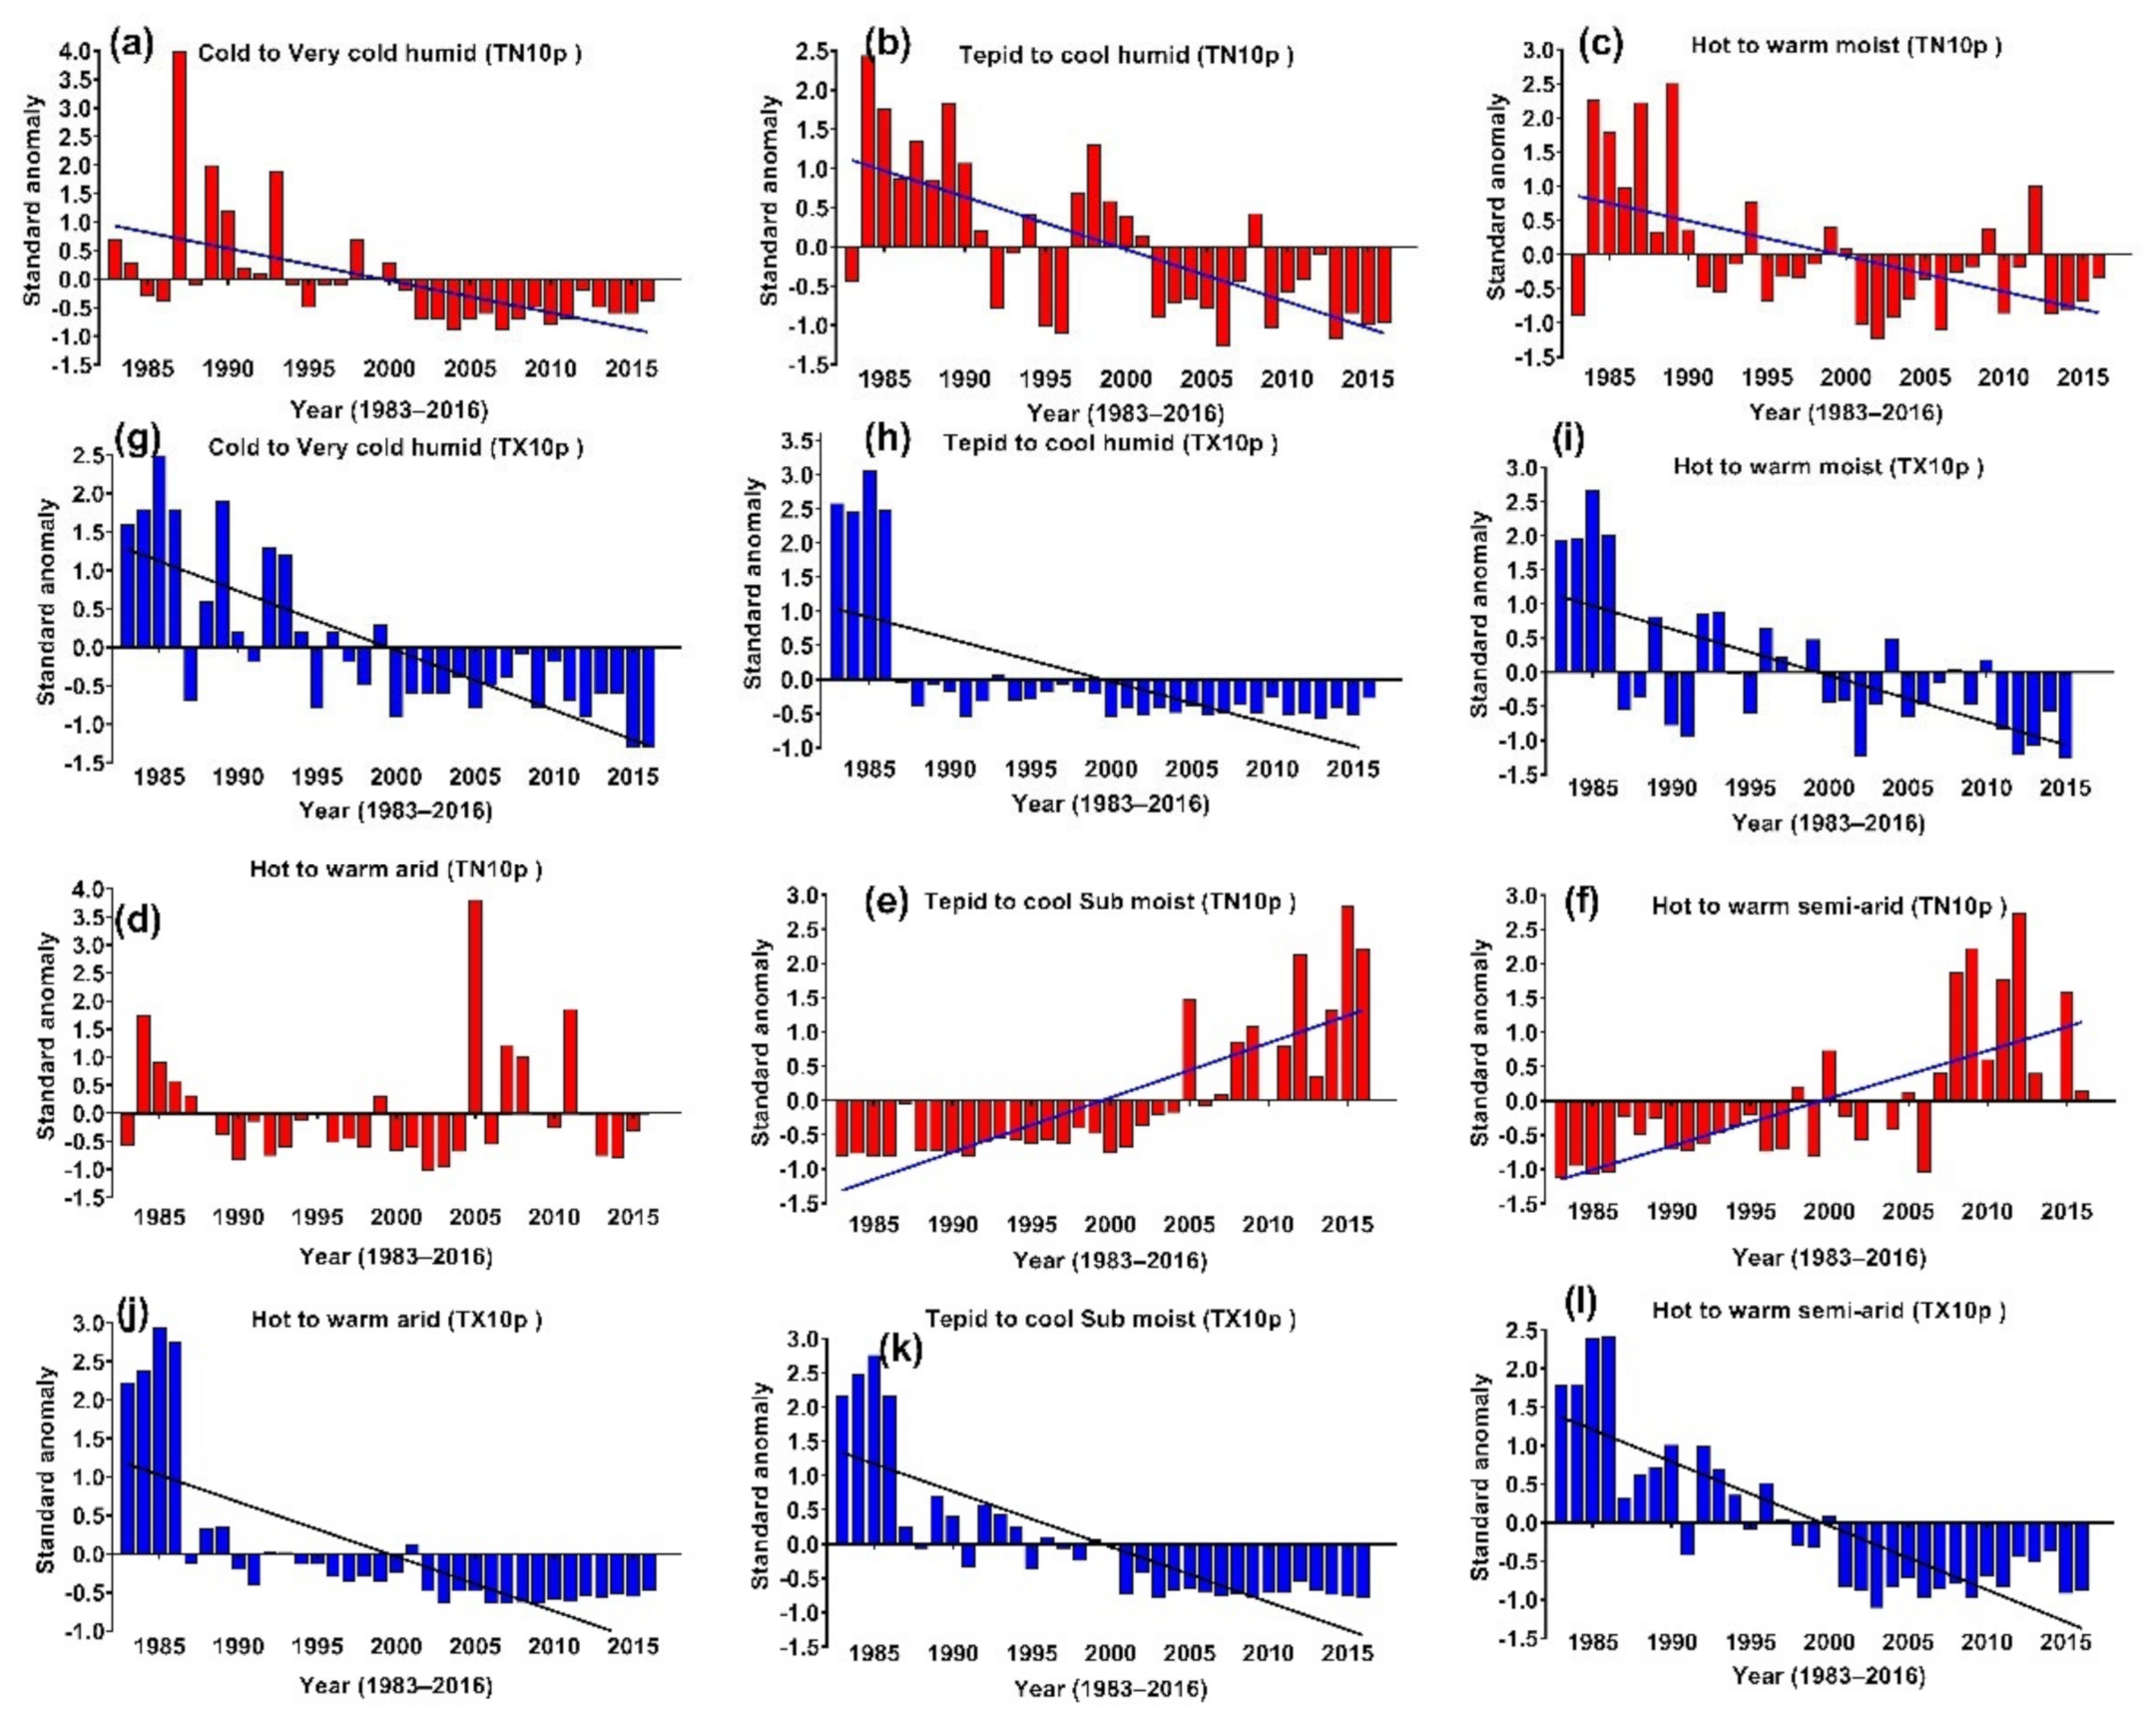
3.2.2. Cool Days and Cool Nights

Results of the frequency of TN10p, show a significant decrease in the cold–very cold humid, tepid–cool humid, hot–warm moist, and hot–warm arid agroecology zones. However, a significant (p < 0.001) positive trend was observed at tepid–cool sub-moist and hot–warm semiarid (Table 2). Berhane et al. [67] reported a statistically significant decreasing trend in studied stations in semiarid areas of Western Tigray between 1983 and 2016. Similarly, Gebrechorkos et al. [19] found a significant decreasing trend in TX10p and TN10p over Ethiopia, Kenya, and Tanzania from 1981 to 2016. On the other hand, except for tepid–cool humid, a significant (p < 0.001) decreasing trend in the frequency of TX10p was observed in the study area (Table 2). The magnitude of change in TX10p was reported to be highest and positive 0.050 °C/year in the tepid–cool humid (p < 0.001). The magnitude of change on the TN10p was reported to be highest and positive at 0.057 °C/year in the hot–warm semiarid agroecology zone (p < 0.001) (Table 2). A recent study conducted in different parts of the country [42,65,68] agrees with our study. Furthermore, [24] predicted a decrease in the frequency of TN10p by considering different climate change scenarios, a similar case to what has been projected globally [1].
The TN10p anomalies show a reduction in negative anomalies since the beginning of the 2000s in the cold–very cold humid, tepid–cool humid, and hot–warm moist agroecologies (Figure 4a–c). On the contrary, significant and positive anomalies are seen for tepid–cool sub-moist and hot–warm semiarid in the 2000s and 2010s, respectively (Figure 4e,f). Regarding the frequency of TX10p anomalies, the negative anomalies have been consistently declining since the beginning of the 2000s for all agroecologies except hot–warm moist (Figure 4h).

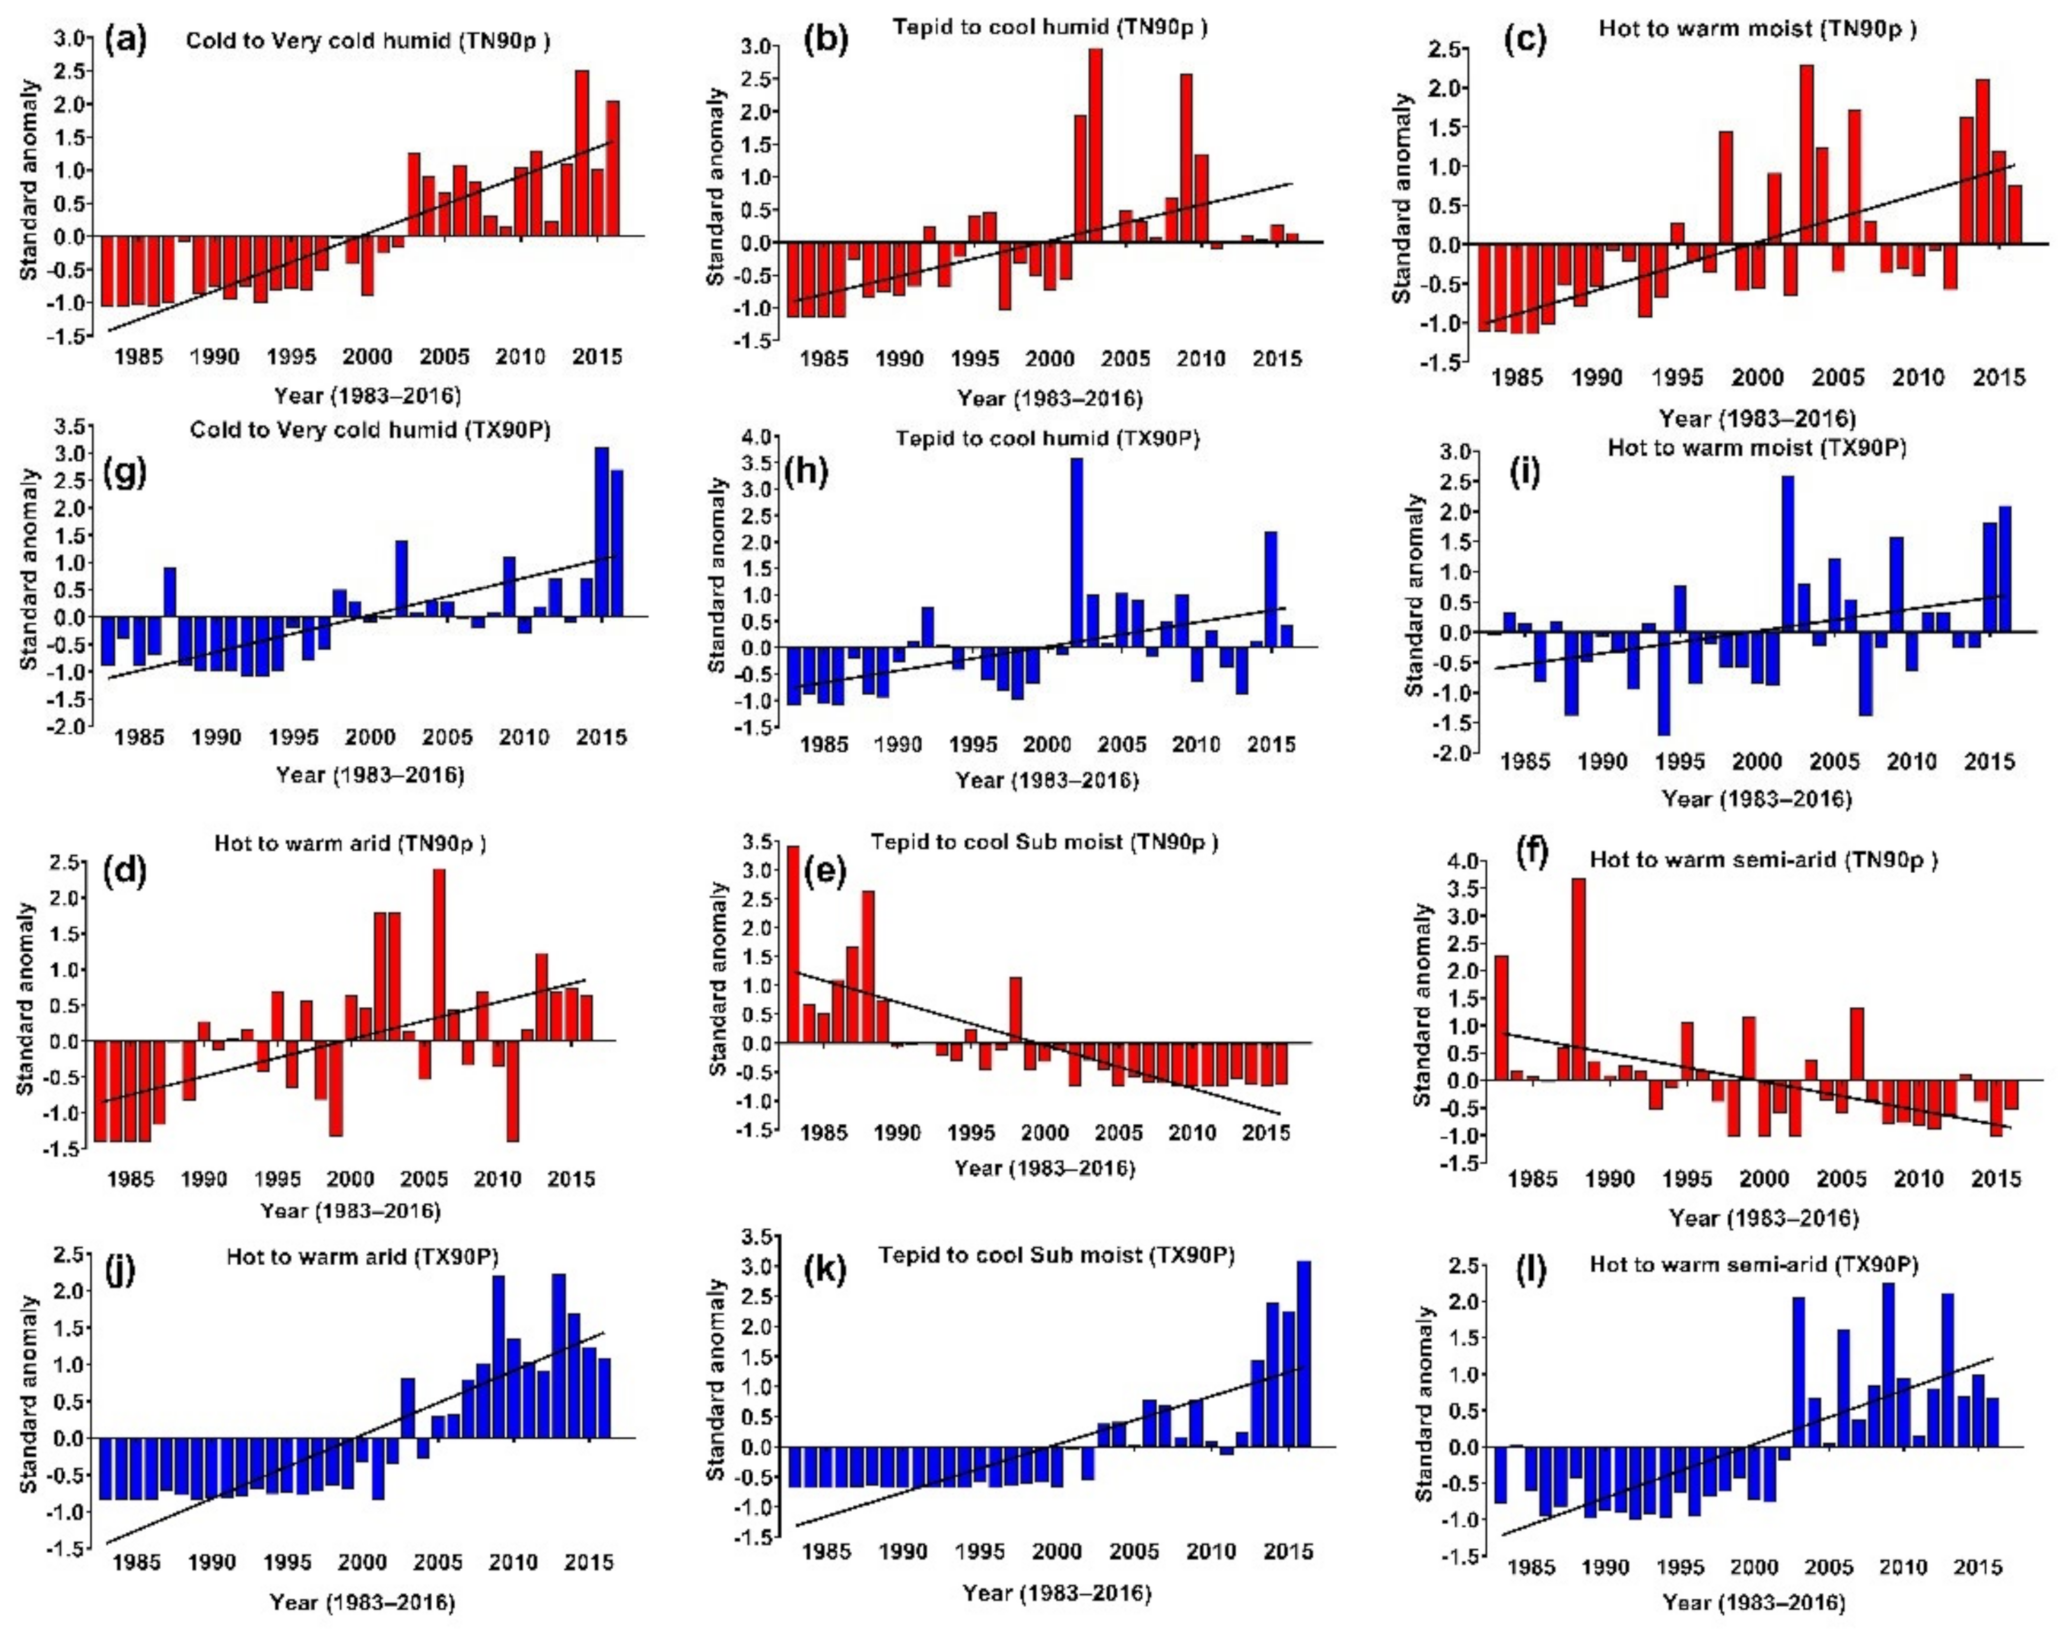
3.2.3. Warm Days and Warm Nights

The increasing trends in the frequency of TX90p were observed at 3 of the 6 AEZs (p < 0.001) (Table 2). Significant positive trends are evident at all stations. Cold–very cold humid, hot–warm moist, and hot–warm arid showed decreasing and significant trends in TX90p. Unlike the case in TX90p, all AEZs show increasing trends in the frequency of TN90p. The magnitude of change on TX90p was reported to be highest and positive at 0.075 °C/year in warm–warm arid (p < 0.001) and lowest (0.040 °C/year) in humid–warm (Table 2). Similarly, the magnitude of change in TN90p for the cold–very cold humid was highest (0.080 °C/year) and lowest (0.049 °C/year) at (p < 0.001). The results are consistent with the observed change in other parts of Ethiopia and elsewhere. Esayas et al. [65] reported a significant increasing trend in the frequency of warm days and warm nights in lowland and highland agroecologies of Southern Ethiopia. An increase in the trends of the numbers of warm days and warm nights during the period 1971–2000 in the Lake Victoria region was reported [69]. Considering the seasonality of crop production, a global study [70] reported that an increase in trends of TX90p and TN90p are usually associated with a decrease in crop yields. This points out the impact of increasing warm days and nights trends on crop production and productivity across agroecologies.
In most agroecology zones, the annual number of warm days and nights are increasing, suggesting that significant increase in warming. When we compare the TN90p and TX90p anomalies, the TN90p peaked in 2014, 2004, 2004, and 2006 for the cold–very cold humid, tepid–cool humid, hot–warm moist, and hot to hot–warm arid, respectively (Figure 5a–d). Overall, warming anomalies are consistently increasing in all AEZs after 2008.

3.2.4. Warmest Day and Coldest Day

Concerning the TXx, significant increasing trends were observed in all agroecologies, except in hot–warm moist, where the trend is insignificant and decreasing (Table 2). The trend in TXx is highest for tepid–cool sub-moist, with the magnitude of change being 0.089 °C/year (p < 0.001). At the same time, the lowest magnitude of change was observed in hot–warm moist to be −0.008 °C/year. The TXn is substantially increasing in all agroecological zones, with the highest magnitude (0.081 °C/year) for tepid–cool sub-moist and hot–warm semiarid. The lowest (0.024 °C/year) change is observed for hot–warm moist. The annual TXn and TXx annual show significant warming anomalies for 1983–2016 in most agroecological zones (Figure 6a–l).
The findings corroborate previous studies over different parts of Ethiopia and elsewhere in the world. For example, Shawul and Chakma [61], in their study over the Upper Awash Basin reported a decreasing trend in TXn. However, Tadese et al. [28] testified an insignificant trend in TXn in all the sampled stations in the country. Chen et al. [71] studied variations in extreme temperature in China and found a significant increasing trend from 1966 to 2015. The increase in TXx across the agroecology zone is another indicator of changing climate in the subbasin. An upward trend in TXx in the main cropping season could reduce agricultural yields [72].

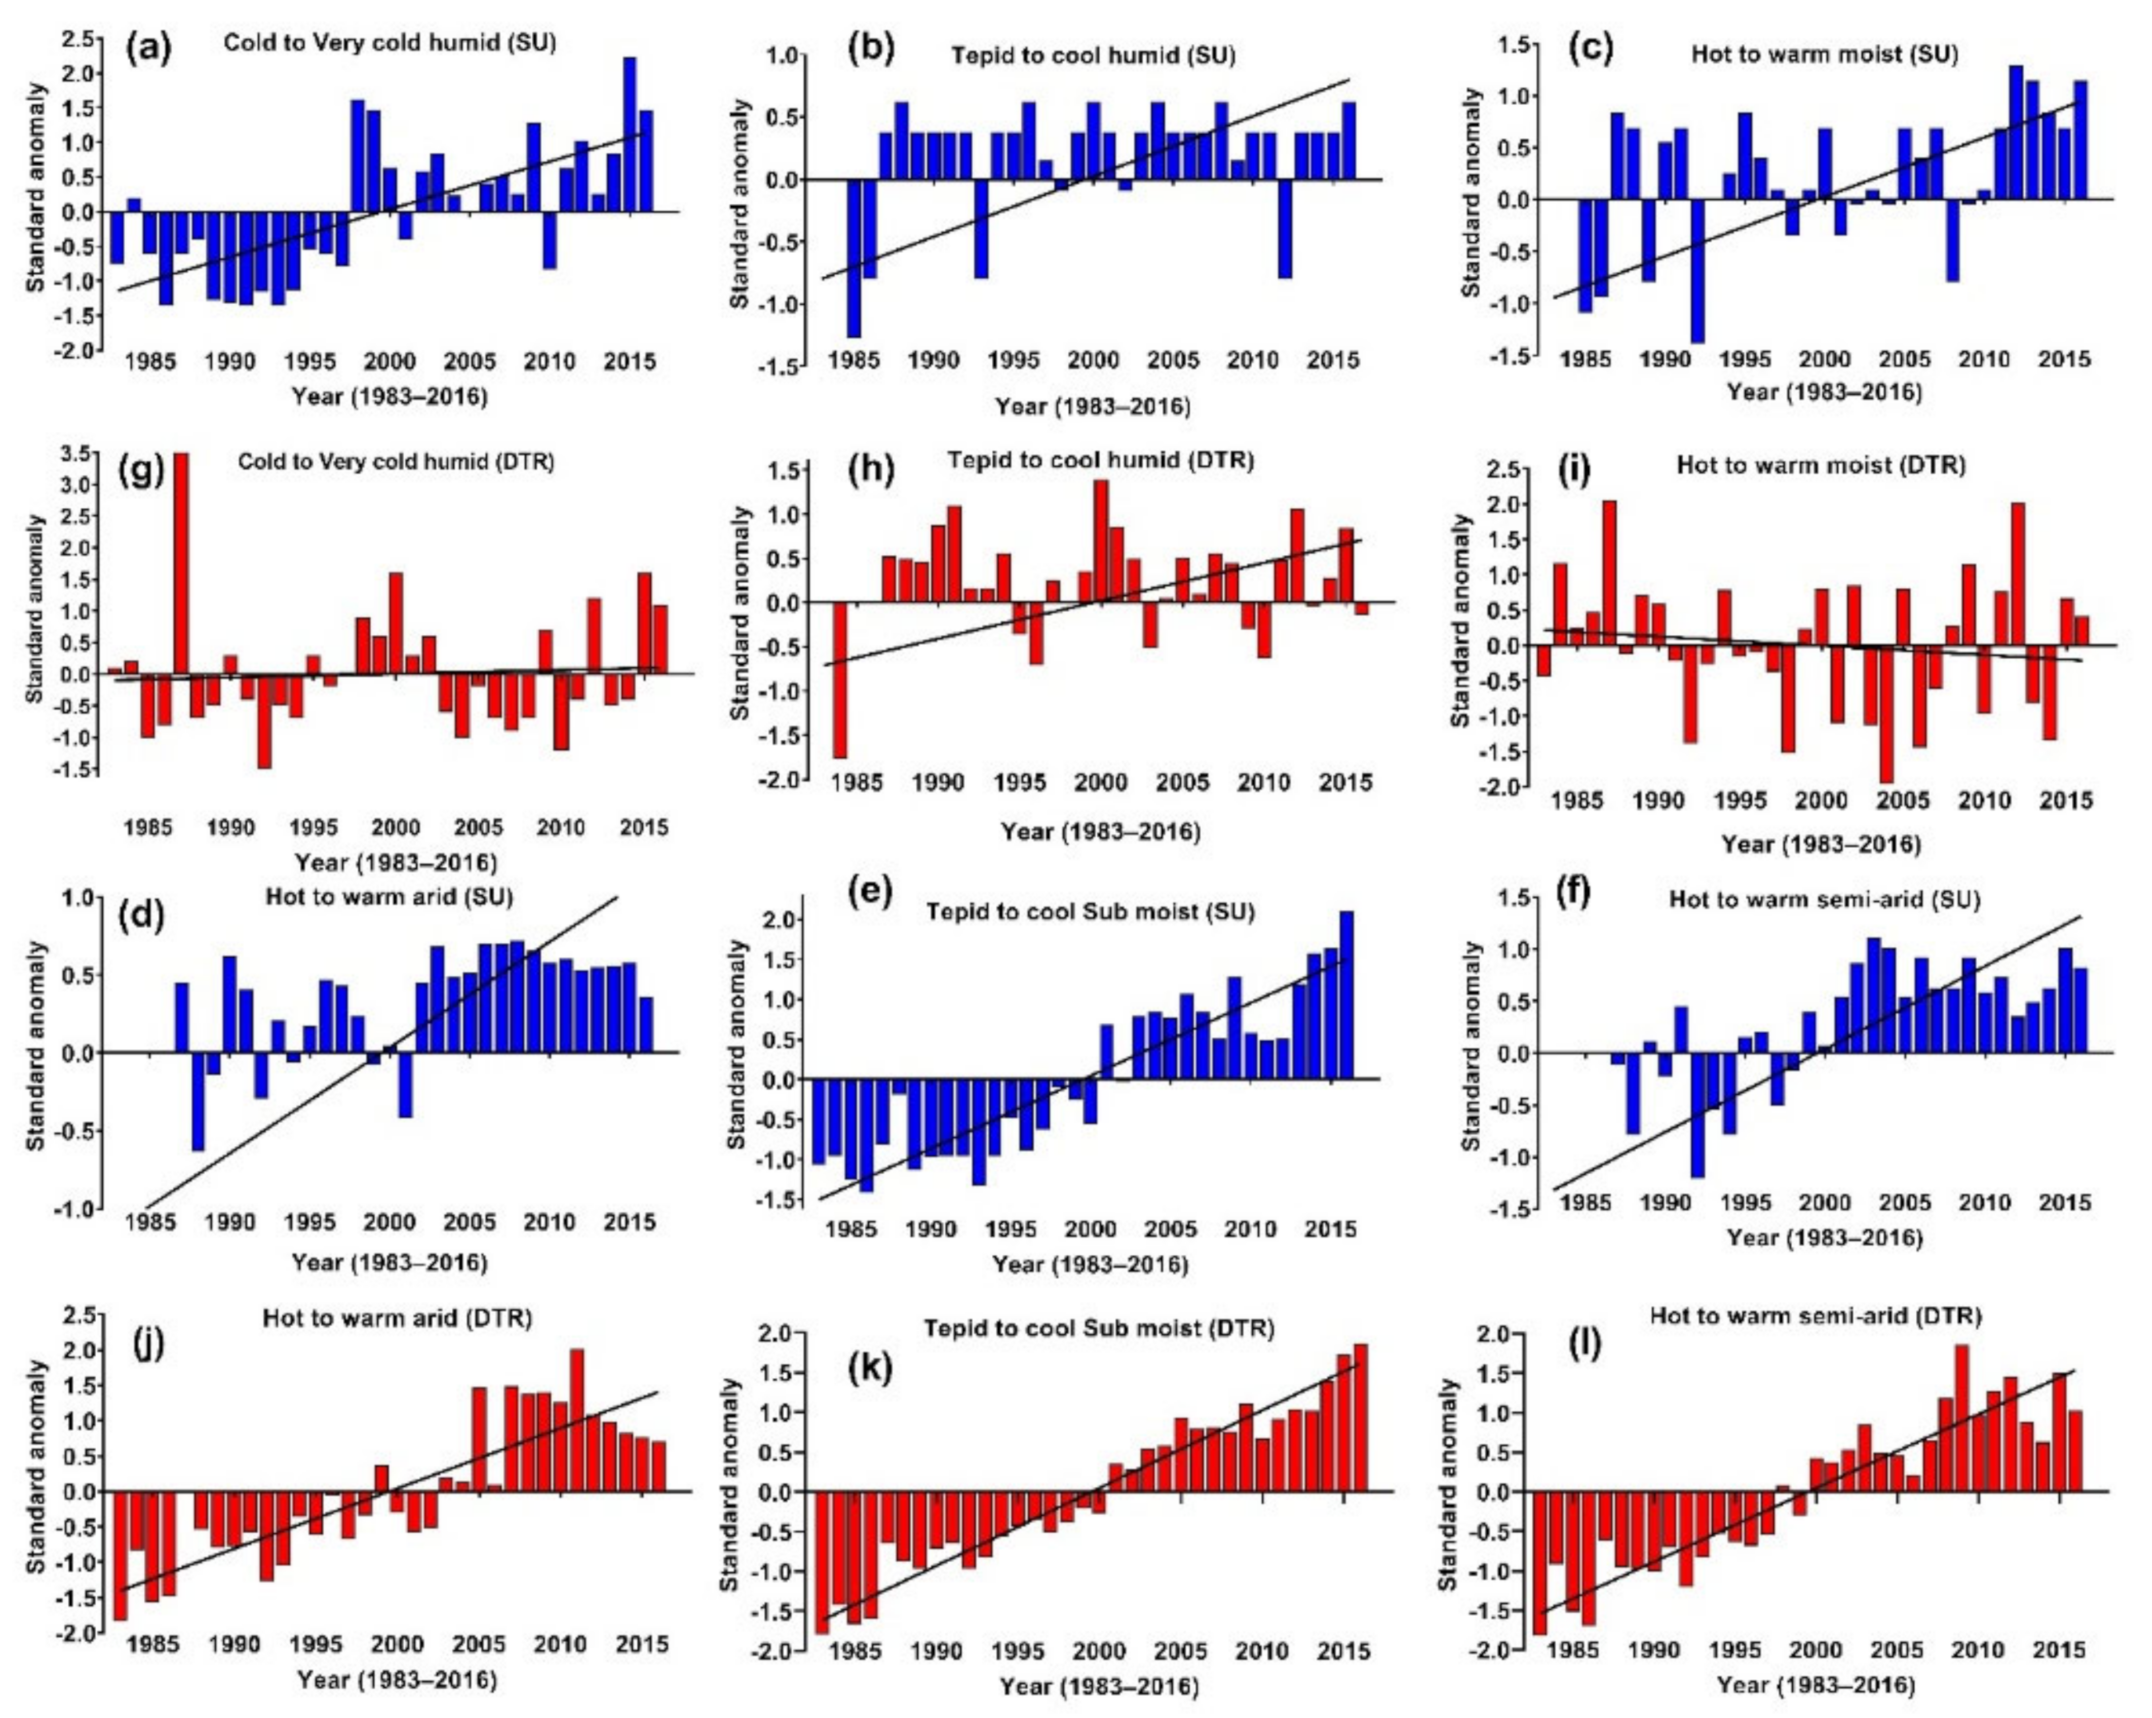
3.2.5. Diurnal Temperature Range and Number of Summer Days

Diurnal temperature range (DTR) trends are significantly increasing in the tepid–cool humid, hot–warm arid, tepid–cool sub-moist, and hot–warm semiarid zones (Table 2), indicating that the daily maximum and minimum temperatures are significantly changing. Only hot–warm moist stations showed an insignificant decreasing trend in DTR, meaning that daily maximum and minimum temperatures are not changing in opposite directions at many of the stations studied. Compared with other agroecologies, the tepid–cool humid and cold–very cold humid recorded the highest (0.120 °C/year) and lowest (0.013 °C/year) magnitude change of DTR, respectively. Esayas et al. [65] reported an insignificant decreasing trend (−0.015 °C/year) in the DTR of the midland AEZ of Southern Ethiopia. Regarding trends in the number of SU, all AEZ in the study shows a significant increase (Table 2). This indicates that the number of days by which the daily temperature is above 25 °C is significantly increasing. Compared with other agroecologies, the highest and lowest magnitude change of SU was 0.22 °C/year and 0.034 °C/year (p < 0.001) in the tepid–cool humid and hot–warm arid AEZs, respectively (Table 2). The annual number of DTR and SU shows a significant change from 1983 to 2016 in most agroecology zones (Figure 7a–l).

3.2.6. Cold Spell Duration Indicator and Warm Spell Duration Indicator

The CSDI and WSDI are annual counts of at least six consecutive days with Tmin greater than the historical 90th percentile value and Tmax less than the historical 10th percentile value. Five of the six agroecology zones showed significant increasing trends in the WSDI. On the other hand, hot–warm moist shows no trend (Table 2). The highest and lowest magnitude change of WSDI was 0.200 °C/year and 0.020 °C/year (p < 0.001) in the tepid–cool humid and hot–warm semiarid, respectively. Regarding the CSDI, a significant increasing trend was observed in tepid–cool sub-moist. In contrast, significant decreasing trends were observed in tepid–cool humid and hot–warm moist (Table 2), indicating a decrease in the number of consecutive cool days at the stations. The highest magnitude of CSDI was detected in tepid–cool sub-moist (0.027 °C/year). A highest negative trend at −0.031 °C/year (p < 0.001) was recorded at hot–warm moist. When we compare the WSDI and CSDI anomalies, the WSDI reaches its peak in 2016, 2002, 2013, 2016, and 2013 for cold–very cold humid, tepid–cool humid, hot–warm arid, tepid–cool sub-moist, and hot–warm semiarid, respectively (Figure 8g–l).
The CSDI peaked in 1987, 1984, 1987, 2005, 2012, and 2012 for cold–very cold humid, tepid–cool humid, hot–warm moist, hot–warm arid, tepid–cool sub-moist, and hot–warm semiarid, respectively (Figure 8g–l). The development and yield of crops depend on factors like temperature, precipitation, soil moisture and fertility, crop pest and diseases, and other crop-management practices. Hence, increase in trends of warm and cold temperature extreme events, coupled with a lack of preparedness for increasing trends, affects agricultural productivity and the farmers whose livelihood depends on it.

3.3. Observed Changes in Precipitation Extremes

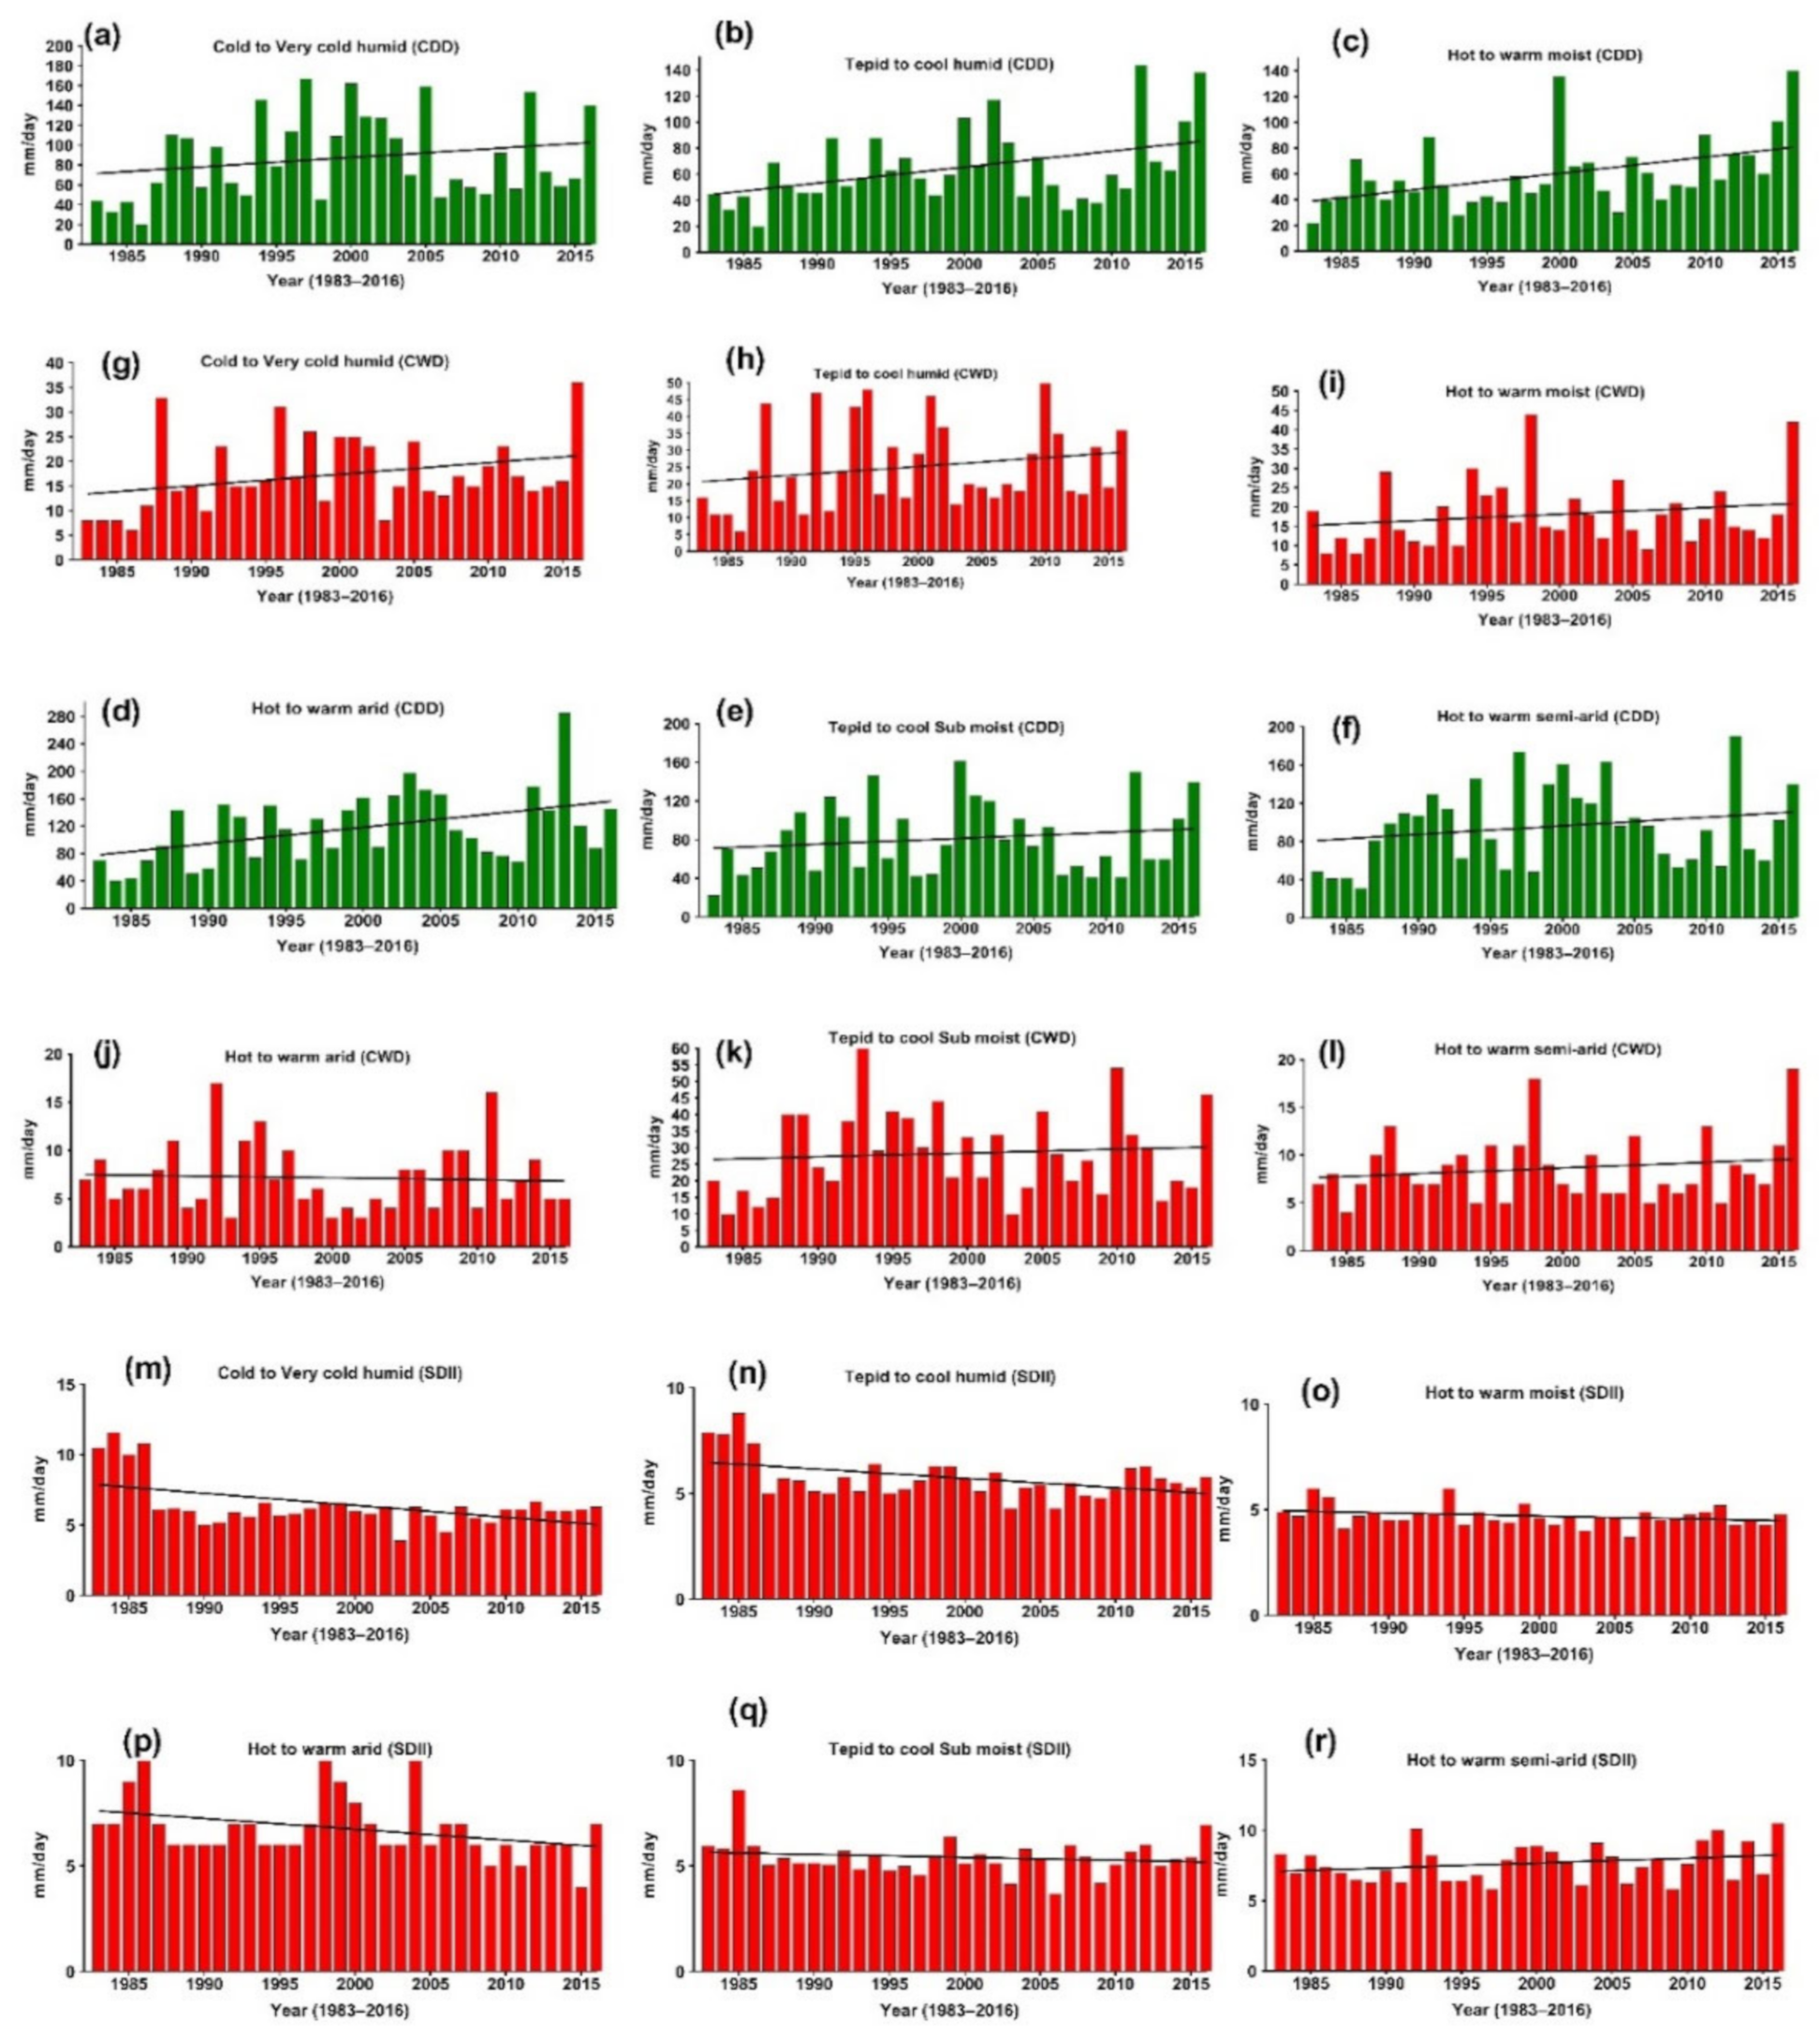
3.3.1. Consecutive Wet Days, Consecutive Dry Days, and Simple Daily Intensity Index

The annual spatiotemporal trends of extreme precipitation indices across the studied agroecologies are presented in Table 2. The maximum number of CWD (≥1 mm) did not show a significant trend in most studied AEZs. Except for cold–very cold humid, all regions of AEZ show an insignificant increasing trend. Though the AEZ are found in different basin locations, the CWD trend result was negligible. Previous research [28] made the same observation, where different eco-environments did not show significant trends in most studied areas. In contrast, a study by Mohammed et al. [73] in the northern highlands of Ethiopia shows a significant and increasing trend in Ambamariam, Mekaneselam, and Dessie stations. Unlike CWD, the maximum number of consecutive days when precipitation <1 mm (CDD) shows a significant increasing trend in tepid–cool humid, hot–warm moist, and tepid–cool sub-moist, and an insignificant increasing trend in the cold–very cold humid, hot–warm arid, and hot–warm semiarid. The increasing trend in CDD is an indicator of increasing dryness across agroecological zones. When the trend in CDD is high during the cropping season, it causes adverse consequences on rainfed agriculture. Compared with other agroecologies, the highest significant change of 0.032 °C/year (p < 0.05) magnitude for CWD was recorded in the cold–very cold humid AEZ. The insignificant and lowest trend in the CWD was observed in tepid–cool humid and hot–warm arid AEZ (Table 2). The result presented in tepid–cool humid, hot–warm moist, and tepid–cool sub-moist agroecology is consistent with [67], who found a significant increase in CWD in Dedebit, Maygaba, Maytsebri, and Sheraro of Western Tigray.
The highest CWD in cold–very cold humid, tepid–cool humid, hot–warm moist, hot–warm arid, tepid–cool sub-moist, and hot–warm semiarid was observed in 2016, 2010, 1998, 1992, 1993, and 1993, respectively (Figure 9g–l). On the contrary, the highest CDD was observed in 1997, 2012, 2016, 2013, 2000, and 2012 in the cold–very cold humid, tepid–cool humid, hot–warm moist, hot–warm arid, tepid–cool sub-moist, and hot–warm semiarid, respectively (Figure 9a–f). The SDII did not show a significant trend in all the zones. All AEZs, except for the hot–warm arid, showed an insignificant negative trend (Table 2). The highest SDII was recorded in 1984, 1985, 1985, 1998, 1985, and 2016 for cold–very cold humid, tepid–cool humid, hot–warm moist, hot–warm arid, tepid–cool sub-moist, and hot–warm semiarid, respectively (Figure 9m–r). In contrast to this, Muluneh et al. [74] reported a significant increase in SDII in the majority of studied stations in the central rift valley of Ethiopia. The insignificant negative trend implies that the trends of daily precipitation have been declining in the majority of observed agroecologies.

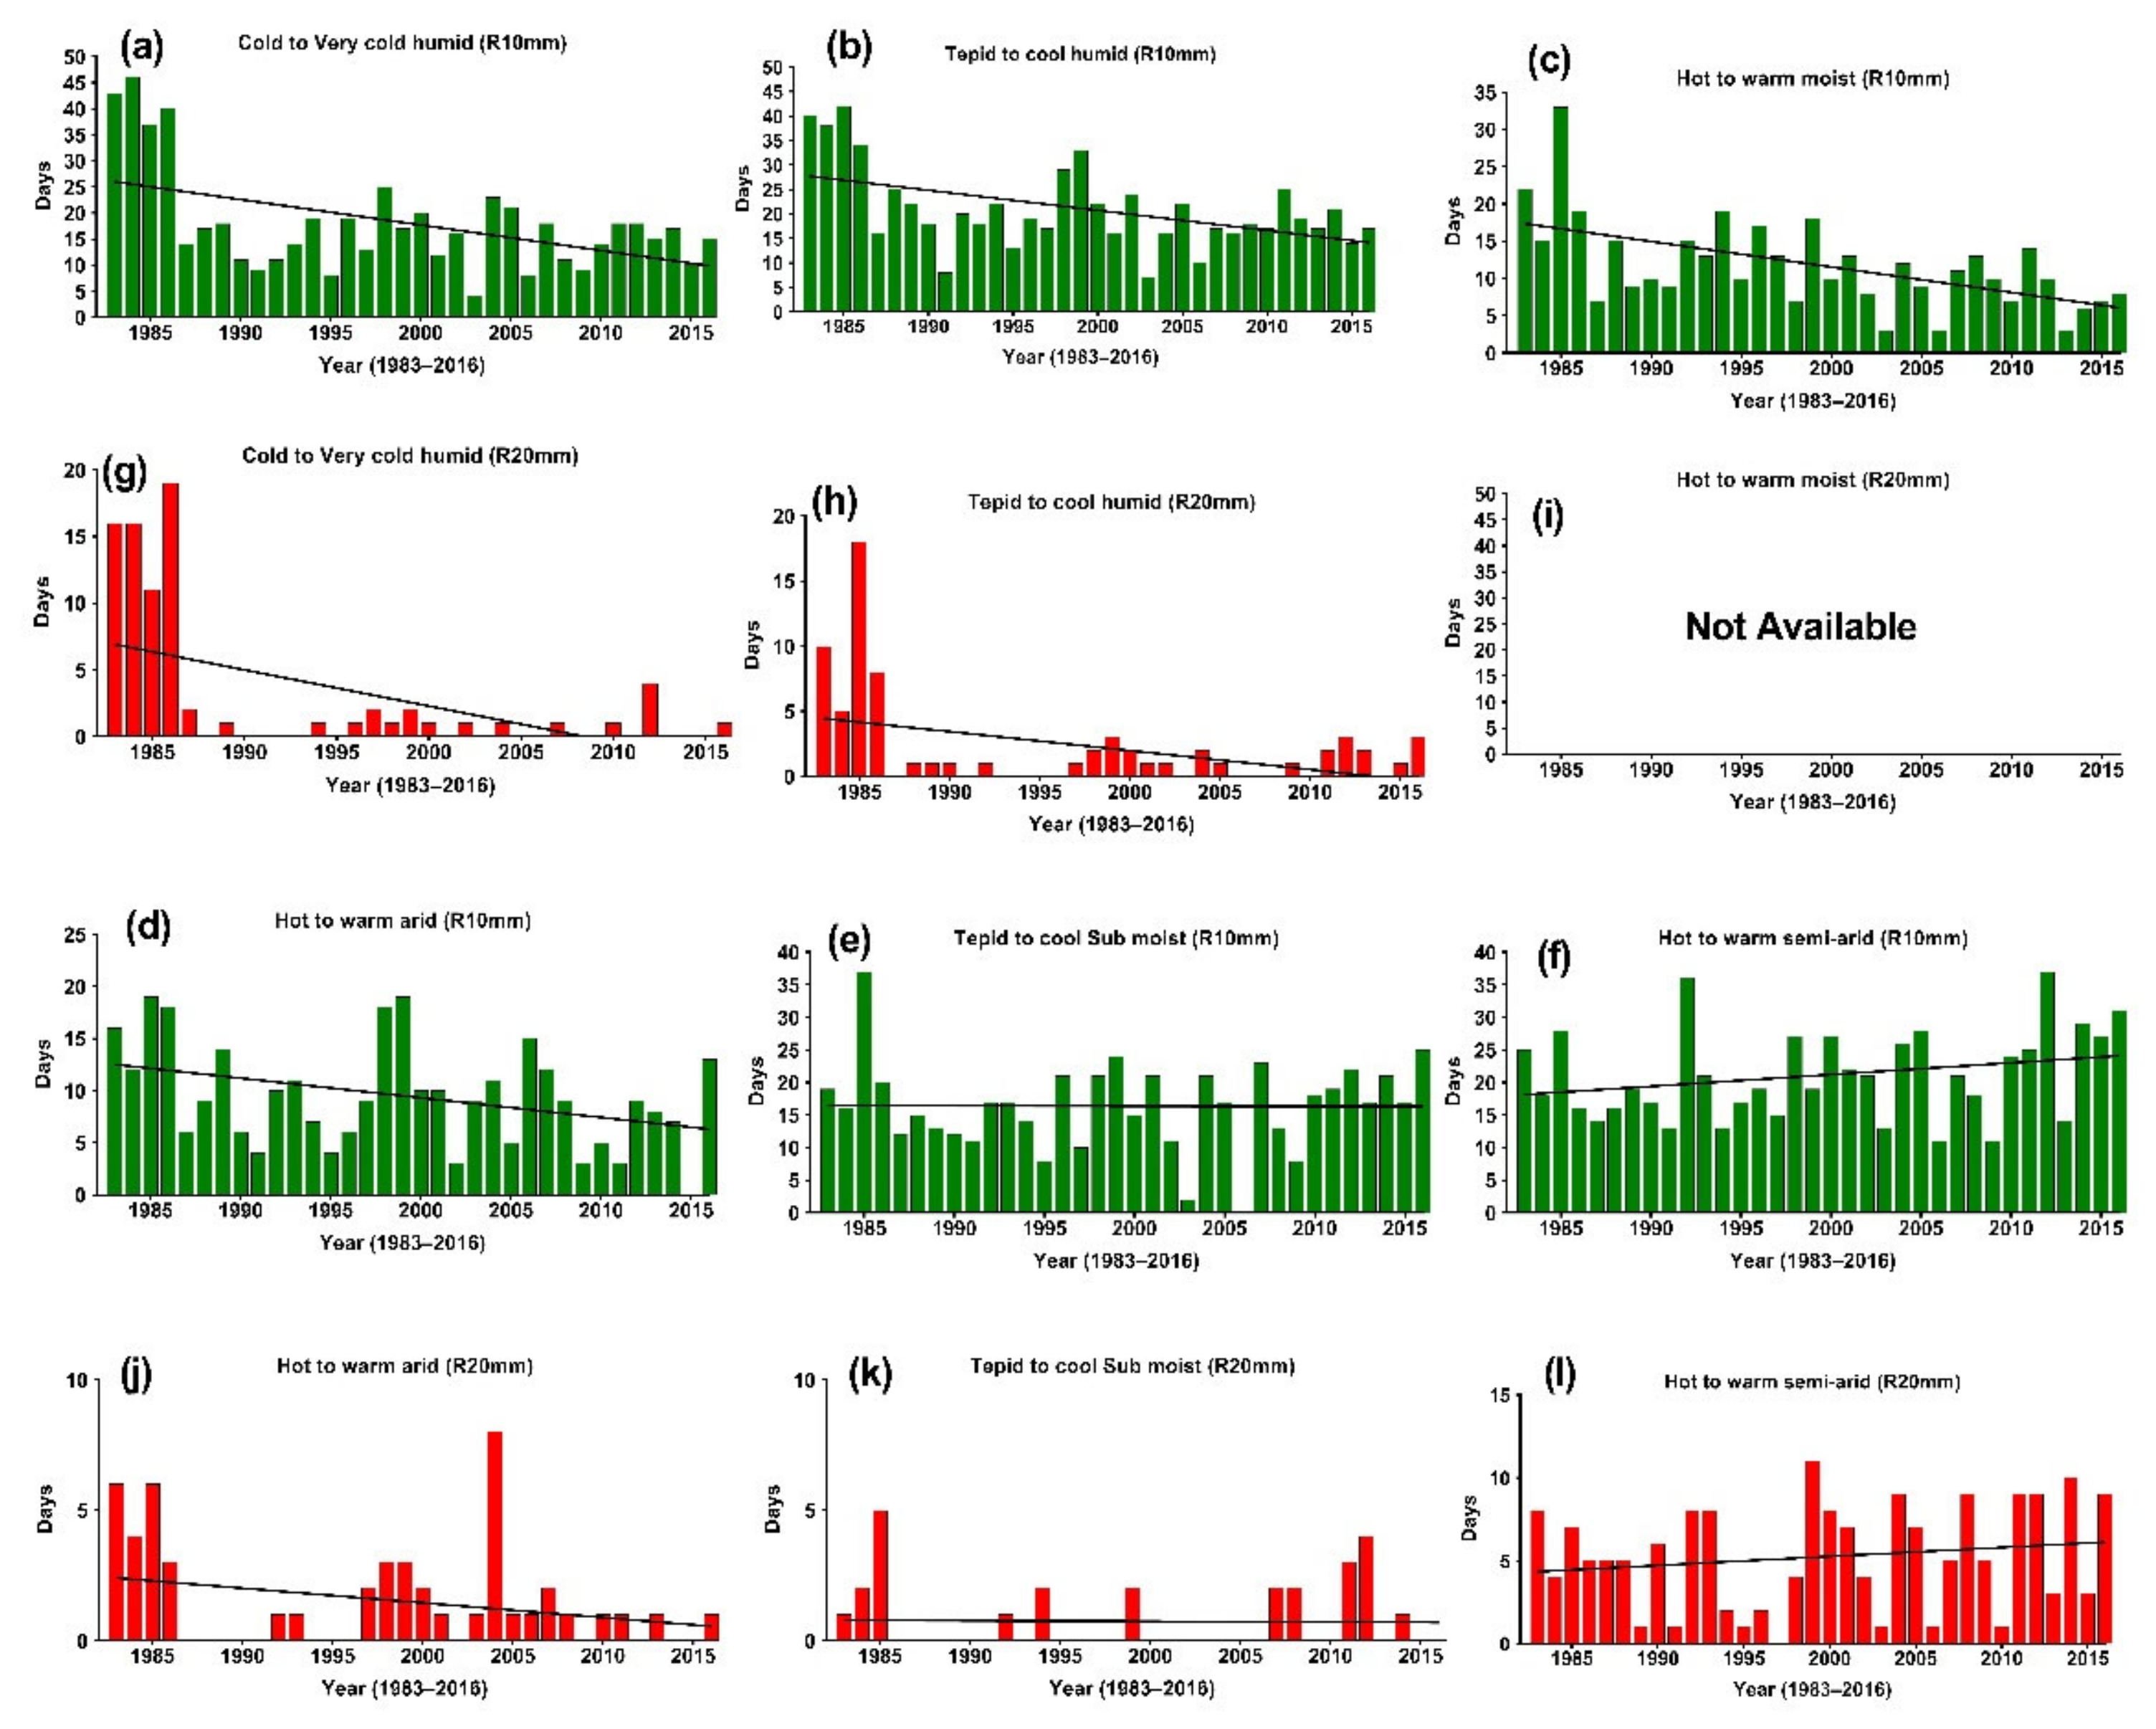
3.3.2. Number of Heavy and Very Heavy Precipitation Days

Trends in R10mm show variation across studied agroecology. Significant decreasing trends were observed for hot–warm moist and tepid–cool sub-moist with decreasing magnitude of −0.049 days/year (p < 0.01) and −0.032 mm (p < 0.05), respectively (Table 2). On the other hand, cold–very cold humid, tepid–cool humid, hot–warm arid, and hot–warm semiarid show an insignificant trend. The highest R10mm was recorded in 1984, 1985, 1985, 1998, 1985, and 2002 for cold–very cold humid, tepid–cool humid, hot–warm moist, hot–warm arid, tepid–cool sub-moist, and hot–warm semiarid, respectively (Figure 10a–f). An increasing insignificant, trend of R10mm was observed in hot–warm arid and hot–warm semiarid, while negative trends in R10mm were observed among the remaining agroecologies (Table 2).
Similarly, trends in R20mm show variation across the studied agroecology. Significant decreasing trends were observed with decreasing magnitude of −0.120 mm (p < 0.001) in tepid–cool humid agroecology (Table 2). The remaining AEZs show an insignificant trend. The highest R20mm was recorded in 1986, 1985, 2004, 1985, and 1999 for cold–very cold humid, tepid–cool humid, hot–warm arid, tepid–cool sub-moist, and hot–warm semiarid, respectively (Figure 10g–l). An increasing, but insignificant trend of R20mm was observed in hot–warm arid, while divergent trends in R20mm were observed among other agroecologies (Table 2). A decreasing trend in the number of heavy and very heavy precipitation suggests potential risks related to drought in most agroecologies. The results are consistent with the findings of Muluneh et al. [74], who found decreasing trend in Addis Ababa, Combolcha, and Jimma stations. The decreasing trend in R10mm and R20mm infer an increase in dry days and a decrease in the magnitude of precipitation.

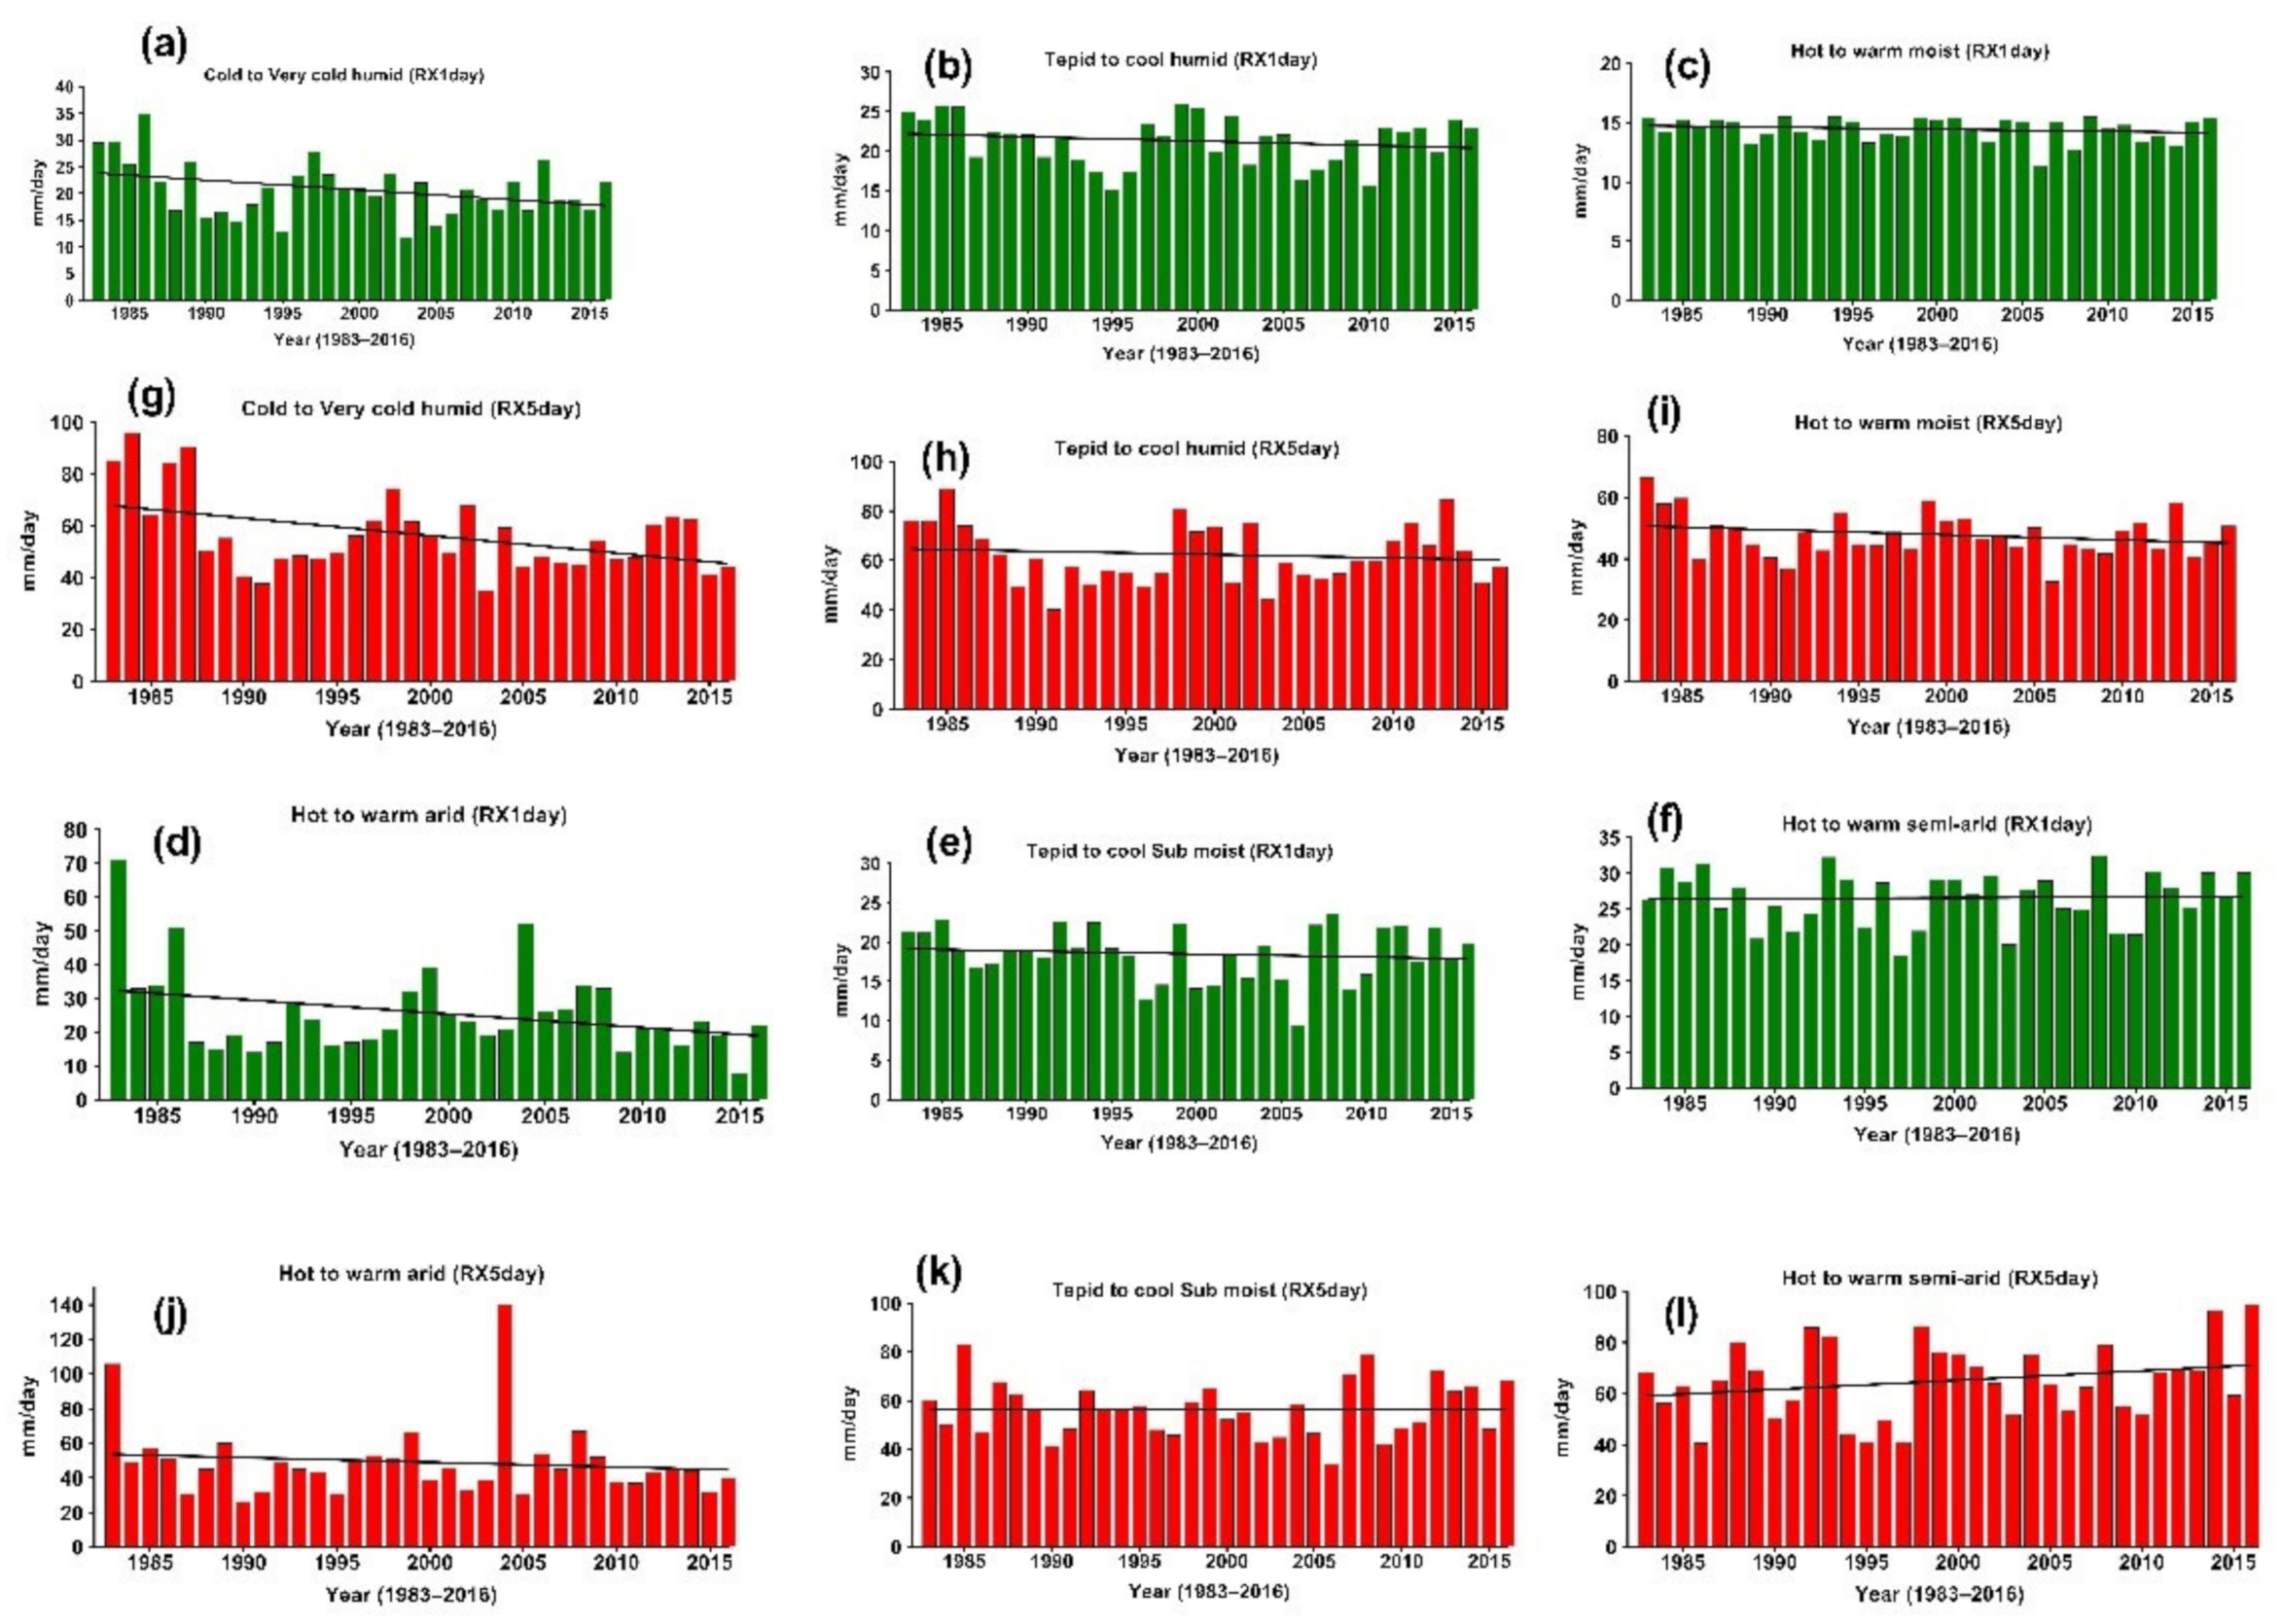
3.3.3. Maximum Precipitations of One Day and Five Days

For the RX1day and RX5day indices, there is a sign of change across agroecologies between 1983 and 2016. Among the studied agroecology, only hot–warm arid had positive and significant trends (0.005 mm/year). In contrast, others had insignificant negative trends in annual maximum consecutive 1-day precipitation (Rx1day) (Table 2). The trends in Rx5day show a negative and significant trend for cold–very cold humid, while tepid–cool humid, hot–warm moist, and tepid–cool sub-moist were negative and insignificant. Hot–warm arid and hot–warm semiarid show an insignificant positive trend in Rx5day (Table 2). The spatial change in Rx1day and Rx5day precipitation indices values generally revealed variations across agroecologies. Compared with other agroecologies, the highest significant magnitude change of Rx5day was recorded at −0.026 mm/year (p < 0.05) in the cold–very cold humid AEZ (Table 2). The higher value and negative trend in Rx1day and Rx5day across the studied AEZ indicate dry years (Figure 11a–l). Comparing cold–very cold AEZ study’s result with [51], who studied extreme climate events in Jema Subbasin and Upper Blue Nile Basin, we find a significant decreasing trend in Alemketema Station.

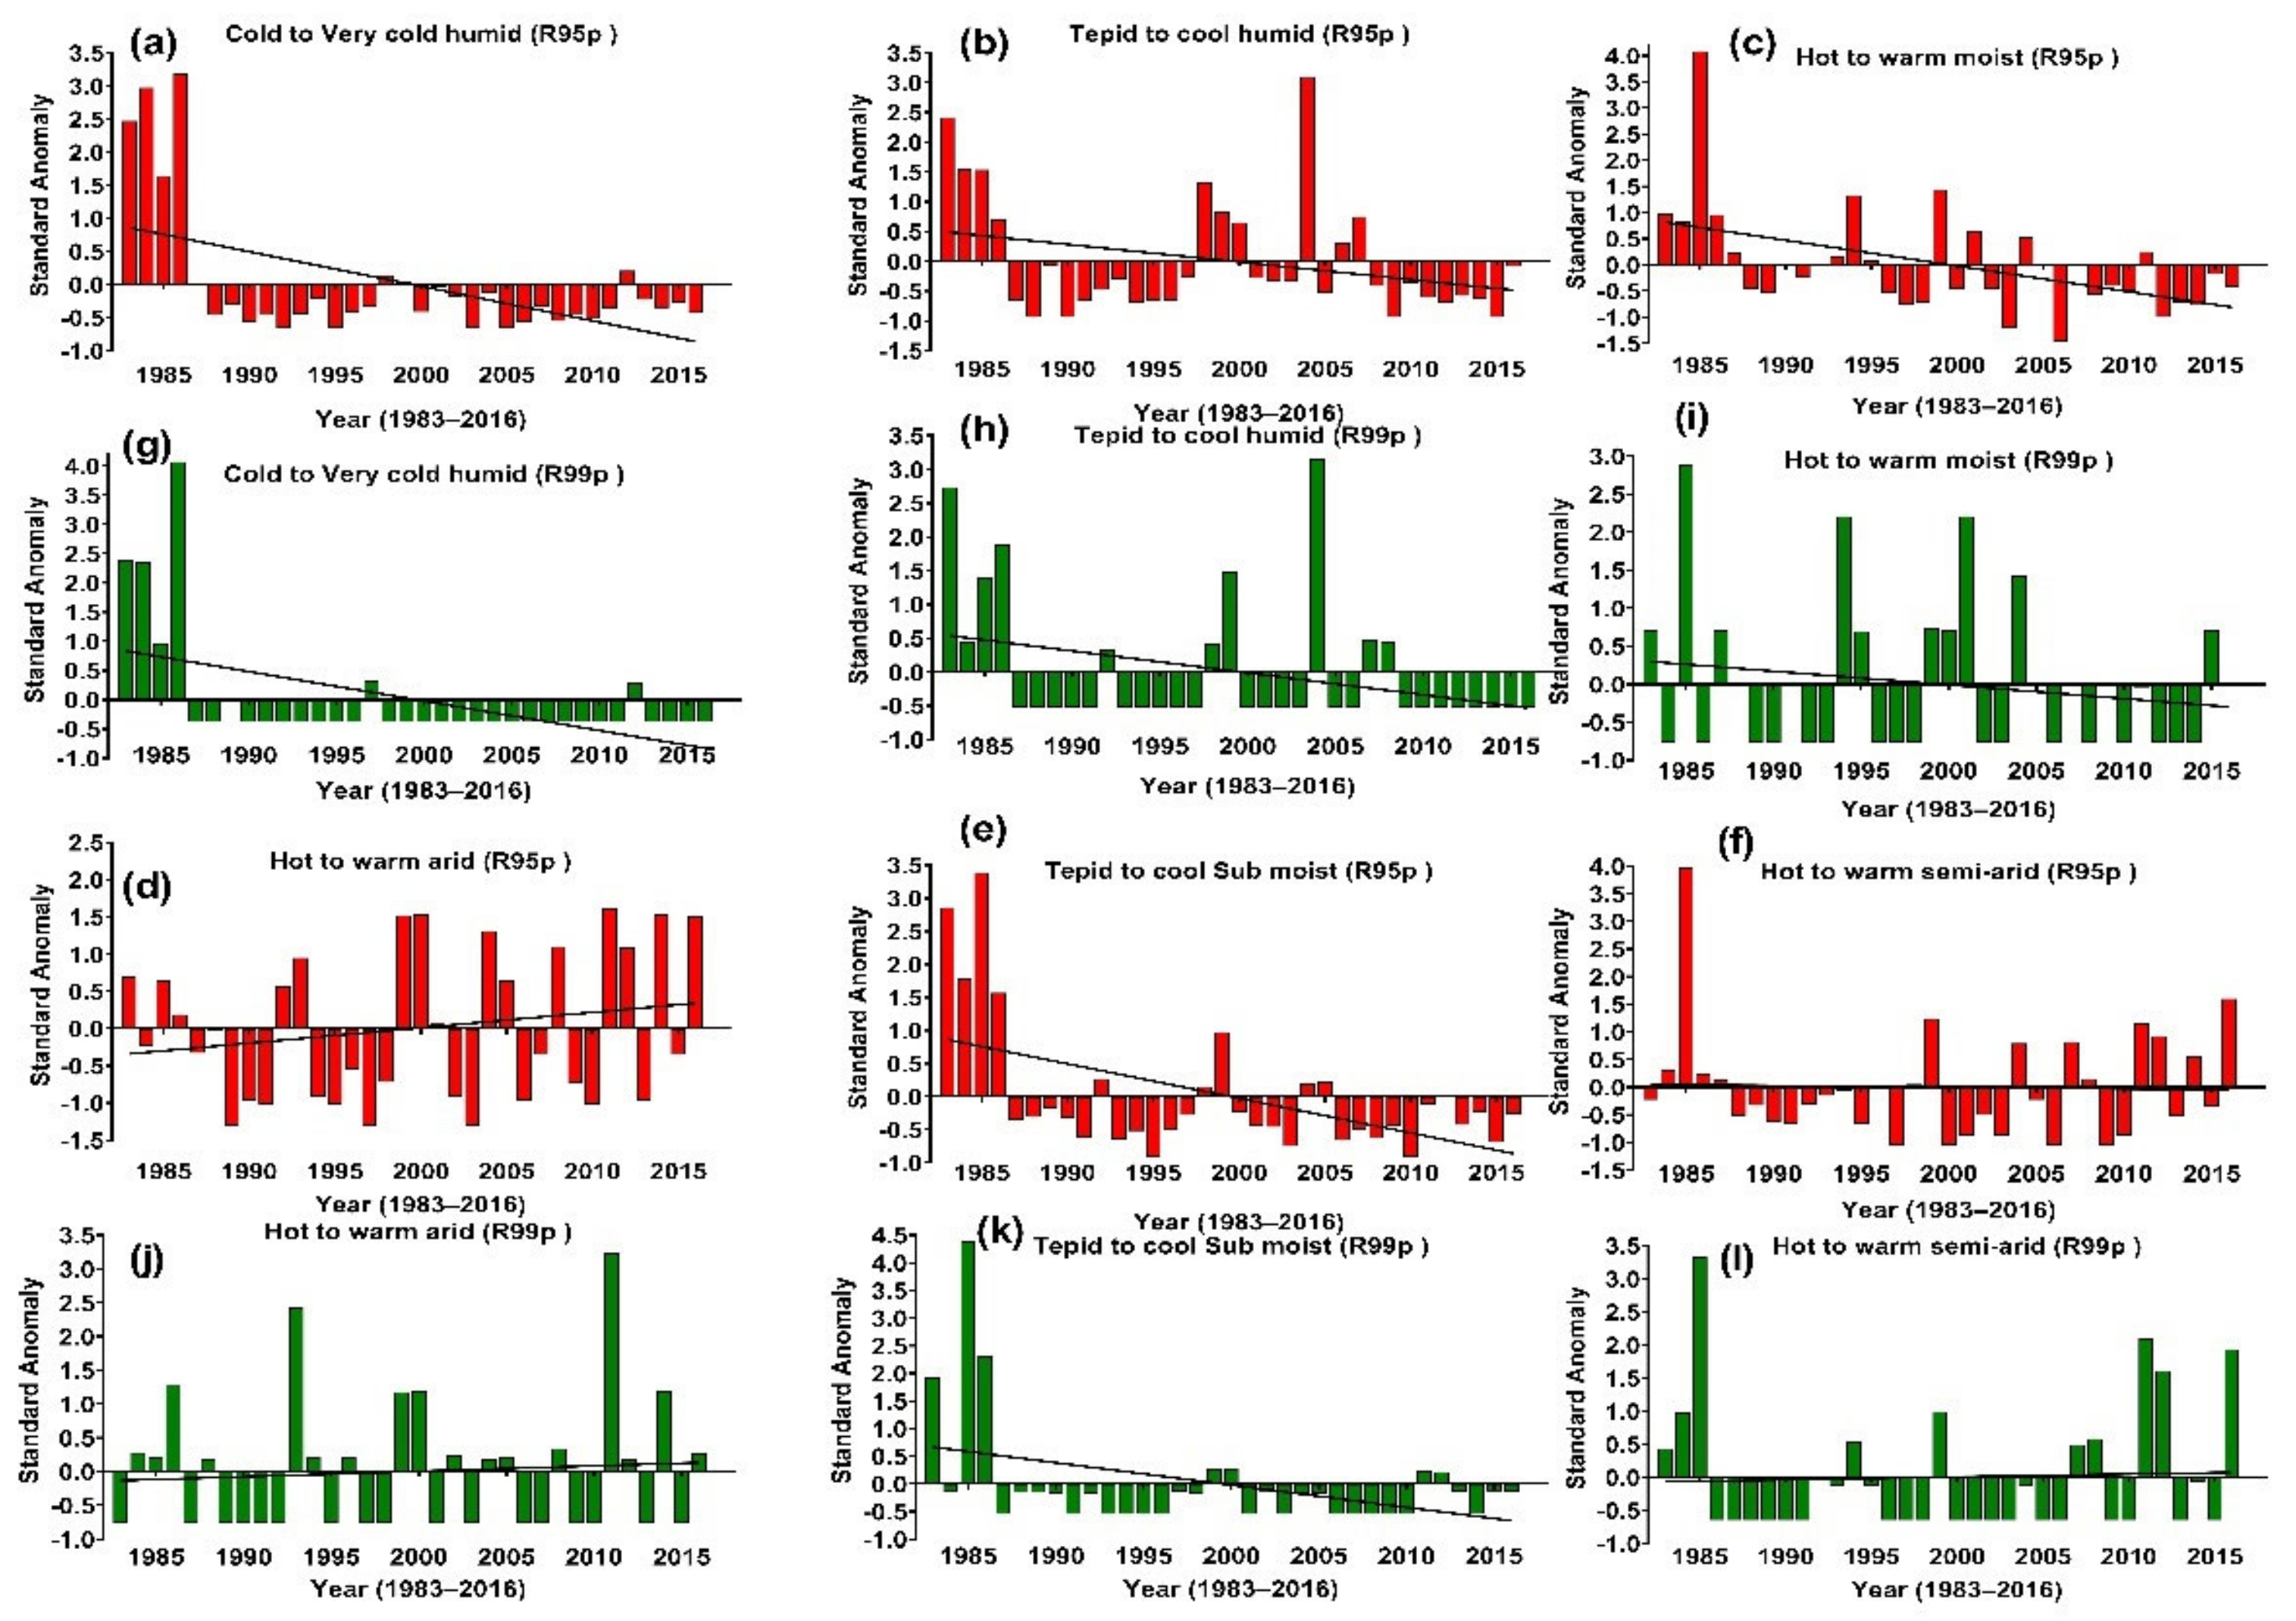
3.3.4. Very Wet Days and Extremely Wet Days

Table 2 shows the computed annual totals of wet-day precipitation amounts that exceed the 95th and 99th percentiles in 1983–2016. There were insignificant trends in R95p in the studied agroecology, except for hot–warm moist and tepid–cool sub-moist, where a significant decreasing trend was observed. Despite the lack of statistical significance, the trends in R95p were positive in hot–warm arid (0.014 mm/year) (Table 2). Similarly, the trends in R99p were not significant in all agroecologies (Table 2).
Furthermore, the frequency of R95p anomalies, the negative anomalies are consistently declining since the beginning of the 1985s in the cold–very cold humid, tepid–cool humid and hot–warm moist and tepid–cool sub-moist agroecologies (Figure 12a–c,e). On the contrary, positive anomalies are noted for hot–warm arid (Figure 12g). Regarding the frequency of R99p, the anomalies are consistently declining for all agroecologies (Figure 12g–i,k). This result inferred insignificant variation in the distribution of wet and extreme wet days across the agroecology understudy over the study periods. Previous research [75] in Adama city and [41] in Debre Zeyit and Kulumsa station of the central highland of Ethiopia also show insignificant trends.

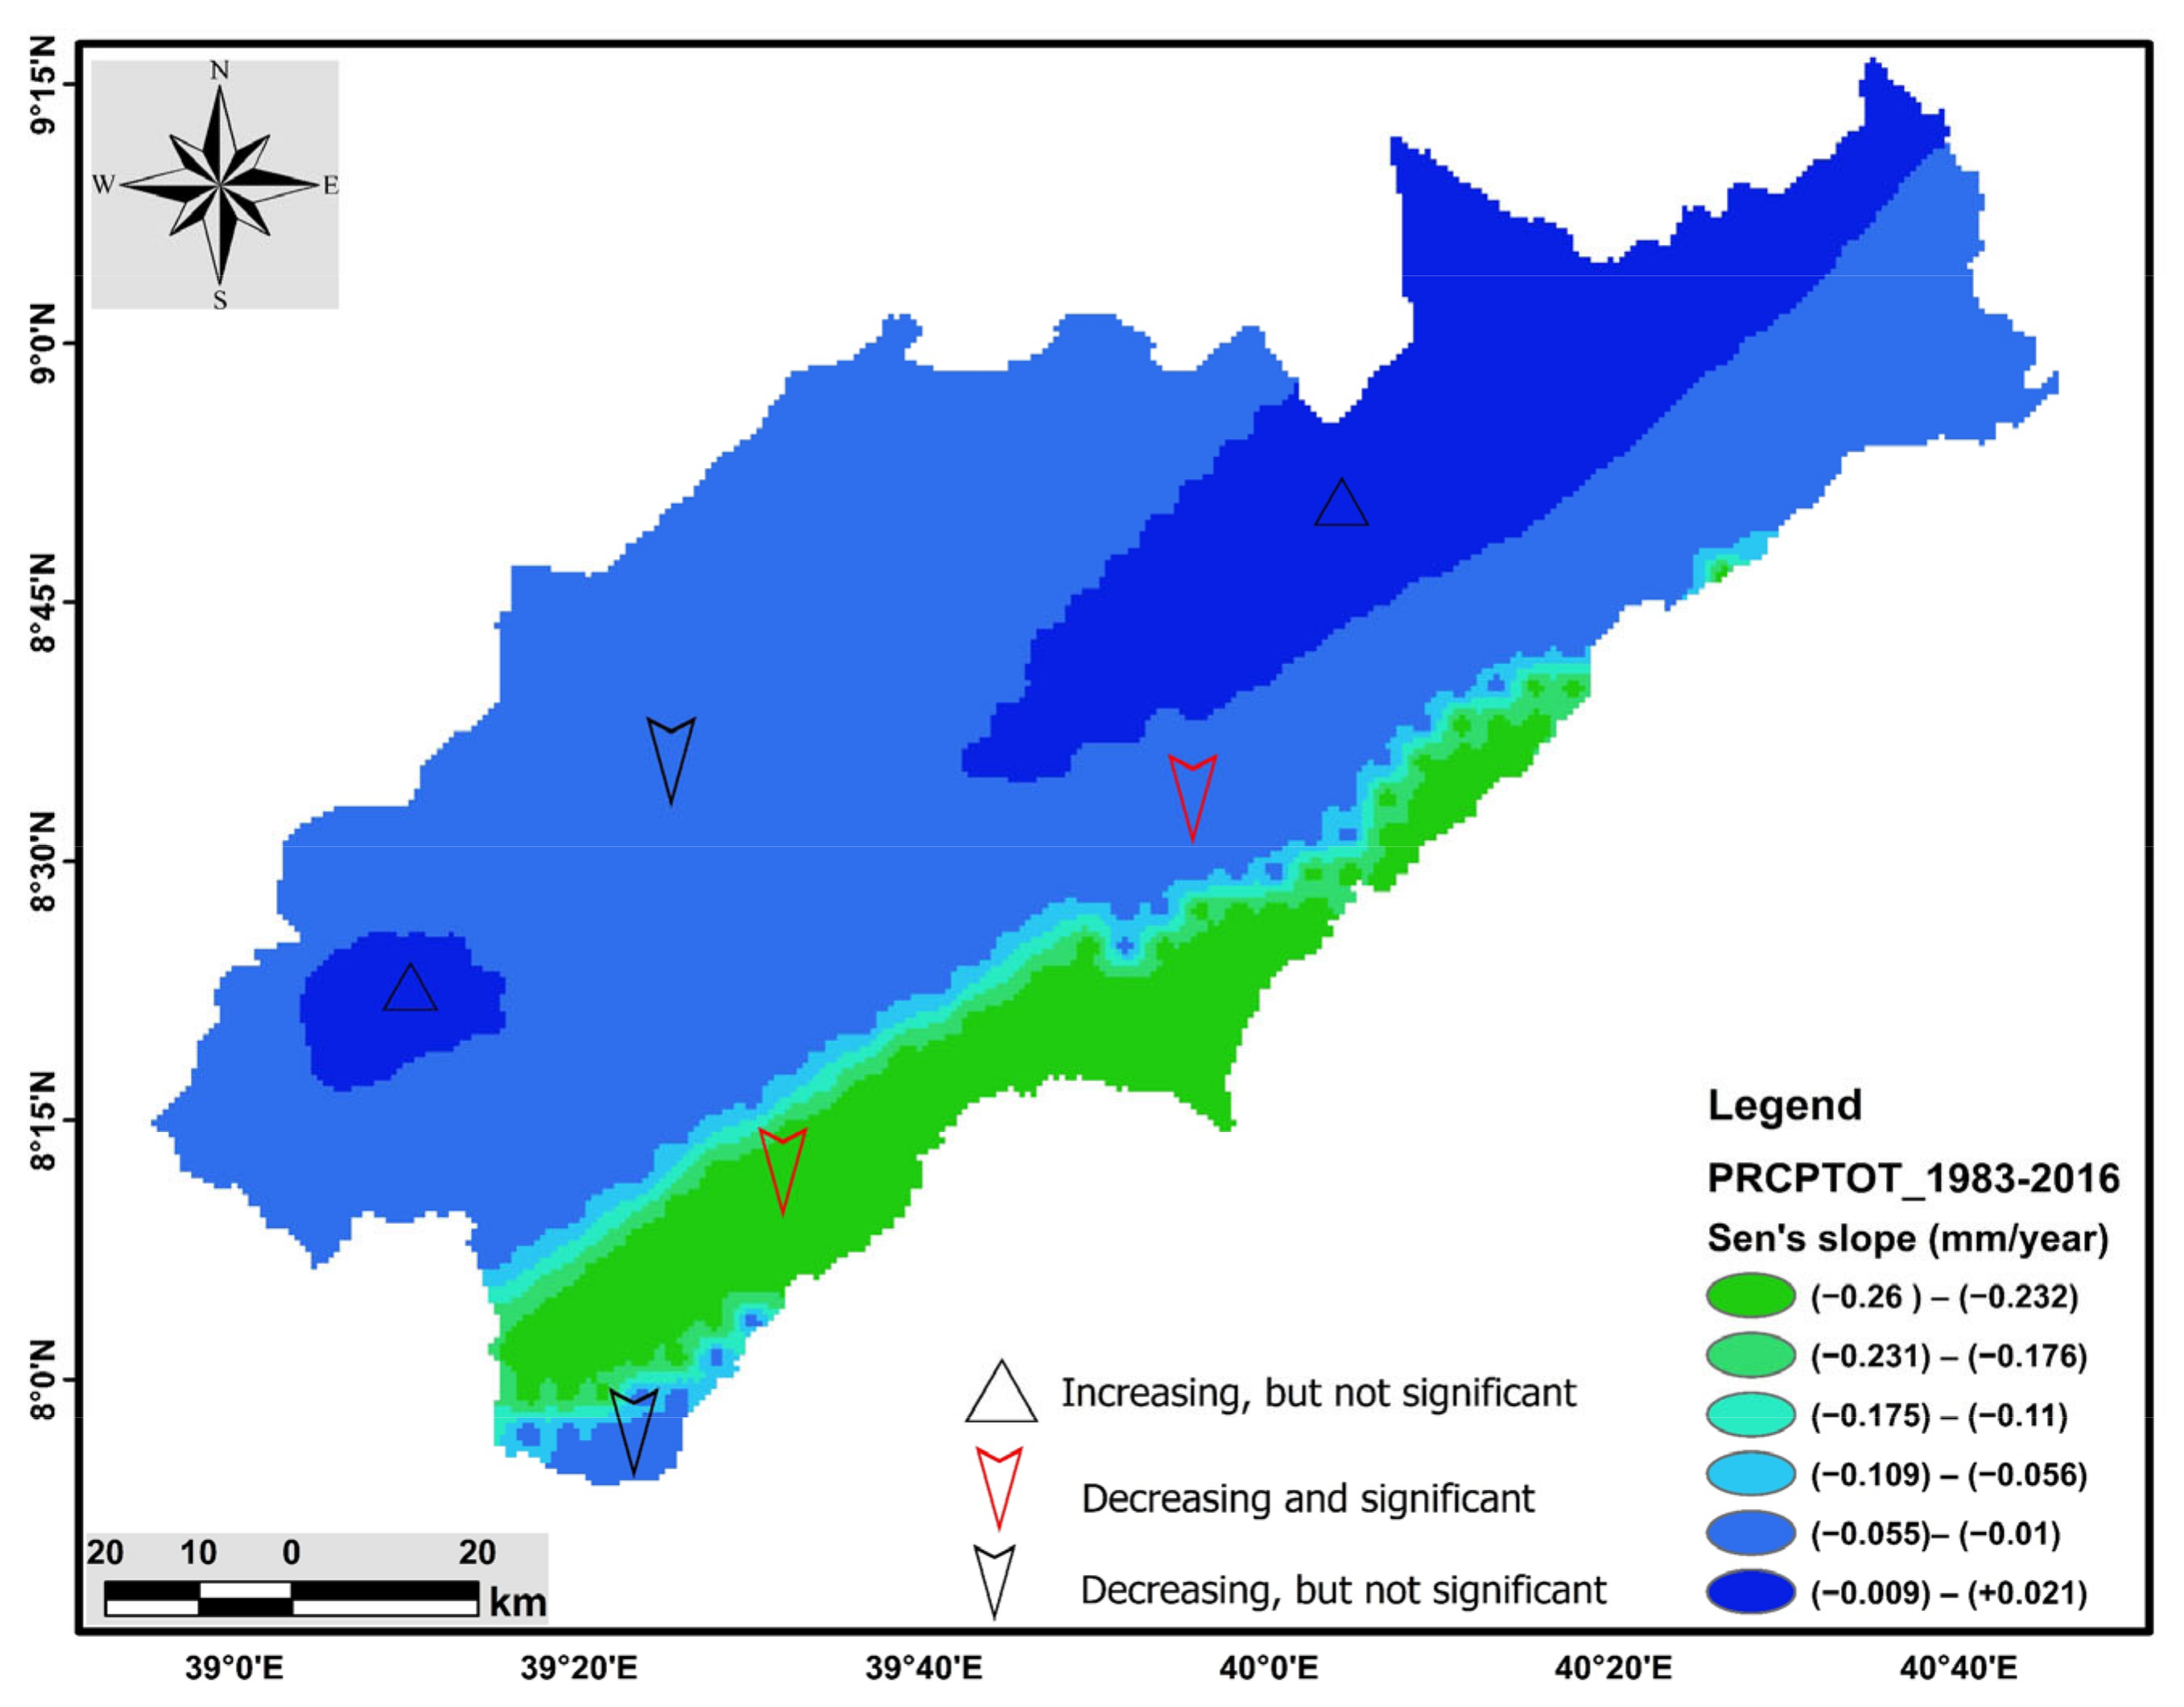
3.3.5. Annual Total Precipitation on Wet Days

Table 2 shows the PRCPTOT (>1 mm/day), which greatly varies across agroecologies. Results show that only tepid–cool humid and hot–warm moist had negative and significant trends, while cold–very cold humid and tepid–cool sub-moist had negative and insignificant trends in PRCPTOT (Figure 13). Hot–warm arid and hot–warm semiarid had insignificant positive trends. Compared with other agroecologies, the highest significant magnitude change of PRCPTOT was recorded at −0.040 mm/year (p < 0.001) in the cold–very cold humid (Table 2). The results reveal a mixture of dry and wet trends in the long-term context of the annual PRCPTOT in the studied agroecology. Our results in the cold–very cold humid and tepid–hot moist agroecologies are consistent with [64], who noted a significant and decreasing trend over the Horn of Africa.
Generally, the significant change in extreme rainfall indices across studied agroecologies can be explained by natural variability and or a high response to global increased greenhouse gas emissions [76,77,78]. Thedecrease in rainfall and extreme events in some agroecologies impacts farmers’ livelihoods. Elsewhere, increased frequencies of extreme rainfall events such as long dry or wet spells result in weaker productive systems [70,78].

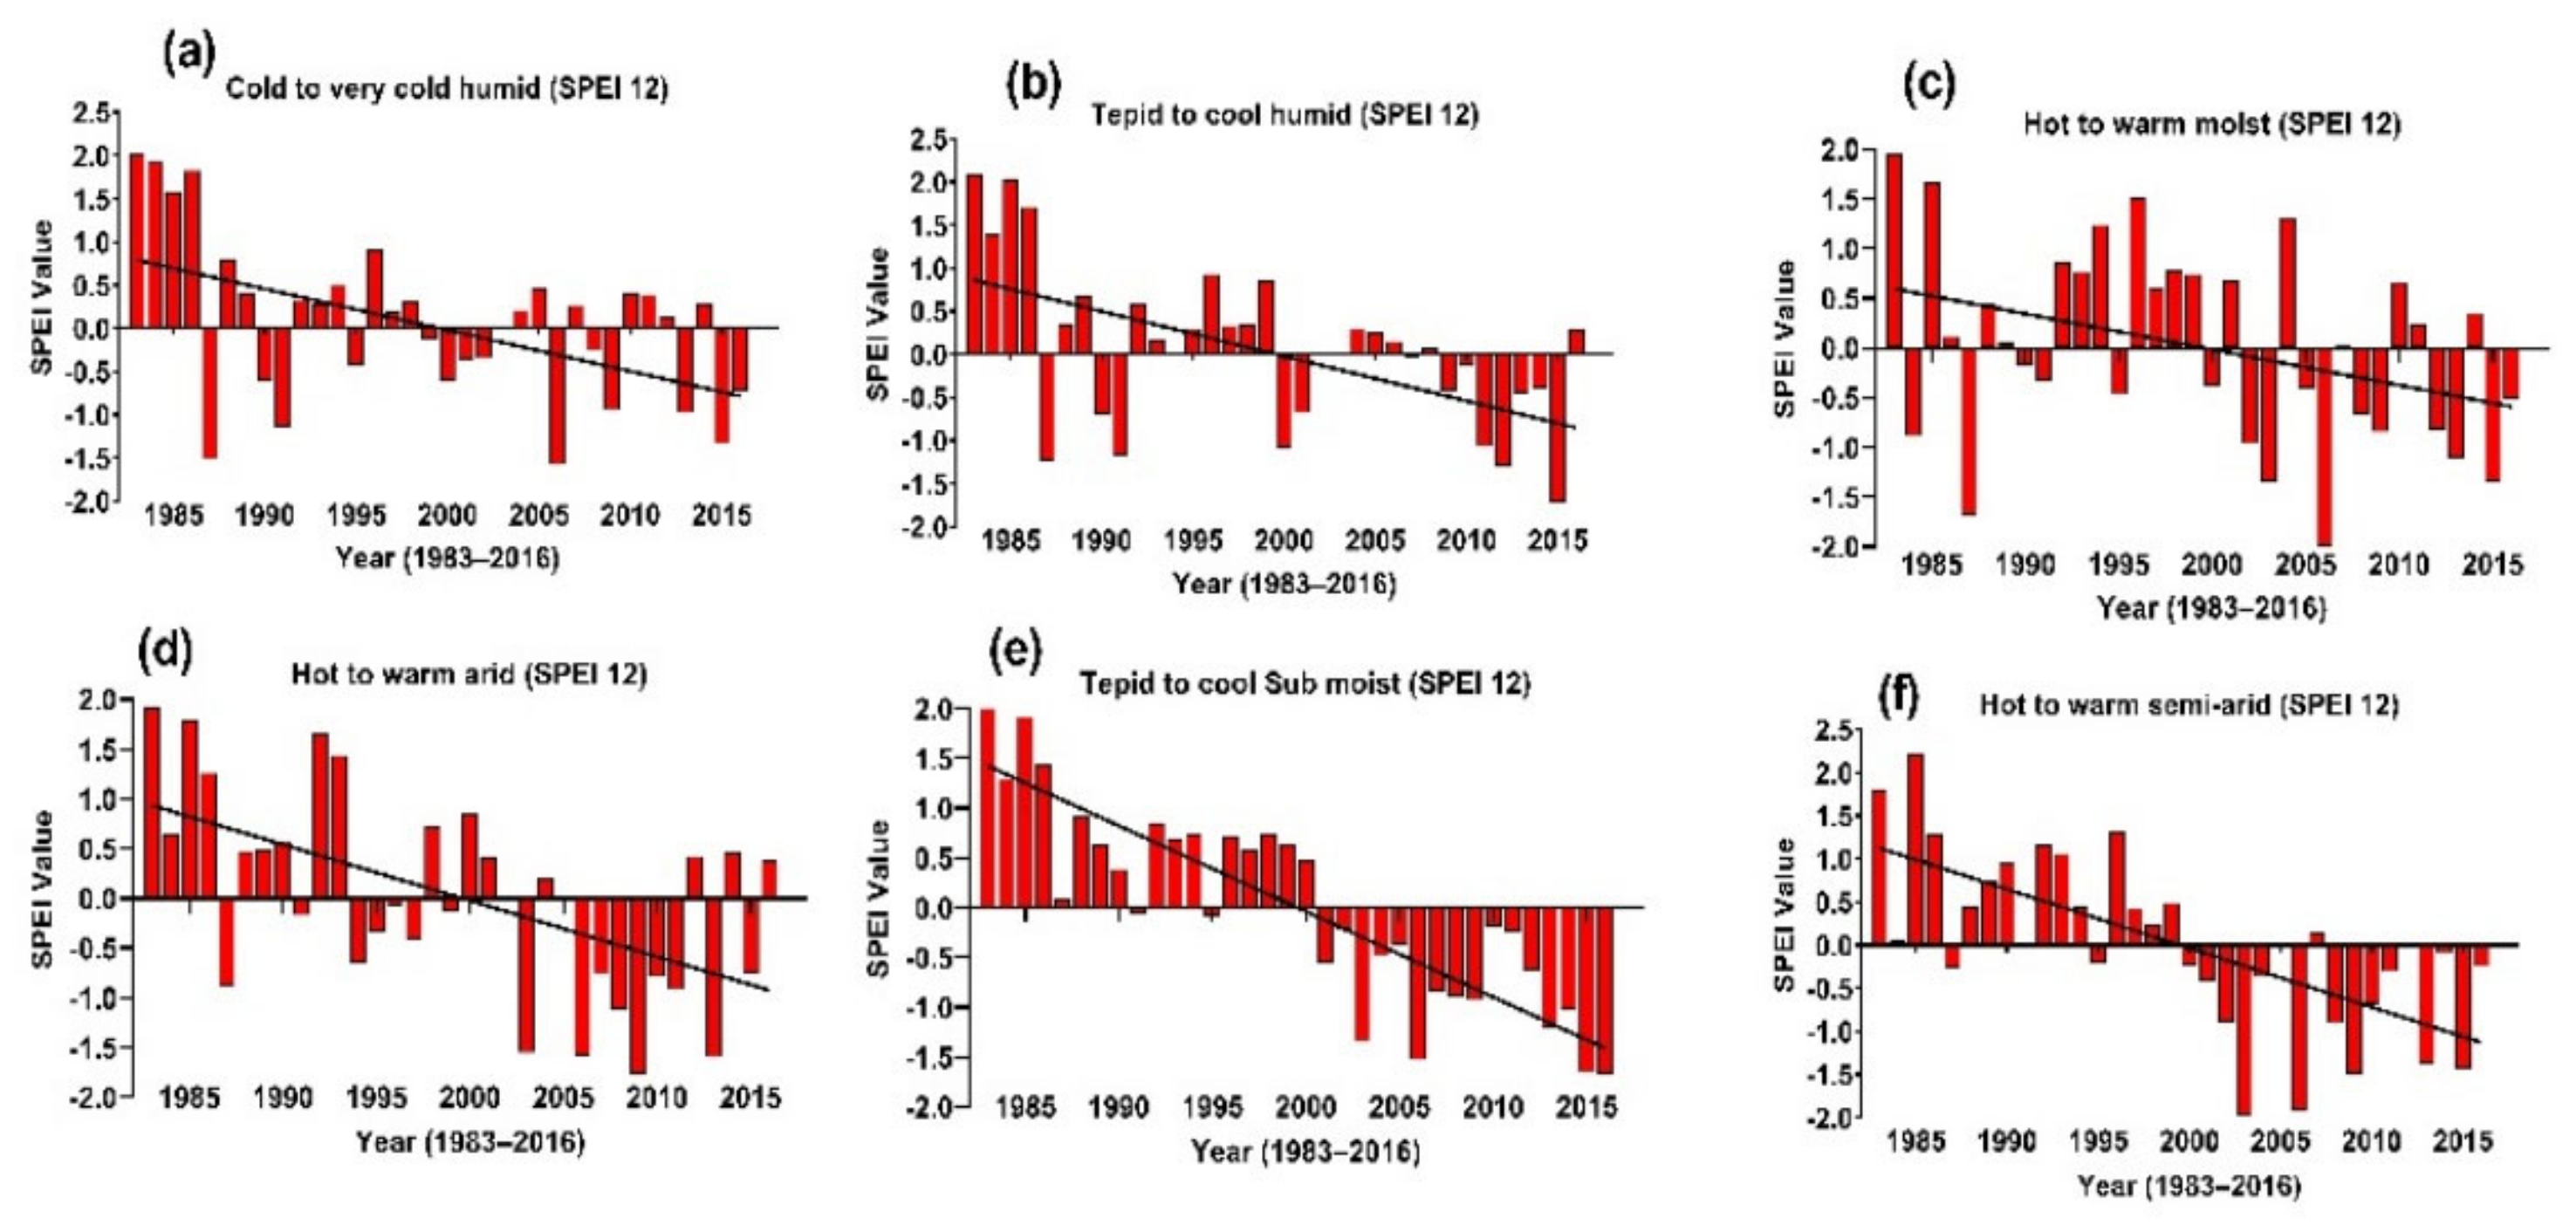
3.4. Drought Indices

For the SPEI 12, there is a sign of change across agroecologies between the years 1983 and 2016. The study revealed that all study agroecology experienced negative and significant trends (Figure 14a–e). A significant and negative annual SPEI trend indicates an increase in drought across agroecology. Compared with other agroecologies, the biggest significant magnitude changes of SPEI-12 were recorded at −0.088 °C/year (p < 0.001) in the tepid–cool sub-moist agroecology (Table 2). The frequency of annual wet, normal, and dry events across agroecologies for the period 1983–2016 are described in Table S2 (Supplementary Materials). The most extreme annual wet event was observed in tepid–cool sub-moist agroecology. The stronger value for normal events was observed in the hot–warm semiarid agroecology. The most frequent extreme annual dry event were observed in hot–warm moist, hot–warm arid, and tepid–cool sub-moist agroecologies (Table S2). The results from the SPEI-12 in this study area agree with recent studies conducted in the Awash basin [27]. The increase in drought frequency across agroecologies can be related to an increase in mean extreme temperature indices and decrease in mean and extreme precipitation indices across the studied agroecologies. The increasing frequency of drought events across agroecology can affect agricultural production by limiting soil water availability for different crops and reducing crop yields [79].

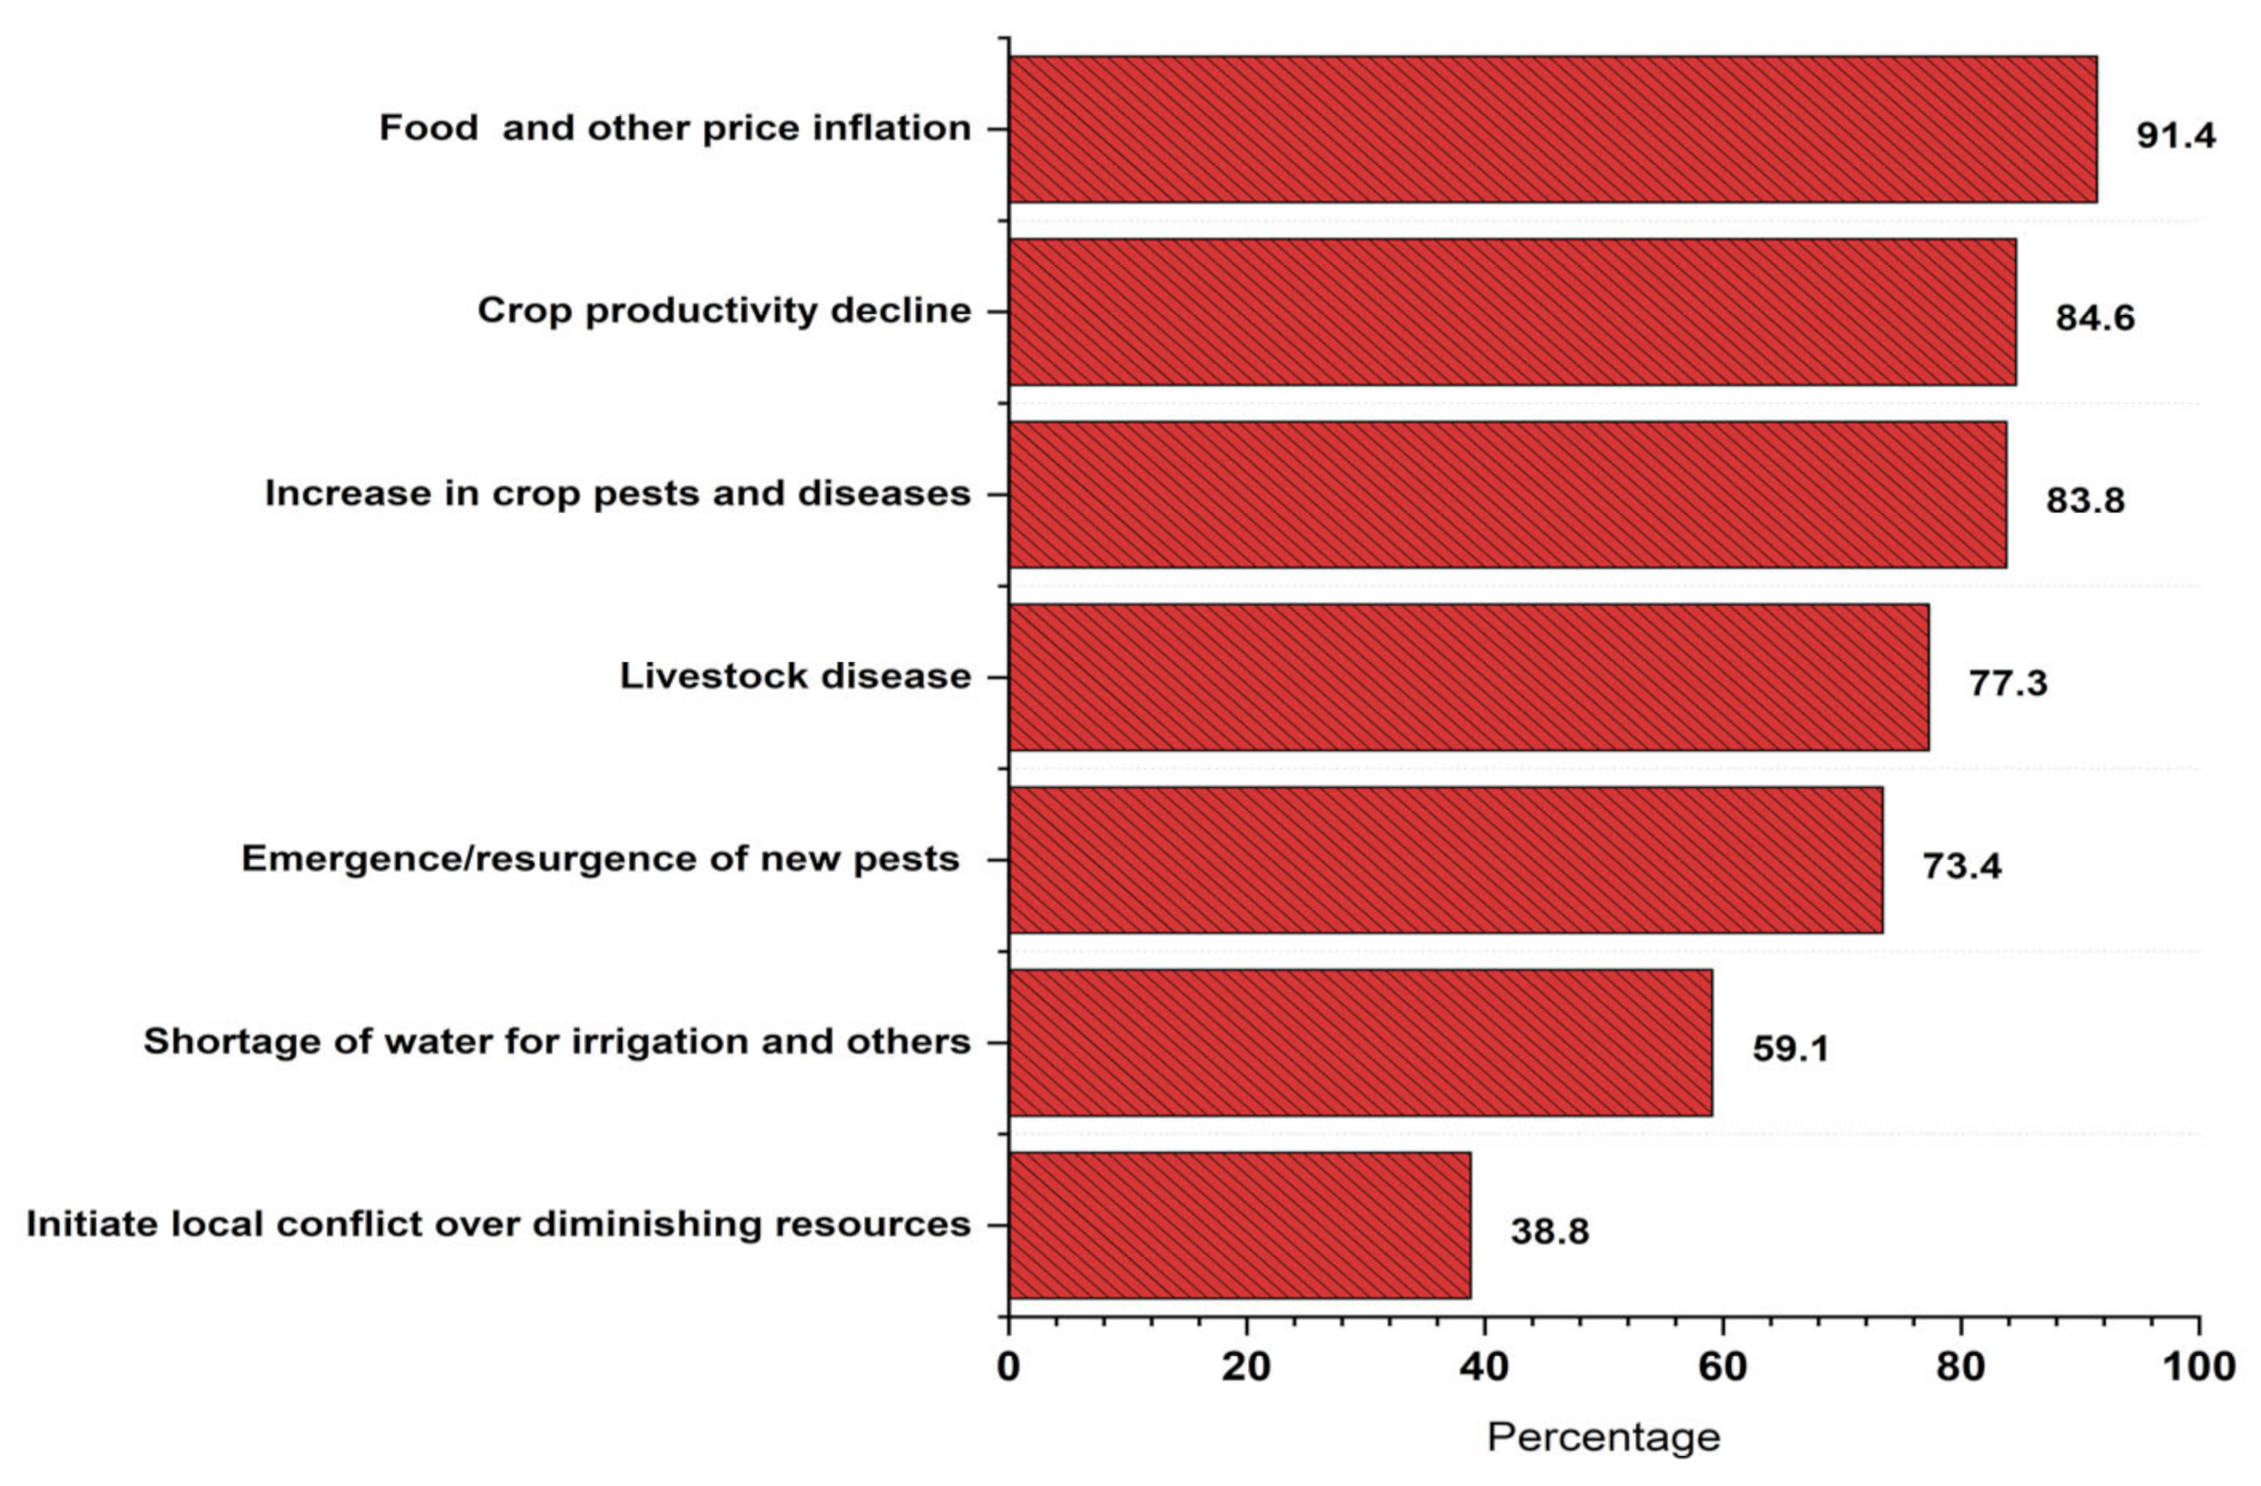
3.5. Farmers’ Perception and Agricultural Implications of Climate Extremes

Farmers from different agroecology zones perceived climate change, variability, and extreme events over the last two decades. Most interviewed key informants, focus group discussants, and surveyed sample farmers in different agroecology (89.3%) perceived changes in climate (Table S3). Focus group discussants indicated that the main source of information for climate change came from personal experience, radio broadcasts, and training given at different times by development agents. Furthermore, they elaborated on the changes in climate through changes in rainfall patterns, amount, and length of the rainy and dry seasons. One focus group discussant from a hot–warm semiarid AEZ stated the change and its impacts brought in his village, as follows:
Climate in our area is changing. Compared to our youth time, the rain does not come on time…., sometimes we experienced unexpected rainfall. The late rain during the main season is harming our agriculture”.
This illustrates the climate change, variability, and extreme events in the study area. The study also revealed a change in the pattern of precipitation across agroecologies. Table S3 shows descriptive statistics results between farmers’ perceptions and some selected climate indices. The majority of respondents, from cold–very cold humid, tepid–cool humid, hot–warm moist, and hot–warm arid AEZs, perceived an increase in temperature in their area. Compared with the farmers’ perception, the Mann–Kendall trend analysis of temperature (Tmax and Tmin) result shows a significant increase in all agroecology except for hot–warm semiarid, where temperature decreases (Table 2 and Figure 3). The results agree with research conducted in different parts of the country and in other parts of the world, where researchers have reported an increase in temperature [80,81,82] and its convergence with climate data. The majority of farmers across agroecologies believed that the annual rainfall had decreased. This is highly consistent with meteorological data. The total rainfall (TRF) trend analysis shows a significant decrease in all agroecology except hot–warm semiarid (Table 2, and Figure 3). The consistency between farmers’ perceptions and meteorological data can facilitate farm adaptation.
A key informant interview conducted with woreda agricultural office heads in the study area showed that all informants know about changing rainfall, temperature, and extreme climate events. Key informants from Lode Hitosa woreda stated the following:
Recently, we are observing changes and variation in climatic elements, which we believe as one of the contributors to the reduction of crop yields”. The key informant further elaborated on the situation as “the variability in rainfall and temperature is affecting crop productivity by introducing crop pests and disease”.
A key informant from the Merti Woreda Agriculture office stated the following:
It is observable that there is climate change and variability in our woreda. Because of woredas’ agroecological location, where almost half of the area is located in lowland, frequent drought experience, crop pest and disease, the animal disease is the main indicator of climate change in the woreda”.
Table S3 shows farmers’ perceptions of the number of warm days and cold nights. The study revealed that farmers from different agroecologies perceived an increase in warm days (76.6%) and cold nights (63.3%). However, the result was wide-ranging between agroecologies (Table S3). All the respondents from the hot–warm semiarid agroecology and 82.9% from the hot–warm semiarid agroecology perceived a change in the number of warm days. The result agrees with the findings of Mihiretu et al. [80], where farmers perceive several warm days. However, there is a divergence between farmers’ perceptions and meteorological data on several cold nights. Farmers from hot–warm moist and hot–warm semiarid agroecology zones perceived an increase and decrease in the number of cold nights, respectively. This deviates from the meteorological data. Hot–warm moist and hot–warm semiarid agroecologies indicated a reduction and an increase in the number of cold nights, respectively (Table 2). Considering the context of convergence and divergence between meteorological data and farmers’ perceptions, it can be assumed that determinants influence farmers’ perception of climate change and extreme events [26,80].
The descriptive statistics show that about 68.3% of farmers in the entire agroecology perceived an increase in drought frequency in their area. However, there is variation across agroecologies, where 75.9%, 65.6%, 62.4%, 60.7%, 61%, and 54.2% of farmers from tepid–cool sub-moist, hot–warm semiarid, tepid–cool humid, cold–very cold humid, hot–warm arid, and hot–warm moist perceived an increase in drought years, respectively (Table S3).
A focus group discussant from tepid–cool humid stated the occurrence of frequent drought in his village, as follows:
In previous years, our area is known with better rainfall, even several times of summer season; rainfall did not allow us to out from our tukul. But, in recent years, the rain is significantly decreasing, and rainfall amount we used to see in the arid area is coming to us”.
The SPEI-12 and SPI-12 computed from all meteorological data show an increase in drought frequency in the last three decades (Table S3). Similarities between meteorological data (increase in drought frequency) and farmers’ perceptions can be due to farmers’ experiences with consequences during drought years [81,82,83,84].
Regarding the perceived impacts of climate change, variability, and extreme events, farm households perceived effects, including food and other product inflation (91.4%), a decrease in crop productivity (84.6), an increase in crop pests and diseases (83.8), increase in livestock disease (77.3), emergence of new pests and weeds (73.4), shortage of water for irrigation (59.1), and initiating conflict over decreasing resources (38.8) (Figure 15). Similarly, a key informant interview with the Woreda Agricultural Office and Development Agents (DA) shows visible effects of climate change, variability, and extreme events. The development agent from Gado Arba kebele stated the impacts, as follows:
There are multiple effects of climate change, among others, reduction in agricultural production, introduction and expansion of crop pests like armyworm, cutworms, yellow rust, aphids and smut, livestock diseases like Blackleg, anthrax, lumpy skin disease, human disease like malaria, frequent occurrences of drought years, and scarcity of water for irrigation are visible effects of climate change in the kebele.
This generally shows that climate change and extreme events are evident in all agroecology studied. Studies conducted in different parts of the country [85] and other parts of the world [86,87,88] recognized perceived and actual impacts of climate change and extreme events on agricultural production.

4. Conclusions

The need for information on local temperature and precipitation extremes has increased due to its wide range of livelihood impacts. The studied major agroecological zones are experiencing climate change and extreme events which are either the same across all or vary between them. Overall, increasing maximum and minimum temperature and decreasing total rainfall in the agroecologies under study are indicators of climate change.
In general, warm extreme temperature indicators such as TXx, TNx, TN90p, TX90p, and WSDI showed a significant increasing trend. However, indicators such as WSDI, TX90p, and TXx showed an insignificant decreasing trend in hot–warm moist agroecology zones. Cold extreme temperature indicators TNn, TN10p, TX10p, and CSDI exhibited a significant decreasing trend in most agroecology zones. However, TXn and TX10p showed a significant increasing trend in tepid–cool humid climates. Overall, the magnitude and direction of change differed across the studied agroecologies, the growing trend of warm extreme temperature events in the cold–very cold humid, tepid–cool humid, and tepid–cool sub-moist agroecologies possibly affects agricultural production and productivity.
Extreme precipitation indicators such as RX1day, RX5day, R10mm, R95p, R99p, and PRCPTOT showed a decreasing trend in most agroecology zones. However, extreme precipitation indices indicated an insignificant increasing trend in the hot–warm arid agroecology zones. The increasing trend of extreme precipitation events in hot–warm semiarid and hot–warm arid agroecologies can be taken as an advantage for the community whose livelihood depends on rainfed agriculture. It can boost crop and vegetation productivity in the study of agroecology. Nevertheless, the decreasing trend of extreme precipitation events in the cold–very cold humid, tepid–cool humid, and tepid–cool sub-moist agroecologies possibly indicate the increase in the number of consecutive dry days (CDD), which is an indicator of drought occurrences in the majority of agroecologies, which they had never experienced in prior years. In addition, this study compared agroecology-based farmers’ perceptions on trends of climate change and some selected extreme indicators. This study revealed similarities in farmers’ perceptions with meteorological data results.
In conclusion, the spatiotemporal differences in extreme temperature and precipitation indices in the Awash-Awash subbasin indicate varying possible implications for agriculture and crop productivity. The upward trend in extreme warm temperatures and decreasing trend in extreme cold indicators have influence crops’ physiological processes and crop productivity. Similarly, the shift in trends of extreme precipitation can disrupt agricultural productivity and possibly affect farmers whose livelihood mainly depends on rainfed agriculture. The results of this agroecology-specific study provide crucial information to policy developers, decision makers, and farmers about the possible impacts of climate change and extreme events that lead to developing agroecology-based adaption measures. As the effects of change in mean and extreme climates on agriculture are complex, research is required to investigate the impacts of seasonal variations of extreme climate events on crop and livestock resources. Furthermore, agroecology-based vulnerability assessment of extreme climate events in the sub-basin can provide an opportunity to minimize the high costs of crisis management, thereby increasing the adaptive capacity of farmers to effects of climate variability and change.

Supplementary Materials

The following supporting information can be downloaded at: https://www.mdpi.com/article/10.3390/cli10060089/s1, Table S1: Sample households per agroecology zone, Table S2: Annual drought frequency over agroecologies for the period 1983–2016, Table S3: Agroecology-based farmers’ perception of trends of selected climate indices.

Author Contributions

Conceptualization, A.D., E.T. and V.O.; methodology, A.D., E.T., V.O. and B.E.; software, A.D.; validation, A.D., E.T., V.O., B.E. and R.M.; formal analysis, A.D.; data curation, A.D.; writing—original draft preparation, A.D.; writing—review and editing, A.D., E.T., V.O., B.E. and R.M.; visualization, A.D.; supervision, E.T., V.O., B.E. and R.M.; funding acquisition, V.O. and R.M. All authors have read and agreed to the published version of the manuscript.

Funding

The lead author is funded by Addis Ababa University and Wolaita Sodo University. The authors would acknowledge the financial support and technical assistance provided by the Botswana International University of Science and Technology under grant number R00132.

Institutional Review Board Statement

Not applicable.

Informed Consent Statement

Not applicable.

Data Availability Statement

Data used in this study are available from the corresponding author only based on reasonable requests.

Acknowledgments

The authors acknowledge the National Meteorological Agency for providing meteorological data. Special appreciation go to the local-level government offices, farmers, and enumerators for the help and cooperation we received during field data collection.

Conflicts of Interest

The authors declare no conflict of interest.

References

  1. The Intergovernmental Panel on Climate Change (IPCC). Climate Change 2021: The Physical Science Basis; Contribution of Working Group I to the Sixth Assessment Report of the Intergovernmental Panel on Climate Change; Masson-Delmotte, V., Zhai, P., Pirani, A., Connors, S.L., Péan, C., Berger, S., Caud, N., Chen, Y., Goldfarb, L., Gomis, M.I., et al., Eds.; Cambridge University Press: New York, NY, USA, 2021.
  2. IPCC. Climate Change and Land: An IPCC special report on climate change, desertification, land degradation, sustainable land management, food security, and greenhouse gas fluxes in terrestrial ecosystems. 2019; in press. [Google Scholar]
  3. Maxwell, S.L.; Butt, N.; Maron, M.; McAlpine, C.A.; Chapman, S.; Ullmann, A.; Segan, D.B.; Watson, J.E. Conservation implications of ecological responses to extreme weather and climate events. Divers. Distrib. 2019, 25, 613–625. [Google Scholar] [CrossRef]
  4. Malhi, Y.; Franklin, J.; Seddon, N.; Solan, M.; Turner, M.G.; Field, C.B.; Knowlton, N. Climate change and ecosystems: Threats, opportunities and solutions. Philos. Trans. R. Soc. B 2020, 375, 20190104. [Google Scholar] [CrossRef] [PubMed] [Green Version]
  5. Maru, H.; Haileslassie, A.; Zeleke, T.; Esayas, B. Agroecology-based analysis of meteorological drought and mapping its hotspot areas in Awash Basin, Ethiopia. Model. Earth Syst. Environ. 2022, 8, 339–360. [Google Scholar] [CrossRef]
  6. Leal Filho, W.; Al-Amin, A.Q.; Nagy, G.J.; Azeiteiro, U.M.; Wiesböck, L.; Ayal, D.Y.; Morgan, E.A.; Mugabe, P.; Aparicio-Effen, M.; Fudjumdjum, H. A comparative analysis of climate-risk and extreme event-related impacts on well-being and health: Policy implications. Int. J. Environ. Res. 2018, 15, 331. [Google Scholar] [CrossRef] [Green Version]
  7. Raymond, C.; Horton, R.M.; Zscheischler, J.; Martius, O.; AghaKouchak, A.; Balch, J.; Bowen, S.G.; Camargo, S.J.; Hess, J.; Kornhuber, K. Understanding and managing connected extreme events. Nat. Clim. Chang. 2020, 10, 611–621. [Google Scholar] [CrossRef]
  8. Pasquier, U.; Few, R.; Goulden, M.; Hooton, S.; He, Y.; Hiscock, K. Integrating stakeholder and scientific knowledge of future flood risk to inform climate change adaptation planning in a coastal region. Geophys. Res. Abstr. 2020, 103, 50–57. [Google Scholar] [CrossRef]
  9. Ongoma, V.; Chen, H.; Omony, G.W. Variability of extreme weather events over the equatorial East Africa, a case study of rainfall in Kenya and Uganda. Theor. Appl. Climatol. 2018, 131, 295–308. [Google Scholar] [CrossRef]
  10. Ayugi, B.; Zhihong, J.; Zhu, H.; Ngoma, H.; Babaousmail, H.; Rizwan, K.; Dike, V. Comparison of CMIP6 and CMIP5 models in simulating mean and extreme precipitation over East Africa. Int. J. Climatol. 2021, 41, 6474–6496. [Google Scholar] [CrossRef]
  11. Ojara, M.A.; Yunsheng, L.; Babaousmail, H.; Wasswa, P. Trends and zonal variability of extreme rainfall events over East Africa during 1960–2017. Nat. Hazards 2021, 109, 33–61. [Google Scholar] [CrossRef]
  12. Kilavi, M.; MacLeod, D.; Ambani, M.; Robbins, J.; Dankers, R.; Graham, R.; Titley, H.; Salih, A.A.; Todd, M.C. Extreme rainfall and flooding over central Kenya including Nairobi city during the long-rains season 2018: Causes, predictability, and potential for early warning and actions. Atmosphere 2018, 9, 472. [Google Scholar] [CrossRef] [Green Version]
  13. Funk, C.; Dettinger, M.D.; Michaelsen, J.C.; Verdin, J.P.; Brown, M.E.; Barlow, M.; Hoell, A. Warming of the Indian Ocean threatens eastern and southern African food security but could be mitigated by agricultural development. Proc. Natl. Acad. Sci. USA 2008, 105, 11081–11086. [Google Scholar] [CrossRef] [Green Version]
  14. Kiros, G.; Shetty, A.; Nandagiri, L. Analysis of variability and trends in rainfall over northern Ethiopia. Arab. J. Geosci. 2016, 9, 451. [Google Scholar] [CrossRef]
  15. Alemu, M.M.; Bawoke, G.T. Analysis of spatial variability and temporal trends of rainfall in Amhara region, Ethiopia. J. Water Clim. Chang. 2020, 11, 1505–1520. [Google Scholar] [CrossRef]
  16. Belay, A.; Demissie, T.; Recha, J.W.; Oludhe, C.; Osano, P.M.; Olaka, L.A.; Solomon, D.; Berhane, Z. Analysis of Climate Variability and Trends in Southern Ethiopia. Climate 2021, 9, 96. [Google Scholar] [CrossRef]
  17. Esayas, B.; Simane, B.; Teferi, E.; Ongoma, V.; Tefera, N. Climate variability and farmers’ perception in Southern Ethiopia. Adv. Meteorol. 2019, 2019, 7341465. [Google Scholar] [CrossRef]
  18. Etana, D.; Snelder, D.J.; van Wesenbeeck, C.F.; de Cock Buning, T. Trends of climate change and variability in three agro-ecological settings in Central Ethiopia: Contrasts of meteorological data and farmers’ perceptions. Climate 2020, 8, 121. [Google Scholar] [CrossRef]
  19. Gebrechorkos, S.H.; Hülsmann, S.; Bernhofer, C. Changes in temperature and precipitation extremes in Ethiopia, Kenya, and Tanzania. Int. J. Climatol. 2019, 39, 18–30. [Google Scholar] [CrossRef] [Green Version]
  20. Wiebe, K.; Robinson, S.; Cattaneo, A. Climate change, agriculture and food security: Impacts and the potential for adaptation and mitigation. In Sustainable Food and Agriculture; Academic Press: Cambridge, MA, USA, 2019; pp. 55–74. [Google Scholar] [CrossRef]
  21. Nhemachena, C.; Nhamo, L.; Matchaya, G.; Nhemachena, C.R.; Muchara, B.; Karuaihe, S.T.; Mpandeli, S. Climate change impacts on water and agriculture sectors in Southern Africa: Threats and opportunities for sustainable development. Water 2020, 12, 2673. [Google Scholar] [CrossRef]
  22. Asfaw, A.; Bantider, A.; Simane, B.; Hassen, A. Smallholder farmers’ livelihood vulnerability to climate change-induced hazards: Agroecology-based comparative analysis in Northcentral Ethiopia (Woleka Sub-basin). Heliyon 2021, 7, e06761. [Google Scholar] [CrossRef]
  23. Habte, A.; Mamo, G.; Worku, W.; Ayalew, D.; Gayler, S. Spatial Variability and Temporal Trends of Climate Change in Southwest Ethiopia: Association with Farmers’ Perception and Their Adaptation Strategies. Adv. Meteorol. 2021, 2021, 3863530. [Google Scholar] [CrossRef]
  24. Teshome, A.; Zhang, J. Increase of extreme drought over Ethiopia under climate warming. Adv. Meteorol. 2019, 2019, 5235429. [Google Scholar] [CrossRef] [Green Version]
  25. Geremew, G.M.; Mini, S.; Abegaz, A. Spatiotemporal variability and trends in rainfall extremes in Enebsie Sar Midir district, northwest Ethiopia. Model. Earth Syst. Environ. 2020, 6, 1177–1187. [Google Scholar] [CrossRef]
  26. Mekasha, A.; Tesfaye, K.; Duncan, A.J. Trends in daily observed temperature and precipitation extremes over three Ethiopian eco-environments. Int. J. Climatol. 2014, 34, 1990–1999. [Google Scholar] [CrossRef]
  27. Maru, H.; Haileslassie, A.; Zeleke, T.; Esayas, B. Analysis of Smallholders’ Livelihood Vulnerability to Drought across Agroecology and Farm Typology in the Upper Awash Sub-Basin, Ethiopia. Sustainability 2021, 13, 9764. [Google Scholar] [CrossRef]
  28. Tadese, M.; Kumar, L.; Koech, R.; Kogo, B.K. Mapping of land-use/land-cover changes and its dynamics in Awash River Basin using remote sensing and GIS. Remote Sens. Appl. Soc. Environ. 2020, 19, 100352. [Google Scholar] [CrossRef]
  29. Damtew, A.; Teferi, E.; Ongoma, V. Farmers’ perceptions and spatial statistical modeling of most systematic LULC transitions: Drivers and livelihood implications in Awash Basin, Ethiopia. Remote Sens. Appl. Soc. Environ. 2022, 25, 100661. [Google Scholar] [CrossRef]
  30. Bekele, D.; Alamirew, T.; Kebede, A.; Zeleke, G.; Melesse, A.M. Land use and land cover dynamics in the Keleta watershed, Awash River basin, Ethiopia. Environ. Hazards 2019, 18, 246–265. [Google Scholar] [CrossRef]
  31. Degefa, S.; Saito, O. Assessing the impacts of large-scale agro-industrial sugarcane production on biodiversity: A case study of Wonji Shoa Sugar Estate, Ethiopia. Agriculture 2017, 7, 99. [Google Scholar] [CrossRef] [Green Version]
  32. Whitmarsh, L.; Capstick, S. Perceptions of climate change. In Psychology and Climate Change: Human Perceptions, Impacts, and Responses; Elsevier: Amsterdam, The Netherlands, 2018; pp. 13–33. [Google Scholar] [CrossRef]
  33. Dendir, Z.; Simane, B. Farmers’ perceptions about changes in climate variables: Perceived risks and household responses in different agro-ecological communities, Southern Ethiopia. Clim. Serv. 2021, 22, 100236. [Google Scholar] [CrossRef]
  34. Ayal, D.Y.; Tilahun, K.; Ture, K.; Terefe Zeleke, T. Psychological dimensions of climate change: Perceptions, collective efficacy, and responses in Berehet District, north Shoa, Ethiopia. Clim. Chang. 2021, 165, 32. [Google Scholar] [CrossRef]
  35. Gebrehiwot, T.; van der Veen, A. Farmers’ drought experience, risk perceptions, and behavioural intentions for adaptation: Evidence from Ethiopia. Clim Dev. 2021, 13, 493–502. [Google Scholar] [CrossRef]
  36. Nguyen, T.P.L.; Mula, L.; Cortignani, R.; Seddaiu, G.; Dono, G.; Virdis, S.G.; Pasqui, M.; Roggero, P.P. Perceptions of present and future climate change impacts on water availability for agricultural systems in the western Mediterranean region. Water 2016, 8, 523. [Google Scholar] [CrossRef]
  37. Aidoo, D.C.; Boateng, S.D.; Freeman, C.K.; Anaglo, J.N. The effect of smallholder maize farmers’ perceptions of climate change on their adaptation strategies: The case of two agro-ecological zones in Ghana. Heliyon 2021, 7, e08307. [Google Scholar] [CrossRef]
  38. Ayanlade, A.; Radeny, M.; Morton, J.F. Comparing smallholder farmers’ perception of climate change with meteorological data: A case study from southwestern Nigeria. Weather Clim. Extrem. 2017, 15, 24–33. [Google Scholar] [CrossRef]
  39. Foguesatto, C.R.; Artuzo, F.D.; Talamini, E.; Machado, J.A.D. Understanding the divergences between farmer’s perception and meteorological records regarding climate change: A review. Environ. Dev. Sustain. 2020, 22, 1–16. [Google Scholar] [CrossRef]
  40. Mase, A.S.; Gramig, B.M.; Prokopy, L.S. Climate change beliefs, risk perceptions, and adaptation behavior among Midwestern US crop farmers. Clim. Risk Manag. 2017, 15, 8–17. [Google Scholar] [CrossRef]
  41. Reser, J.P.; Bradley, G.L. The nature, significance, and influence of perceived personal experience of climate change. Wiley Interdiscip. Rev. Clim. Chang. 2020, 11, e668. [Google Scholar] [CrossRef]
  42. Gari, A.; Getnet, M.; Nigatu, L. Observed and future climate variability, trend, and extremes in central highlands of Ethiopia: A case study at Arsi Robe, Asasa, Debre Zeit and Kulumsa Areas. Environ. Pollut. Clim. Chang. 2018, 2, 163. [Google Scholar] [CrossRef]
  43. Halcrow, S.W. Master Plan for the Development of Surface Water Resources in the Awash Basin. 1989. Available online: http://197.156.72.153:8080/xmlui/handle/123456789/1486 (accessed on 3 August 2021).
  44. Ministry of Agriculture (MoA). Agro-ecological zones of Ethiopia. Natural Resources Management and Regulatory Department. With support of German Agency for Technical Cooperation (GTZ) 1998. Available online: http://197.156.72.153:8080/xmlui/handle/123456789/2517 (accessed on 3 August 2021).
  45. Beck, H.E.; Zimmermann, N.E.; McVicar, T.R.; Vergopolan, N.; Berg, A.; Wood, E.F. Present and future Köppen-Geiger climate classification maps at 1-km resolution. Sci. Data 2018, 5, 180214. [Google Scholar] [CrossRef] [Green Version]
  46. Dinku, T.; Block, P.; Sharoff, J.; Hailemariam, K.; Osgood, D.; del Corral, J.; Cousin, R.; Thomson, M.C. Bridging critical gaps in climate services and applications in Africa. Earth Perspect. 2014, 1, 15. [Google Scholar] [CrossRef] [Green Version]
  47. Alemayehu, A.; Bewket, W. Smallholder farmers’ coping and adaptation strategies to climate change and variability in the central highlands of Ethiopia. Local Environ. 2017, 22, 825–839. [Google Scholar] [CrossRef]
  48. Dinku, T.; Faniriantsoa, R.; Islam, S.; Nsengiyumva, G.; Grossi, A. The Climate Data Tool: Enhancing Climate Services Across Africa. Front. Clim. 2022, 3, 185. [Google Scholar] [CrossRef]
  49. Wang, X.L.; Feng, Y. Overview of the RHtests_dlyPrcp Software Package for Homogenization of Daily Precipitation. 2015. Available online: https://meetingorganizer.copernicus.org/EMS2015/EMS2015-76.pdf (accessed on 15 November 2021).
  50. Alexander, L.; Herold, N. ClimPACTv2 Indices and Software. A Document Prepared on Behalf of the Commission for Climatology (CCl) Expert Team on Sector-Specific Climate Indices (ET-SCI) 2015. Available online: https://epic.awi.de/id/eprint/49274/1/ClimPACTv2_manual.pdf (accessed on 12 November 2021).
  51. Worku, G.; Teferi, E.; Bantider, A.; Dile, Y.T. Observed changes in extremes of daily rainfall and temperature in Jemma Sub-Basin, Upper Blue Nile Basin, Ethiopia. Theor. Appl. Climatol. 2019, 135, 839–854. [Google Scholar] [CrossRef]
  52. Abdila, W.; Nugroho, B. Trend analysis of extreme precipitation indices in the southern part of Java. IOP Conf. Ser. Environ. Earth Sci. 2021, 653, 012032. [Google Scholar] [CrossRef]
  53. Ridder, N.N.; Pitman, A.J.; Ukkola, A.M. Do CMIP6 climate models simulate global or regional compound events skillfully? Geophys. Res. Lett. 2021, 48, e2020GL091152. [Google Scholar] [CrossRef]
  54. Kothari, C.R. Research Methodology: Methods and Techniques; New Age International: New Delhi, India, 2004; Available online: https://ccsuniversity.ac.in/bridge-library/pdf/Research-Methodology-CR-Kothari.pdf (accessed on 18 February 2022).
  55. Haile, G.G.; Tang, Q.; Leng, G.; Jia, G.; Wang, J.; Cai, D.; Sun, S.; Baniya, B.; Zhang, Q. Long-term spatiotemporal variation of drought patterns over the Greater Horn of Africa. Sci. Total Environ. 2020, 704, 135299. [Google Scholar] [CrossRef]
  56. Mann, B.H. Non-Parametric Test against Trend. Econometrica 1945, 13, 245–259. [Google Scholar] [CrossRef]
  57. Kendall, M. Rank Correlation Methods, 4th ed.; Charles Griffin: San Francisco, CA, USA, 1975; Volume 8, p. 875. [Google Scholar]
  58. Sen, P.K. Estimates of the regression coefficient based on Kendall’s tau. J. Am. Stat. Assoc. 1968, 63, 1379–1389. [Google Scholar] [CrossRef]
  59. Ayugi, B.; Eresanya, E.O.; Onyango, A.O.; Ogou, F.K.; Okoro, E.C.; Okoye, C.O.; Anoruo, C.M.; Dike, V.N.; Ashiru, O.R.; Daramola, M.T.; et al. Review of meteorological drought in Africa: Historical trends, impacts, mitigation measures, and prospects. Pure Appl. Geophys. 2022, 179, 1365–1386. [Google Scholar] [CrossRef] [PubMed]
  60. Nasir, J.; Assefa, E.; Zeleke, T.; Gidey, E. Modeling seasonal and annual climate variability trends and their characteristics in northwestern Escarpment of Ethiopian Rift Valley. Model. Earth Syst. Environ. 2021, 8, 2551–2565. [Google Scholar] [CrossRef]
  61. Shawul, A.A.; Chakma, S. Trend of extreme precipitation indices and analysis of long-term climate variability in the Upper Awash basin, Ethiopia. Theor. Appl. Climatol. 2020, 140, 635–652. [Google Scholar] [CrossRef]
  62. Coulibaly, T.; Islam, M.; Managi, S. The impacts of climate change and natural disasters on agriculture in African countries. Econ. Disaster Clim. Chang. 2020, 4, 347–364. [Google Scholar] [CrossRef]
  63. Hatfield, J.L.; Prueger, J.H. Temperature extremes: Effect on plant growth and development. Weather Clim. Extrem. 2015, 10, 4–10. [Google Scholar] [CrossRef] [Green Version]
  64. Omondi, P.A.; Awange, J.L.; Forootan, E.; Ogallo, L.A.; Barakiza, R.; Girmaw, G.B.; Fesseha, I.; Kululetera, V.; Kilembe, C.; Mbati, M.M. Changes in temperature and precipitation extremes over the Greater Horn of Africa region from 1961 to 2010. Int. J. Climatol. 2014, 34, 1262–1277. [Google Scholar] [CrossRef]
  65. Esayas, B.; Simane, B.; Teferi, E.; Ongoma, V.; Tefera, N. Trends in extreme climate events over three agroecological zones of southern Ethiopia. Adv. Meteorol. 2018, 2018, 7354157. [Google Scholar] [CrossRef]
  66. Ferrelli, F.; Brendel, A.S.; Perillo, G.M.E.; Piccolo, M.C. Warming signals emerging from the analysis of daily changes in extreme temperature events over Pampas (Argentina). Environ. Earth Sci. 2021, 80, 422. [Google Scholar] [CrossRef]
  67. Berhane, A.; Hadgu, G.; Worku, W.; Abrha, B. Trends in extreme temperature and rainfall indices in the semi-arid areas of Western Tigray, Ethiopia. Environ. Syst. Res. 2020, 9, 3. [Google Scholar] [CrossRef] [Green Version]
  68. Shuai, S.; Fadong, L.; Yonglong, L.; Khan, K.; Jianfang, X.; Peifang, L. Spatio-temporal characteristics of the extreme climate events and their potential effects on crop yield in Ethiopia. J. Resour. Ecol. 2018, 9, 290–301. [Google Scholar] [CrossRef]
  69. Luhunga, P.M.; Songoro, A.E. Analysis of climate change and extreme climatic events in the Lake Victoria Region of Tanzania. Front. Clim. 2020, 27, 559584. [Google Scholar] [CrossRef]
  70. Vogel, E.; Donat, M.G.; Alexander, L.V.; Meinshausen, M.; Ray, D.K.; Karoly, D.; Meinshausen, N.; Frieler, K. The effects of climate extremes on global agricultural yields. Environ. Res. Lett. 2019, 14, 054010. [Google Scholar] [CrossRef]
  71. Chen, H.; Yang, J.; Ding, Y.; Tan, C.; He, Q.; Wang, Y.; Qin, J.; Tang, F.; Ge, Q. Variation in Extreme Temperature and its Instability in China. Atmosphere 2021, 13, 19. [Google Scholar] [CrossRef]
  72. Wu, X.; Wang, Z.; Zhou, X.; Lai, C.; Chen, X. Trends in temperature extremes over nine integrated agricultural regions in China, 1961–2011. Theor. Appl. Climatol. 2017, 129, 1279–1294. [Google Scholar] [CrossRef]
  73. Mohammed, Y.; Yimer, F.; Tadesse, M.; Tesfaye, K. Variability and trends of rainfall extreme events in north east highlands of Ethiopia. Int. J. Hydrol. 2018, 2, 594–605. [Google Scholar] [CrossRef]
  74. Muluneh, A.; Bewket, W.; Keesstra, S.; Stroosnijder, L. Searching for evidence of changes in extreme rainfall indices in the Central Rift Valley of Ethiopia. Theor. Appl. Climatol. 2017, 128, 795–809. [Google Scholar] [CrossRef]
  75. Bulti, D.T.; Abebe, B.G.; Biru, Z. Analysis of the changes in historical and future extreme precipitation under climate change in Adama city, Ethiopia. Model. Earth Syst. Environ. 2021, 7, 2575–2587. [Google Scholar] [CrossRef]
  76. Akinsanola, A.; Kooperman, G.; Reed, K.; Pendergrass, A.; Hannah, W. Projected changes in seasonal precipitation extremes over the United States in CMIP6 simulations. Environ. Res. Lett. 2020, 15, 104078. [Google Scholar] [CrossRef]
  77. Myhre, G.; Alterskjær, K.; Stjern, C.W.; Hodnebrog, Ø.; Marelle, L.; Samset, B.H.; Sillmann, J.; Schaller, N.; Fischer, E.; Schulz, M. Frequency of extreme precipitation increases extensively with event rareness under global warming. Sci. Rep. 2019, 9, 16063. [Google Scholar] [CrossRef] [Green Version]
  78. Halimatou, A.T.; Kalifa, T.; Kyei-Baffour, N. Assessment of changing trends of daily precipitation and temperature extremes in Bamako and Ségou in Mali from 1961–2014. Weather Clim. Extrem. 2017, 18, 8–16. [Google Scholar] [CrossRef]
  79. Lu, J.; Carbone, G.J.; Huang, X.; Lackstrom, K.; Gao, P. Mapping the sensitivity of agriculture to drought and estimating the effect of irrigation in the United States, 1950–2016. Agric. For. Meteorol. 2020, 292, 108124. [Google Scholar] [CrossRef]
  80. Mihiretu, A.; Okoyo, E.N.; Lemma, T. Small holder farmers’ perception and response mechanisms to climate change: Lesson from Tekeze lowland goat and sorghum livelihood zone, Ethiopia. Cogent Food Agric. 2020, 6, 1763647. [Google Scholar] [CrossRef]
  81. Roy, D.; Datta, A.; Kuwornu, J.K.; Zulfiqar, F. Comparing farmers’ perceptions of climate change with meteorological trends and examining farm adaptation measures in hazard-prone districts of northwest Bangladesh. Environ. Dev. Sustain. 2021, 23, 8699–8721. [Google Scholar] [CrossRef]
  82. Zhang, C.; Jin, J.; Kuang, F.; Ning, J.; Wan, X.; Guan, T. Farmers’ perceptions of climate change and adaptation behavior in Wushen Banner, China. Environ. Sci. Pollut. Res. 2020, 27, 26484–26494. [Google Scholar] [CrossRef] [PubMed]
  83. Manalo, J.A., IV; van de Fliert, E.; Fielding, K. Rice farmers adapting to drought in the Philippines. Int. J. Agric. Sustain. 2020, 18, 594–605. [Google Scholar] [CrossRef]
  84. Neisi, M.; Bijani, M.; Abbasi, E.; Mahmoudi, H.; Azadi, H. Analyzing farmers’ drought risk management behavior: Evidence from Iran. J. Hydrol. 2020, 590, 125243. [Google Scholar] [CrossRef]
  85. Mekuyie, M.; Mulu, D. Perception of impacts of climate variability on pastoralists and their adaptation/coping strategies in fentale district of Oromia region, Ethiopia. Environ. Syst. Res. 2021, 10, 4. [Google Scholar] [CrossRef]
  86. Cuni-Sanchez, A.; Omeny, P.; Pfeifer, M.; Olaka, L.; Mamo, M.B.; Marchant, R.; Burgess, N.D. Climate change and pastoralists: Perceptions and adaptation in montane Kenya. Clim. Dev. 2019, 11, 513–524. [Google Scholar] [CrossRef] [Green Version]
  87. Poudyal, N.C.; Joshi, O.; Hodges, D.G.; Bhandari, H.; Bhattarai, P. Climate change, risk perception, and protection motivation among high-altitude residents of the Mt. Everest region in Nepal. Ambio 2021, 50, 505–518. [Google Scholar] [CrossRef]
  88. Talanow, K.; Topp, E.N.; Loos, J.; Martín-López, B. Farmers’ perceptions of climate change and adaptation strategies in South Africa’s Western Cape. J. Rural Stud. 2021, 81, 203–219. [Google Scholar] [CrossRef]
Figure 1. Map of the study area.
Climate 10 00089 g001
Figure 2. Trends of TRF (a), Tmin (b), and Tmax (c) of the study area. Red dots indicate 95% confidence level; green dots indicate not significant at 95% confidence level.
Climate 10 00089 g002
Figure 3. Coldest night (TNn) (af) and warmest night (TNx) (gl) over agroecological zones for the period 1983–2016.
Climate 10 00089 g003
Figure 4. Cool nights (TN10p) (af) and cool days (TX10p) (gl) over agroecological zones for the period 1983–2016.
Climate 10 00089 g004
Figure 5. Warm nights (TN90p) (af) and warm days (TX90p) (gl) over agroecological zones for the period 1983–2016.
Climate 10 00089 g005
Figure 6. The coldest day (TXn) (af) and warmest day (TXx) (gl) over agroecological zones for the period 1983–2016.
Climate 10 00089 g006
Figure 7. Number of summer days (SU) (af) and Diurnal temperature range (DTR) (gl) over agroecological zones for the period 1983–2016.
Climate 10 00089 g007
Figure 8. Cold spell duration indicator (CSDI) (af) and Warm spell duration indicator (WSDI) (gl) over agroecological zones for the period 1983–2016.
Climate 10 00089 g008
Figure 9. Consecutive dry days (CDD) (af), Consecutive wet days (CWD) (gl), and simple daily intensity index (SDII) (mr) over agroecological zones for the period 1983–2016.
Climate 10 00089 g009
Figure 10. Number of heavy (R10mm) (af) and very heavy (R20mm) (gl) precipitation days over agroecological zones for the period 1983–2016.
Climate 10 00089 g010
Figure 11. Maximum precipitations of 1 day (Rx1DAY) (af) and 5 days (Rx5DAY) (gl) over agroecological zones for the period 1983–2016.
Climate 10 00089 g011
Figure 12. Very wet days (R95p) (af) and extremely wet days (R99p) (gl) over agroecological zones for the period 1983–2016.
Climate 10 00089 g012
Figure 13. Annual total wet-day PRCPTOT (>1 mm/day) over agroecological zones for the period 1983–2016.
Climate 10 00089 g013
Figure 14. Annual trends of SPEI (af) over agroecological zones for the period 1983–2016.
Climate 10 00089 g014
Figure 15. Perceived impacts of climate change, variability, and extreme events (%).
Climate 10 00089 g015
Table 1. Annual trends of TRF, Tmin and Tmax across agroecologies (1983−2016).
VariablesTRF_tau
(Sen’s Slope)
Tmin_tau
(Sen’s Slope)
Tmax_tau
(Sen’s Slope)
Cold–very cold humid [AEZ_1]−0.371 (−10.26) *0.308 (0.019) *0.480 (0.049) *
Tepid–cool humid [AEZ_2]−0.242 (−6.75) *0.373 (0.023) *0.447 (0.062) *
Hot–warm moist [AEZ_3]−0.237 (−3.94) *0.312 (0.028) *0.661 (0.056) *
Hot–warm arid [AEZ_4]−0.264 (−3.83) *0.515 (0.055) *0.501 (0.054) *
Tepid–cool sub-moist [AEZ_5]−0.169 (−5.96) ns0.465 (0.034) *0.619 (0.061) *
Hot–warm semiarid [AEZ_6]0.112 (2.16) ns−0.119 (−0.014) ns0.640 (0.091) *
* = p <0.05; ns = insignificant.
Table 2. Trends of ET_SCI extreme indices.
CodeCold–Very Cold Humid [AEZ_1]Tepid–Cool Humid [AEZ_2]Hot–Warm Moist [AEZ_3]Hot–Warm Arid [AEZ_4]Tepid–Cool Sub-Moist [AEZ_5]Hot–Warm Semiarid [AEZ_6]
(MK) Sens Slope(MK) Sens Slope(MK) Sens Slope(MK) Sens Slope(MK) Sens Slope(MK) Sens Slope
Temperature Indices
TXx(0.419) 0.056 ***(0.400) 0.040 ***(−0.073) −0.008 ns(0.615) 0.082 ***(0.699) 0.089 ***(0.480) 0.073 ***
TNx(0.606) 0.075 ***(0.470) 0.060 ***(0.455) 0.056 ***(0.385) 0.049 ***(−0.636) −0.080 ***(−0.228) −0.033 ns
TXn(0.308) 0.047 **(0.330) 0.030 ***(0.196) 0.024 ns(0.435) 0.066 ***(0.631) 0.081 ***(0.586) 0.081 ***
TNn(0.005) 0.000 ns(−0.130) −0.010 ns(−0.240) −0.030 *(−0.025) −0.004 ns(−0.583) −0.080 ***(−0.430) −0.061 ***
TN10p(−0.456) −0.035 ***(−0.470) −0.070 ***(−0.291) −0.041 **(−0.082) −0.008 ns(0.724) 0.050 ***(0.544) 0.057 ***
TX10p(−0.549) −0.070 ***(0.500) 0.050 ***(−0.438) −0.069 ***(−0.622) −0.033 ***(−0.709) −0.057 ***(−0.599) −0.077 ***
TN90p(0.722) 0.080 ***(−0.490) −0.020 ***(0.472) 0.049 ***(0.405) 0.053 ***(−0.699) −0.048 ***(−0.380) −0.040 **
TX90P(0.472) 0.056 ***(0.390) 0.040 ***(0.184) 0.028 ns(0.768) 0.075 ***(0.713) 0.054 ***(0.528) 0.065 ***
WSDI(0.430) 0.024 ***(0.050) 0.200 ***(0.041) 0.000 ns(0.583) 0.041 ***(0.545) 0.026 ***(0.346) 0.020 **
DTR(0.111) 0.013 ns(0.320) 0.120 **(−0.071) −0.015 ns(0.620) 0.082 ***(0.879) 0.098 ***(0.772) 0.094 ***
CSDI(−0.159) 0.000 *(−0.260) −0.040 *(−0.283) −0.031 *(0.116) 0.000 ns(0.430) 0.027 ***(0.340) 0.000 **
SU(0.481) 0.073 ***(0.050) 0.220 ***(0.364) 0.055 *(0.513) 0.034 ***(0.720) 0.090 ***(0.620) 0.069 ***
Rainfall Indices
RX1day(−0.194) −0.036 ns(−0.090) −0.010 ns(−0.127) −0.013 ns(0.025) 0.005 ns(−0.121) −0.018 ns(−0.077) −0.010 ns
RX5day(−0.239) −0.026 *(−0.120) −0.010 ns(−0.123) −0.022 ns(0.139) 0.027 ns(−0.082) −0.011 ns(0.011) 0.001 ns
R10mm(−0.210) −0.025 ns(−0.048) −0.006 ns(−0.385) −0.049 **(0.189) 0.034 ns(−0.282) −0.032 *(0.094) 0.011 ns
R20mm(−0.257) 0.000 *(−0.300) −0.120 ***(−0.184) −0.023 ns(0.121) 0.015 ns(−0.087) 0.000 ns(−0.002) 0.000 ns
CDD(0.175) 0.021 ns(0.320) 0.040 **(0.378) 0.042 **(0.135) 0.019 ns(0.258) 0.035 *(0.077) 0.012 ns
CWD(0.258) 0.032 *(−0.060) 0.000 ns(0.135) 0.016 ns(0.068) 0.000 ns(0.207) 0.022 ns(0.053) 0.006 ns
R95p(−0.155) −0.010 ns(−0.170) −0.020 ns(−0.332) −0.037 **(0.098) 0.014 ns(−0.232) −0.020 *(0.011) 0.000 ns
R99p(−0.235) 0.000 **(−0.180) 0.000 ns(−0.080) 0.000 ns(0.027) 0.000 ns(−0.134) 0.000 ns(0.045) 0.000 ns
SDII(−0.159) −0.014 ns(−0.220) −0.030 ns(−0.178) −0.021 ns(0.134) 0.024 ns(−0.171) −0.023 ns(−0.053) −0.006 ns
PRCPTOT(−0.201) −0.025 ns(−0.360) −0.040 ***(−0.237) −0.029 *(0.141) 0.021 ns(−0.225) −0.036 ns(0.023) 0.004 ns
Drought Index
SPEI 12(−0.330) −0.052 **(−0.410) −0.050 ***(−0.275) −0.040 *(−0.390) −0.058 **(−0.695) −0.088 ***(−0.497) −0.068 ***
* p ≤ 0.05; ** p ≤ 0.01; *** p ≤ 0.001; ns = insignificant.
Publisher’s Note: MDPI stays neutral with regard to jurisdictional claims in published maps and institutional affiliations.

