
Recent Developments in Some Long-Term Drought Drivers


Abstract
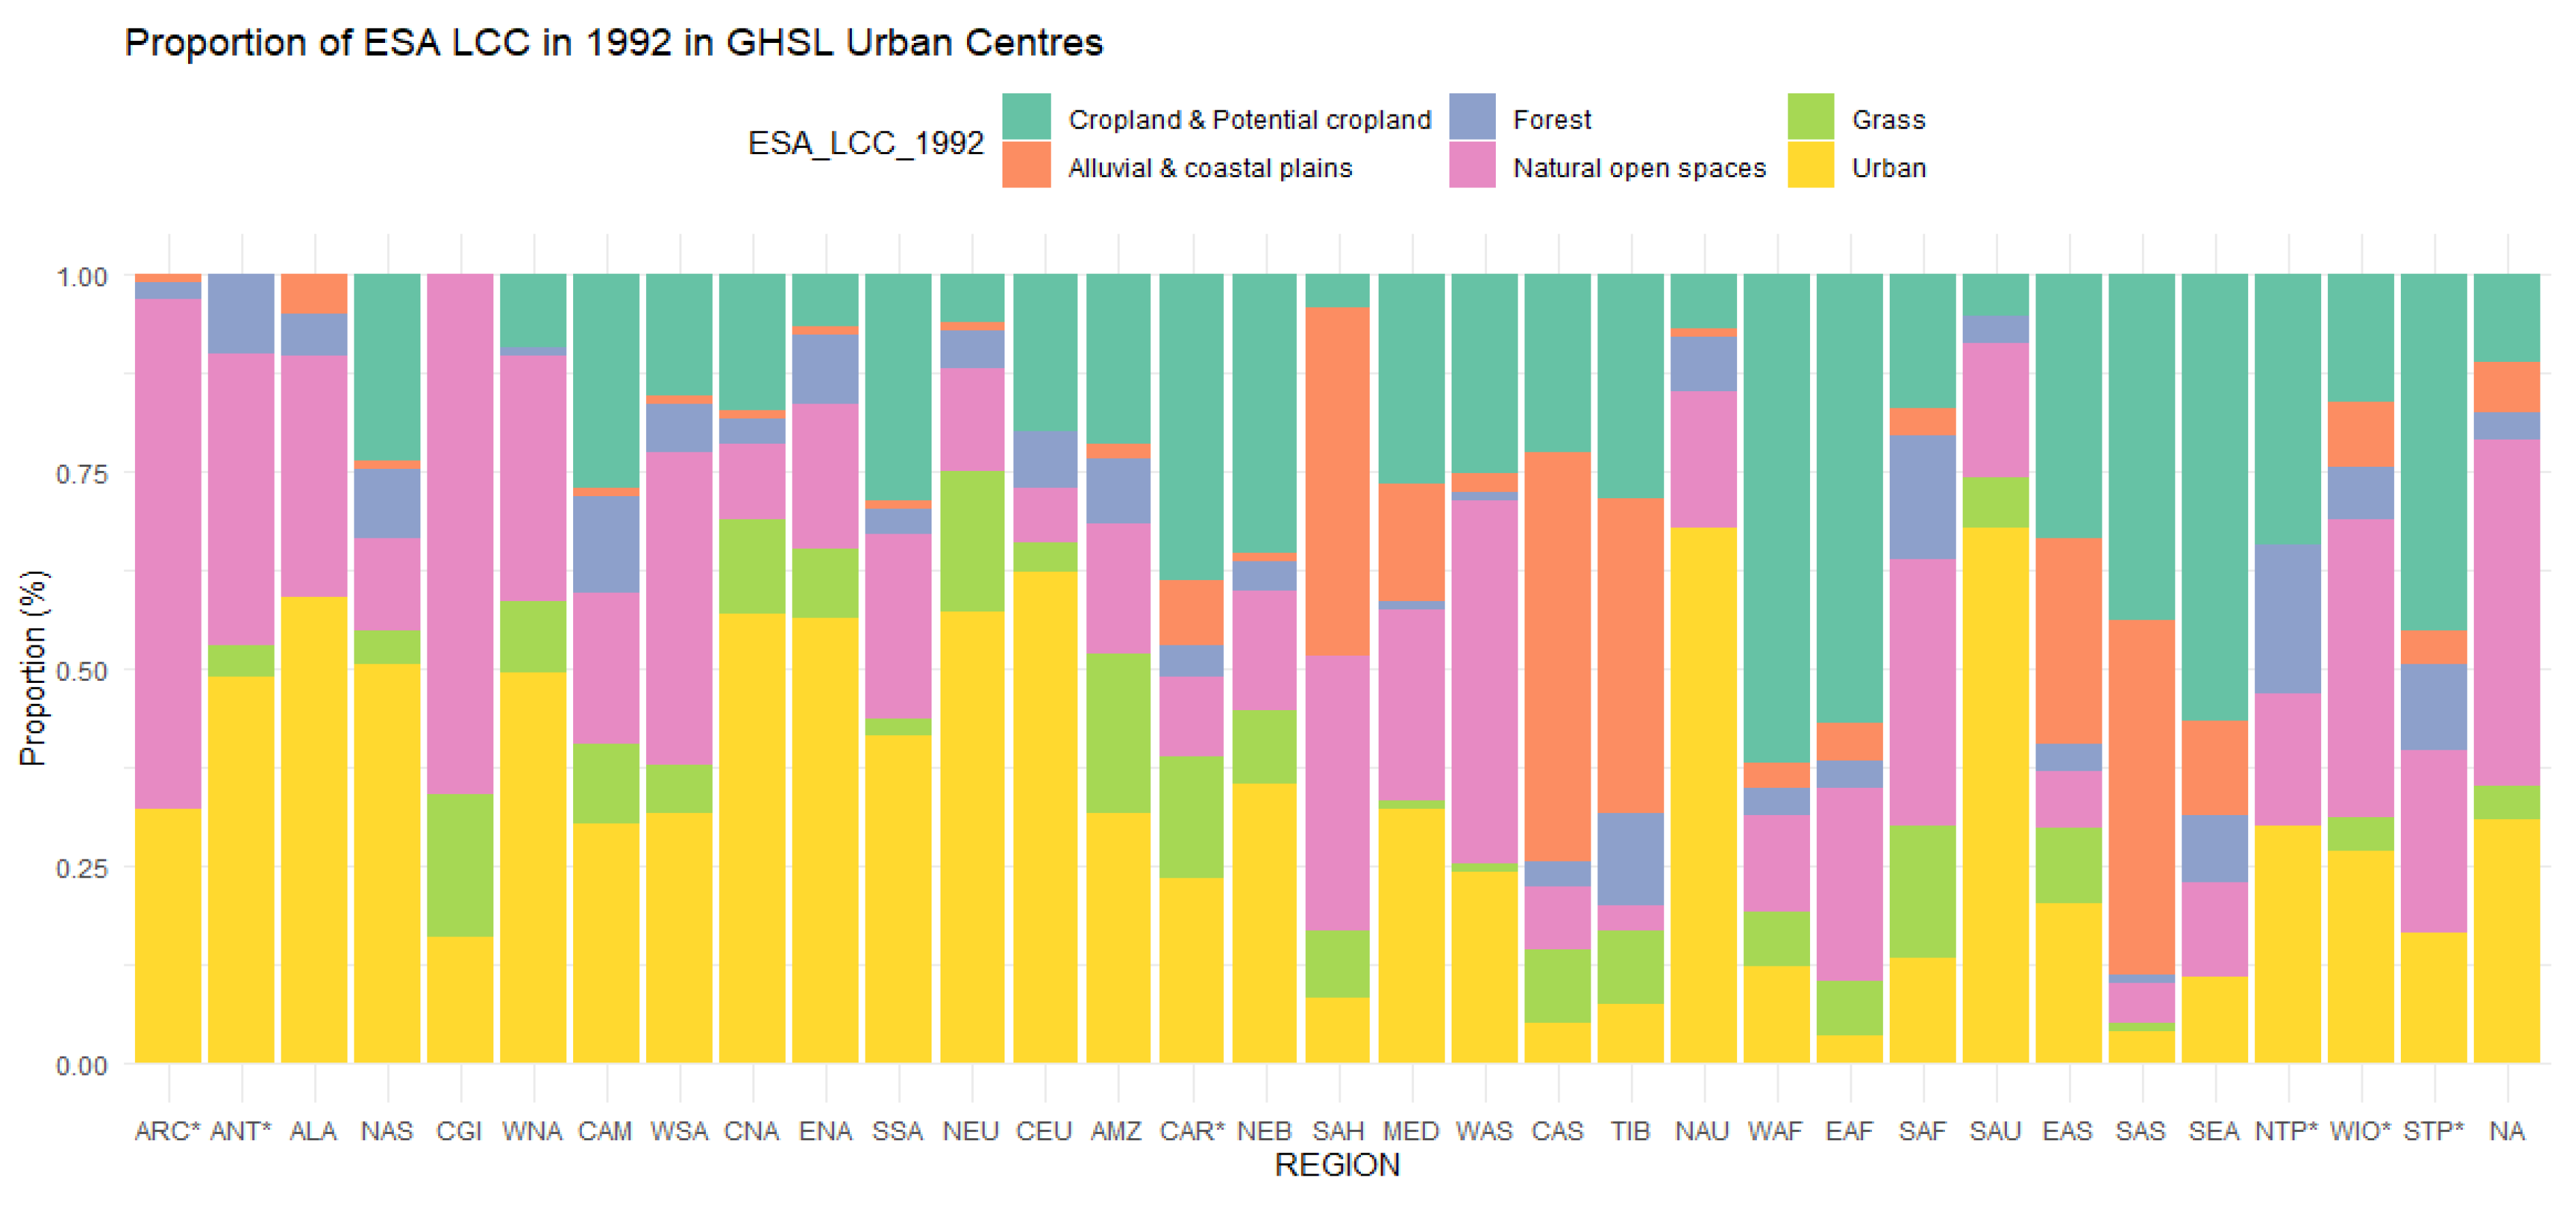
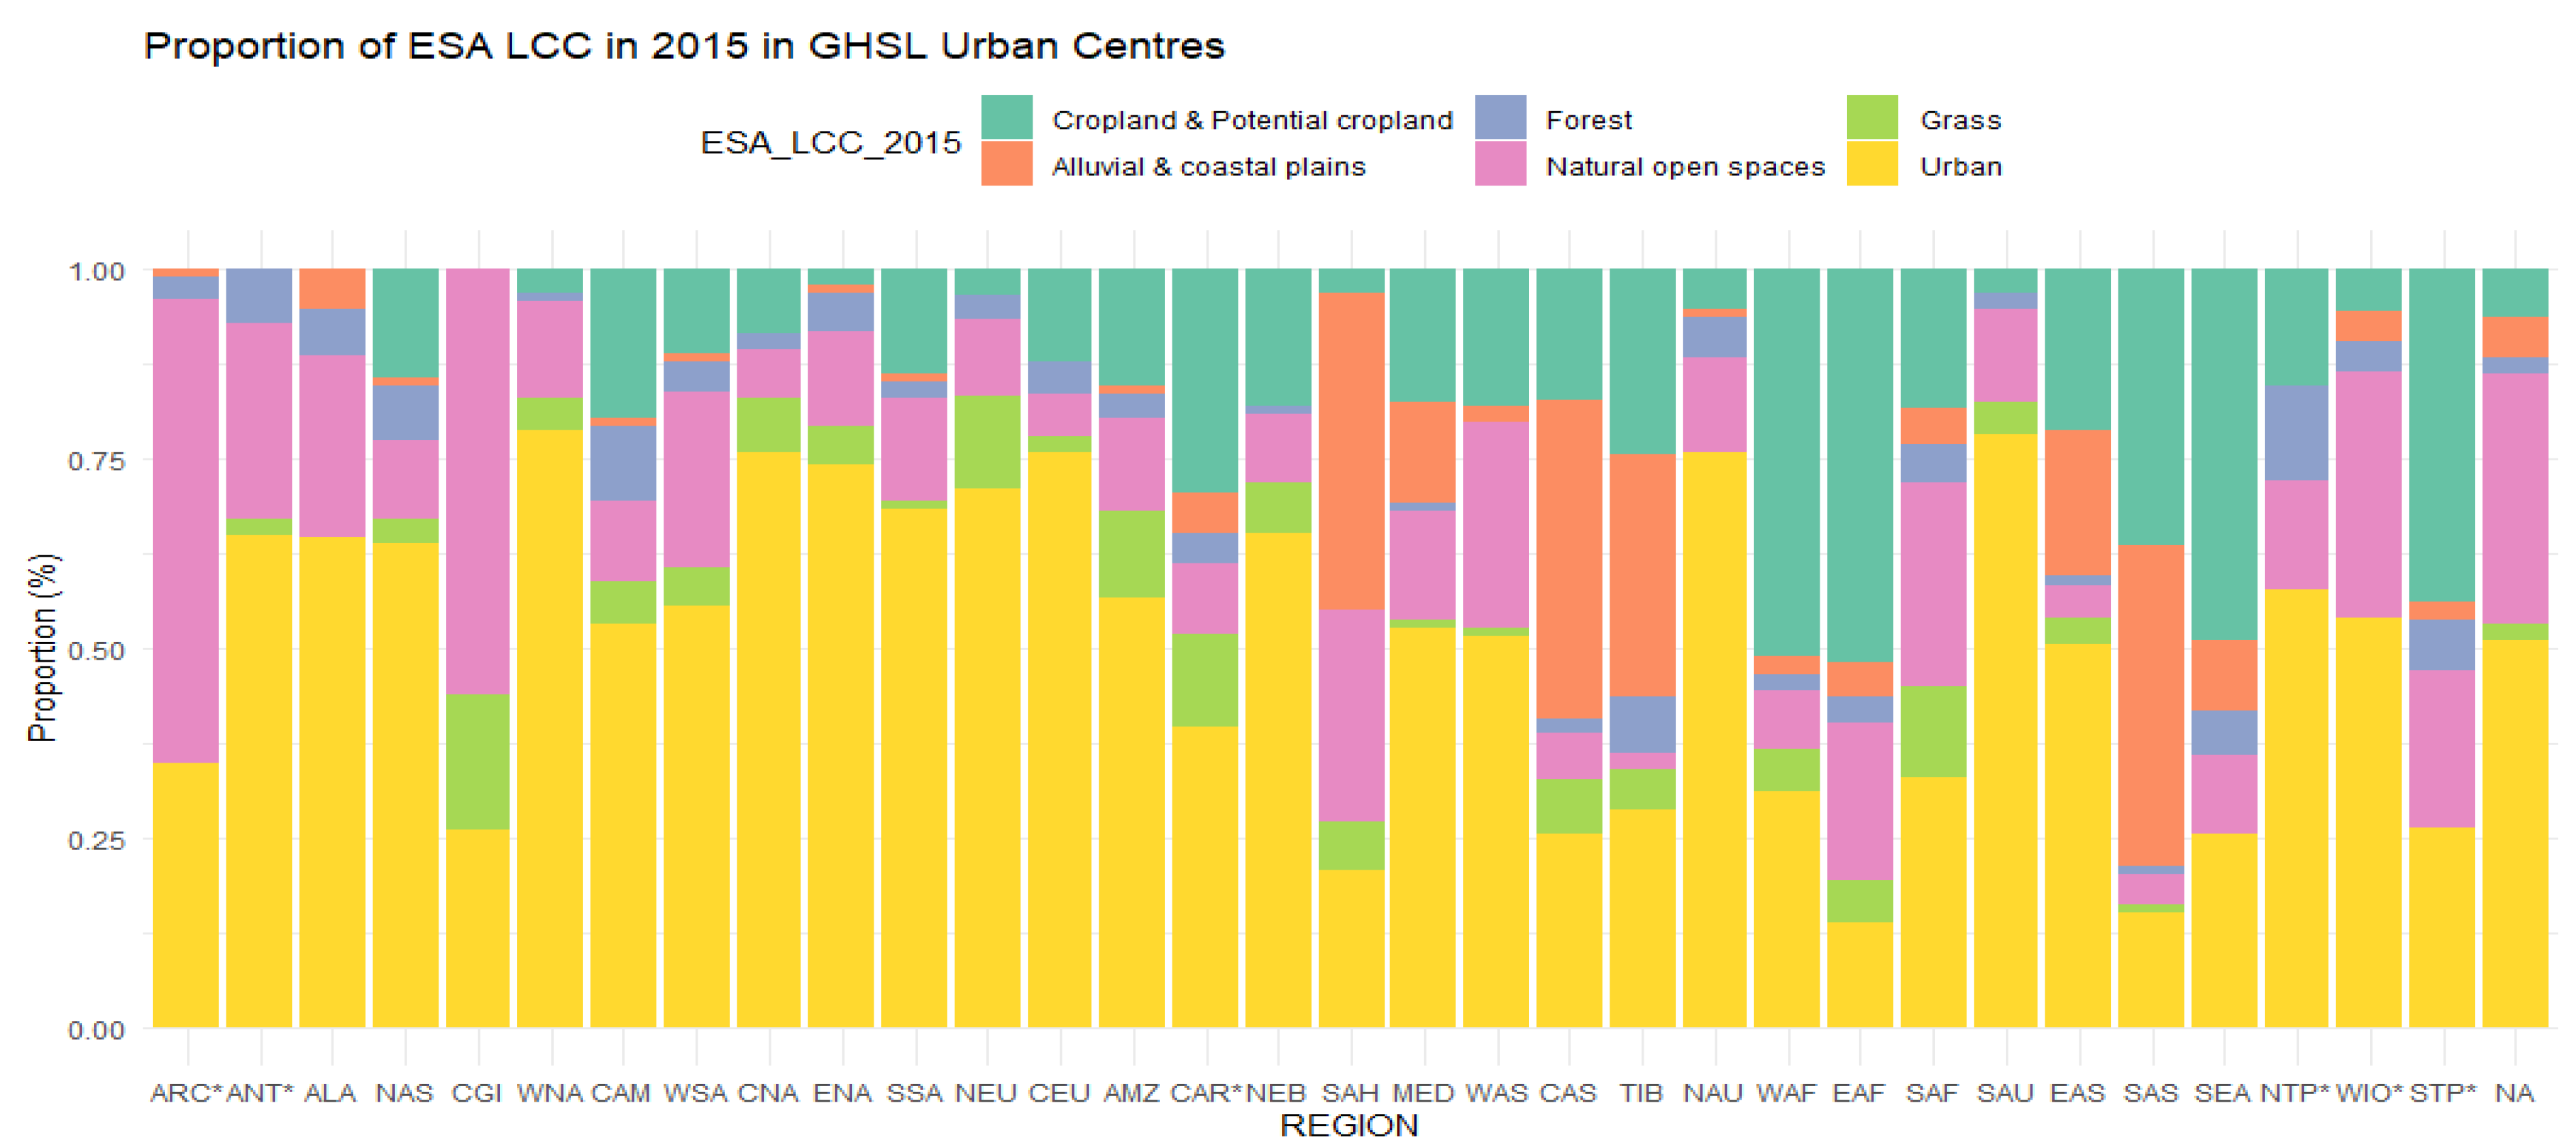
:1. Land Use Changes in the Last 30 Years
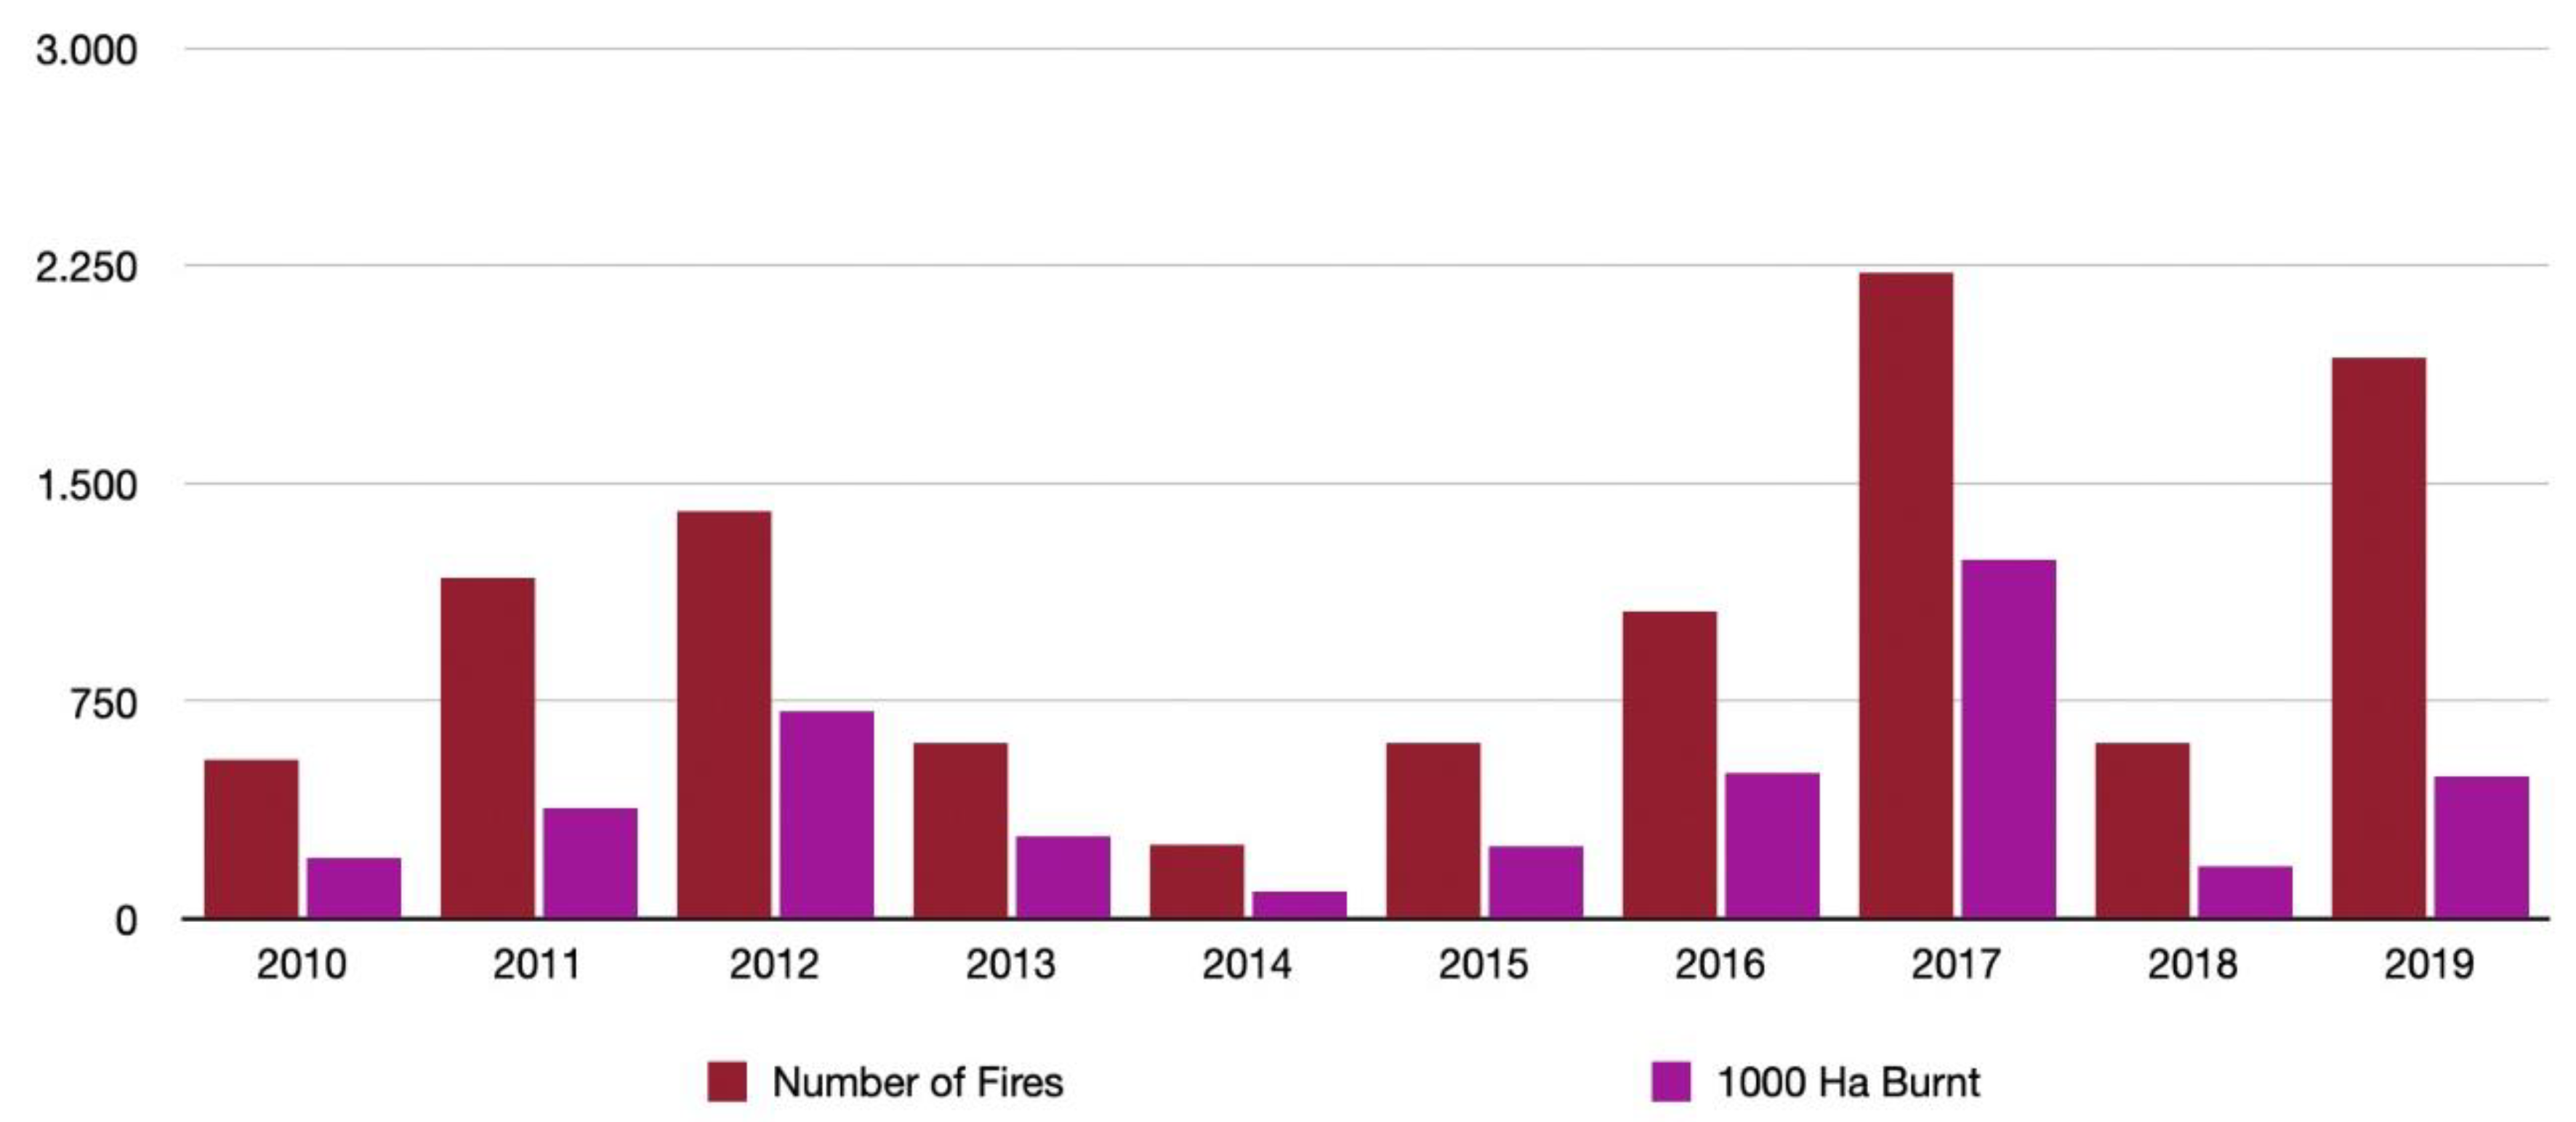
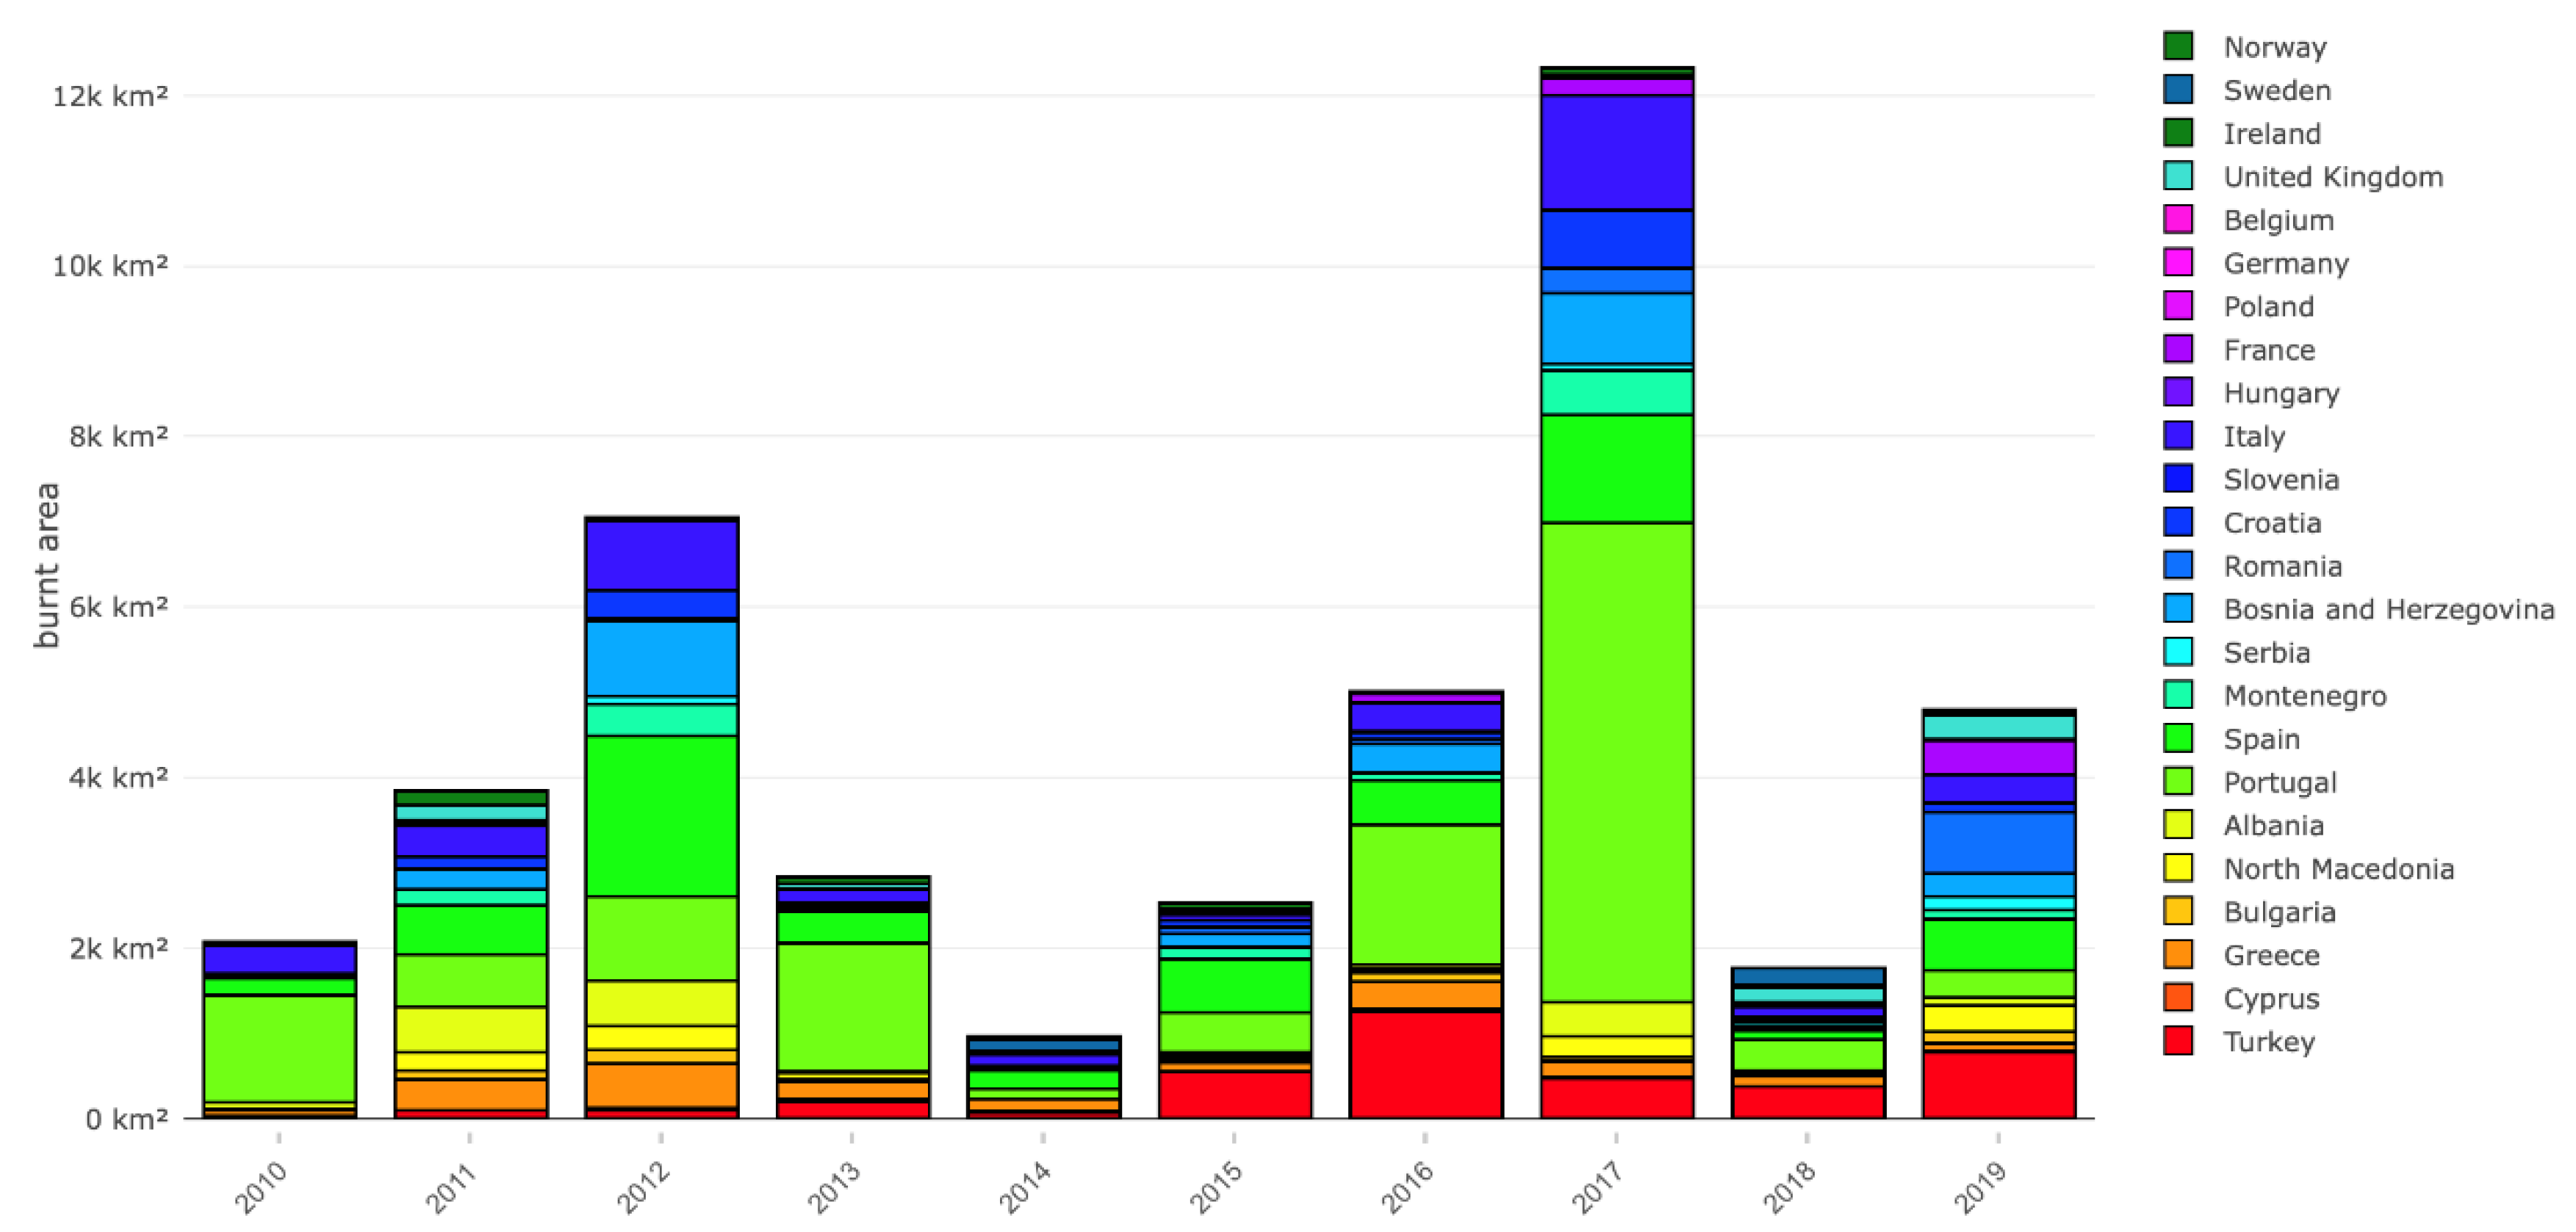
2. Wildfires
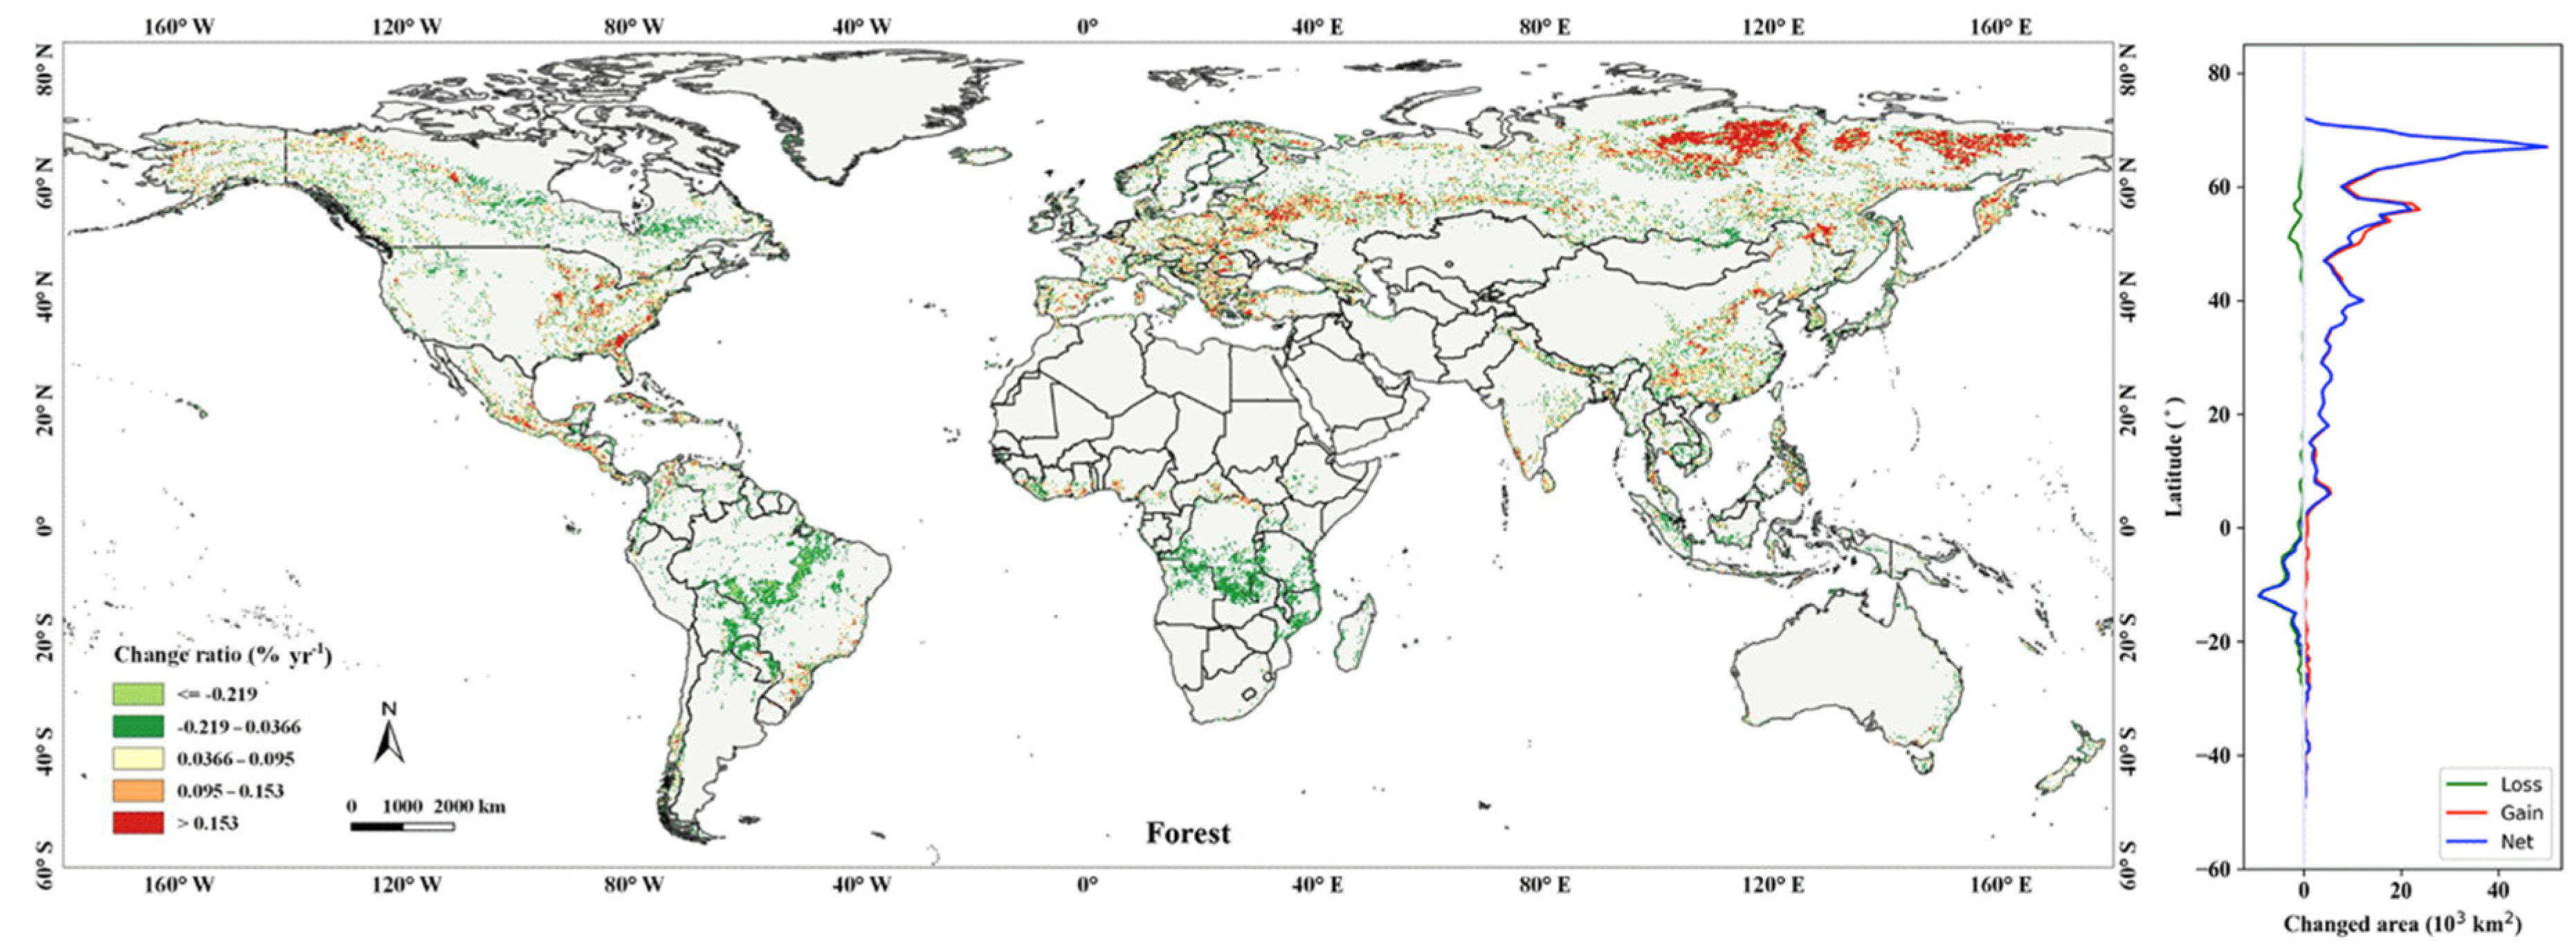
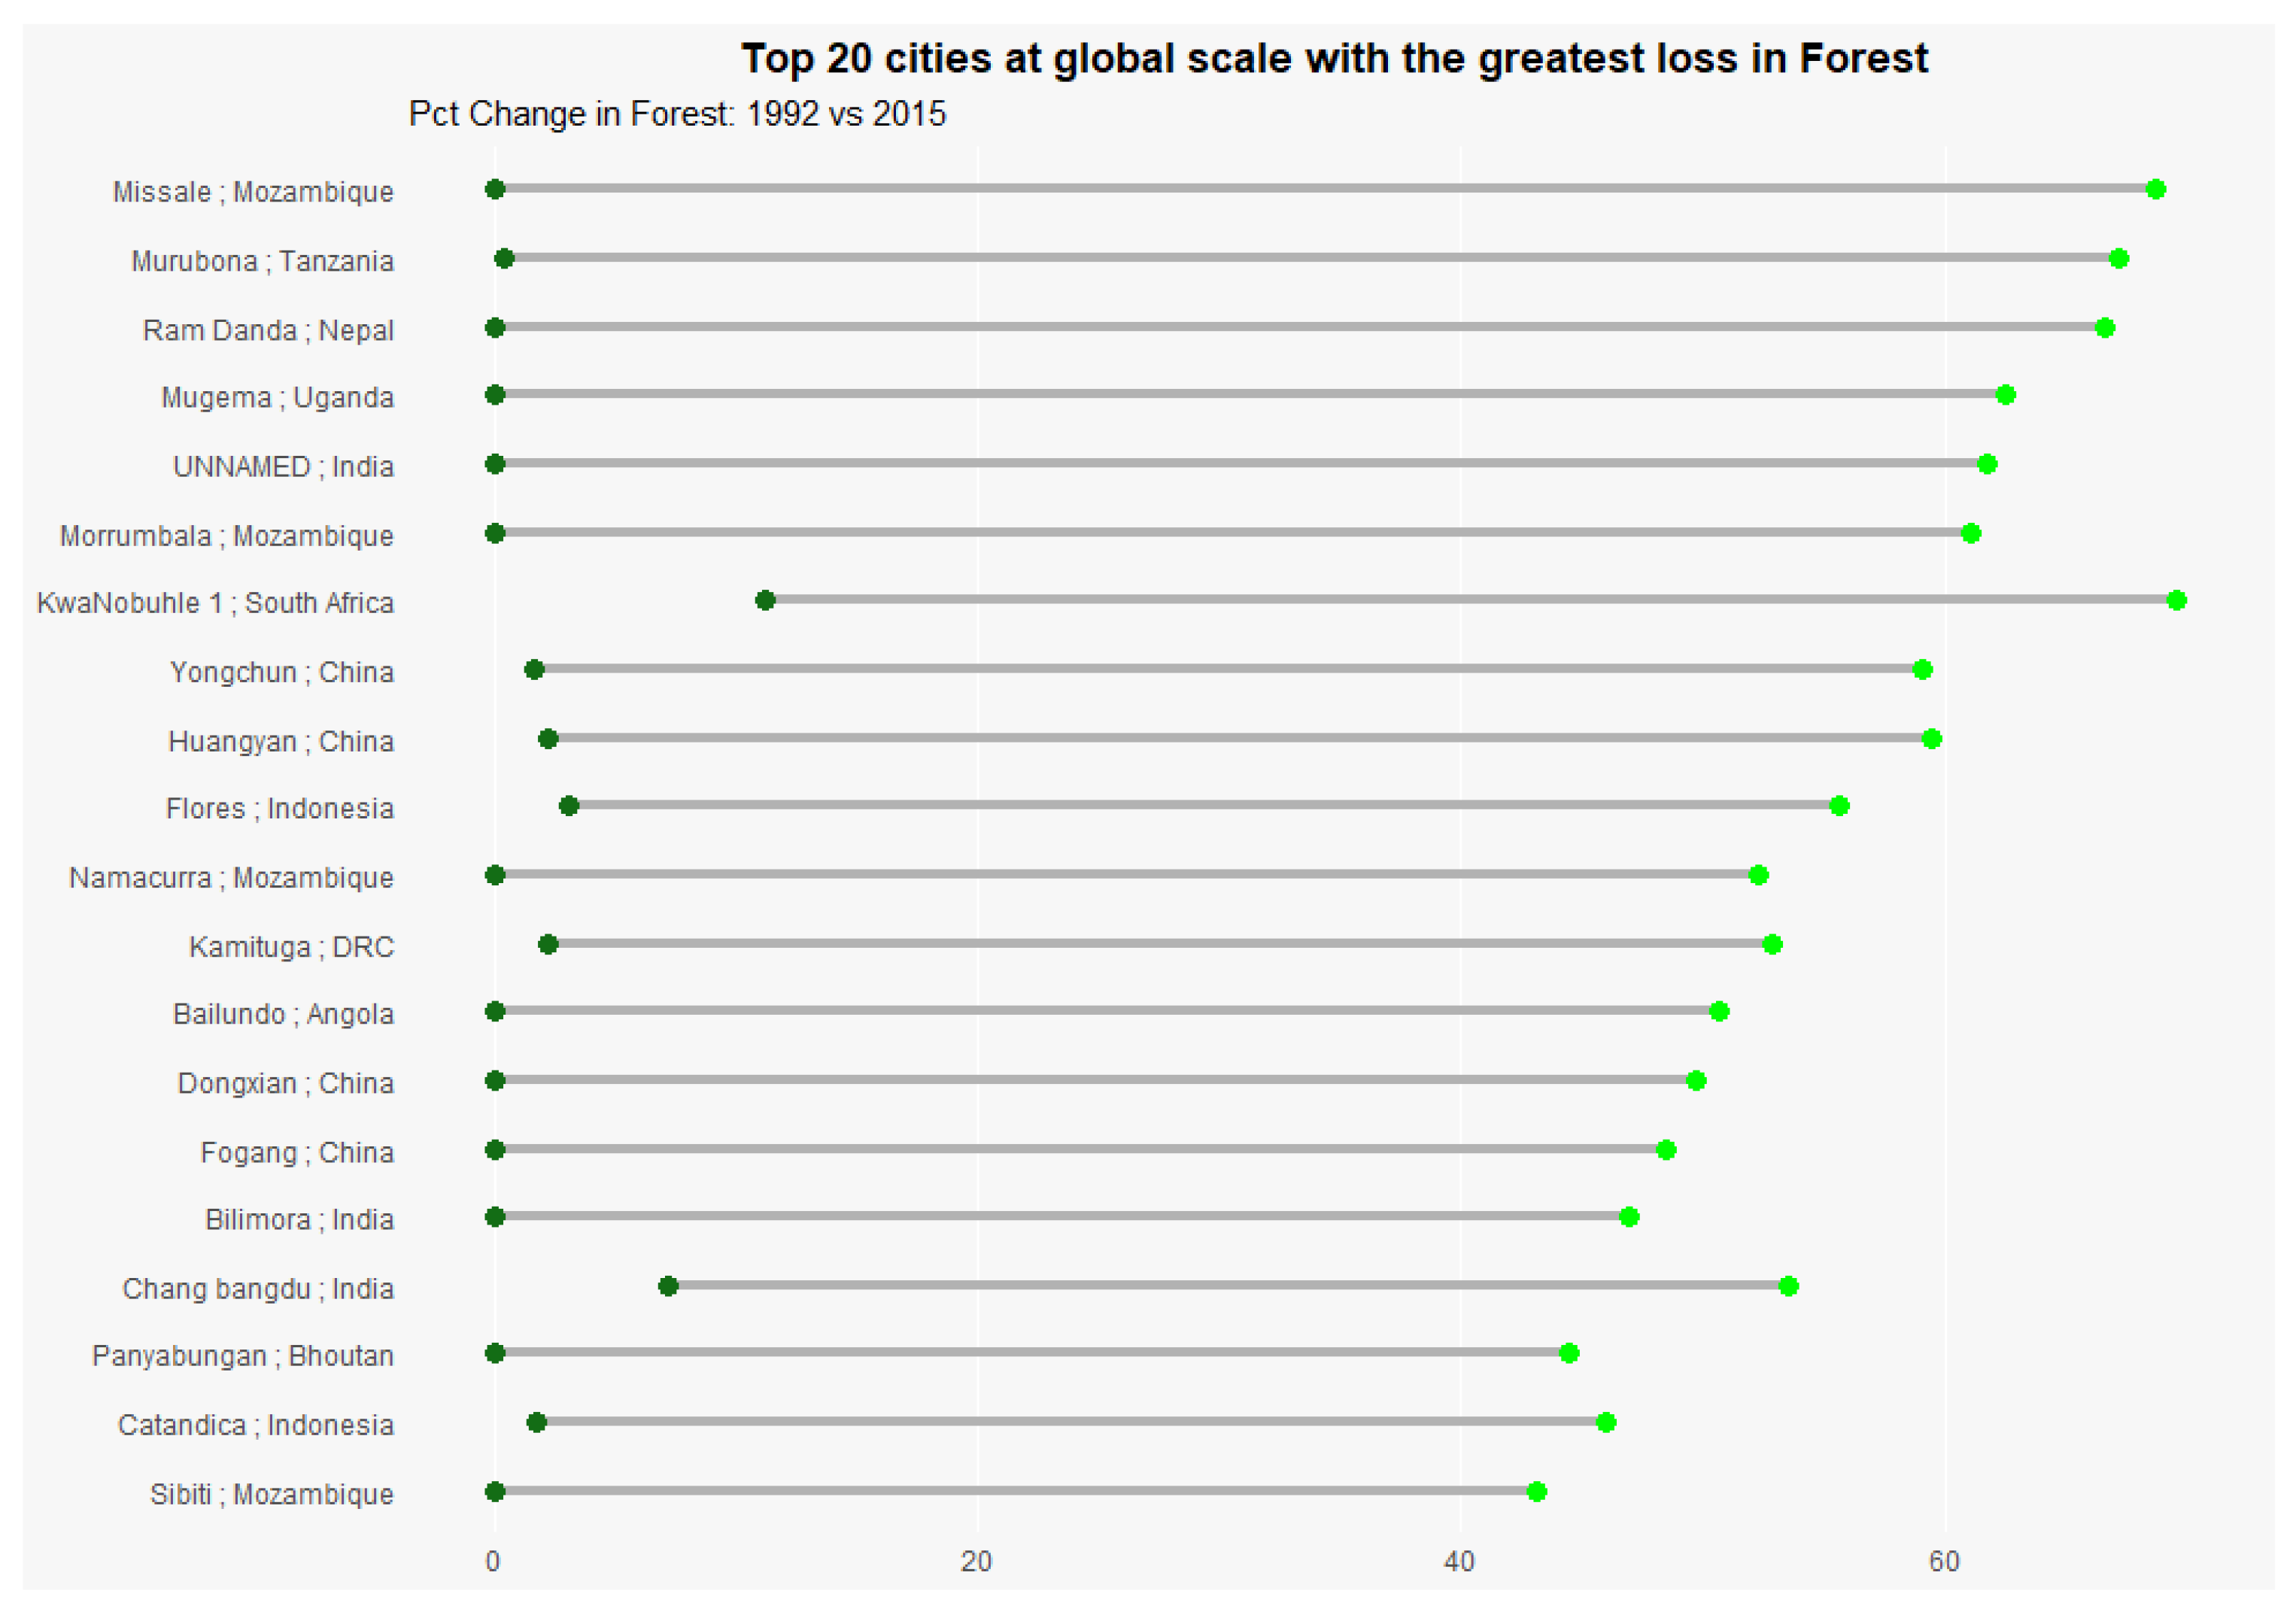
3. Deforestation
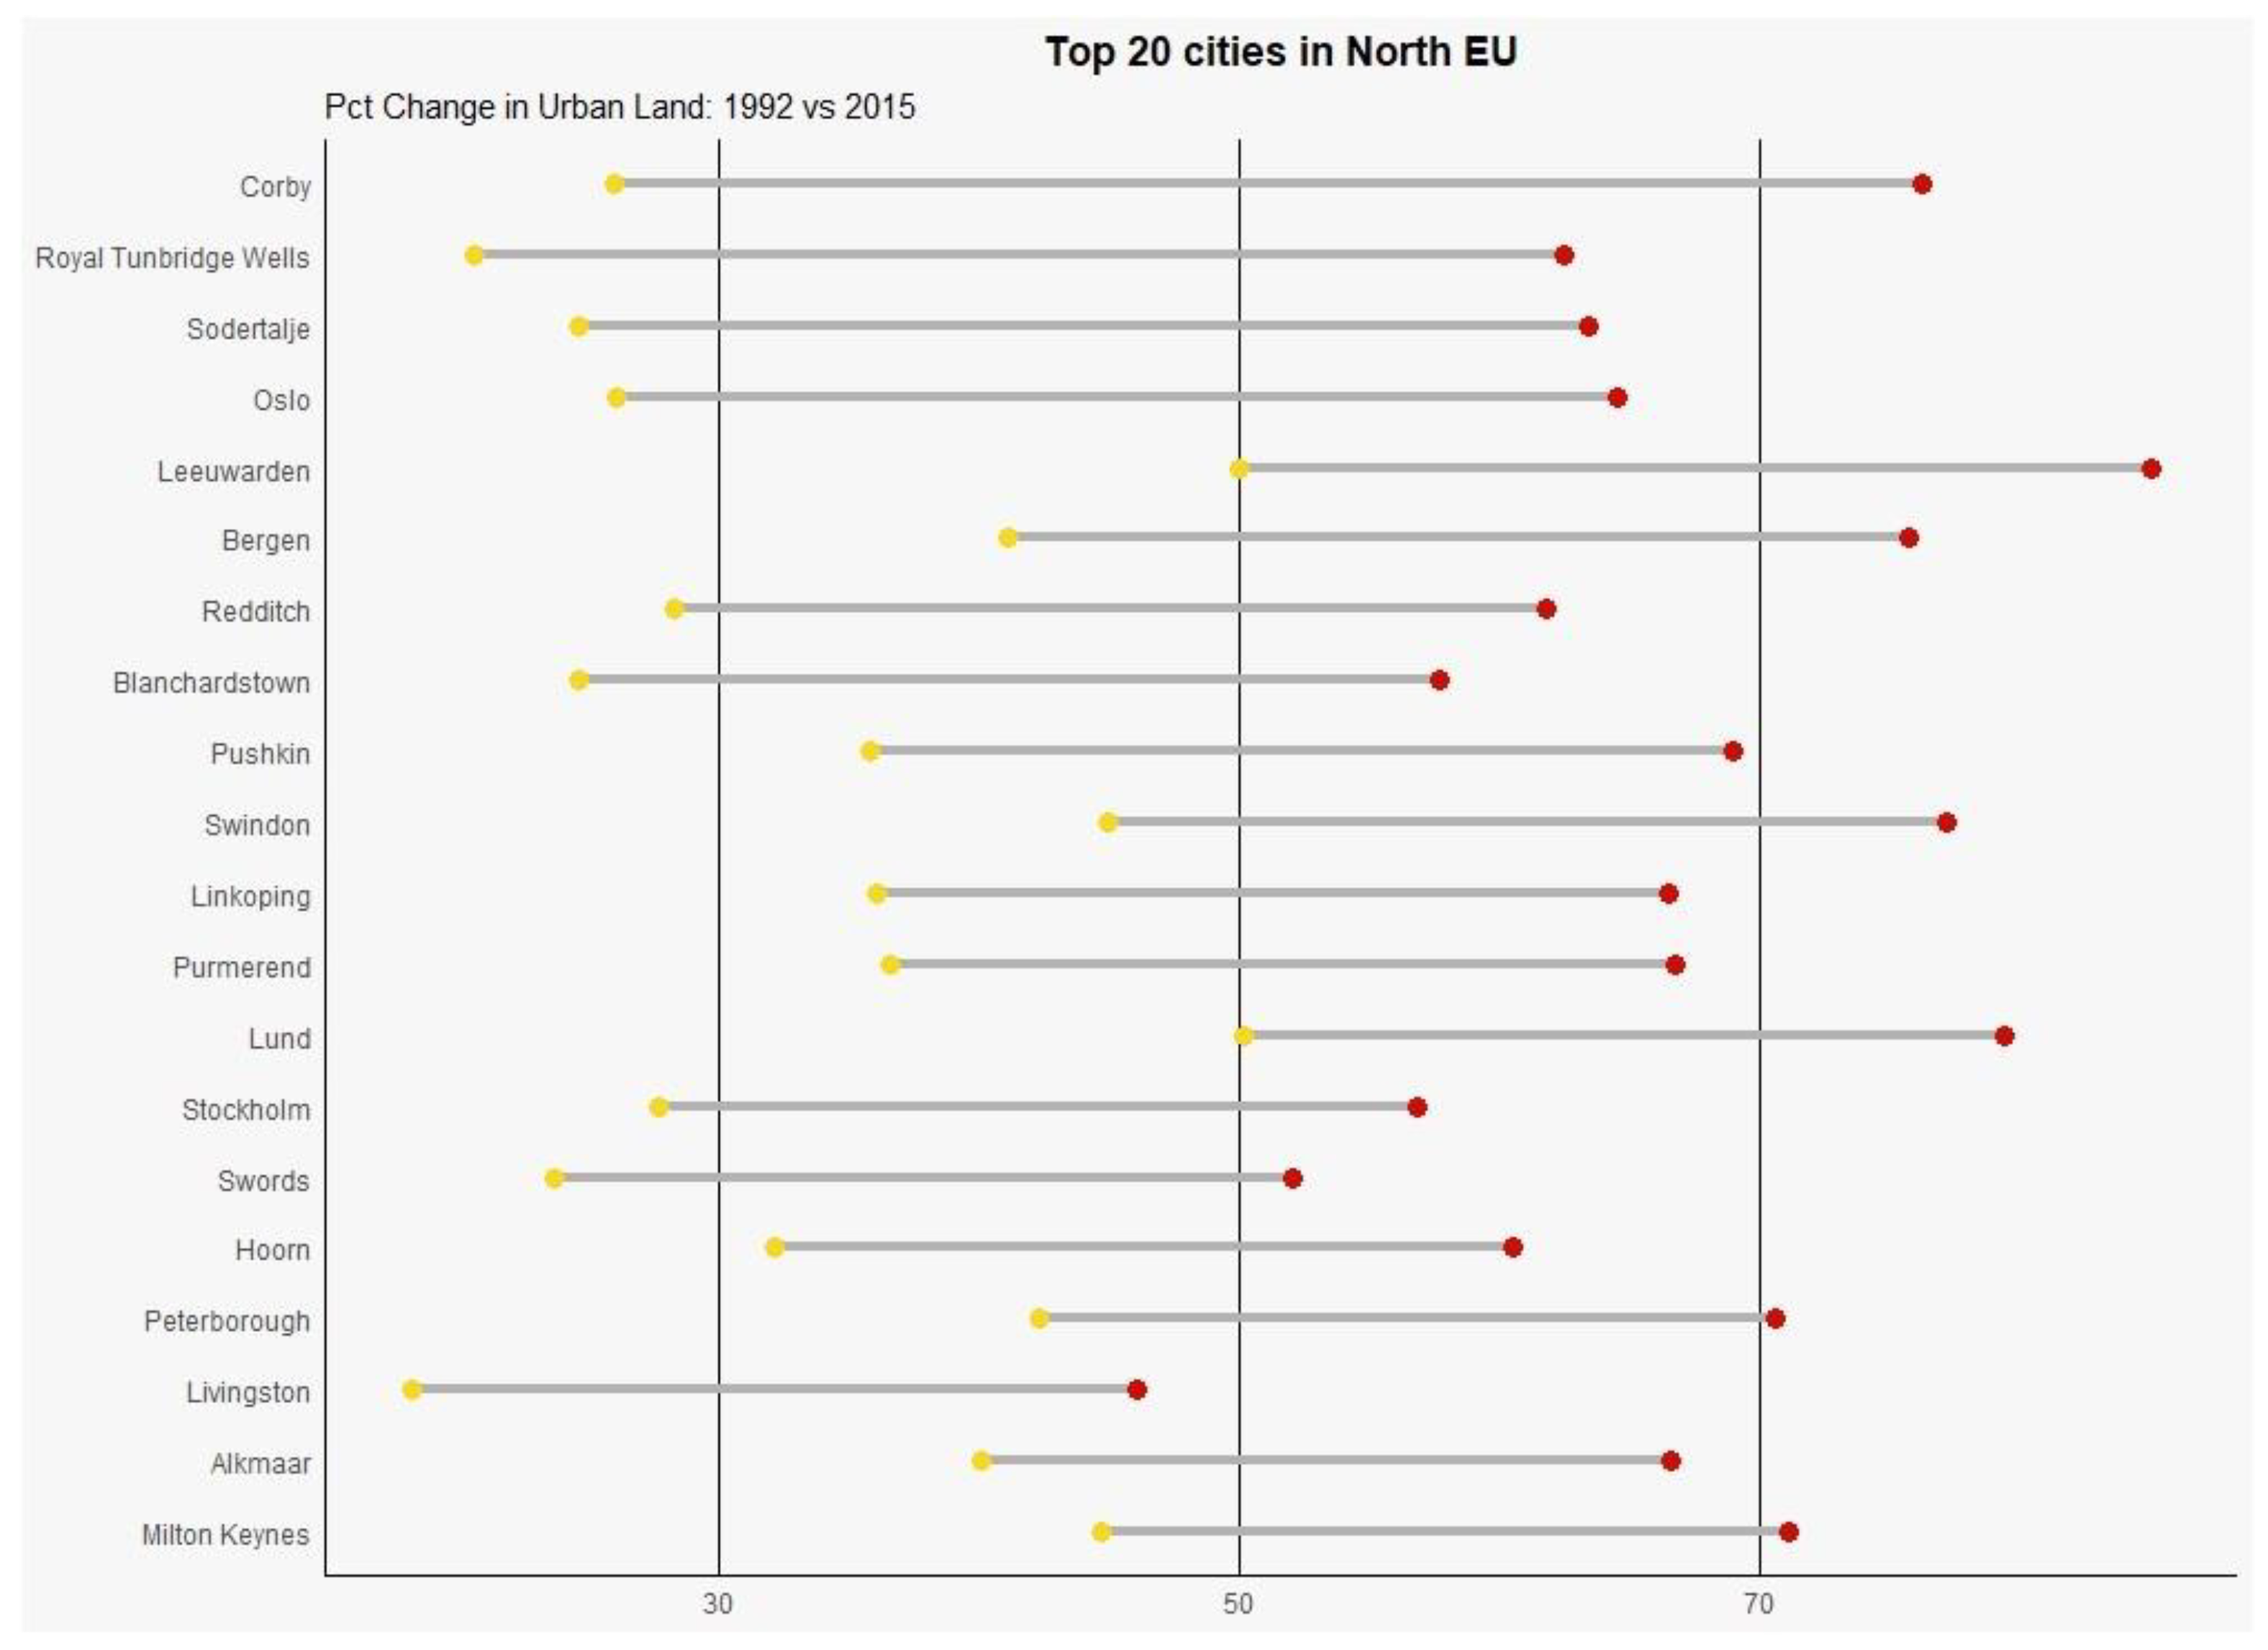
4. Urbanisation
5. Conclusions on Land Use Trends and Drought
Author Contributions
Funding
Institutional Review Board Statement
Informed Consent Statement
Data Availability Statement
Conflicts of Interest
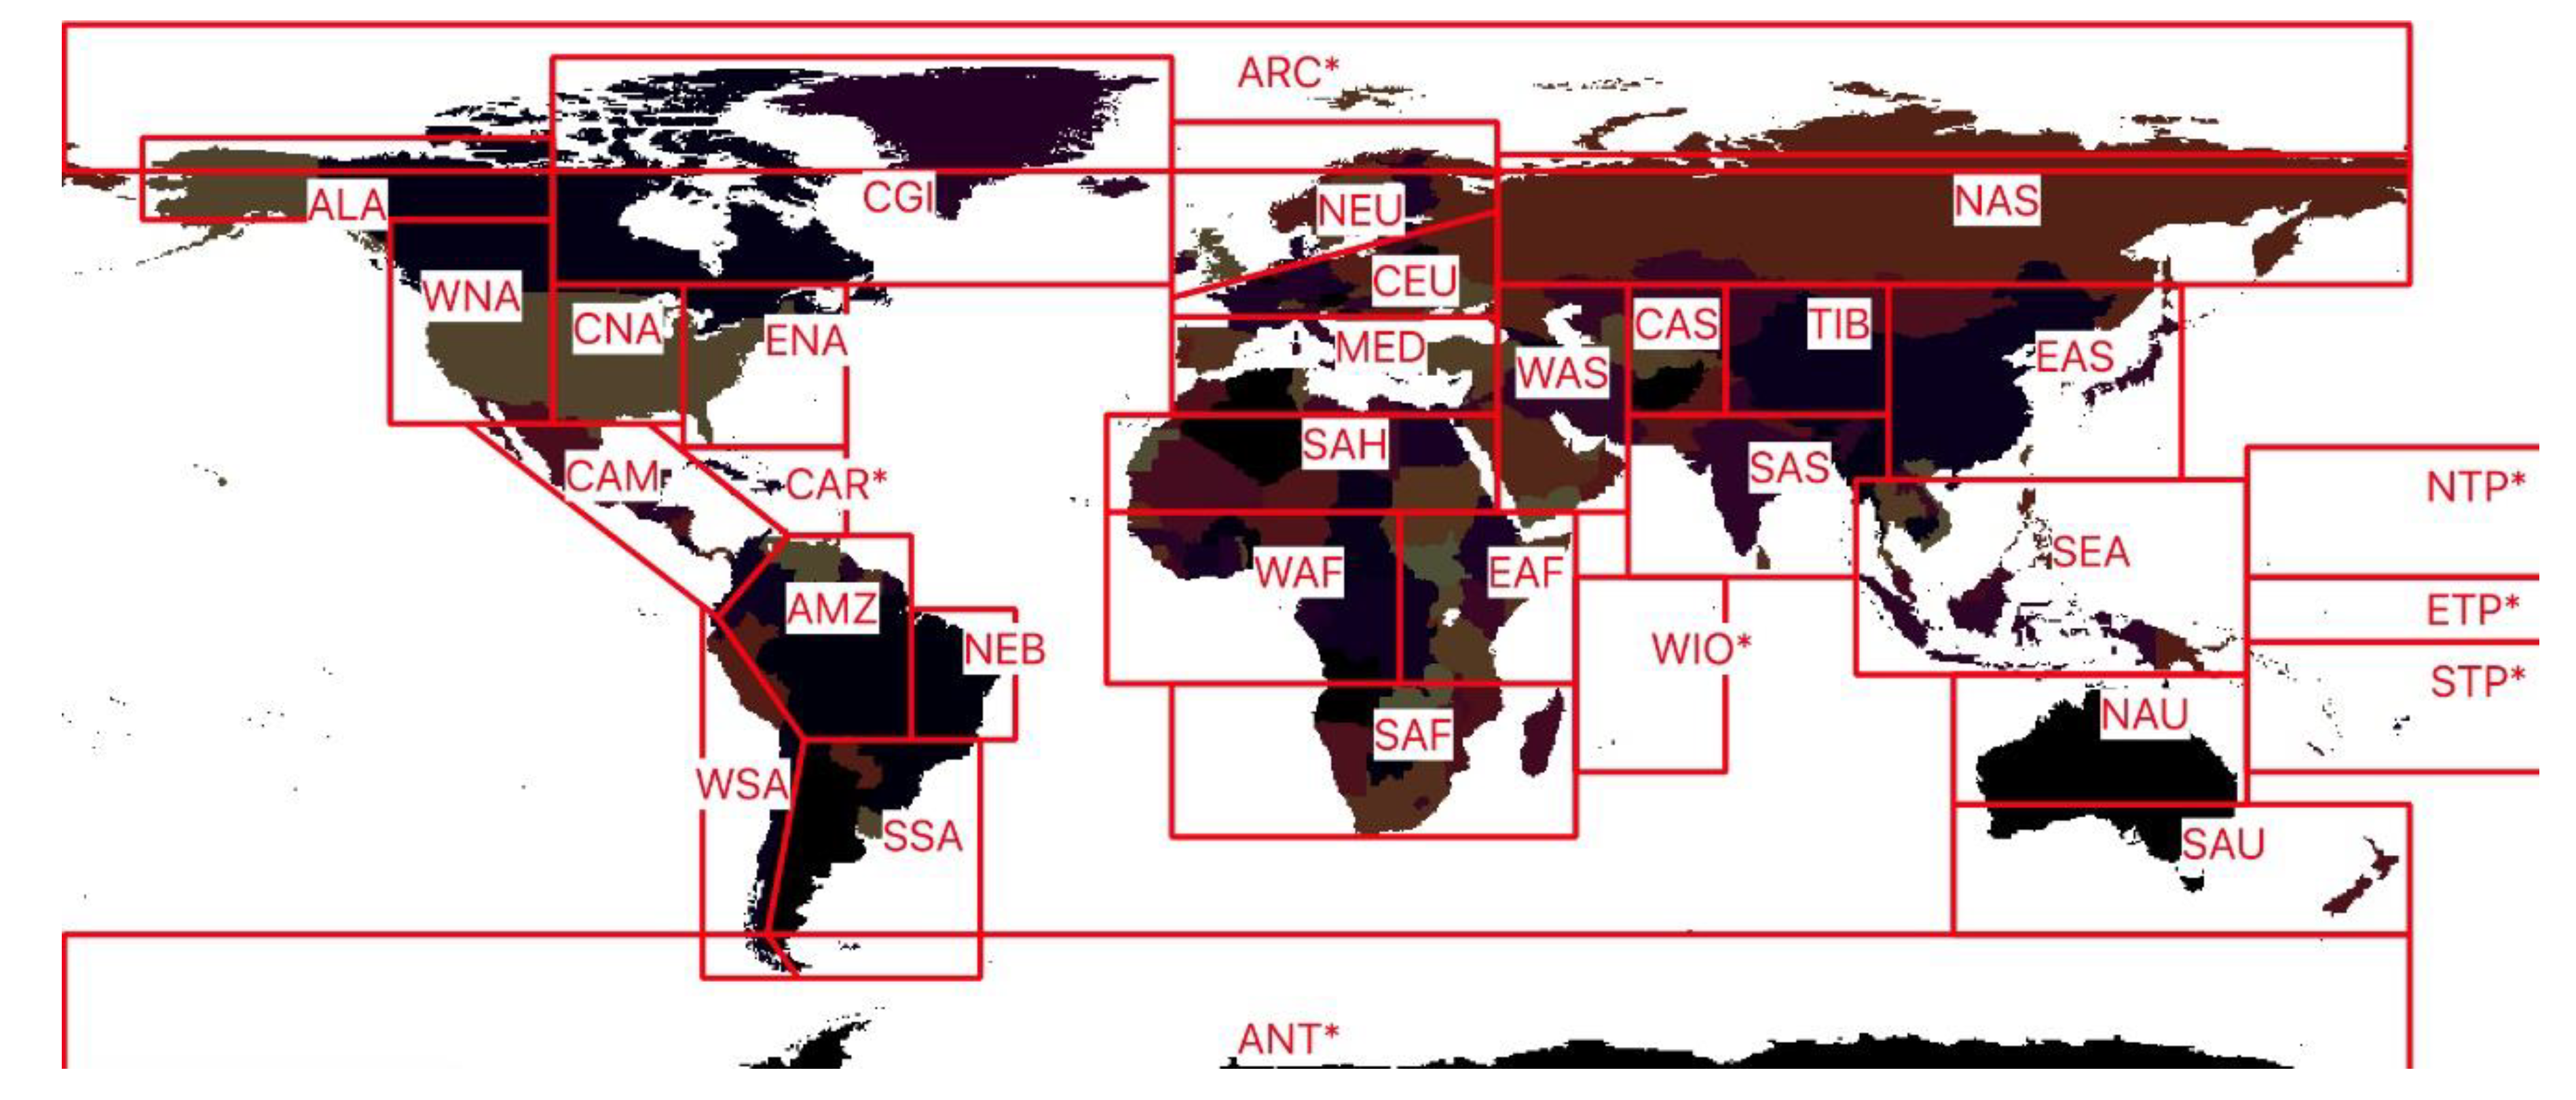
Appendix A. IPCC Macro Regions

| Abbreviation | Name |
|---|---|
| ARC | Arctic Ocean, islands, and coasts |
| CGI | Canadian Artic Islands, Greenland, Iceland |
| ALA | Alaska and North West Canada |
| WNA | Western North America |
| CAN | Central North America |
| ENA | Eastern North America |
| NEU | Northern Europe |
| CEU | Central Europe |
| MED | Mediterranean |
| WAS | Western Asia |
| CAS | Central Asia |
| NAS | Northern Asia |
| TIB | Tibetan Plateau |
| EAS | Eastern Asia |
| SAH | Sahara |
| WAF | West Africa |
| EAF | East Africa |
| SAF | Southern Africa |
| CAM | Central America and Mexico |
| CAR | Caribbean, small islands |
| AMZ | Amazon |
| WSA | West Coast South America |
| SSA | Southern South America |
| NEB | North Eastern Brazil |
| SAS | South Asia |
| SEA | South East Asia |
| NAU | Northern Australia |
| SAU | Southern Australia and New Zealand |
Appendix B. Clustering of FAO-EAS Land Use Classes
| ESA Class | Grouped Class |
|---|---|
| 10 Cropland, rainfed | 10 Cropland and potential croplands |
| 20 Cropland irrigated or post flooding | 20 Alluvial and coastal plains |
| 30 Mosaic croplands > 50%, natural vegetation | 10 Cropland and potential croplands |
| 40 Mosaic natural vegetation > 50%, cropland | 10 Cropland and potential croplands |
| 50 Tree cover, broadleaved, evergreen | 50 Forest |
| 60 Tree cover, deciduous | 50 Forest |
| 70 Tree cover, needle leaved, evergreen | 50 Forest |
| 80 Tree cover, needle leaved, deciduous | 50 Forest |
| 90 Tree cover, mixed leaf type | 50 Forest |
| 100 Mosaic tree and shrub > 50% | 100 Natural open spaces |
| 110 Herbaceous > 50% | 110 Grass |
| 120 Shrubland | 100 Natural open spaces |
| 130 Grassland | 110 Grass |
| 140 Lichens and mosses | 100 Natural open spaces |
| 150 Sparse vegetation | 100 Natural open spaces |
| 160 Tree cover, flooded, fresh water | 20 Alluvial and coastal plains |
| 170 Tree cover, flooded, saline water | 20 Alluvial and coastal plains |
| 180 Shrubs, flooded | 20 Alluvial and coastal plains |
| 190 Urban areas | 190 Urban |
| 200 Bare areas | 100 Natural open spaces |
| 210 Water bodies | 100 Natural open spaces |
| 220 Permanent snow and ice | 100 Natural open spaces |
References
- Sudmeier-Rieux, K.; Arce-Mojica, T.; Boehmer, H.J.; Doswald, N.; Emerton, L.; Friess, D.A.; Galvin, S.; Hagenlocher, M.; James, H.; Laban, P.; et al. Scientific evidence for ecosystem-based disaster risk reduction. Nat. Sustain. 2021, 4, 803–810. [Google Scholar] [CrossRef]
- Beck, P.S.A.; Goetz, S.; Mack, M.C.; Alexander, H.D.; Jin, Y.; Randerson, J.T.; Loranty, M. The impacts and implications of an intensifying fire regime on Alaskan boreal forest composition and albedo. Glob. Change Biol. 2011, 17, 2853–2866. [Google Scholar] [CrossRef]
- Mietkiewicz, N.; Balch, J.K.; Schoennagel, T.; Leyk, S.; Denis, L.A.S.; Bradley, B.A. In the Line of Fire: Consequences of Human-Ignited Wildfires to Homes in the U.S. (1992–2015). Fire 2020, 3, 50. [Google Scholar] [CrossRef]
- Sabatini, F.M.; Burrascano, S.; Keeton, W.S.; Levers, C.; Lindner, M.; Pötzschner, F.; Verkerk, P.J.; Bauhus, J.; Buchwald, E.; Chaskovsky, O.; et al. Where are Europe’s last primary forests? Divers. Distrib. 2018, 24, 1426–1439. [Google Scholar] [CrossRef] [Green Version]
- Meier, R.; Schwaab, J.; Seneviratne, S.I.; Sprenger, M.; Lewis, E.; Davin, E.L. Empirical estimate of forestation-induced precipitation changes in Europe. Nat. Geosci. 2021, 14, 473–478. [Google Scholar] [CrossRef]
- FAO. Global Forest Resources Assessment 2020; Key Findings; Food and Agriculture Organization of the United Nations: Rome, Italy, 2020. [Google Scholar]
- Liu, H.; Peng, G.; Wang, J.; Clinton, N.; Yuqi, B.; Shunlin, L. Annual dynamics of global land cover and its long-term changes from 1982 to 2015. East Syst. Sci. Data 2020, 12, 1217–1243. [Google Scholar] [CrossRef]
- Wang, J.; Chagnon, F.J.F.; Williams, E.R.; Betts, A.; Renno, N.O.; Machado, L.; Bisht, G.; Knox, R.; Bras, R.L. Impact of deforestation in the Amazon basin on cloud climatology. Proc. Natl. Acad. Sci. USA 2009, 106, 3670–3674. [Google Scholar] [CrossRef] [PubMed] [Green Version]
- Nair, U.S.; Ray, D.K.; Lawton, R.O.; Welch, R.M.; Pielke, R.A.S.; Calvo-Alvarado, J.; Bruijnzeel, L.A.; Scatena, F.N.; Hamilton, L.S. The impact of deforestation on orographic cloud formation in a complex tropical environment. In Tropical Montane Cloud Forests: Science for Conservation and Management; International Hydrology Series; Cambridge University Press (CUP): Cambridge, UK, 2011; pp. 538–548. [Google Scholar] [CrossRef] [Green Version]
- UNCCD. The Great Green Wall Implementation Status and Way Ahead to 2030; Climekos gGmbH: Bonn, Germany, 2020. [Google Scholar]
- European Forest Fire Information System (EFFIS). 2020. Available online: https://forest.eea.europa.eu/countries/regions/eu (accessed on 29 September 2020).
- Population Division, Department of Economic and Social Affairs, United Nations. World Urbanization Prospects: The 2018 Revision (ST/ESA/SER.A/420); United Nations: New York, NY, USA, 2019. [Google Scholar]
- Schatz, J.; Kucharik, C. Urban climate effects on extreme temperatures in Madison, Wisconsin, USA. Environ. Res. Lett. 2015, 10, 094024. [Google Scholar] [CrossRef] [Green Version]
- Lin, M.; Horowitz, L.W.; Xie, Y.; Paulot, F.; Malyshev, S.; Shevliakova, E.; Finco, A.; Gerosa, G.; Kubistin, D.; Pilegaard, K. Vegetation feedbacks during drought exacerbate ozone air pollution extremes in Europe. Nat. Clim. Change 2020, 10, 444–451. [Google Scholar] [CrossRef]
- Winbourne, J.B.; Jones, T.S.; Garvey, S.M.; Harrison, J.L.; Wang, L.; Li, D.; Templer, P.H.; Hutyra, L.R. Tree Transpiration and Urban Temperatures: Current Understanding, Implications, and Future Research Directions. Bioscience 2020, 70, 576–588. [Google Scholar] [CrossRef]
- Corbane, C.; Pesaresi, M.; Politis, P.; Syrris, V.; Florczyk, A.J.; Soille, P.; Maffenini, L.; Burger, A.; Vasilev, V.; Rodriguez, D.; et al. Big earth data analytics on Sentinel-1 and Landsat imagery in support to global human settlements mapping. Big Earth Data 2017, 1, 118–144. [Google Scholar] [CrossRef] [Green Version]
- Dijkstra, L.; Poelman, H. A Harmonised Definition of Cities and Rural Areas: The New Degree of Urbanisation. Working Papers. European Commission. 2014. Available online: http://ec.europa.eu/regional_policy/en/information/publications/working-papers/2014/a-harmonised-definition-of-cities-and-rural-areas-the-new-degree-of-urbanisation (accessed on 5 August 2020).
- ESA. Land Cover 2010. 2010. Available online: https://www.esa.int/ESA_Multimedia/Images/2014/10/Land_cover_2010 (accessed on 25 September 2020).
- Pachauri, R.K.; Allen, M.R.; Barros, V.R.; Broome, J.; Cramer, W.; Christ, R.; Church, J.A.; Clarke, L.; Dahe, Q.; Dasgupta, P.; et al. Climate Change 2014: Synthesis Report. Contribution of Working Groups I, II and III to the Fifth Assessment Report of the Intergovernmental Panel on Climate Change; Pachauri, R.K., Meyer, L.A., Eds.; IPCC: Geneva, Switzerland, 2014; 151p, ISBN 978-92-9169-143-2. [Google Scholar]
- Radeloff, V.C.; Helmers, D.P.; Kramer, H.U.; Mockrin, M.H.; Alexandre, P.M.; Bar-Massada, A.; Butsic, V.; Hawbaker, T.J.; Martinuzzi, S.; Syphard, A.D.; et al. Rapid growth of the US wildland-urban interface raises wildfire risk. Proc. Natl. Acad. Sci. USA 2018, 115, 3314–3319. [Google Scholar] [CrossRef] [PubMed] [Green Version]
- Olsson, L.H.; Barbosa, S.; Bhadwal, A.; Cowie, K.; Delusca, D.; Flores-Renteria, K.; Hermans, E.; Jobbagy, W.; Kurz, D.; Li, D.J.; et al. Land Degradation. In Climate Change and Land: An IPCC Special Report on Climate Change, Desertification, Land Degradation, Sustainable Land Management, Food Security, and Greenhouse Gas Fluxes in Terrestrial Ecosystems; Shukla, P.R., Skea, J., Buendia, E.C., Masson-Delmotte, V., Pörtner, H.-O., Roberts, D.C., Zhai, P., Slade, R., Connors, S., van Diemen, R., et al., Eds.; United Nations IPCC: Geneva, Switzerland, 2019; in press. [Google Scholar]
- de Jager, A.L.; Pelaez, S. Assets at Risk and Potential Impacts, Environment and Ecosystem Services. Science for Disaster Risk Management 2020, Acting Today Protecting Tomorrow; Publication Office of the European Union: Luxembourg, 2021; Chapter 4; pp. 436–470. [Google Scholar]


| Land Use Type | Drought Impact | Droughts Relief |
|---|---|---|
| Alluvial and coastal plains | Subsidence, cracking | High groundwater level, cooling through wind |
| Cropland and Potential cropland | Failing harvest, groundwater depletion through irrigation | Access to crops close to the city, cooling of area |
| Forest | Ignition of wildfire subsequent air pollution, dying of wild species, trees might die. | Strong cooling, water reserve in groundwater, relaxation, some food (nuts, small animals, fish in creeks) |
| Grass | Ignition of wildfire subsequent air pollution. Grass recovers, but not all species. | Cooling through wind, access to meat, milk close to the city |
| Natural open spaces | Ignition of wildfire, dying of wild species. | Cooling through wind, relaxation, some food (berries, small wildlife) |
| Urban | Extreme temperatures, additional air pollution, groundwater depletion, surface water and reservoir depletion. | Shelter for humans and the animals and plants accompanying them. |
| Land Use Practice | Drought Impact | Mediation Method |
|---|---|---|
| Deforestation | Less shadow, less cloud formation, less rainwater percolation to groundwater reservoirs, higher average temperatures | Reforestation, rewilding, silvopasture, agroforestry, restoration of small landscape elements. Disincentivize relationship deforestation and wildfires, practices of forest clearing though fire in the dry season or during a drought. |
| Reservoir construction | Sediment trapped leading to beach erosion downstream, evaporation of reservoir surface water, less fertilisation of flood plains, fish migration blockage, ecosystem disturbance, loss of fertile land. | Smaller reservoirs, fish access points, sediment outlets, cleaning of reservoirs, storage of rainwater in groundwater bodies instead of reservoirs. |
| Road construction, urbanization | Groundwater lowering leading to soil subsidence and less groundwater, Increased temperature (black colour of tarmac) heat island effect, Temporary flooding after heavy rainfall (also related to the subsidence of the soil), no storage of the rainwater in the soil, Additional tree cutting/limited tree planting to save on maintenance costs | Creation of additional holes/lakes in the landscape to collect excess rainwater and resupply to groundwater body. Separation of sewage systems to collect rainwater and resupply groundwater bodies. Systematic tree planting along roads, on south face of buildings to provide shadow. Forbidding of pumping after completion of construction. Concentrate on high-rise buildings. Limitation of road construction, favour alternatives for mobility. Grass roofs or white roofs. Construct on soils suitable for construction (protect fertile soils from construction). Allow for wind alleys throughout the urban area. Tax tree covered soils less than covered soils in the urban area. |
| Irrigation | Loss of water through evapotranspiration, full failure (no harvest at all) during severe drought, groundwater depletion, dependency of glaciers (not sustainable with current lack of climate policy implementation) | Change to crop types needing less water, move to silvopasture and agroforestry, pricing water for agricultural use, desalination of seawater using solar/wind energy |
| River/streams canalization | Low flow during summer/dry season, ecosystem degradation, loss of peat lands, reduced capacity to store water in the land | Allowing rivers/streams to meander again, compensate landowners losing land, restore peat lands and fauna belonging to peat lands (to curb, e.g., mosquitoes) |
| Industrial agricultural practices | Reduction of soil organic matter content leading to less soil moisture, compaction of soils due to heavy equipment, lowering of groundwater table to allow for heavy equipment, additional evapotranspiration, and soil erosion due to large size of fields, wind erosion | Stimulate agricultural practices that favour soil quality or tax pesticides. Forbid use of heavy equipment on susceptible soil types, forbid field sizes above a certain threshold, compensate loss of land due to restoration of bushes, hedges, and parcel edge vegetation |
| Wildfires | Increased temperature and wind, heating up the landscape, soil erosion due to lack of vegetation cover during heavy rains, reduced capacity of the soil to buffer rainwater, loss of human and wildlife, ecosystem services loss | Reforestation, rewilding, forestation with tree types less susceptible to fire (broadleaves), less focus on (wood) production, more on quality. Landscape variation, large mammal reintroduction (to keep the landscape open) Check on relation deforestation and wildfires, disincentive deforestation (animal fodder production in former Amazon forest plots) |
Publisher’s Note: MDPI stays neutral with regard to jurisdictional claims in published maps and institutional affiliations. |
© 2022 by the authors. Licensee MDPI, Basel, Switzerland. This article is an open access article distributed under the terms and conditions of the Creative Commons Attribution (CC BY) license (https://creativecommons.org/licenses/by/4.0/).
Share and Cite
de Jager, A.; Corbane, C.; Szabo, F. Recent Developments in Some Long-Term Drought Drivers. Climate 2022, 10, 31. https://doi.org/10.3390/cli10030031
de Jager A, Corbane C, Szabo F. Recent Developments in Some Long-Term Drought Drivers. Climate. 2022; 10(3):31. https://doi.org/10.3390/cli10030031
Chicago/Turabian Stylede Jager, Alfred, Christina Corbane, and Filip Szabo. 2022. "Recent Developments in Some Long-Term Drought Drivers" Climate 10, no. 3: 31. https://doi.org/10.3390/cli10030031