1. Introduction
The rise in extreme temperatures, heat waves and global warming are increasingly alarming phenomena that compromise the safety of some vulnerable population classes. Indeed, relevant studies demonstrated the correlation between mortality and extreme temperatures [
1,
2,
3]. In this worrying context, the Urban Heat Island (UHI) phenomenon is becoming a critical problem, which further increases the risks associated with high temperatures in cities. UHI consists of the presence of higher ambient temperatures in urban districts compared with the surrounding rural areas [
4]. Consequently, in large and dense cities, the local modification of the urban microclimate in combination with heat waves and global warming can affect comfort and liveability. In such cities, the demand of cooling energy consumption during summertime increases with severe consequences on economic and environmental sustainability [
5,
6]. Several authors such as Li [
7] and Giridharan et al. [
8] demonstrated (through review articles) how summer cooling energy can be seriously affected by UHII (in some cases the energy required can double). Successively, the research of Zinzi et al. [
9] confirmed the impressive cooling energy demand required during the combined impact of heat waves and UHI. Beyond energy consumption, the studies of Lowe [
10] and Baccini [
11] discussed the increase in mortality and health reduction linked to heat waves and the increase in temperature. In addition, the critical interaction between heat waves and UHII is investigated by He et al. [
12], whose results prove that it is imperative to facilitate an accurate and effective response to urban heat problems.
To this aim, the study of this phenomenon and comparative analysis among cities is of basic importance to define effective mitigation strategies. In this context, effective mitigation can benefit from technological development. Several researchers investigated different cooling techniques, exploiting reflective materials, heat storage and harvesting materials according to Qi et al. [
13]. Other investigations designed permeable pavements with capillary columns to enhance evaporation, as in the study of Liu et al. [
14]. Recently, cool and super cool materials have been investigated by Santamouris et al. [
15] to provide a useful technological solution. Beyond the technological support of novel performing material, Chatterjee et al. compared different approaches and demonstrated the potential of a combination of cool pavement, cool roofs and increasing green areas [
16]. On the other hand, even if it is proven that such technological solutions could be effective, the urban policy plays an important role in the effective application of these mitigation strategies. Degirmenci et al. proposed a recent review to investigate the complex synergy between policy and technology and relative open research questions [
17].
The first step for achieving a useful mitigation strategy in a city concern the quantification of the UHII phenomenon. The traditional approaches to evaluating the Urban Heat Island Intensity (UHII) can involve many weather measuring stations and both complex and time-consuming analyses [
18]. Consequently, a large number of resources, time and several measuring stations are needed to achieve a spatial distribution of the UHII in a city [
19]. Alternatively, using remote sensing (RS) data and techniques can be applied to achieve large scale investigations [
20]. On the other hand, such RS approaches neglect some important parameters such as the anthropogenic heat and most of the effects related to the city’s geometry.
Because of such complexity in the UHII investigation, few studies are present in related literature dedicated to the intensity maps of Italian cities. Some examples concern the case Trieste for which remote sensing approaches are used [
21] or the case of Perugia investigated with a novel mobile monitoring system [
22]. On the contrary, to the best of our knowledge, there are no studies to achieve an intensity map of the UHII in southern Italy and in particular in the Puglia region and Bari (the regional capital). Even if such spatial investigation is missing, recent studies demonstrate that the heat island effect may be significant and particularly dangerous to health in southern Italy in combination with the warm local climate [
23].
With the aim of obtaining intensity maps of several urban districts, recent investigations calibrated a new index
(°C) to forecast the absolute maximum UHII phenomenon in the summer period by exploiting a holistic multicriteria approach and open-source data [
18]. The index considers eleven criteria, including meteorological variables such as synoptic weather and climate conditions, characteristics of the city such as greenery and albedo, anthropogenic heat related to population density, and urban layout.
Such an approach provides a great support for technicians of city government and for civil protection to analyze the territory and define mitigation strategies [
24]. Indeed, the index
can effectively evaluate the spatial distribution of the UHII in a city and allows one to produce intensity maps of the phenomenon [
25].
This paper proposes different strategies to mitigate the UHI phenomenon in the central district of Bari, Puglia (Italy) by exploiting the recent multi-criteria index-based approach.
Firstly, the intensity map of the 17 urban districts of Bari is produced by applying the index. Secondly, the results are compared with the ones of five other major European cities, for a total of 344 investigated urban districts.
The proposed approach required a large data acquisition to compile the database (meteorological variables, anthropogenic heat, city canyons and characteristics of the city in terms of albedo and greenery) and to obtain the index. Moreover, to obtain the characteristics of the city, for every one of the 344 investigated districts, albedo and greenery are extracted using a specific image analysis [
18]. Such image analysis breaks down the satellite image to individuate urban district materials (asphalt, water, white plaster, red brick, etc.) and the presence of greenery (the analysis is specifically calibrated for the application of the
index).
Finally, the proposed work allowed one to point out some virtuous examples of UHII mitigation in major European cities. Moreover, the comparison between the districts of Bari and other European cities allows for emphasizing the positive and negative aspects of the southern city. The performed analysis allowed one to define useful mitigation strategies to contrast UHI in one of the central districts of Bari (the “Murattiano” district), and to investigate the effect of a greater presence of urban green areas and a higher average albedo in the city.
The novelty of the proposed research is threefold: For the first time, the UHII have been calculated for the whole city of Bari to understand the severity of the phenomenon. Secondly, a useful comparison allows defining mitigation strategies in the central district of Bari. Finally, the heat stress and different scenarios (in the city of Bari) are evaluated by combining the UHI and the summer weather data.
2. Methodology
The proposed methodology identifies the maximum values of UHII in every urban district (for the summer period) by exploiting a multi-criteria index
already calibrated and validated in the previous research of Sangiorgio et al. [
18]. By means of this index, the UHII is calculated by considering both the meteorological data of the city and characteristics of the investigated urban districts. The resulting values of the index are the absolute max UHII expressed in °C of the investigated urban districts. Consequently, it is possible to draw up a mapping of the UHI intensity of the cities.
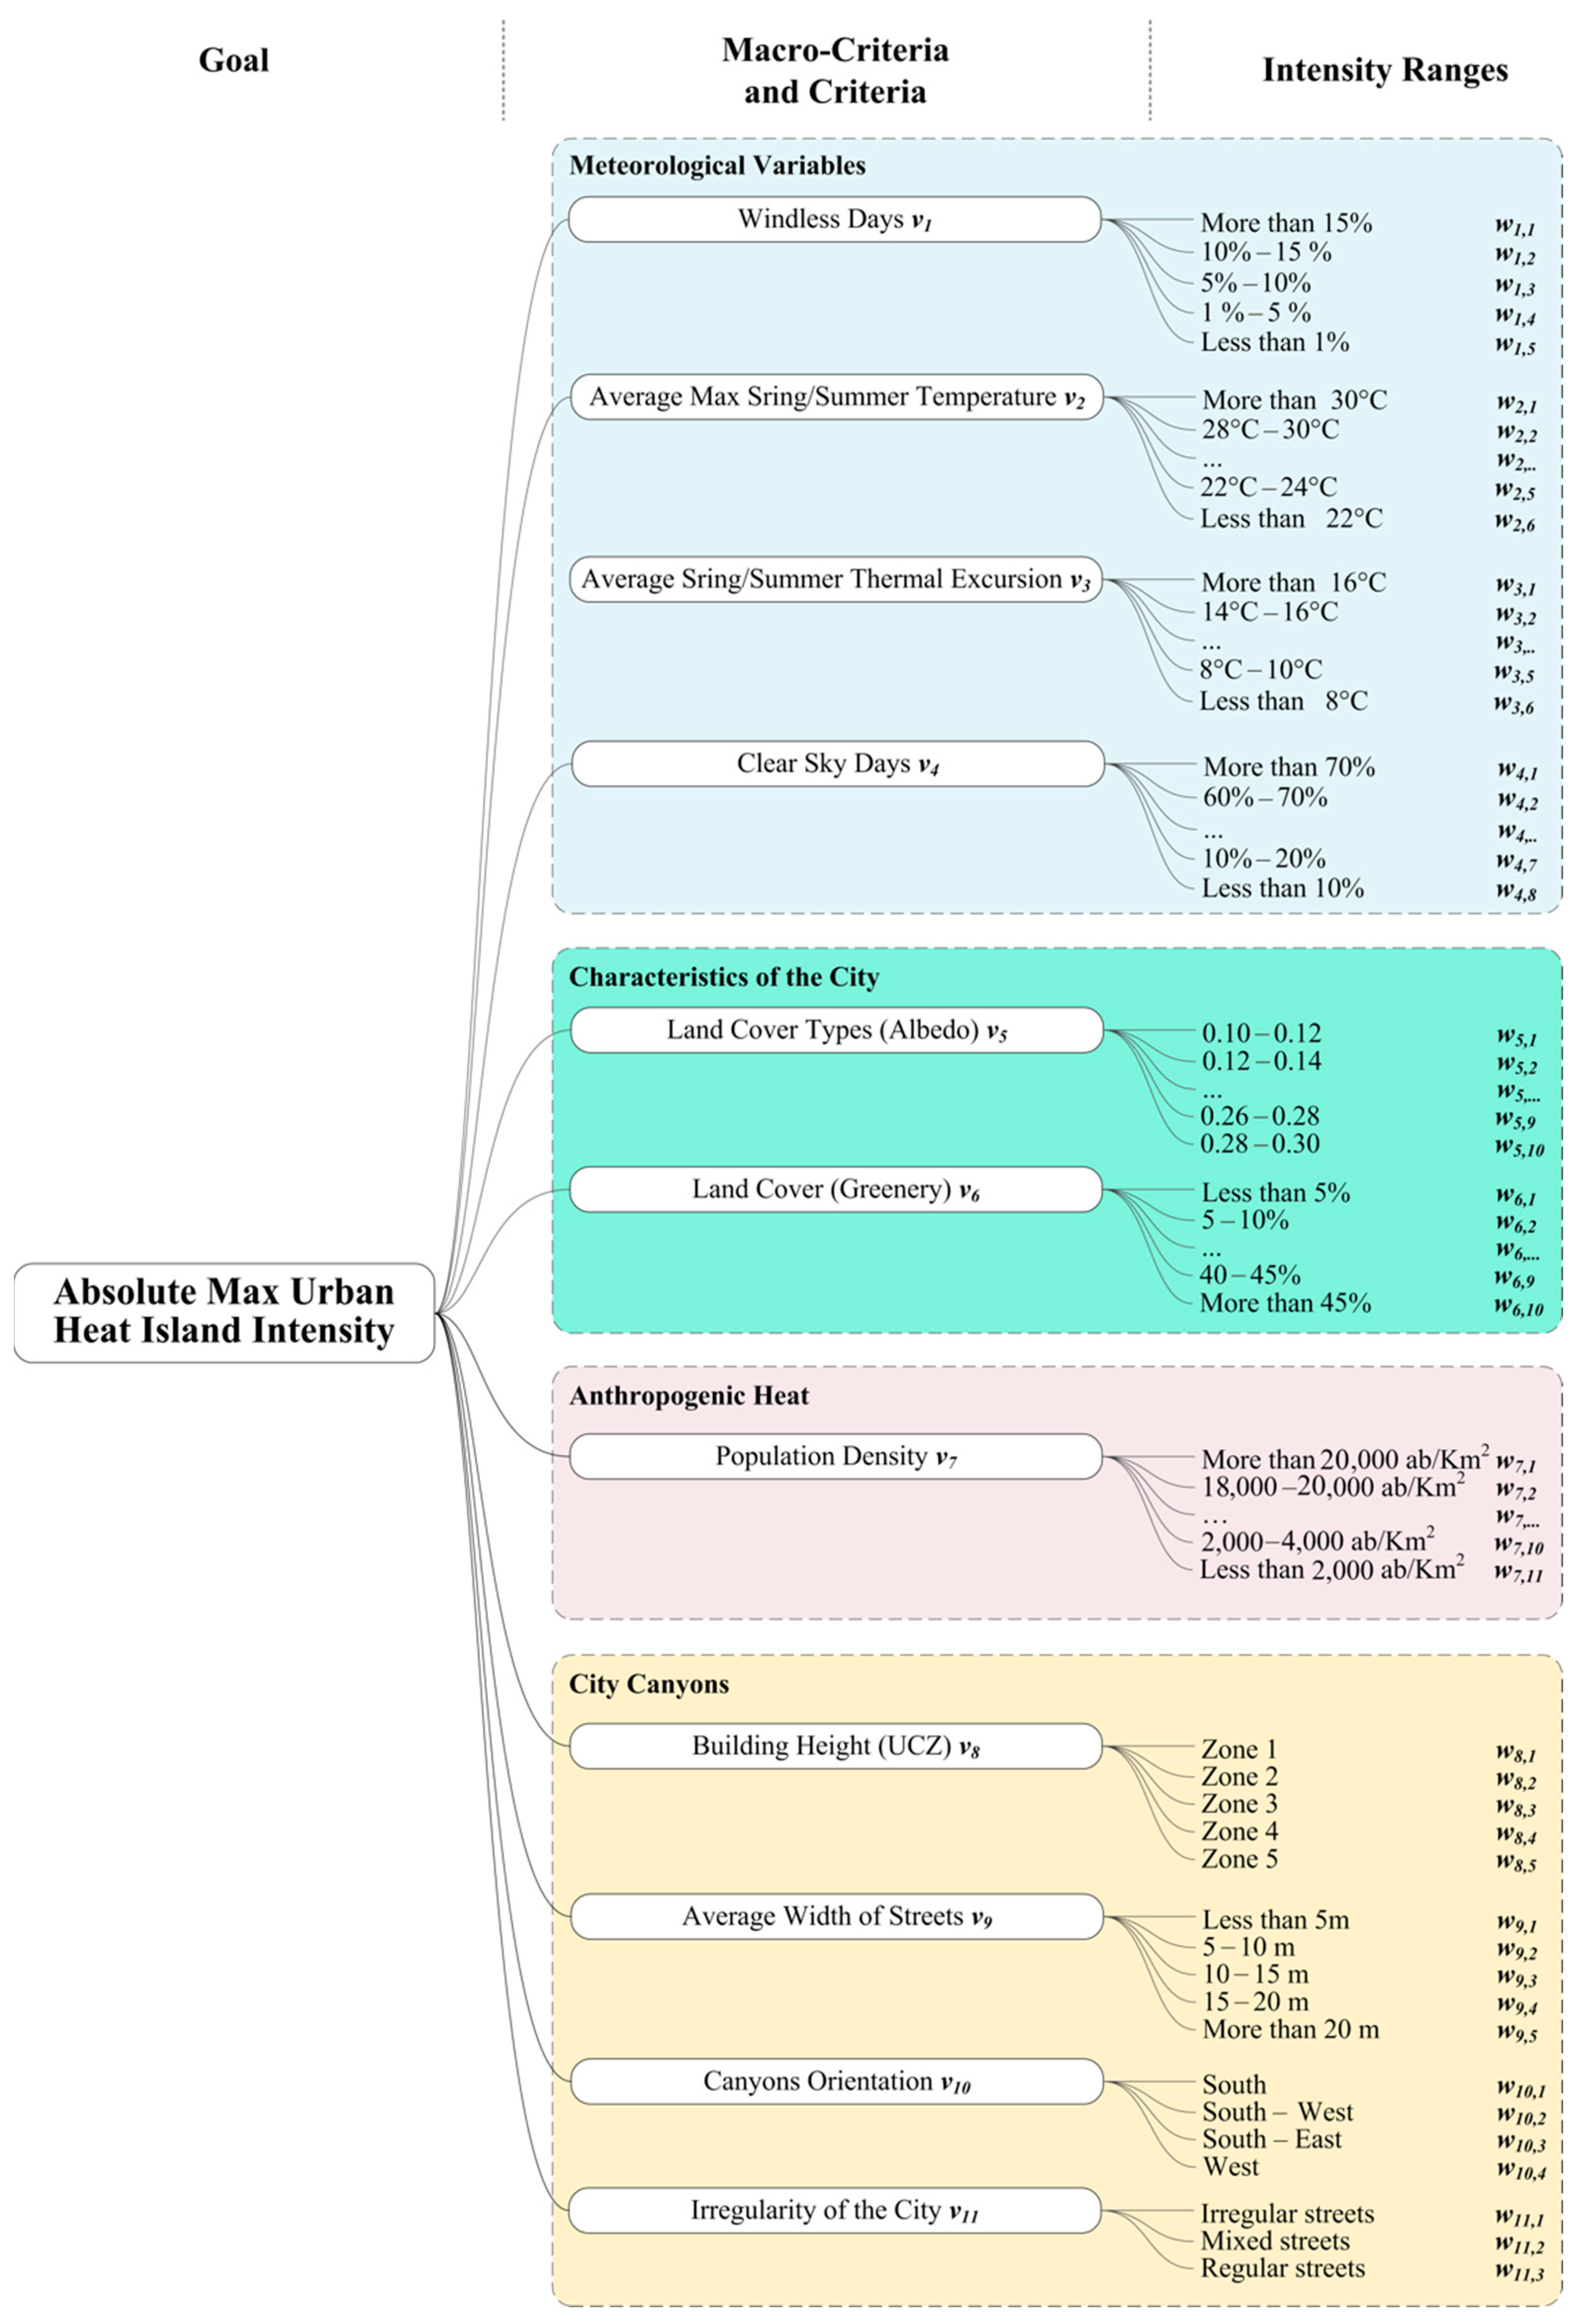
2.1. The Quantitative Index to Evaluate the UHII
The proposed index
is based on eleven criteria
i (with
i = 1, …, 11), which are grouped into four macro-criteria. In order to evaluate the index in the investigated urban districts, for each criterion, a set of intensity ranges j (with
j = 1, …,
ni) can be assigned on the basis of the acquired data (meteorological data and district characteristics).
Figure 1 shows the hierarchical structure of the four macro-criteria, eleven criteria, and related intensity ranges.
It is worth noting that the selection of the criteria and the calibration of the index have been achieved in the previous research of Sangiorgio et al. [
18]. Indeed, the proposed criteria have been selected from a thorough review of the literature. In addition, to verify that all selected criteria should be used, the linear correlation among criteria and the absolute max UHII is evaluated (exploiting data surveyed in 41 urban districts of the European continent). Moreover, the index
has been calibrated by employing four synergistically related techniques: (1) a Multi Criteria Analysis to structure the problem and define the index; (2) a large data acquisition process to obtain an exhaustive dataset; (3) an optimization procedure to calibrate the index based on a large data acquisition; (4) two validation tests involving a Jackknife approach to identify the stability of the solution and the Absolute Error of the proposed model.
The First macro-criterion regards the meteorological variables in which the first four criteria are grouped:
- (1)
Windless Days consider the percentage of the total days of the summer period when the average wind speed is below 5 km/h. Five intensity are defined (n1 = 5): (i) less than 1%, (ii) 1–5%, (iii) 5–10%, (iv) 10–15%, (v) and more than 15%.
- (2)
Average Max Summer Temperature is evaluated in six intensity ranges (n2 = 6): (i) more than 30 °C, (ii) 28–30 °C, (iii) 26–28 °C, (iv) 24–26 °C, (v) 22–24 °C, and (vi) less than 22 °C.
- (3)
Average Summer Thermal Excursion evaluates (for every day) the average of the difference between maximum daily temperatures and minimum daily temperatures in the summer period. It includes six ranges (n3 = 6): (i) more than 16 °C, (ii) 14–16 °C, (iii) 12–14 °C, (iv) 10–12 °C, (v) 8–10 °C, and (vi) less than 8 °C.
- (4)
Clear sky days contemplate the possible occurrence of the ideal “no cloud” condition (1 or 2 Okta). The intensity ranges are expressed in percentage considering the number of days with “no cloud” condition with respect to the total days of the considered summer period (n4 = 8): varying from less than 10%, and more than 70%.
The second macro-criterion consider the characteristics of the city (Albedo and Greenery):
- (5)
Land Cover Types (Albedo) evaluates the average of city albedo through an image analysis of satellite photos. Ten intensity ranges (n5 = 10) are defined, ranging between 0.10 and 0.30.
- (6)
Land Cover (Greenery) takes into account the percentage of green areas in the city (n6 = 10): from less than 5% to more than 45%, with differences of 5% between two consecutive ranges.
The third macro-criterion is the Anthropogenic Heat including a single criterion:
- (7)
Population Density evaluates the number of inhabitants per square kilometer in eleven ranges (n7 = 11) from less than 2000 ab/Km2 to more than 20,000 ab/Km2.
The final macro-criterion takes the effect of city canyons into account by exploiting four criteria:
- (8)
Buildings’ Heights is defined by following the five ranges in accordance with the definition of Oke reported in the following [
26] (
n8 = 5): class 1, intensely developed high-rise building; class 2, intensely developed 2–5 story building; class 3, highly developed dose set houses; class 4, highly developed low building; class 5, medium developed 1 or 2 story houses.
- (9)
Width of street is divided in five ranges (n9 = 5), from less than 5 m to more than 20 m.
- (10)
Canyons’ orientation considers, with a qualitative analysis, the orientation of the canyon of the urban districts in four intensity ranges (n10 = 4): South; south-west; south-east and east.
- (11)
Irregularity of the city evaluate if the district is irregular, mixed, or regular in the street arrangement, exploiting three qualitative intensity ranges (n11 = 3).
The index can be calculated following the Equation (1), which returns the forecasting of the maximum UHI intensity in the district. In particular, it is necessary to acquire the data of the districts under investigation related to all the 11 criteria (and consequently identify the intensity ranges) to apply the equation and calculate the index.
where
vi and
wij are tabulated weights (
Table 1) associated to the criterion
i and to the intensity ranges
j, respectively.
Table 1 shows the relation between every single intensity range and the associate weights
wij [
18].
To sum up, for every urban district, the procedure consists of data acquisition, identification of intensity ranges, identification of the associated weights
wij through
Table 1, and application of Equation (1).
2.2. Data Acquisition
The data acquisition includes both quantitative and qualitative information. Quantitative information can be extracted from existing databases and standard fixed meteorological stations and involves
Meteorological Variables,
Anthropogenic Heat and
Clear Sky Days. In general, meteorological variables are acquired by using TuTiempo database [
27], Copernicus data and Weatherspark [
28]. The anthropogenic heat exploits Eurostat (
https://ec.europa.eu/eurostat accessed on 30 March 2022) or local web-site when integrations are necessary. The remaining necessary data belong to the macro-criterion
City canyon and includes both qualitative and quantitative information. Building height and width of streets are quantitatively obtained from existing maps or geographic information systems (Google map or technical cartography). Canyon orientation and the irregularity of the districts are qualitative deductibles from the existing city maps.
Specifically, in the case of Bari, data are acquired during the summer period of 2021 by means of fixed weather stations. In particular, the used databases are attained from Apulian ARPA’s weather stations located in some sites (Caldarola, CUS) and Tutiempo database [
27]. Moreover, population density is available into the ISTAT survey conducted in 2019 for Bari and its districts. Clear Sky Days criteria is investigated from the Weatherspark databases [
28].
Characteristics of the City in terms of
albedo and
greenery are extracted by image analysis, which breaks down satellite images to individuate urban district materials (asphalt, water, white plaster, red brick, etc.) and the presence of greenery. A more detailed description of such a procedure is proposed in the next subsection (2.3
Albedo and greenery extraction).
2.3. Albedo and Greenery Extraction
This subsection describes in detail the approach used to calculate data albedo and greenery in the investigated urban districts. This analysis is carried out by following four steps:
- (i)
Extraction of the interested area from high-resolution satellite image (e.g., Google Earth [
29]);
- (ii)
Processing and decomposition of the image by identifying different surfaces through an automatic color recognition such as asphalt, water, white plaster or red bricks;
- (iii)
Calculation of greenery by identifying the percentage of vegetation in the district;
- (iv)
Calculation of albedo by using existing tabulated weights to characterize the identified surfaces and by performing a weighted average (based on their extension) among the identified district materials.
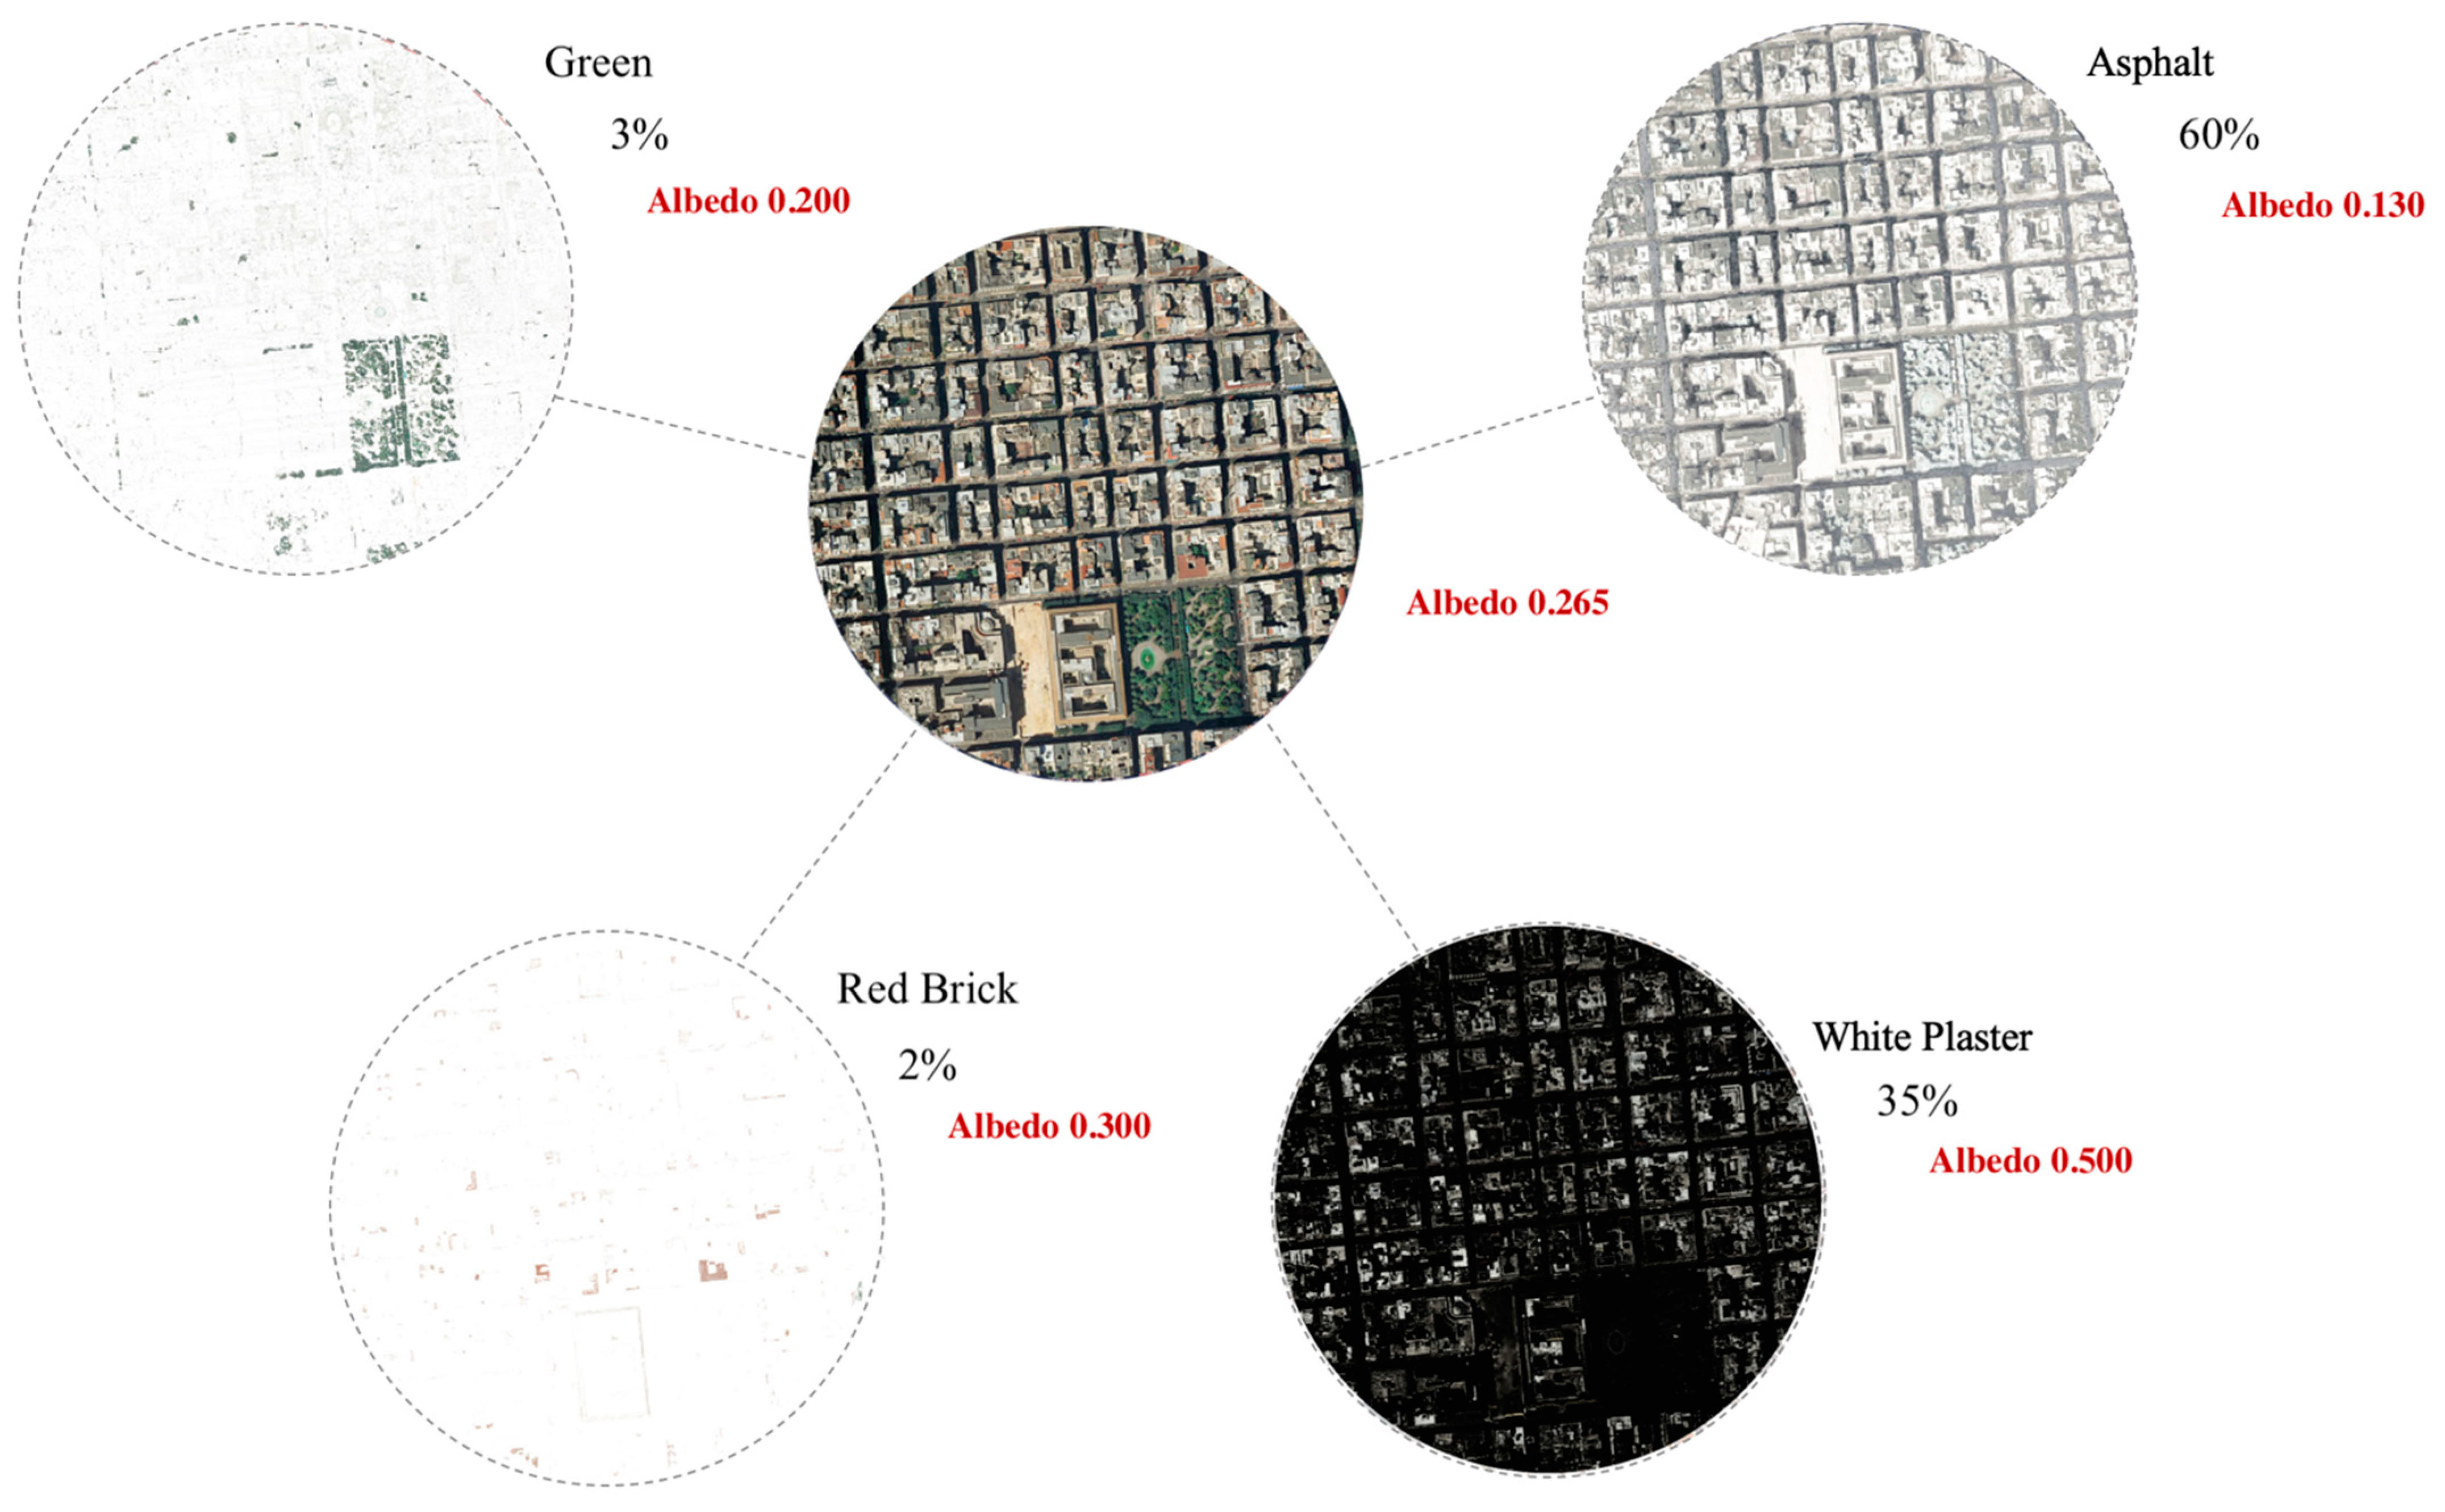
To provide an example,
Figure 2 shows the case of the Bari (Murattiano district) and the percentages of various types of surfaces identified by the image processing. Once the image is decomposed to classify the different surfaces, it is possible to immediately identify the percentage of greenery (3%) and percentage of other materials: Asphalt (60%), plaster (35%), and red brick (2%).
The land cover type (Albedo) of the urban district can be obtained by exploiting the tabulated value of the existing literature [
29,
30] and carrying out a weighted average. The weighted average is based on the percentage of the obtained types of covered urban district materials. In the example of Murattiano, the tabulated values of albedo and the percentage of the identified material are, respectively: Green surface (0.200; 3%), Asphalt (0.130; 60%), white plaster (0.500; 35%) and red brick (0.300; 2%). Consequently, the weighted average of such land cover type (Albedo) is of 0.265 (
Figure 2).
2.4. Mapping
Once the database is complete, the absolute max UHII can be calculated in every investigated district applying Equation (1). The last step of the methodological approach regards the creation of an intensity map for every district of the investigated city through the calculated index and design tools for thematic maps. Specifically, the intensity maps have been created by using CAD tools (i.e., SketchUp© Make 2016 v16.1.1451 and Autodesk© AutoCAD 2020) and Adobe Photoshop© 2020 v21.1.0 starting from the imagery of the “Territorial information system” of the cities.
The intensity map can be useful to identify the districts in worst conditions by showing the magnitude of the phenomenon through a color scale. In addition, useful comparisons can be performed among different cities in order to identify the best mitigation strategy at the district scale.
2.5. The Study Area
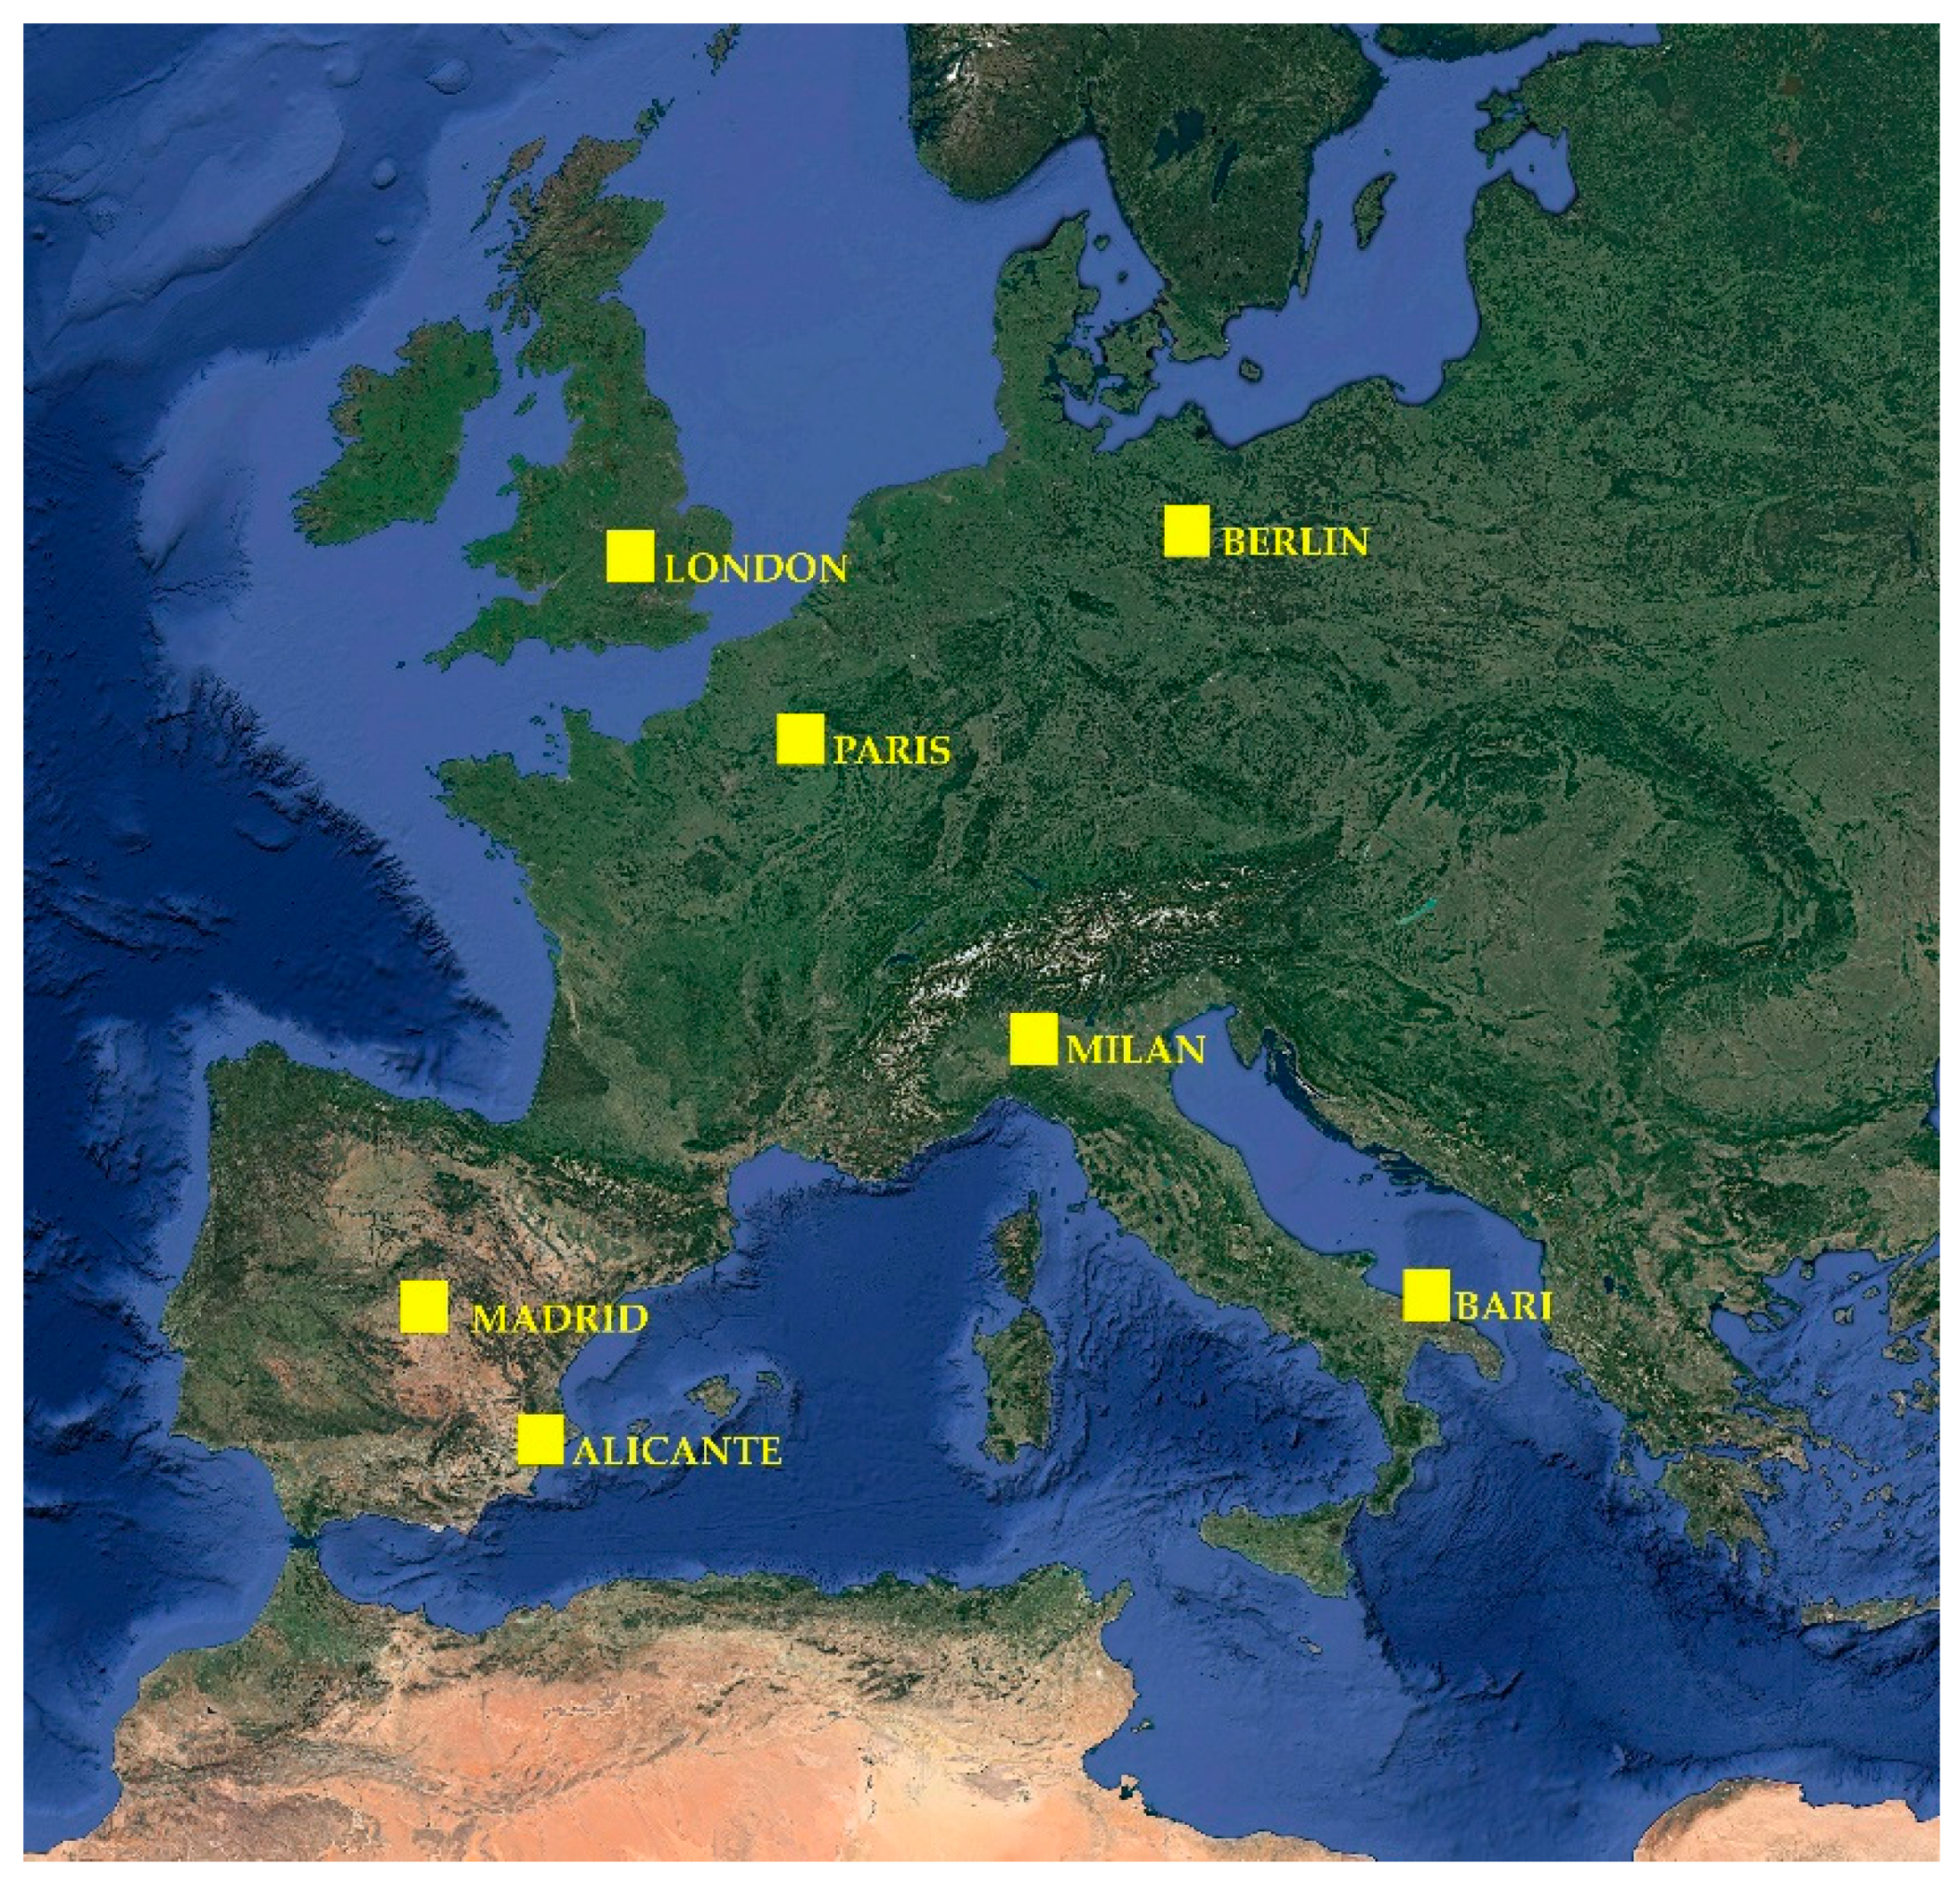
In this paper, the following urban districts and cities are investigated: 17 districts in Bari (Italia); 9 districts in Alicante (Spain); 21 in Madrid (Spain); 80 in Paris (France); 96 in Berlin (Germany); 88 in Milan (Italy) and 33 in London (UK). In these investigated cities, the municipal districts are considered, while the provincial territory has been neglected to consider urban areas only. Alicante has been selected to compare Bari with a city with a similar dimension ad morphological characteristic, while the other major cities are important to identify mitigation strategies effective even for highly populated cities (typically most affected by the phenomenon). This comparison and analysis can be useful for defining mitigation strategies in Bari and enhancing its future development. Moreover, cities from different climatic zones are considered since in related literature it is demonstrated that the cold or warmer climate is not influencing the phenomenon [
31]. On the other hand, some differences are observed for extreme climatic conditions (e.g., arctic), as discussed in [
32]. Indeed, Hamdi et al. [
33] and Cugnon et al. [
34] demonstrated that the UHI is principally correlated to three-dimensional urban geometry, thermal characteristics of impervious surfaces, anthropogenic heat and anthropogenic heat.
More in detail, the investigated cities are described in the following (
Figure 3):
- -
Bari (41°07′31″ N 16°52′00″ E): located on the Adriatic Sea, with a coastline of 42 km in length and essentially flat (altitude 5 m a.s.l.). The city is characterized by a Mediterranean climate. The territory was crossed by rivers in the past; over time those rivers, due to various geological phenomena, dried up, but their bed remained.
- -
Alicante (38°21′00.01″ N 0°29′00″ W): a city in southern Spain, located at the foot of a hill overlooking the Mediterranean Sea within a large bay. The territory is at 3 m o.s.l. It is characterized by a warm semi-arid climate, which is generally hot and dry. The provincial land of Alicante is crossed by some rivers, but they are not in the urban areas of Alicante city.
- -
Berlin (52°31′12″ N 13°24′18″ E): it is sited in north-eastern Germany, in a mainly flat area (34 m o.s.l.) of low-lying marshy woodlands. Berlin is characterized by oceanic climate; the eastern part of the city has a slight continental influence, with an annual rainfall. The summer temperatures are moderate, sometimes hot; while winters are cold but usually not rigorous. Berlin’s major rivers are Spree, which flows into the Havel; many lakes are located in the western and southeastern boroughs formed by the Spree, Havel and Dahme, the largest of which is Lake Müggelsee.
- -
Madrid (40°25′00″ N 3°42′09″ O): located in the central area of the Iberian Peninsula. The urban areas are at 657 m above sea level, with the maximum altitude of approximately 846 m. The climatic context corresponds to the Southern Subplateau, geographically positioned in the Tagus basin. The climate is intermediate between the Mediterranean climate and the cold semi-arid climate.
- -
London (51°30′26″ N 0°7′39″ W): London has a temperate oceanic climate and it is crossed by the Thames.
- -
Paris (48°51′25″ N 2°21′05″ E): placed in the north of France, in the middle of the Parisian basin. The city is crossed by the Seine River. The urban areas are relatively flat, and the lowest altitude is 35 m above sea level. The highest hill is Montmartre with 130 m among external hills. The climate is a temperate oceanic climate (transition climate), as it is far from the coast.
- -
Milan (45°28′01″ N 9°11′24″ E): rests on a carbonate cement soil of fluvio-glacial origin, common to the entire Po Valley. It is characterized by a humid temperate climate with a significant annual temperature range (hot summer and cold winter).
3. The Case of Bari
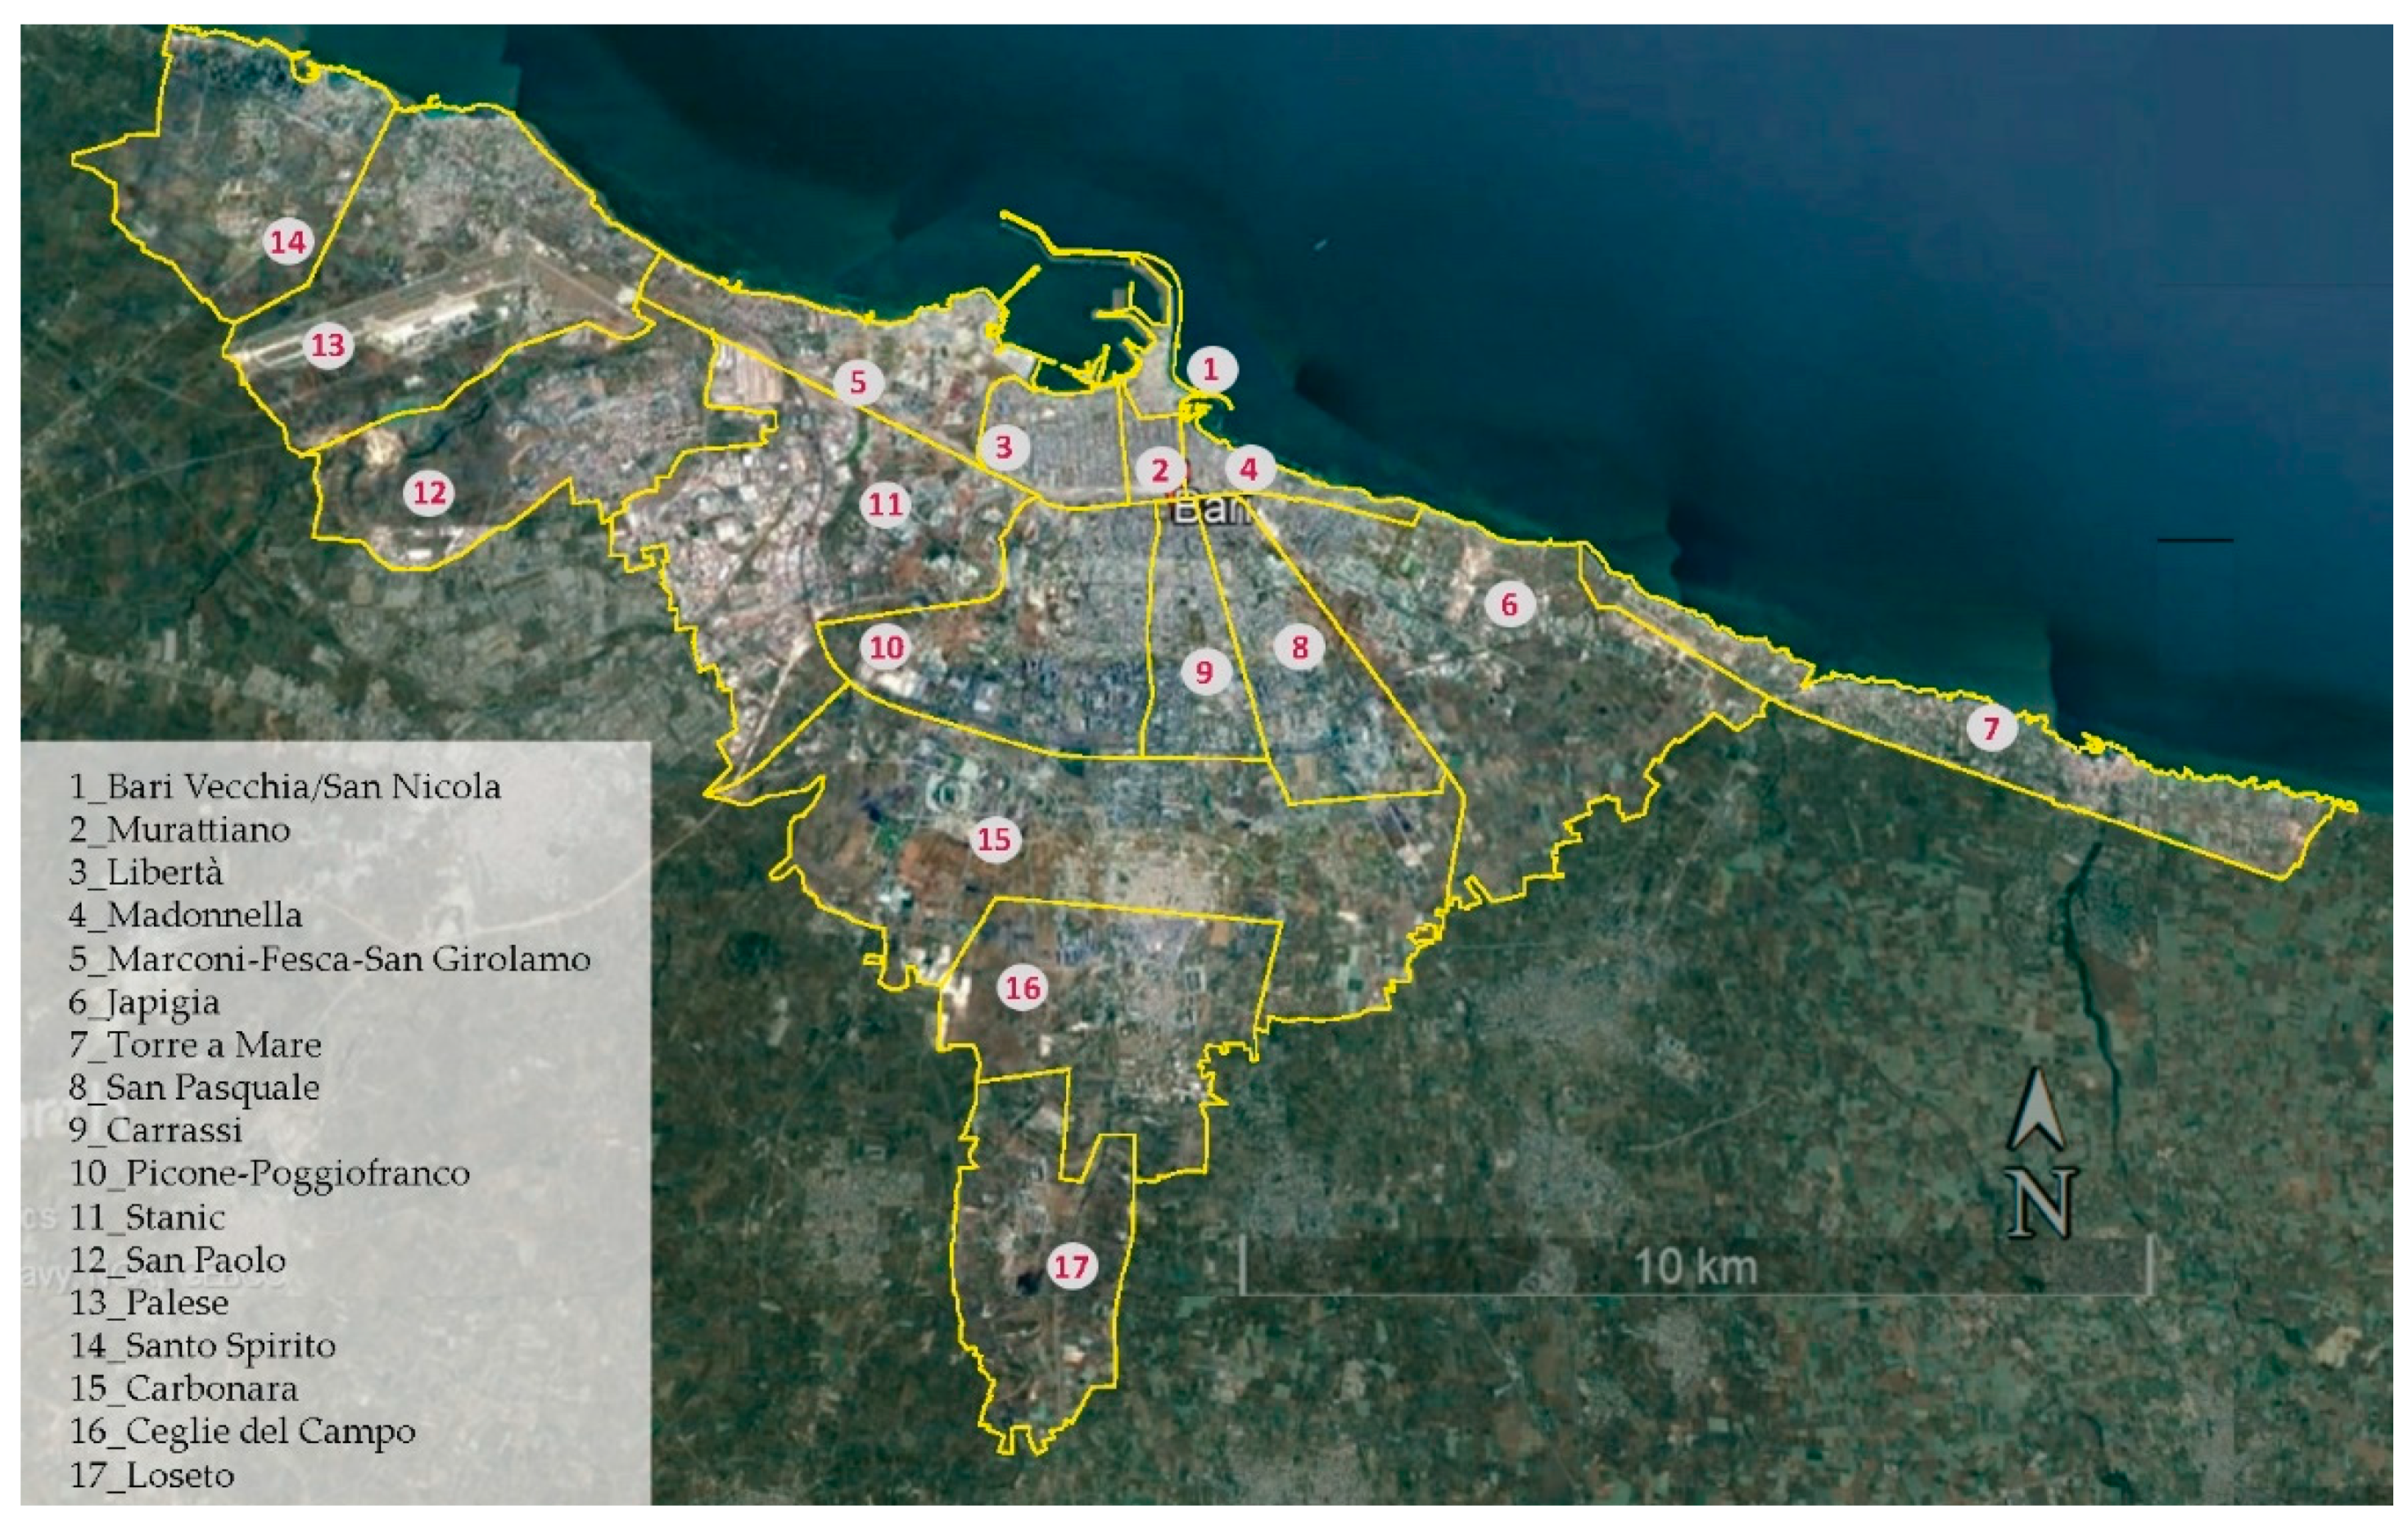
The city of Bari is subdivided into 17 districts (
Figure 4). Over time, newly built satellite neighborhoods (12) or initially independent villages (13–17) have been added to the city of Bari, originally formed by the districts from 1 to 11. For those non-homogeneous districts, the parameters have been calculated considering representative urban settlements for
Land Cover Albedo,
Greenery,
Canyon Orientation and
Irregularity of the City, while the
Building Heights and
Width of Streets have been obtained considering the intensity ranges with the maximum number of buildings and streets within the entire district.
3.1. Data Acquisition and Extraction of Albedo and Greenery
The data about
meteorological variables, regarding the city, are shown in
Table 2. Moreover,
Table 3 reports data ranges obtained from the analysis of each criterion from i = 5 to i = 11 in the 17 districts.
The district of Ceglie del Campo has the minimum value of Albedo, while Madonnella and Japigia present the maximum values. According to the Greenery criteria, the districts of Murattiano, Japigia and San Paolo are characterized by the minimum extension of greenery (less than 5%); Carrassi and Santo Spirito have the higher percentage of greenery (more than 45%). Madonnella, Libertà and Murattiano are the most populated. The settlements with the minimum values of Building Height (UCZ) are Palese Santo Spirito, Ceglie del Campo and Loseto; meanwhile, the maximum values (more than 20 m) are distributed within the urban expansion (districts from 1 to 11). The majority of the city show Canyon Orientation and Irregularity of the city in intermediate intensity ranges.
3.2. Index Evaluation in Bari
After the data acquisition and elaboration, the calculation of UHII per each district is executed.
Table 4 shows the weights assigned to every urban district of Bari on the basis of the intensity ranges and tabulated weights (
) of
Table 1 (calibrated in [
18]). Moreover, in the last column (right of
Table 4) the result of the index is provided. Note that such UHII values are evaluated by exploiting the weights associated to the criteria (
,
Table 1) and the weights associated of the intensity ranges (
,
Table 4). In particular, the index
is evaluated by exploiting a weighted sum in which criteria weights are multiplied by the associated intensity “ranges weights” according to Equation (1).
As an example, the
of the “Murattiano” district is evaluated according to the analytical Equation (1) by specifying weights
vi and
wij (Equation (2)) and calculating the values (Equation (3)):
The higher value of UHII is recorded in the center (Bari Vecchia-San Nicola UHII = 8.77 °C). On the other hand, an IUHII higher than 9 never occurs. This because the historical part has a good albedo (0.175). The Land Cover Type is influenced by a wide use of white limestone as pavement coverings of pedestrian streets and squares and white plaster (10%), and greenery extension equal to 6% along the seafront and around the Swabian castle. In addition, the width of the streets (less than 5 m) and the building heights (15–20 m) give a limited contribution to UHII value. In districts such as Murattiano, the UHII is relatively low (7.11 °C) in comparison to other cities, because white plaster covers the surface for 35%, even if the greenery is not diffuse (3%), grass is absent, and asphalt is the most employed material for outdoor pavements and roofs (60%).
Peripheral districts are less affected by the phenomenon because the urban asset is more extensive and large green areas are available. Nevertheless, further research may be carried out in some districts, such as Palese, Santo Spirito, Ceglie del Campo, Loseto and Carbonara that have characteristics of towns, with the city center and the peripheral areas with different values of UHII criteria for characteristics of the city and city canyon. The anthropogenic heat has higher contribution in Madonnella, Libertà and Murattiano.
Few previous studies investigated UHI in cities of southern Italy. The only example for the city of Bari concerns the research of Martinelli et al. [
23]. Such investigation provided the evaluation of three urban districts by using standard fixed measuring stations. These values are coherent with the UHII evaluated in the proposed research (e.g., UHII in the Murattiano district—the differences of the two UHI evaluation are less than 0.5 °C). Beyond the confirmation of these UHII values, the proposed research achieved the intensity map of the entire city, proposed useful mitigation scenarios and evaluated the heat stress of the combination between the warm temperatures of southern Italy and the UHII (following
Section 4.1,
Section 4.4 and
Section 4.5, respectively).
4. Comparison with Other European Cities and Discussion
A comprehensive overview of different urban contexts can be achieved through an extensive comparison between Bari and the other six European cities. This section presents the results of the 344 investigated urban districts useful to emphasize the positive or negative aspects of Bari. In addition, some virtuous examples of UHII mitigation in the major European cities are pointed out to draw inspiration and define useful mitigation strategies for Bari.
4.1. The UHII and Mapping of Other European Cities
Analogously to the case of Bari, the mapping of the other six European cities have been produced by following the proposed methodology.
For every urban district, meteorological data have been extracted from the existing meteorological European database (e.g., TuTiempo [
27]) and Copernicus data. The characteristics of the city are acquired by exploiting the proposed satellite data processing and image analysis. Moreover, anthropogenic heat and city canyons are achieved from European Environment Agency, Google Maps and Technical cartographies (when available). Once data are stored in a large database, the index
have been calculated by exploiting Equation (1) and the tabulated weights of
Table 1.
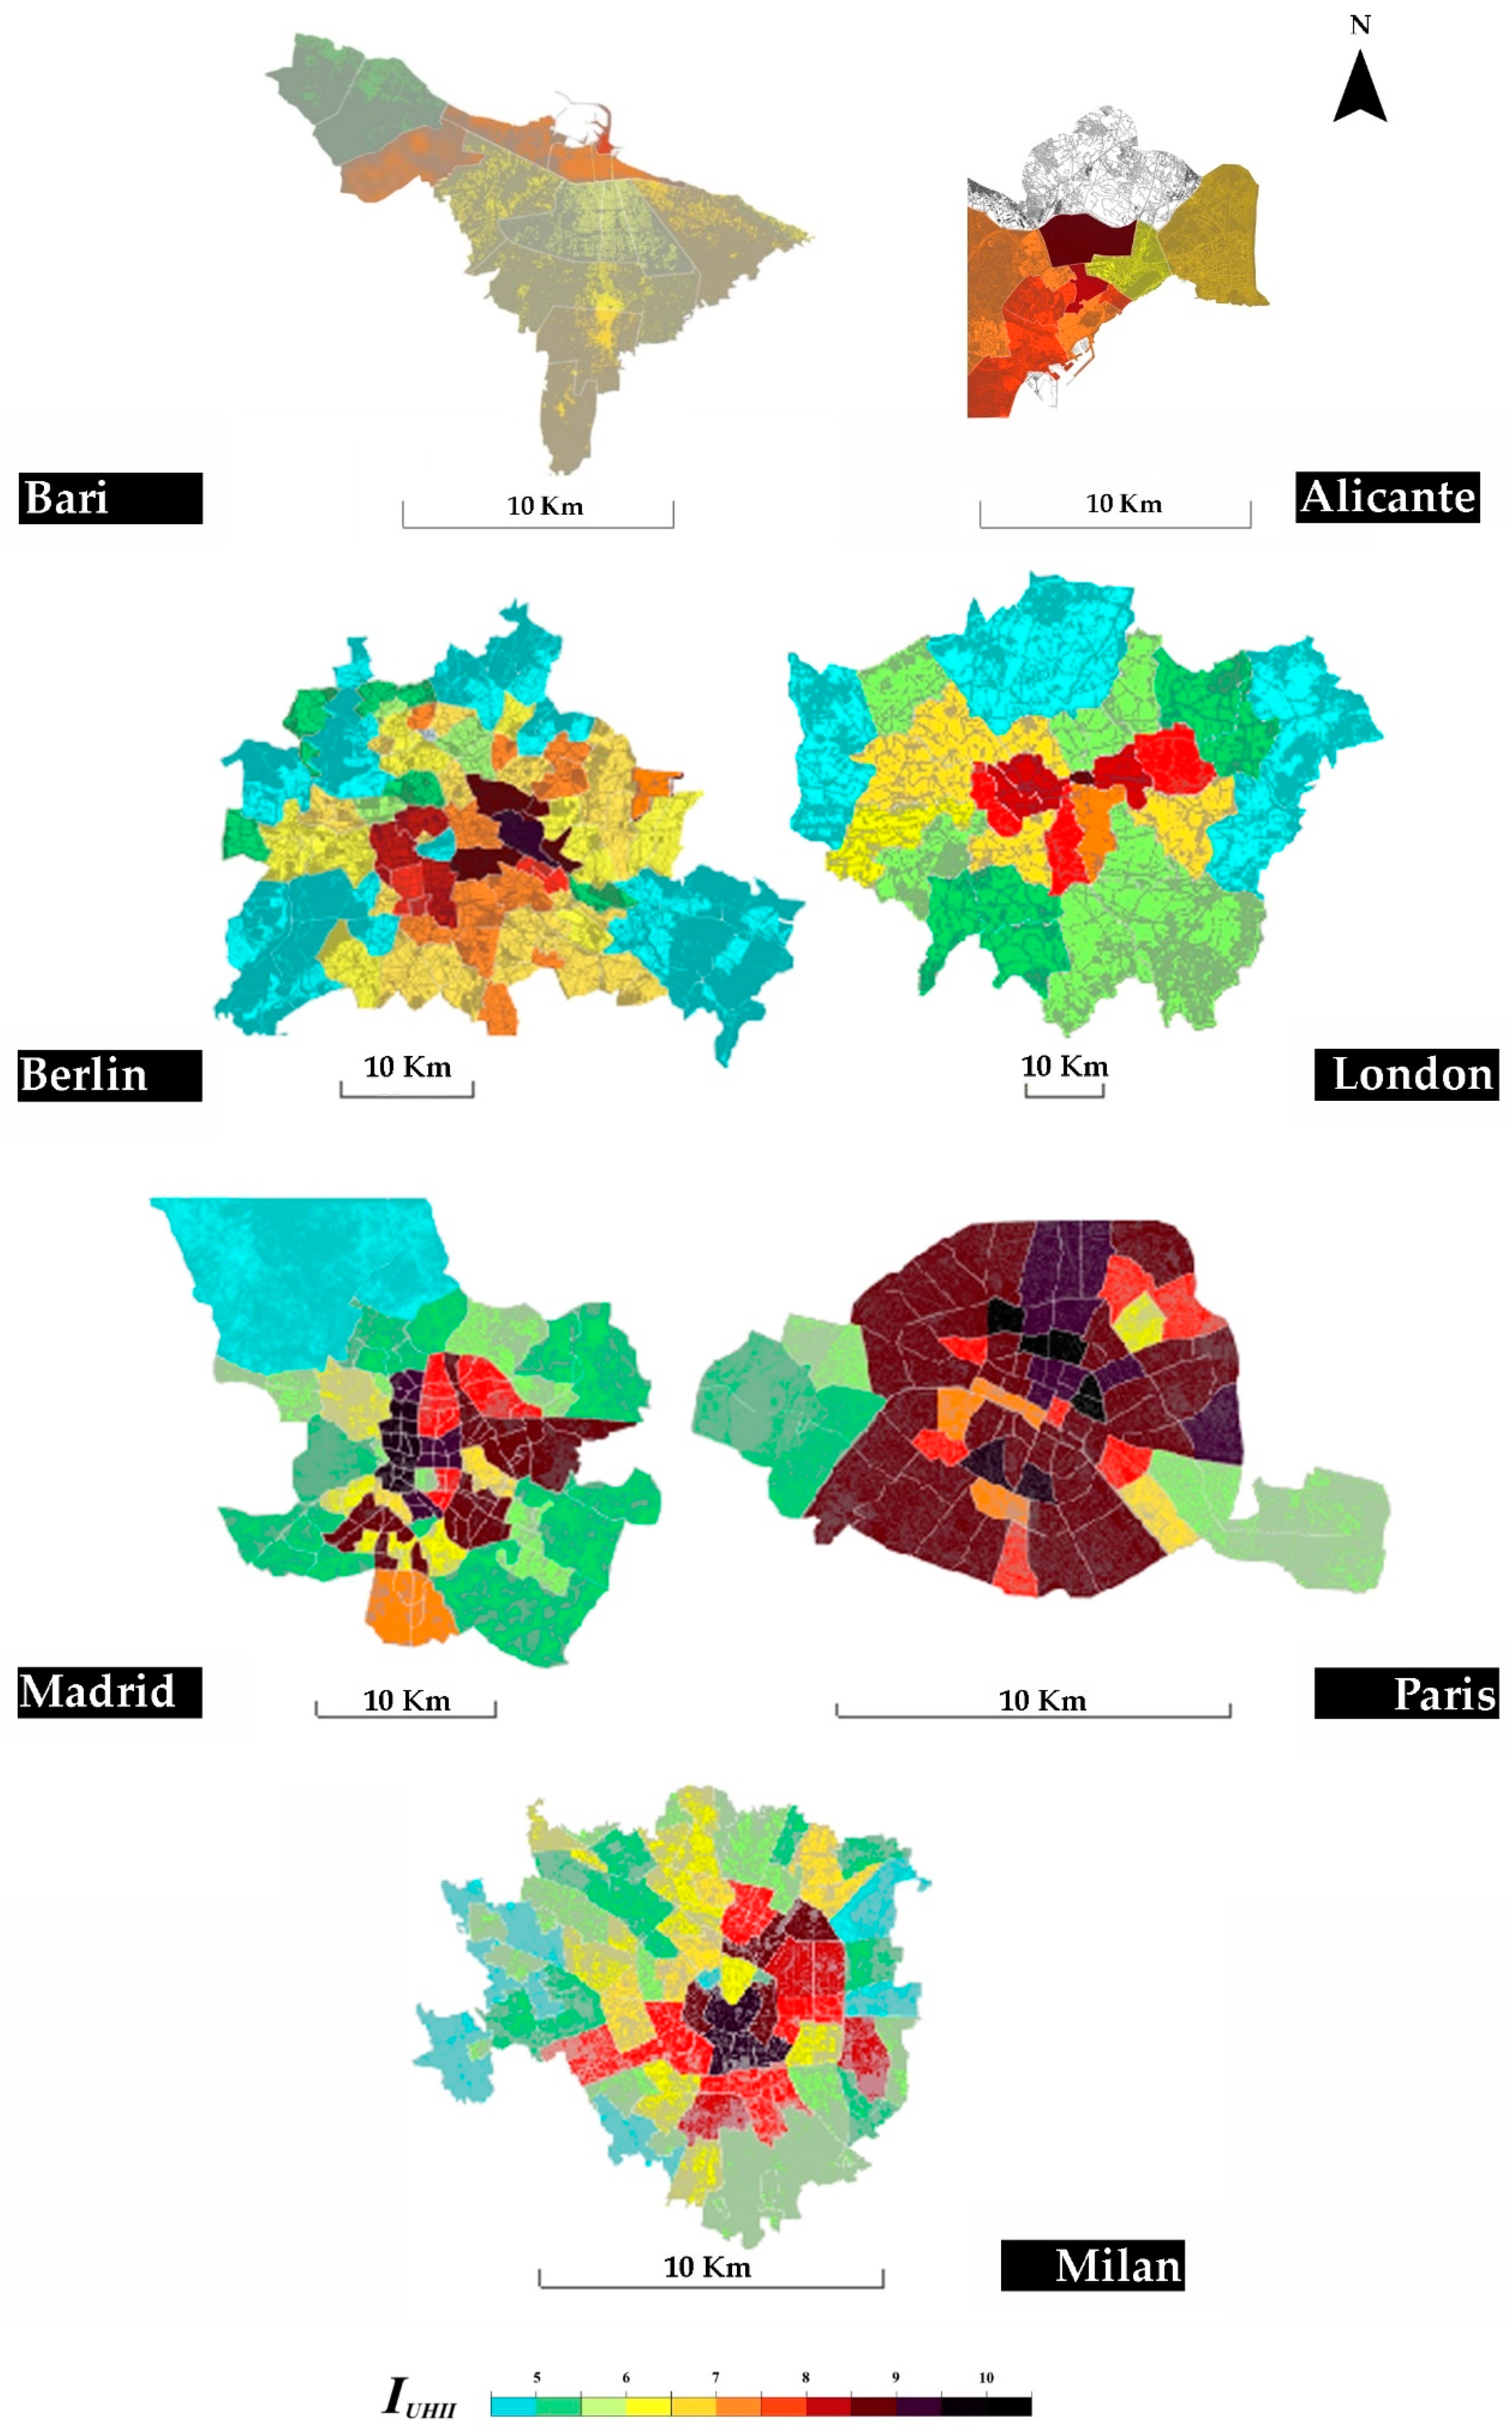
Figure 5 shows the intensity maps of Bari and the other investigated cities.
4.2. Comparison
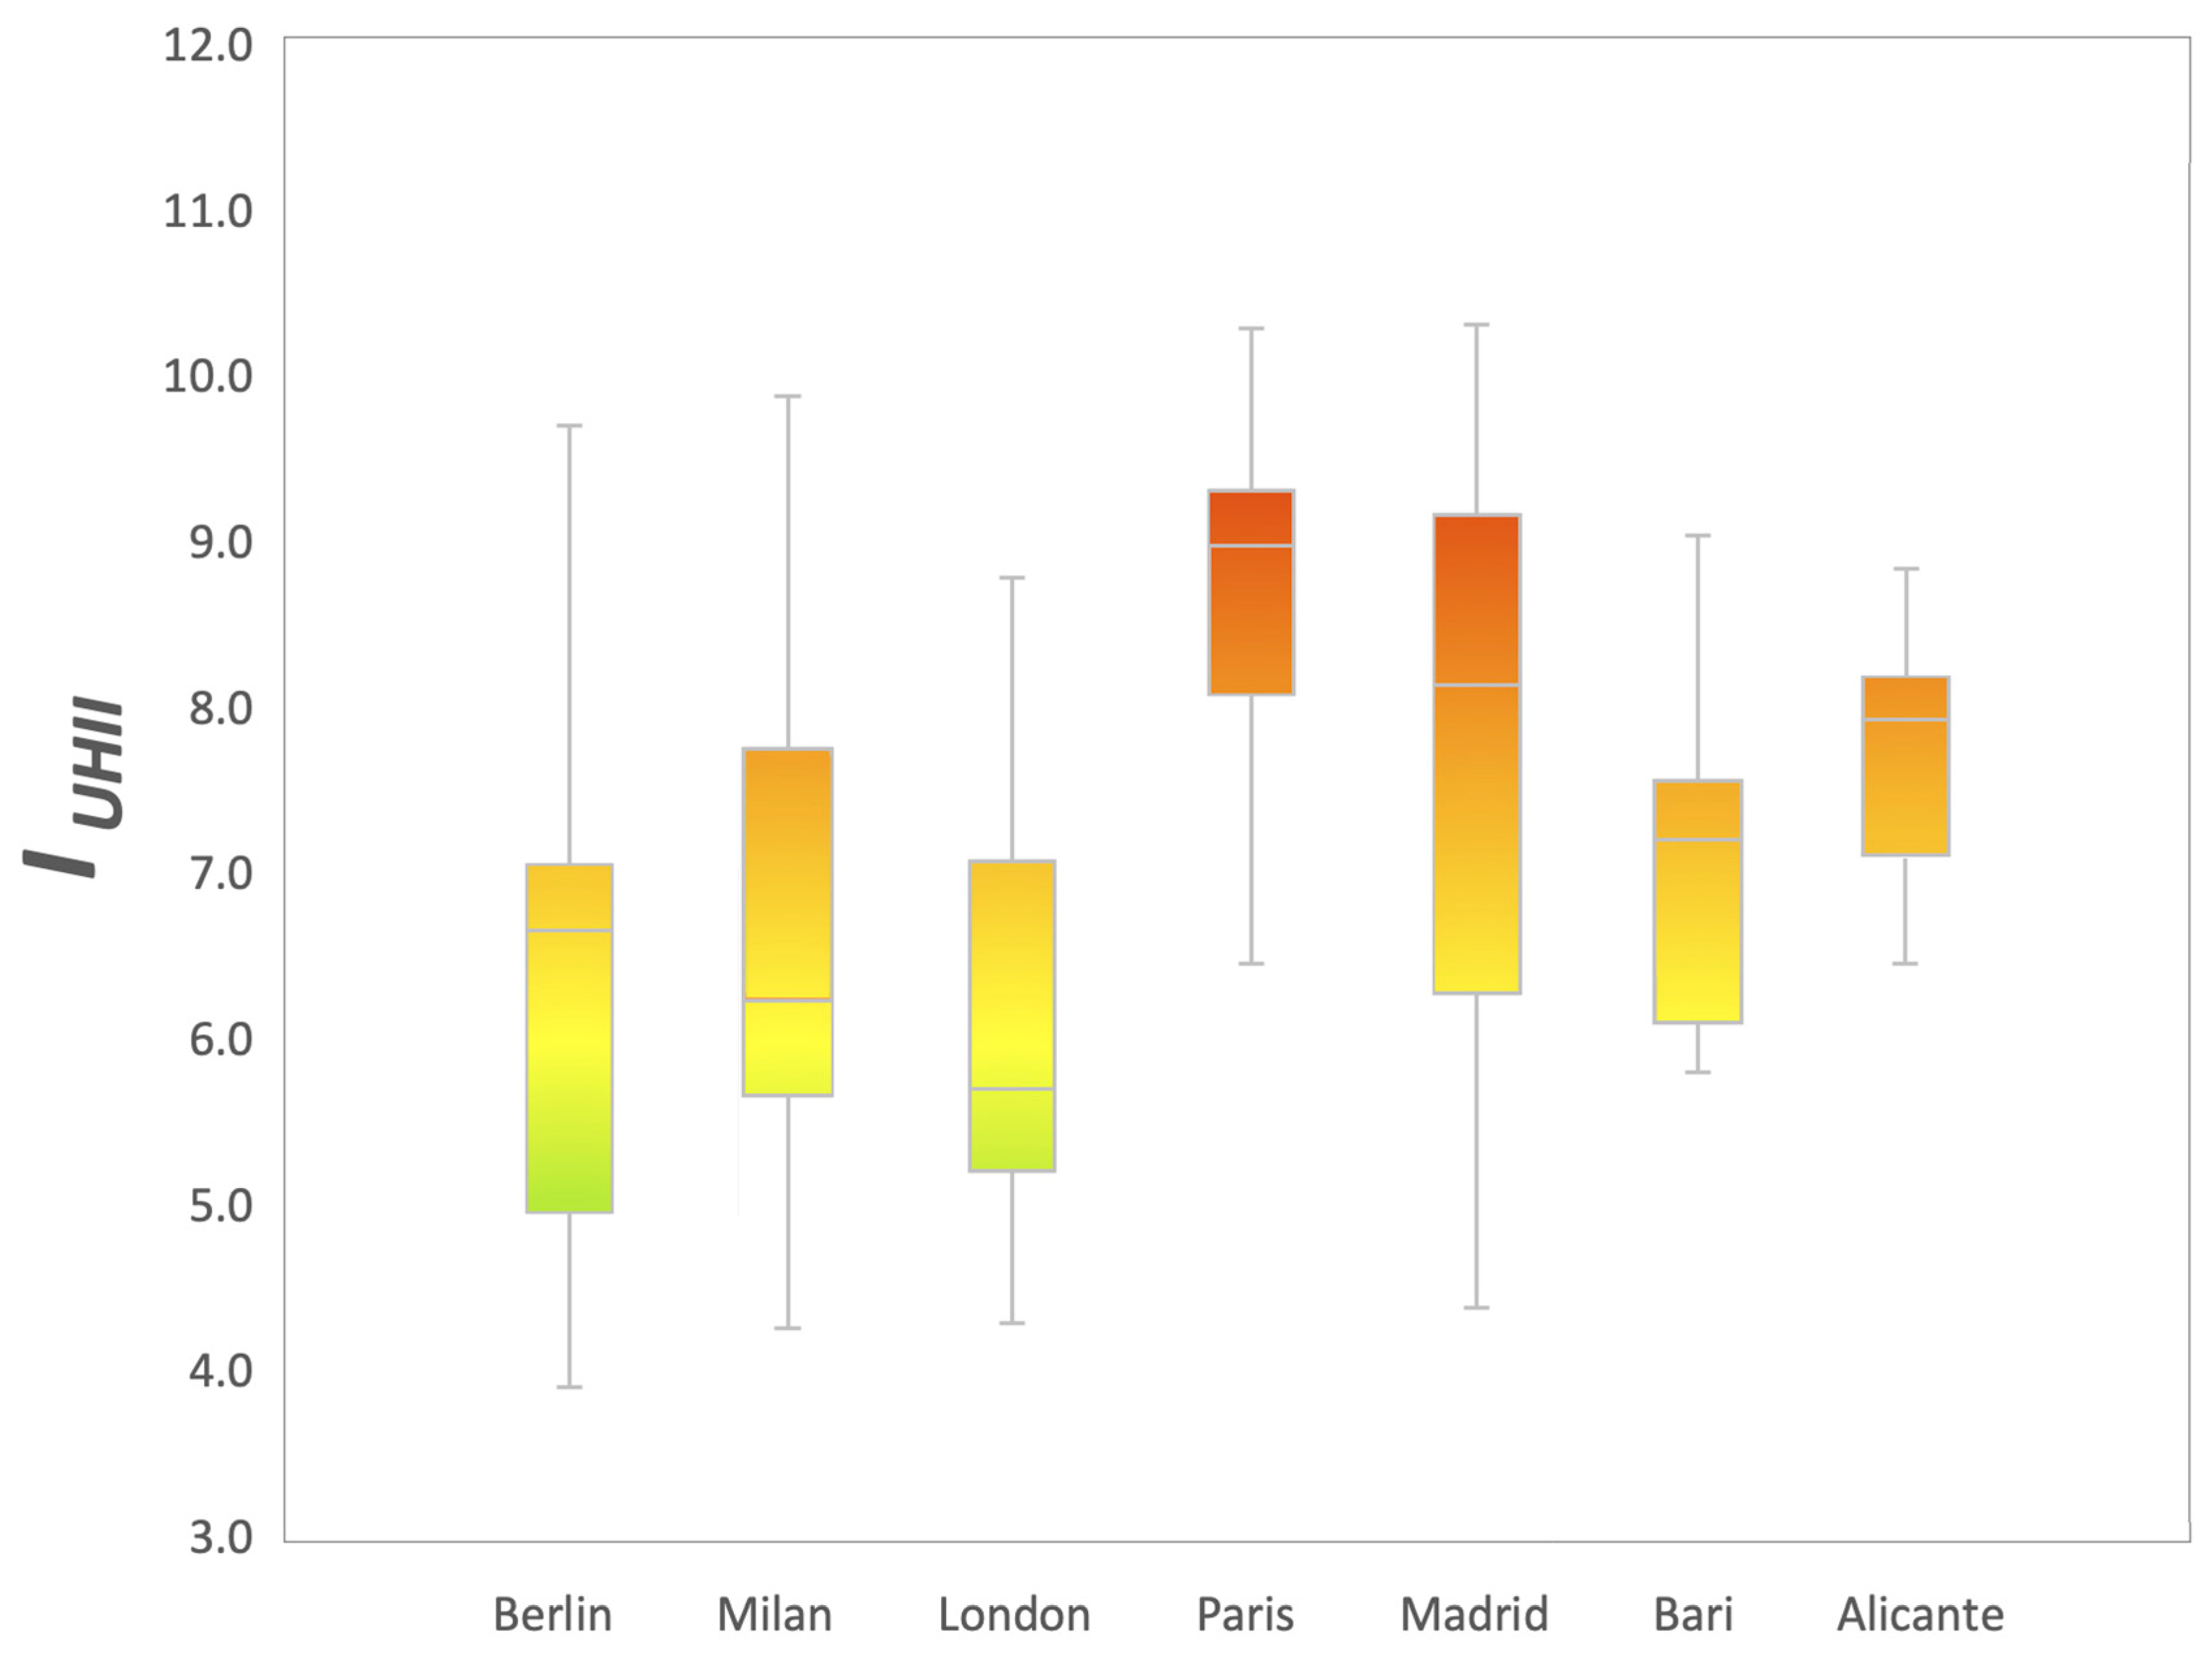
Figure 6 shows the boxplot of the UHII evaluated for the compared cities. The boxes represent the distribution of the UHII, and the black horizontal line inside the boxes denotes the median of the sample. Although the box contains all results within the 25th and 75th percentile of the population, the vertical line contains all results that are not considered outliers. In all the compared city, temperatures in the central districts are higher than the surrounding areas as is predictable and widely known in the literature [
15]. In the case of Paris, the situation seems different since high-intensity values are present in almost all the investigated districts with an average
IUHII of 8.7 °C. The reason for this result in Paris depends on the fact that all the investigated 80 urban districts belong to the central area of the city “Unitè urbaine” (the 1% of the extension of the entire urbanized area of Paris). In the other cases, for example in London, the metropolitan boroughs include several large districts with a lower population density and bordering with the peripheral area of the urbanized area. In London, the average of the evaluated
IUHII in the districts is 6.2 °C. To this aim, if only urban districts with a radius of 5 km from the city center are compared in every city, the surveyed differences are not very high and almost all the boroughs have high values of UHII above 7.5 °C. The central districts in the worst condition are found in Madrid and Paris with values above 10 °C. In these city centers, the phenomenon increases due to the absence of greenery, narrow streets and high buildings that create ideal conditions for reaching high peaks of temperatures.
Beyond the analysis of the city centers, the investigated cities present other differences, as discussed in the following subsections.
4.2.1. Berlin
The UHII in the city of Berlin reaches a higher value in a few central districts such as “Friedrichshain”, “Kreuzberg” and “Prenzlauer Berg” with
IUHII values of 9.7 °C, 6.6 °C and 8.8 °C. These districts are characterized by intensive high-rise buildings and fewer green areas (less than 15%) if compared with the average of the districts (about 38%). On the other hand, the presence of large green areas, also called municipal forests, produces a positive effect in the mitigation of the phenomenon. To provide an example, the central urban district of Tiergarten (
IUHII of 4.53 °C) is known for the most popular inner-city park (of the same name) located completely in the district. This park is 210 hectares in size and is among the largest urban gardens of Germany. Beyond Tiergarten, almost all the urban district of Berlin has parks or neighboring parks that can mitigate the UHII effect. Only a few exceptions, in the suburban area, concern districts subject to high-absolute max UHII because of the high housing density and lower presence of green (e.g., the district of Hellersdorf in the north-east of the city). The results achieved in such city are in line with the study of Menberg et al. [
35], which investigates the distribution of the surface air temperature in Berlin.
4.2.2. Milan
Similarly to other cities, the intensely developed urban fabric creates higher values of UHI in the central districts of Milan (near the cathedral). The neighborhoods with the potentially highest phenomenon are “Duomo”, “Porta Vigentina” and “Porta Ticinese” with a UHII index just above 9 °C.
The only two exceptions in the city center (with lower UHII) concern the districts mitigated by the presence of large parks (Sempione Park and the Garden of Porta Venezia with an IUHII of 4.3 °C and 5.2 °C, respectively). On the contrary, outside the central area, the UHI effect is less severe principally thanks to larger green areas and a minor canyon effect produced by lower buildings with wider and greener streets. Some of these representative neighborhoods are “Parco delle Abbazie”, “Parco dei Navigli”, “Parco Agricolo Sud—Assiano” and “Parco Bosco in Città” with a resulting index of less than 4.5 °C.
4.2.3. London
The city of London is characterized by large urban districts with a greater extension than the other investigated cities. Consequently, only a few districts can be considered in the intensively developed area of the city. This justifies the presence of only 4 (out of 33) urban districts subject to high UHII above 8 °C. In particular, the UHII in the districts of “London Centre”, “Westminster”, “Kensington” and “Tower Hamlets” is evaluated, respectively, of 8.89 °C, 8.38 °C, 8.00 °C and 8.20 °C with the proposed index. The achieved results are in line with the previous study of Kolokotroni and Giridharan, investigating the outdoor air temperature and UHI effect in London during the summer months [
36]. However, a moderate mitigation of the phenomenon is ensured by the constant presence of greenery (almost all over the city) in the districts of London. In addition, outside the central areas of London, the change in the building typology from intensively developed and high-rise buildings to terraced houses (with a private green area) creates an effective mitigation. A particularly significant example for this type of mitigation concerns the districts of Lewisham (south-east of the city) where the absolute max UHII is estimated below 6 °C even if the population density remains high. The peripherical quartiers of London can be considered an effective example of moderate mitigation of the UHII with the presence of numerous green areas while maintaining a high population density.
4.2.4. Madrid
In the city of Madrid, and in particular, in the center, the UHI phenomenon reaches higher peaks compared with the other cities of Milan, London and Berlin. Indeed, the district of “Centro” and “Chamberí” can reach a UHII higher than 10 °C, while other districts such as “Arganzuela”, “Salamanca” and “Tetuán” are above 9 °C according to the used multicriteria approach. This condition is partly due to the meteorological variables particularly prone to intensifying the phenomenon. On the other hand, the principal contribution to the manifestation of such an intense phenomenon concerns the presence of few green areas and high-rise buildings with very narrow streets that create tall and narrow city canyons. This condition is present in both the central districts and in other peripherical areas such as “Usera” in the south or the “Ciudad Lineal” in the north-east of the city. Indeed, all these conditions are ideal for the formation of the high value of UHII that characterize more than half of the districts of the city [
37]. The phenomenon is mitigated only in a few peripheral districts where buildings are sparser and the presence of greenery increases. One of the better examples of UHI mitigation in Madrid is represented by the district of “Moncloa-Aravaca” mitigated by the large green park named “Casa de Campo”.
4.2.5. Paris
Paris is the city that suffers most from the manifestation of UHII among the comparison. The index IUHII is evaluated above 9.5 °C in 25 urban districts out of 80 and is above 10 °C in 5 districts (“Enfants-Rouges”, “Archives”, “Saint-Georges”, “Faubourg-Montmartre” and “Porte-Saint-Denis”).
Such a heavy condition is due for the presence of multiple concurring causes. Firstly, in most of the districts, the absence of sufficient green areas does not allow the mitigation of the phenomenon. Secondly, the districts of Paris are characterized by high-rise buildings with narrow streets that improve the severity of the UHI. Thirdly, the high population density allows the development of a high anthropogenic heat, which aggravates the development of higher ambient temperatures. In total, 66 out of 80 urban districts in Paris located in the “Unitè urbaine” suffer from UHII conditions above 8 °C. Temperatures at least 8 °C higher in the city center than in the surrounding rural area are in line with the previous studies of Lemonsu and Masson [
38] investigating the phenomenon in the 1st arrondissement of Paris. However, it is important to note that the districts considered in this paper are in a densely populated urban area of the city. Lemonsu and Masson demonstrated that the mitigation of the phenomenon starts sensitively in the metropolitan area a distant 10 km from the center (e.g., between Val-d’Oise and Sena-Saint Denis) [
38].
4.2.6. Alicante
The UHII manifestation in Alicante (
Table 5) is very similar with the case of Bari. Indeed, the max value registered in the ”Juan XXIII” district is 8.69 °C, similar to Bari, which reaches values of 8.97 °C in the historic center. In particular, the Alicante historic center presents almost the totality of buildings with roofs covered by red bricks, within an almost regular street arrangements where roads have widths between 5 and 10 m.
The highest value of the “Juan XXII” district depends on a low value of the cover type albedo (0.183) derived by an extensive asphalted area (66.89%) and limited greenery (3.27%). The index IUHII reaches values higher than 7.5 °C in “Pla del Bon Repos-La Goleta-San Anton”, “San Blas-Pau”, “Campoamor-Carolinas-Altozano” and “Benalua-La Florida-Babel-San Gabriel”. “Pla del Bon Repos-La Goleta-San Anton” and “Campoamor-Carolinas-Altozano” are more central and featured by the highest contribution to the anthropogenic value due to a population density (14,000–16,000 ab/Km2 and more than 20,000 ab/Km2, respectively). Meanwhile, the “Benalua-La Florida-Babel-San Gabriel” critical aspect regards the building heights higher than 20 m, together with the southern canyon orientation. The districts of “San Blas-Pau” presents similar characteristics in terms of the width of streets and building height if compared with Pla del Bon Repos; on the other hand, the lower presence of greenery allows it to reach UHII values of 7.93 °C.
The UHII is never under 6.24 °C, and such a minimum value is calculated for “Parque Avenidas -Vistohermosa”, the most peripheral district, characterized by low-rise buildings and low population density.
Moreover, in this case, the achieved results are compared with previous research:
- (i)
Martinez et al. [
39] studied the phenomenon by acquiring values of temperature through mobile survey techniques (to be compared with rural measurements). He surveyed the higher UHI effect of above 5 °C during the winter of 2012–2013. On the other hand, such values of UHI intensity are just indicative and not comparable with the current study, as it concerns the maximum UHI intensity in summer 2021;
- (ii)
In 2019, Jato-Espino [
40] illustrated the spatiotemporal statistical analysis of the Urban Heat Island effect in a Mediterranean region, investigating the temporal intervals 2005–2009–2011–2015 from June 21 to September 23 for the Alicante city and airport meteorological stations. The observed and predicted values of Jato-Espino are consistent with the proposed work. To provide an example, in the district of Juan XXIII, the obtained UHII value is 8.69 °C (in the proposed research) and is slightly above 9 °C in Jato-Espino.
On the other hand, unlike the previous work, the proposed investigation achieved the intensity map of the entire city of Alicante, while previous works were mainly focused on the Valencian region. The two researched works can be considered complementary, since the previous one focused on the regional scale to investigate the UHII in the Mediterranean region, although the current research proposes a comparison among cities fully investigated in all urban districts.
4.3. Positive and Negative Aspects of Bari
The city of Bari does not reach values of UHII higher than 8 °C, and also not in the center. This occurs because the historical part has a good albedo (0.175). The Land Cover Type is influenced by a wide use of white limestone as pavement coverings of pedestrian streets and squares and white plaster (10%), and greenery extension equal to 6% along the seafront and around the Swabian castle. In addition, the width of the streets (less than 5 m) and the building heights (15–20 m) give a limited contribution to UHII value. In districts such as Murattiano, the UHII is relatively low in comparison to other cities, because white plaster covers the surface for 35%, even if the greenery is not diffuse (3%), grass is absent, and asphalt is the most employed material for outdoor pavements and roofs (60%). Peripheral districts are less affected by the phenomenon because the urban asset is more extensive and large green areas are available. Nevertheless, further research may be carried out in some districts, such as Palese, Santo Spirito, Ceglie del Campo, Loseto and Carbonara, which have characteristics of towns, with the city center and the peripheral areas with different values of UHII criteria for characteristics of the city and the city canyon. The anthropogenic heat has a higher contribution in Madonnella, Libertà and Murattiano.
4.4. Mitigation Strategy in the City of Bari
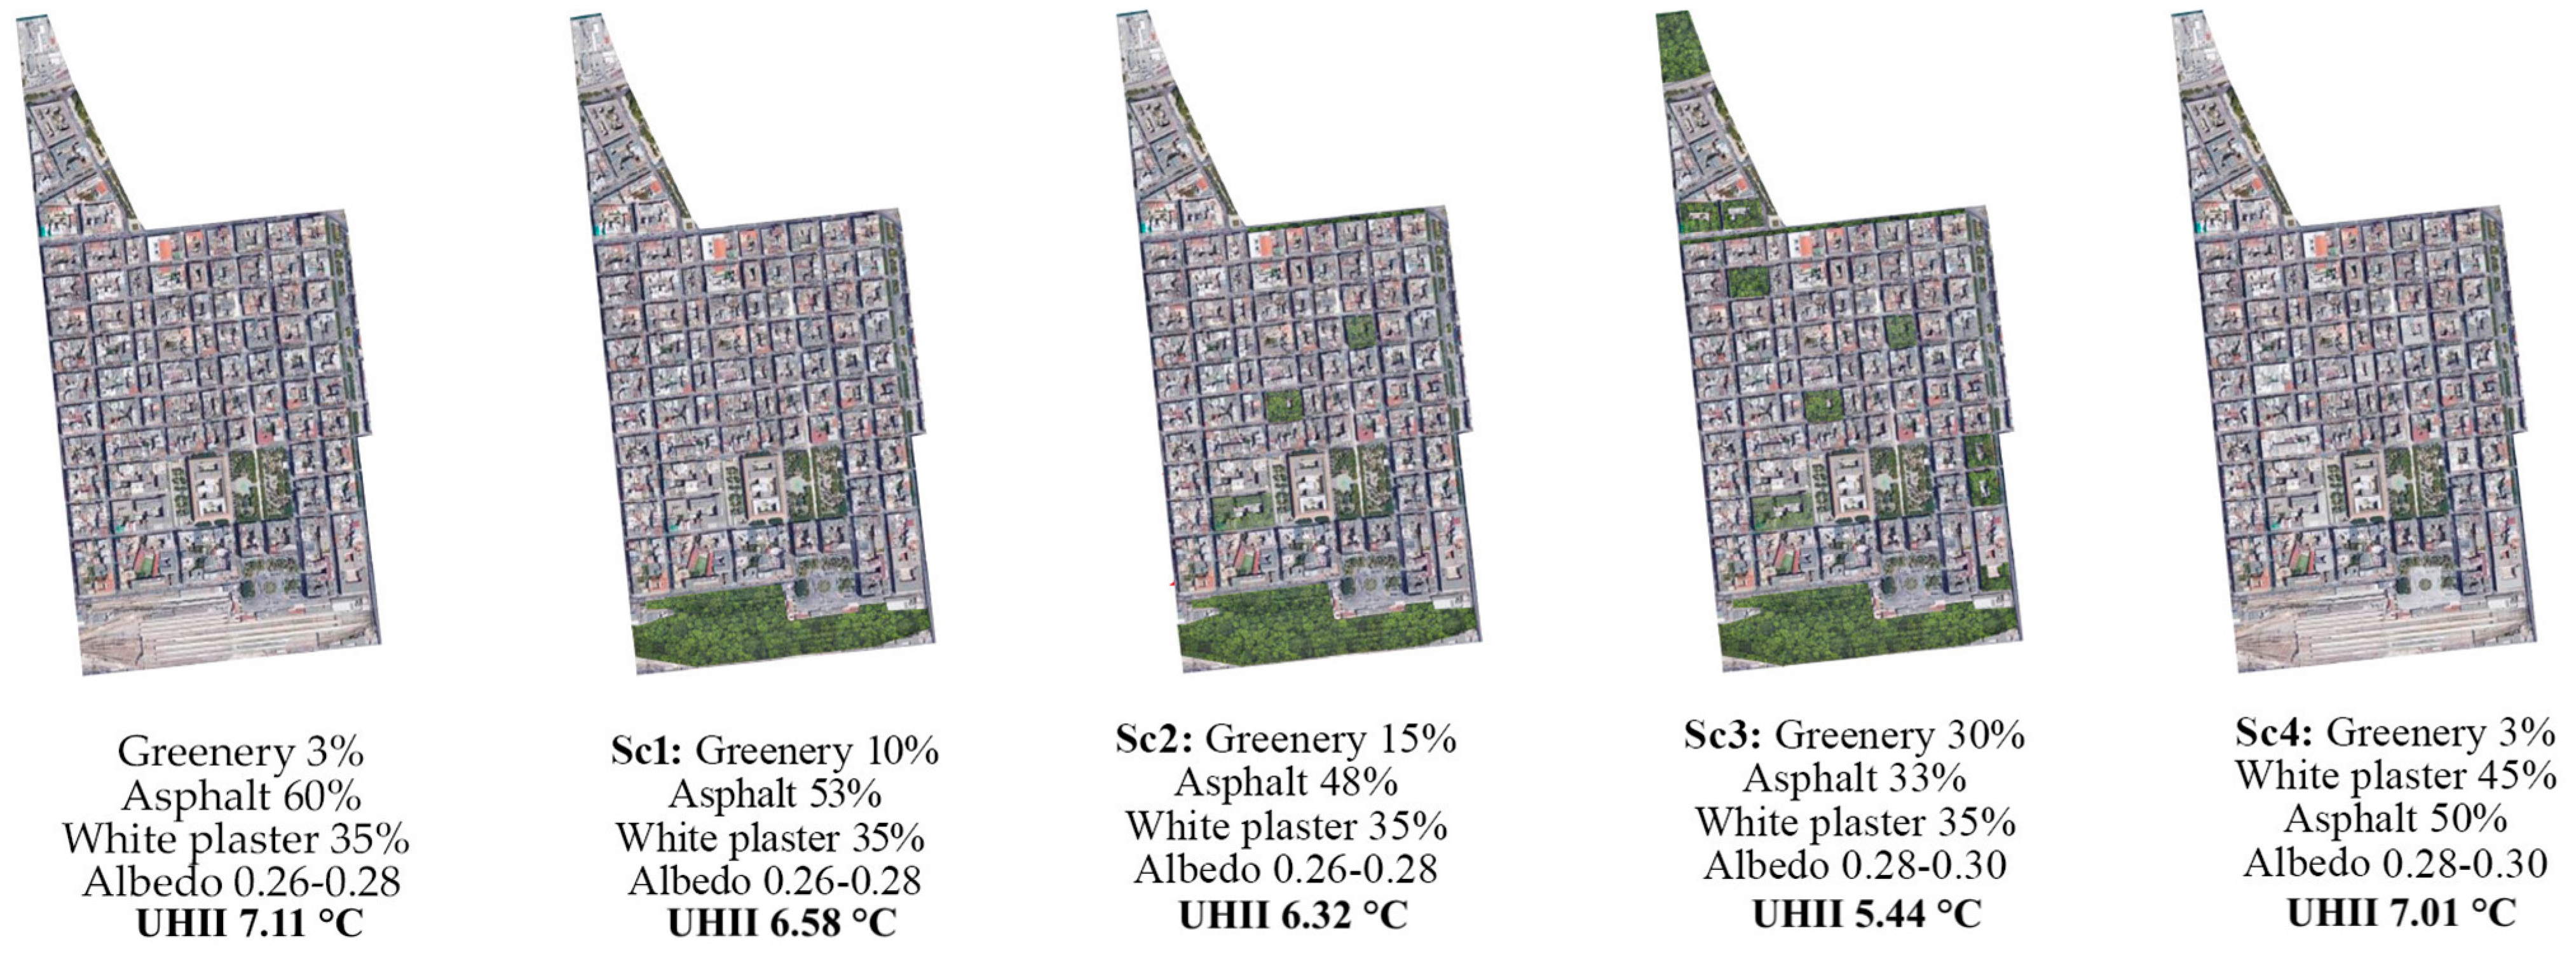
In order to demonstrate the potential of the method and provide a useful overview of different mitigation strategies, four scenarios of intervention within the central district of “Murattiano” have been assessed and consist of an increase in greenery (Sc1, Sc2, Sc3) and the use of cool roofs (Sc4) (
Figure 7):
- (Sc1)
Greenery 10%, asphalt 53% and white plaster 35%;
- (Sc2)
Greenery 15%, asphalt 48% and white plaster 35%;
- (Sc3)
Greenery 30%, asphalt 33% and white plaster 35%;
- (Sc4)
Greenery 3%, white plaster 45% and asphalt 50%.
In the central districts, the UHI reduction can be reached only intervening on the extension of green and/or white areas at the expense of the asphalted floors, as little can be performed with the City canyon criteria, which relates with consolidated urban settlements. Focusing the attention on the “Murattiano” district, one of the most densely urbanized area of Bari, it is characterized by a low percentage of greenery. For this reason, the effects of the UHI can be reduced by increasing greenery and proposing the planting of trees and grass in streets, open areas and roofs, which influence the Land Cover Types (Albedo), together with the use of white-topping pavements/coverings, when feasible. The city albedo of “Murattiano” is good enough because its value ranges from 0.26 to 0.28 (0.265), and the highest weight is assigned to only one range up (0.28–0.30 with w3,10 equal to 0.38). Consequently, an appropriate decision is to intervene on greenery. In particular, a wide intervention can be planned in the area of the train rails (in the south of the district) that consist of almost the 7% of the total area and about 11.5% of asphalt surface. In this context, a public park might be built raised to the train rails, as proposed with the “Nodo Verde” by Fuksas Architects. If this area of 7% is subtracted from the asphalt one (reduced from 60% to 53%), devoting it for greenery at 90% and white coverings at 10%, the UHI value is decreased to 6.44 (−0.27 °C) because the percentage of greenery (of the entire district) rises from 3% to 9%, while the city albedo continues to range from 0.26 to 0.28 (Sc1). Nevertheless, this intervention is regarding public areas; thus, they are committed to municipalities and transportation authorities. Meanwhile, the decision to have green and white roofs is left to building owners, thus the full potential of reducing UHI can be difficultly obtained. Therefore, the assumption to increase Greenery up to 15% with green roofs and trees on the ground (Sc2), keeping the same quantity of white surfaces and reducing asphalt at 48%, the Land Cover Types (Albedo) does not enter in the following range, but the UHI reaches 6.18 °C (−0.53 °C). Meanwhile, if greenery is added to achieve an extension of 30% (Sc3), land cover types (albedo) enter the last range (0.28–0.30) and UHI will be equal to 5.03 °C (−1.68 °C). In the hypothesis that the Greenery extension overcomes the 45%, the UHII is 4.24 °C (−2.47 °C).
In the hypothesis of intervening on cool roofs, keeping the same extension of greenery (3%), the percentage of 45% (+10%) of white plaster with the reduction to 50% (−10%) of asphalt used for bitumen roofs will increase the albedo (land cover type) from 0.265 to 0.302 (reaching the following range) (Sc4). This will lead to a UHII equal to 6.60 °C (−0.11 °C), which is a very low decrease in the phenomenon. This results in the inconvenience of intervening with cool roofs, while high positive gain can be achieved, adding greenery (
Figure 7). Differently, in new urban settlements located in peripheral zones, city canyon criteria can also support decisions about building heights, canyon orientation and width of streets and irregularity of the city, together with the extension of greenery and the selection of high albedo materials, in order to limit the negative effects of UHI.
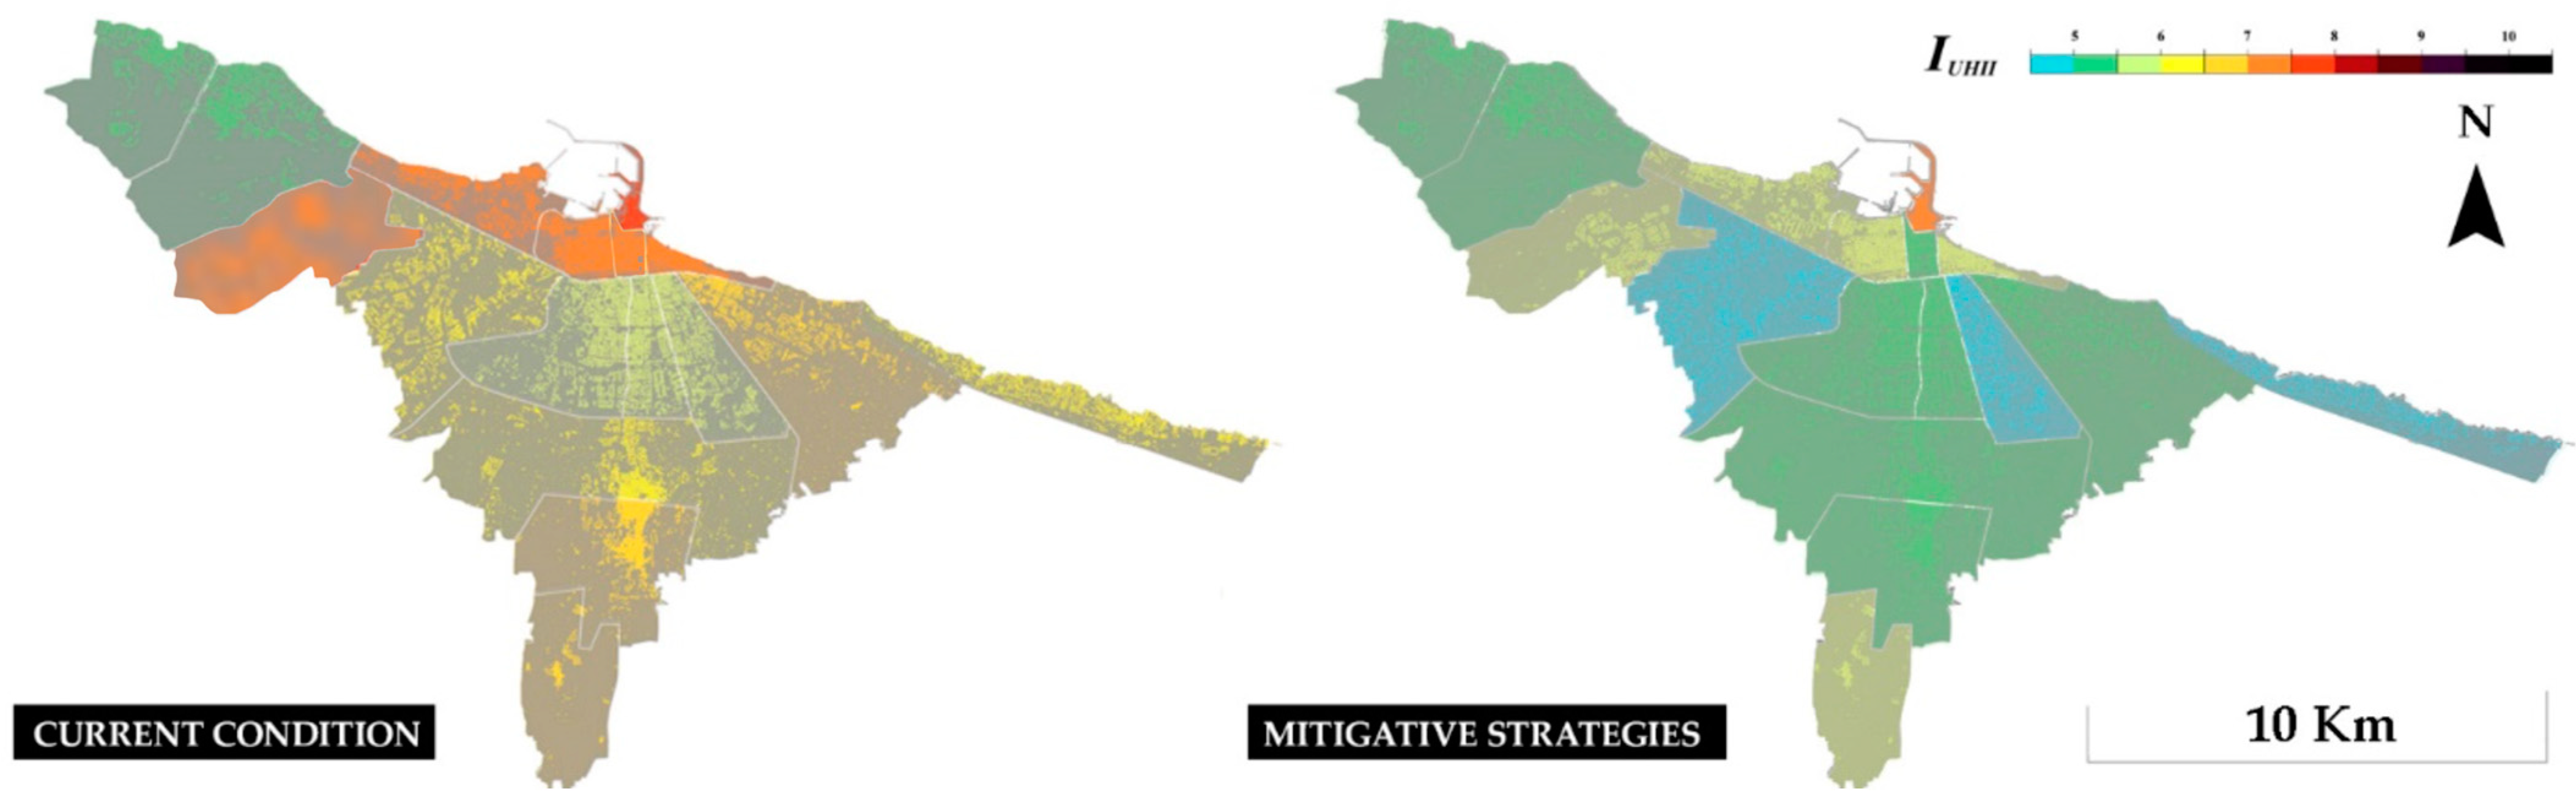
Figure 8 shows the intensity map of the city of Bari in the case of an increase in greenery according to the available space of every district (as shown in the case of Murattiano, with a maximum greenery of up to 30%).
Based on the presented four scenarios of intervention, the proposed methodology can support governmental and technical personnel in urban and building renovation: the increasing of greenery (introducing parks, tree-lined streets and green roofs in the urban settlements) and the conversion into cool roofs and pavements are the relevant recommendations for future urban planning.
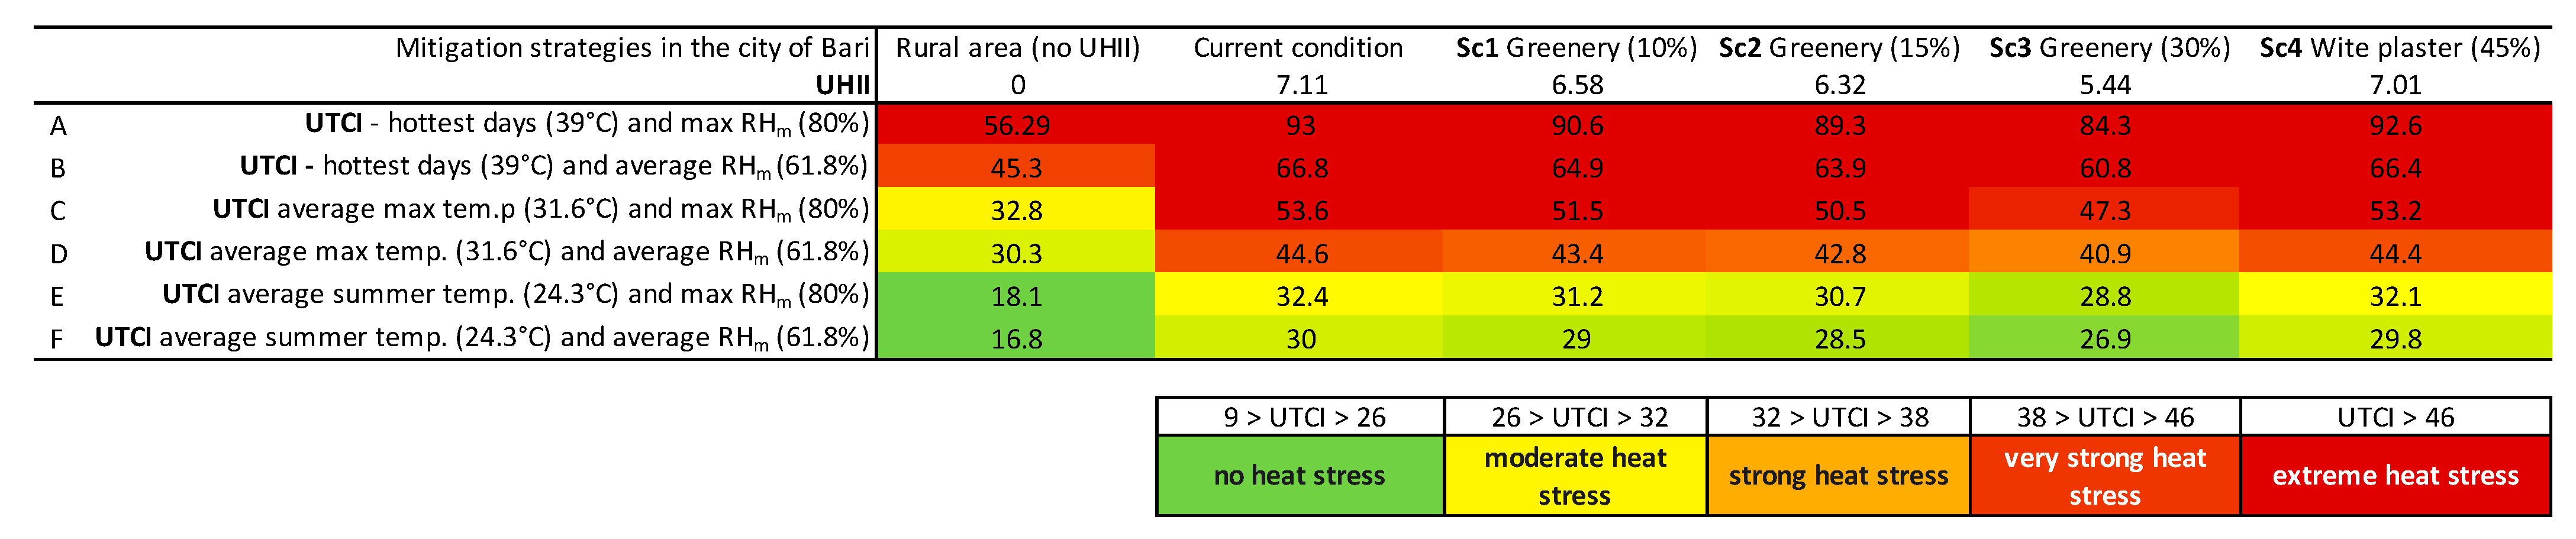
4.5. Mitigation Strategies and Heat Stress in Bari
To understand the effect of the UHII on human discomfort (heat stress), the Universal Thermal Climate Index (UTCI) has been evaluated in the central district of “Murattiano”. The UTCI is evaluated in the proposed five scenarios and in the surrounding rural area (where the UHII phenomenon is absent). The evaluation has been achieved by exploiting the algorithm of Wojtach [
41]. Such heat stress has been evaluated by considering the condition of the external environment with no direct sunlight and a wind speed of 10.5 m/s (the average wind speed of Bari during the summer season). More in detail, the following six combinations of meteorological variables are evaluated and combined with the UHII effects (all the values refer to the summer period):
- (A)
Hottest max temperature of the summer (39 °C) and most humid day of the summer, i.e., max average daily relative humidity, (max RHm 80%);
- (B)
Hottest max temperature of the summer (39 °C) and average summer relative humidity, RHm (61.8%);
- (C)
Average max daily summer temperature (31.6 °C) and max RHm (80%);
- (D)
Average max daily summer temperature (31.6 °C) and average RHm (61.8%);
- (E)
Average summer temp (24.3 °C) and max RHm (80%);
- (F)
Average summer temp (24.3 °C) and average RHm (61.8%).
It is worth noting that by investigating all these combinations, it is possible to provide a good overview of the effect of the UHII on the heat stress in the “Mutattiano” district of Bari. Indeed, case A concerns the unlikely combination between the hottest day and the most humid day of the summer. The heat stress evaluated in B and C regards human discomfort when either the temperature or humidity is higher in the summer. Case D represents a common day of summer in the hottest hours with average values of RH. Finally, cases E and F estimated the heat stress in the average daily summer temperature (considering different RH).
Figure 9 shows the resulting heat stress in the above-mentioned conditions and scenarios evaluated through the UTCI and classified according to the semantic scale of Błażejczyk et al. [
42]. The first two lines (A and B) show that during higher summer temperature unliveable conditions are reached with UTCI above 50. Moreover, during the maximum daily temperatures (C and D) extreme or very strong heat stress is reached in the city district (while in the surrounding rural areas, the heat stress is still moderate.). During these warmer hours of the summer days, the proposed mitigation strategies are not sufficient to considerably reduce discomfort in the districts. On the other hand, during the daily average summer temperature (E and F), the mitigation strategies begin to be significantly effective. Indeed, the solution with greenery increased by up to 30% allows one to reduce the human discomfort approximately from “strong” or “moderate” heat stress to “moderate” and “no” heat stress.
These results emphasize how mitigation strategies can be very important for the health of the population. For existing urban districts such as the Murattiano (in the central area of the city), the greenery can be increased up to 30% (on the basis of the areas that can be transformed into public green or garden roofs). On the contrary, in new neighborhoods (or growing districts) massive mitigation strategies could be considered by combining large urban green areas and clear surfaces.
To sum up, cities of southern Italy are severely affected by heat waves in the summer period. In the future, mitigation strategies will not be just a possibility but an essential need for the population’s health, as demonstrated by the results of
Figure 9.
5. Conclusions
The proposed work presents an extensive investigation and comparison of the UHII phenomenon in 344 urban districts of 7 European cities to identify positive and negative aspects of the different urban configurations. Moreover, the investigation of some virtuous examples of the attenuation of the phenomenon allows for defining useful mitigation strategies for the city of Bari. The applied methodological approach for the evaluation of the UHII exploits a multicriteria-based index able to evaluate the absolute max UHII in several urban districts by using open-source data.
The novelty of the proposed research is fourfold:
- (i)
For or the first time, the intensity map of the absolute max UHII is achieved for the city of Bari. Consequently, the urban districts most subject to high intensity level of the phenomenon have been pointed out;
- (ii)
An extensive comparison of 344 urban districts of 7 European cities is conducted in order to discuss positive and negative aspects of the investigated cities and identify virtuous examples in mitigating the phenomenon such as the districts of “Tiergarten” in Berlin, “Parco Bosco in Città” in Milan, “Lewisham” in London and “Moncloa-Aravaca” in Madrid;
- (iii)
For the first time, useful mitigation scenarios are proposed for a city in Puglia (southern Italy);
- (iv)
Advantages and disadvantages of interventions in the urban districts of Bari have been investigated in comparison with the other cities and by analyzing the potential heat stress during the summer period.
In particular, based on the
approach, four different mitigation scenarios have been proposed in the “Murattiano” district by demonstrating that the effect (7.11) can be reduced to 6.58 °C, 6.32 °C and 5.44°C by increasing the greenery up to 10%, 15% and 30%, respectively. It is worth noting that the reliability of the index-based analysis has been verified through the comparison of some districts, where more in-depth analyses were conducted by previous studies [
18]. Indeed, in the case of Bari, the difference between the real data of districts [
23] and the simulation through the index differs by no more than 0.5 °C.
The limitations of the proposed study concern the actual damage that the heat island effect can bring to human health, which is still unknown in southern Italy. In the proposed work, a preliminary evaluation based on the heat stress was carried out to achieve an indicative value of human discomfort. On the other hand, future research will investigate the increase in heat-related mortality in correlation with the urban heat island effect by exploiting the achieved intensity map. Beyond the heat-related mortality, additional research will be focused on the influence of the sea breeze on the UHII in relation to the characteristics of the city.


