
A Multi-Agent Intrusion Detection System Optimized by a Deep Reinforcement Learning Approach with a Dataset Enlarged Using a Generative Model to Reduce the Bias Effect


Abstract
:1. Introduction
2. Related Works
2.1. Balancing Datasets Comprising Attacks and Non-Attacks
2.2. Designing Multi-Agent Intrusion Detection Systems
2.3. Designing Multi-Agent Intrusion Detection Systems with Balanced Datasets Comprising Attacks and Non-Attacks
3. Methodology
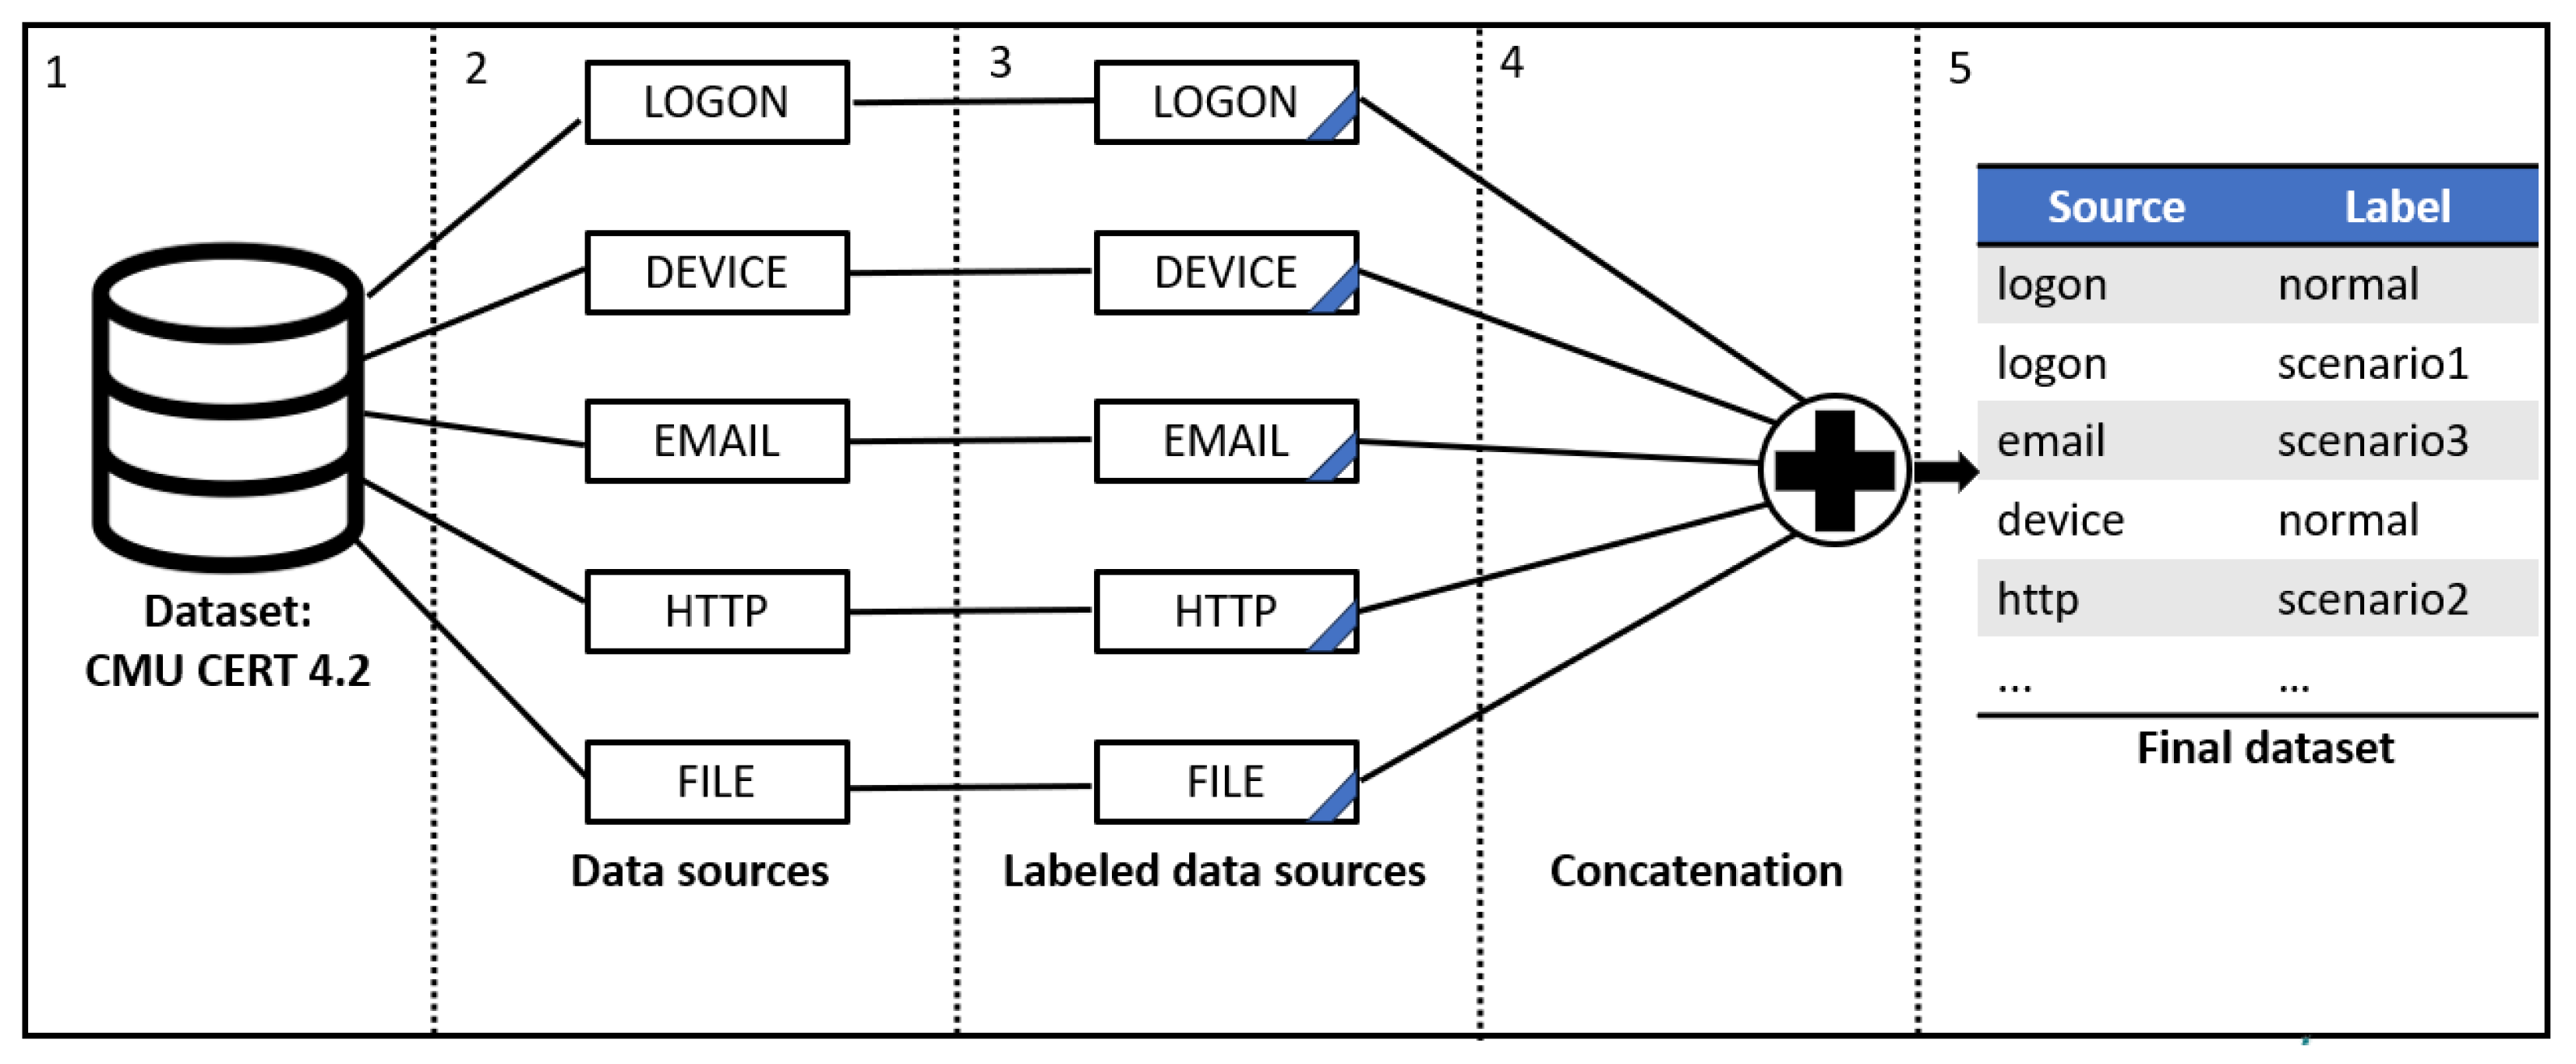
3.1. Dataset
- Logon corresponds to session auditing logs inside an information system, containing the fields id, date, user, pc, and activity (logon/logoff). There are 427,628 entries, among which 198 are cyberattack data (0.046% of the total entries).
- Device corresponds to external device auditing logs inside an information system, containing the fields id, date, user, pc, and activity (connect/disconnect). There are 205,476 entries, among which 2786 are cyberattack data (1.37% of the total entries).
- Http corresponds to the HTTP requests made by the users inside an information system, containing the fields id, date, user, pc, url, and content. There are 28,438,284 entries, among which 3860 are cyberattack data (0.013% of the total entries).
- Email corresponds to the emails sent within an information system (which can be sent inside and outside the information system), containing the fields id, date, user, pc, to, cc, bcc, from, size, attachment_count, and content. There are 1,315,459 entries among which 469 are cyberattack data (0.035% of the total entries).
- File corresponds to a file auditing log inside an information system, containing the fields id, date, user, pc, to, filename, and content. There are 222,801 entries among which 10 are cyberattack data (0.004% of the total entries).

- Scenario 1: A user who did not previously use removable drives or work after hours begins logging in after hours, using a removable drive, and uploading data to wikileaks.org. The user leaves the organization shortly thereafter.
- Scenario 2: A user begins surfing job websites and soliciting employment from a competitor. Before leaving the company, the user uses a thumb drive (at significantly higher rates than what the user used to do previously) to steal data.
- Scenario 3: A system administrator becomes disgruntled. He downloads a keylogger and uses a thumb drive to transfer it to his supervisor’s machine. The next day, he uses the collected keylogs to log in as his supervisor and send out an alarming mass email, causing panic in the organization. He leaves the organization immediately.
3.2. Data Pre-Processing
| Algorithm 1 Data pre-processing |
|
| Algorithm 2 Data adaptation for multi-agent RL |
|
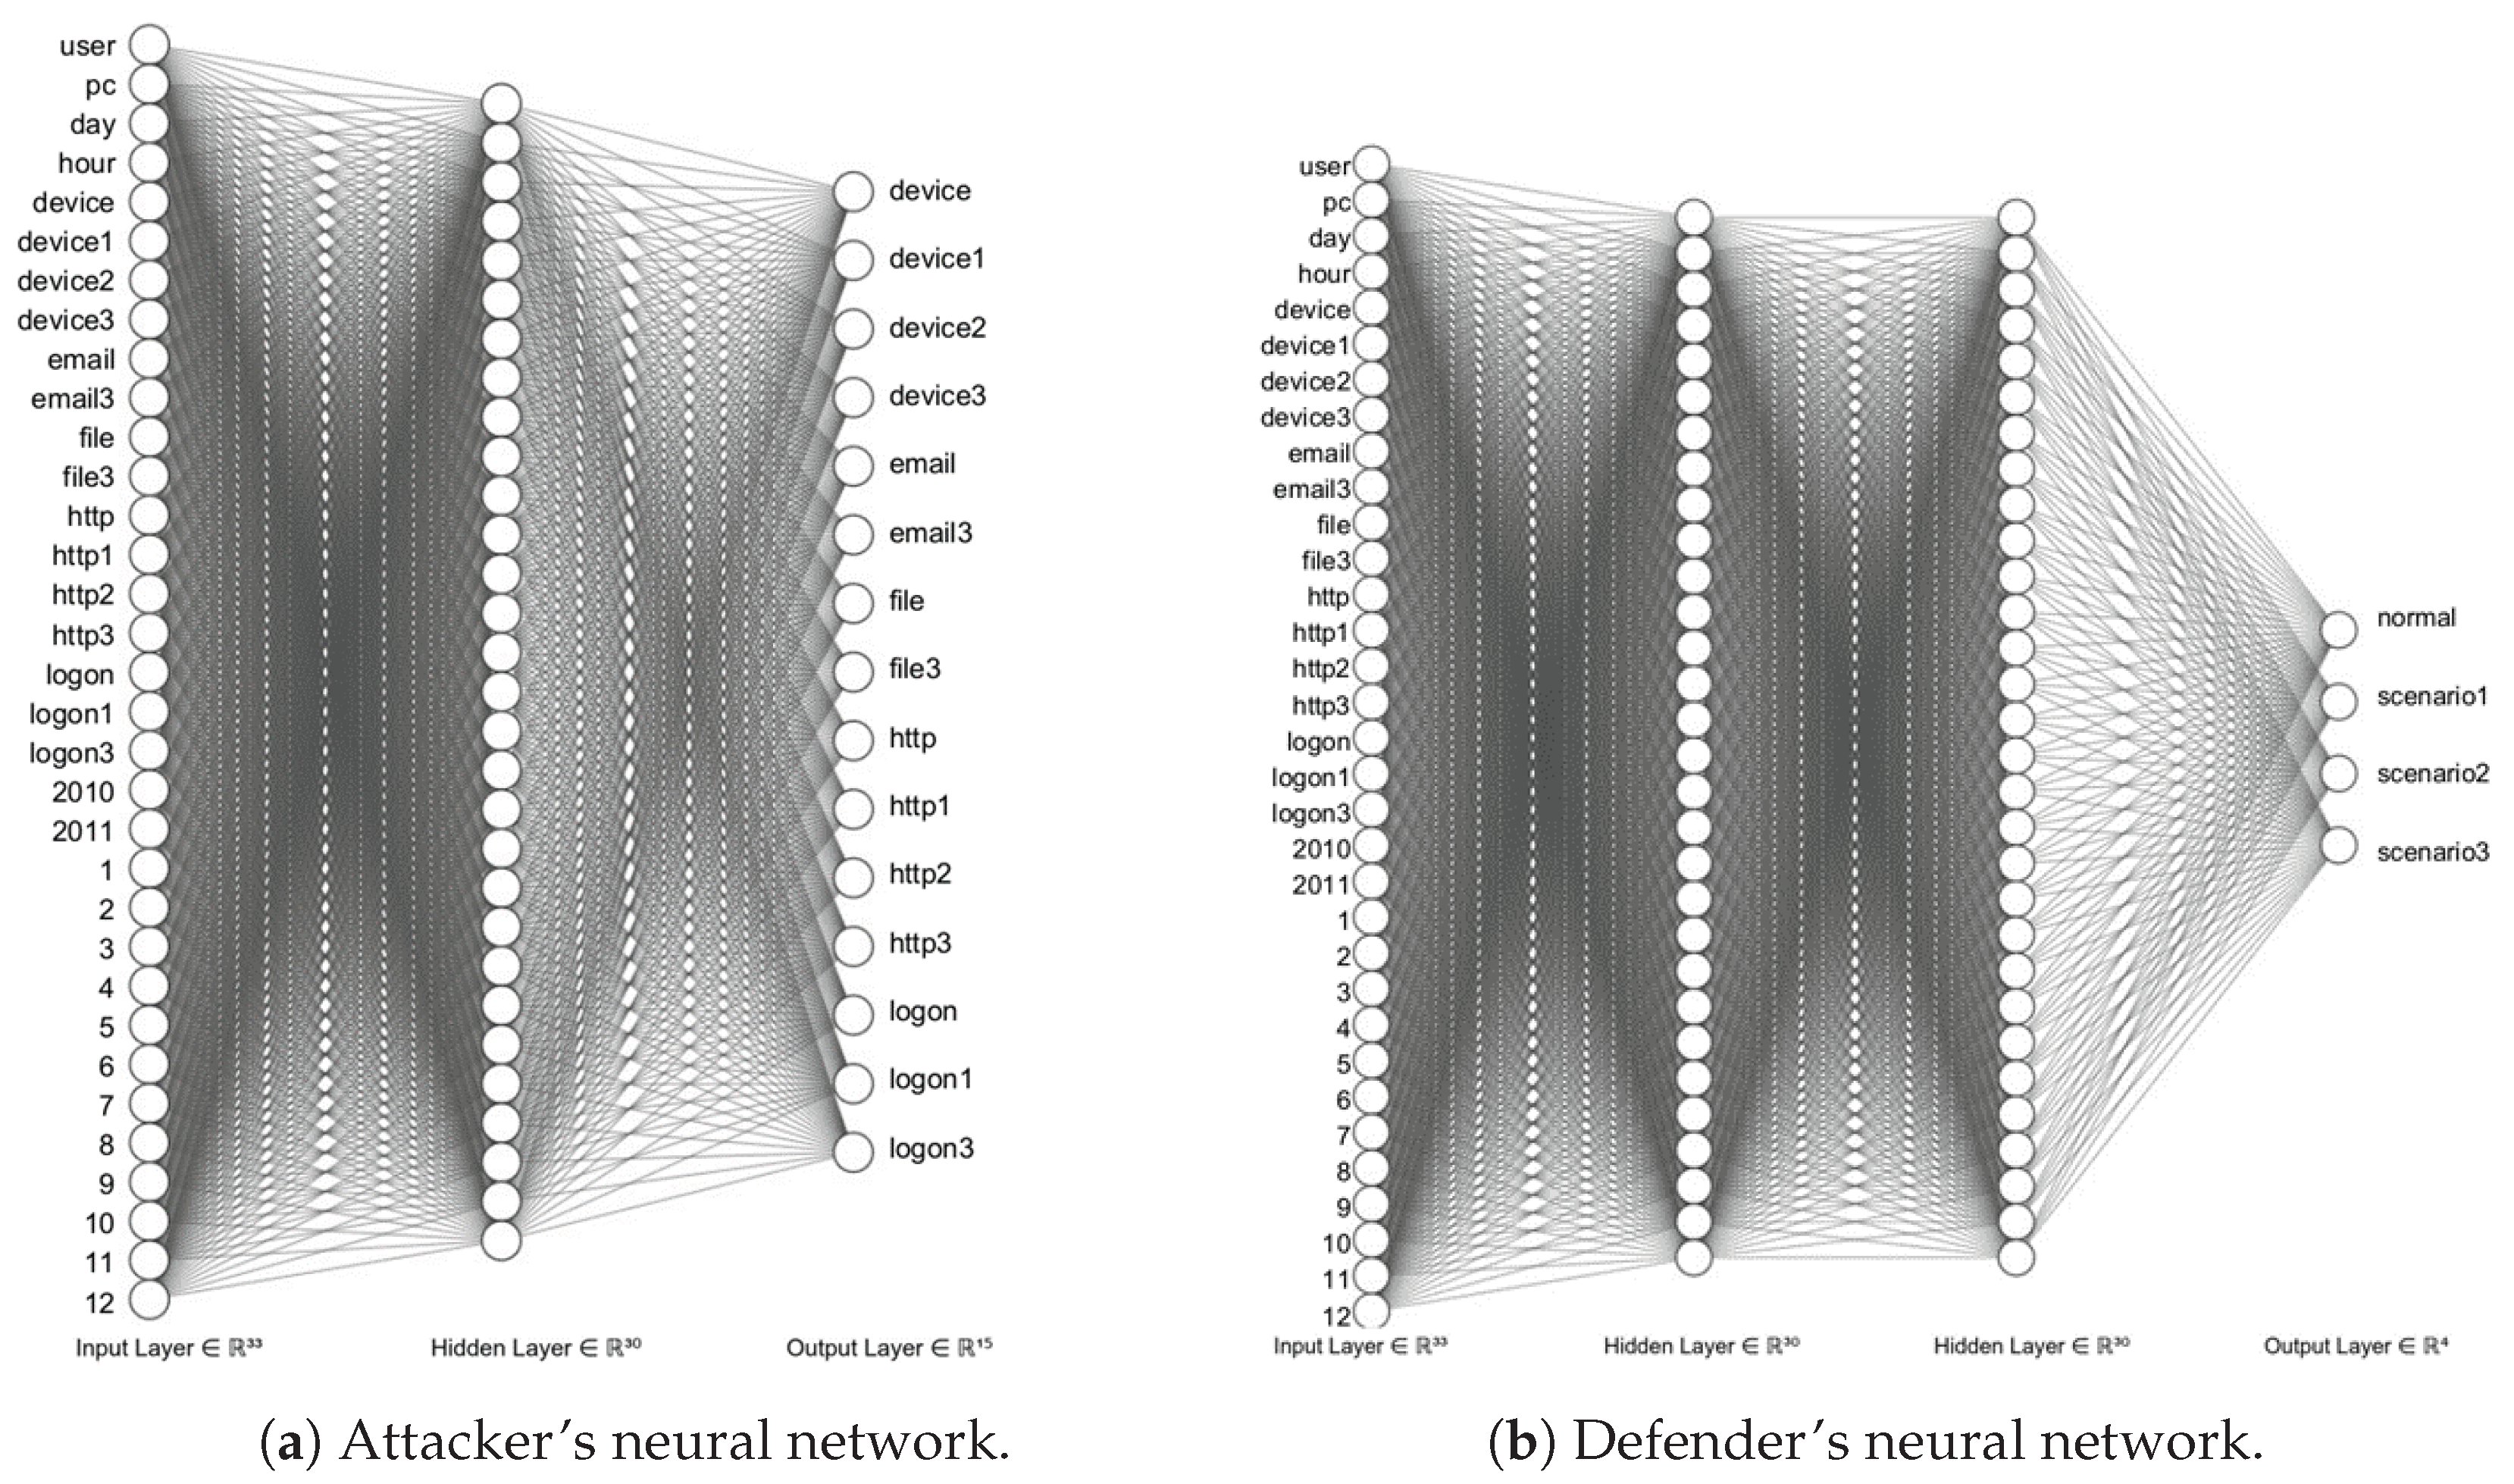
- Normal scenario (i.e., non-attack scenario) with the following classes (i.e., labels): logon, device, http, email, file;
- Scenario 1 with the following classes (i.e., labels): logon1, device1, http1;
- Scenario 2 with the following classes (i.e., labels): device2, http2;
- Scenario 3 with the following classes (i.e., labels): logon3, device3, email3, http3, file3.
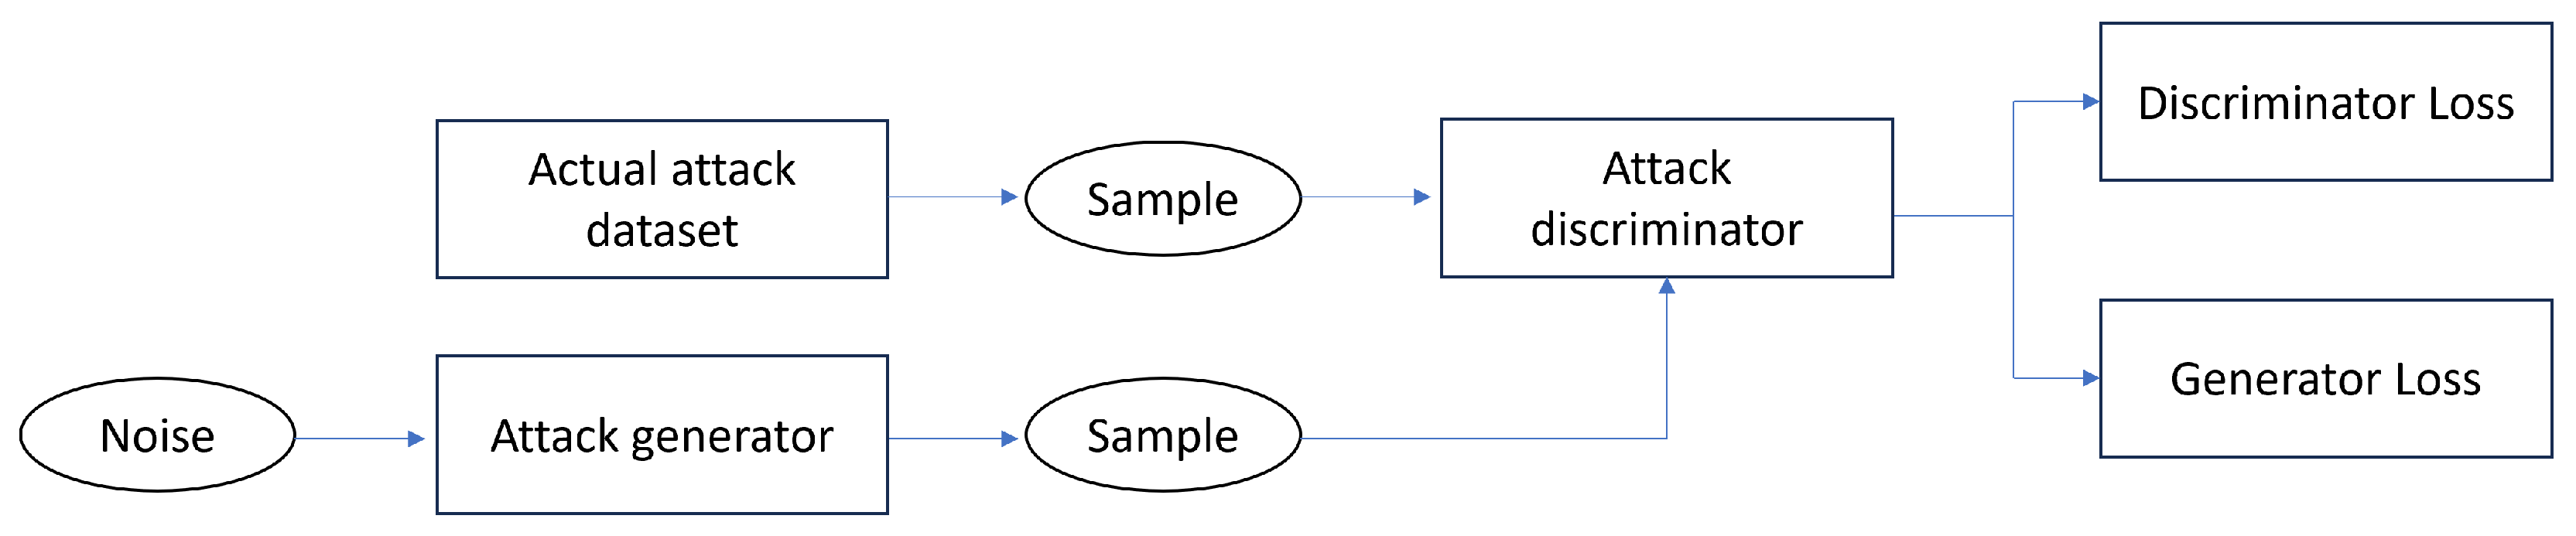
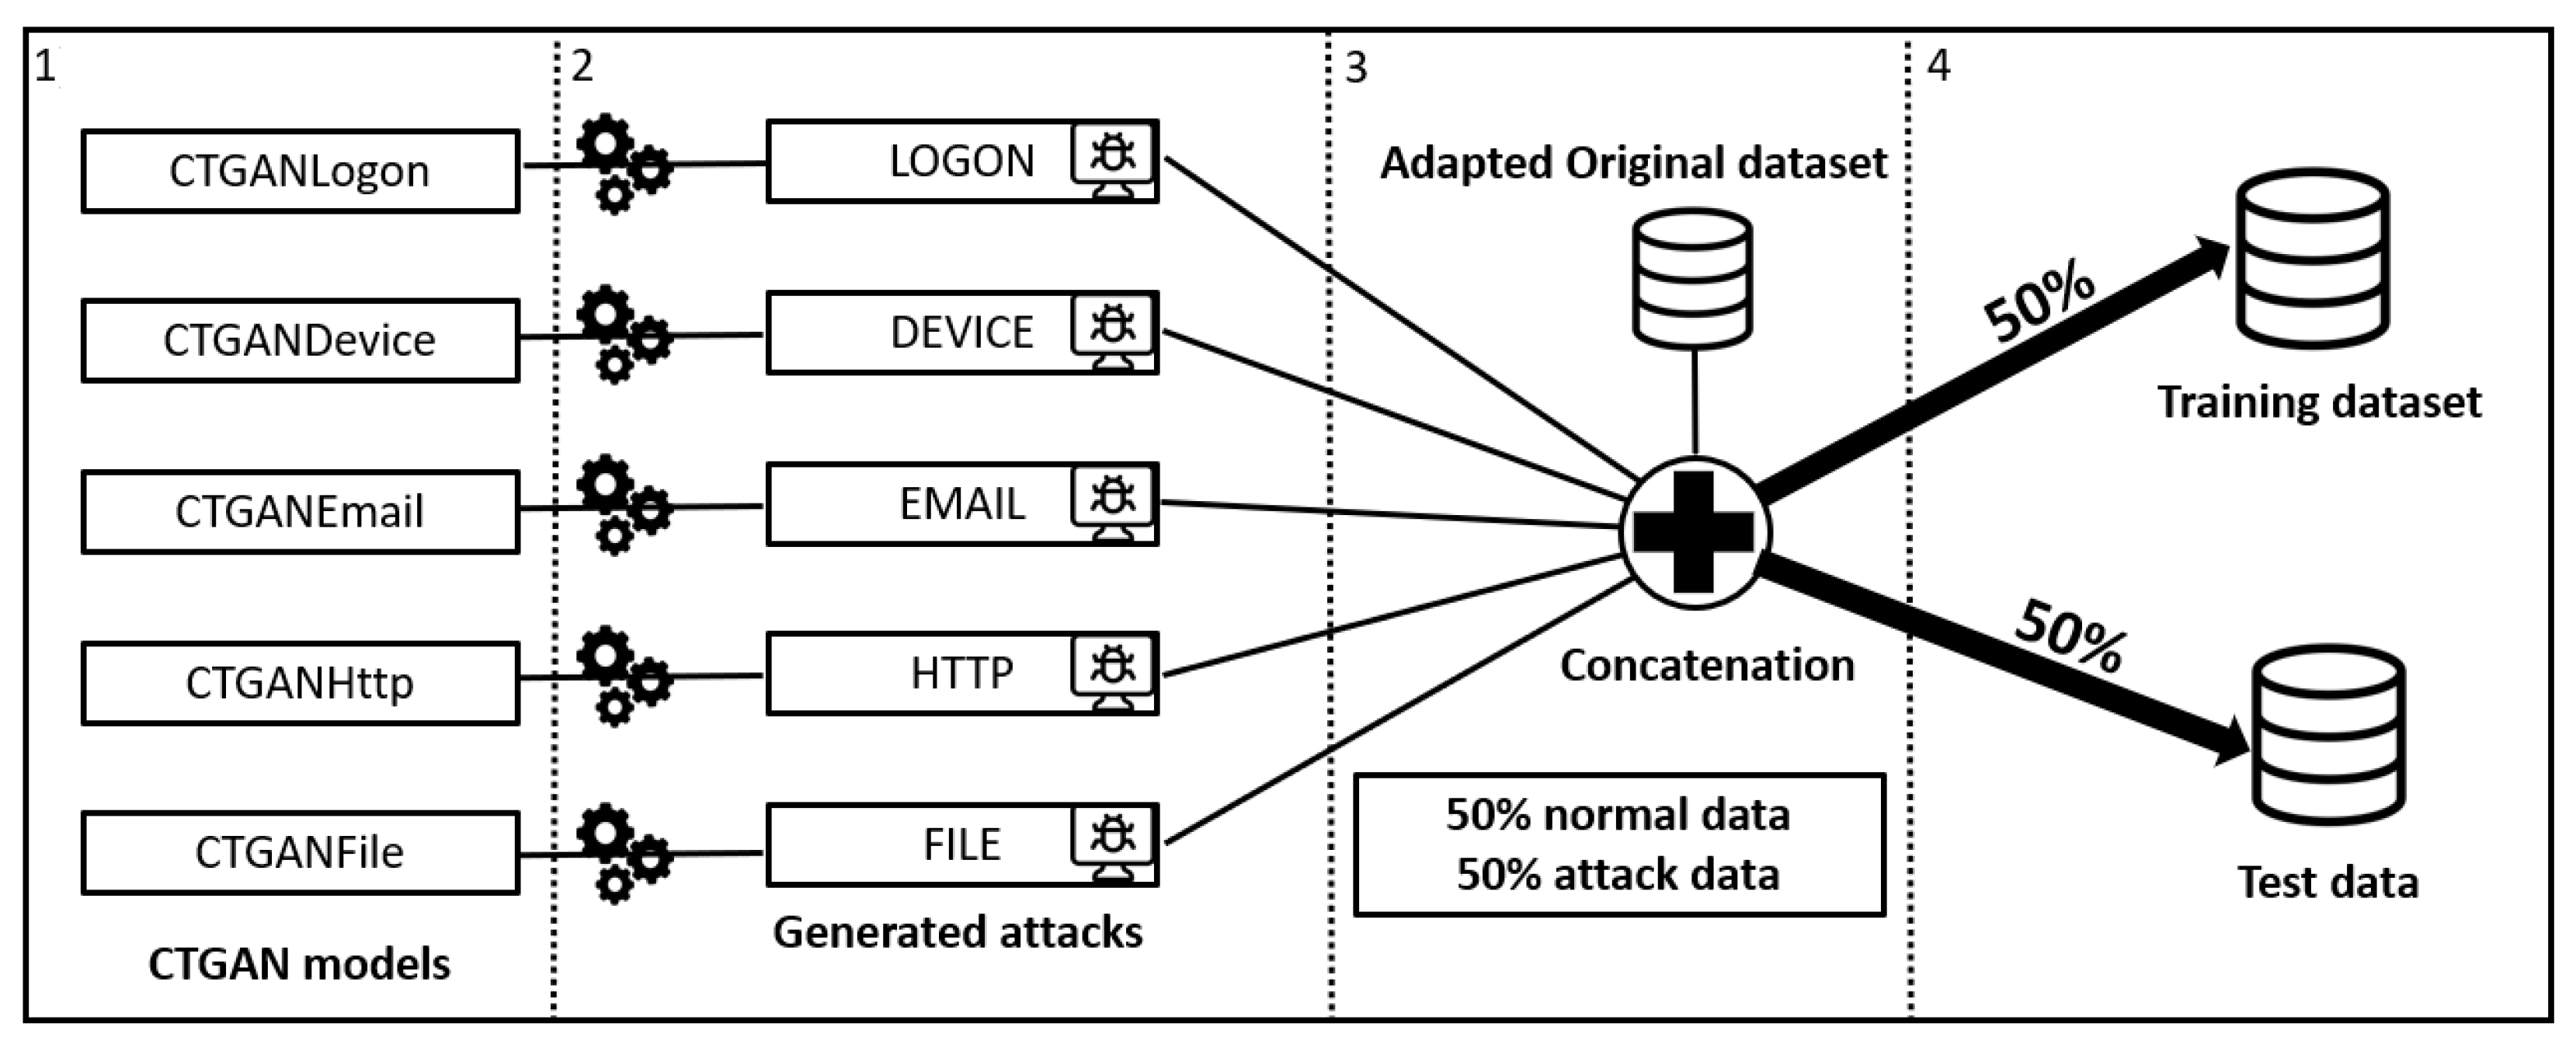
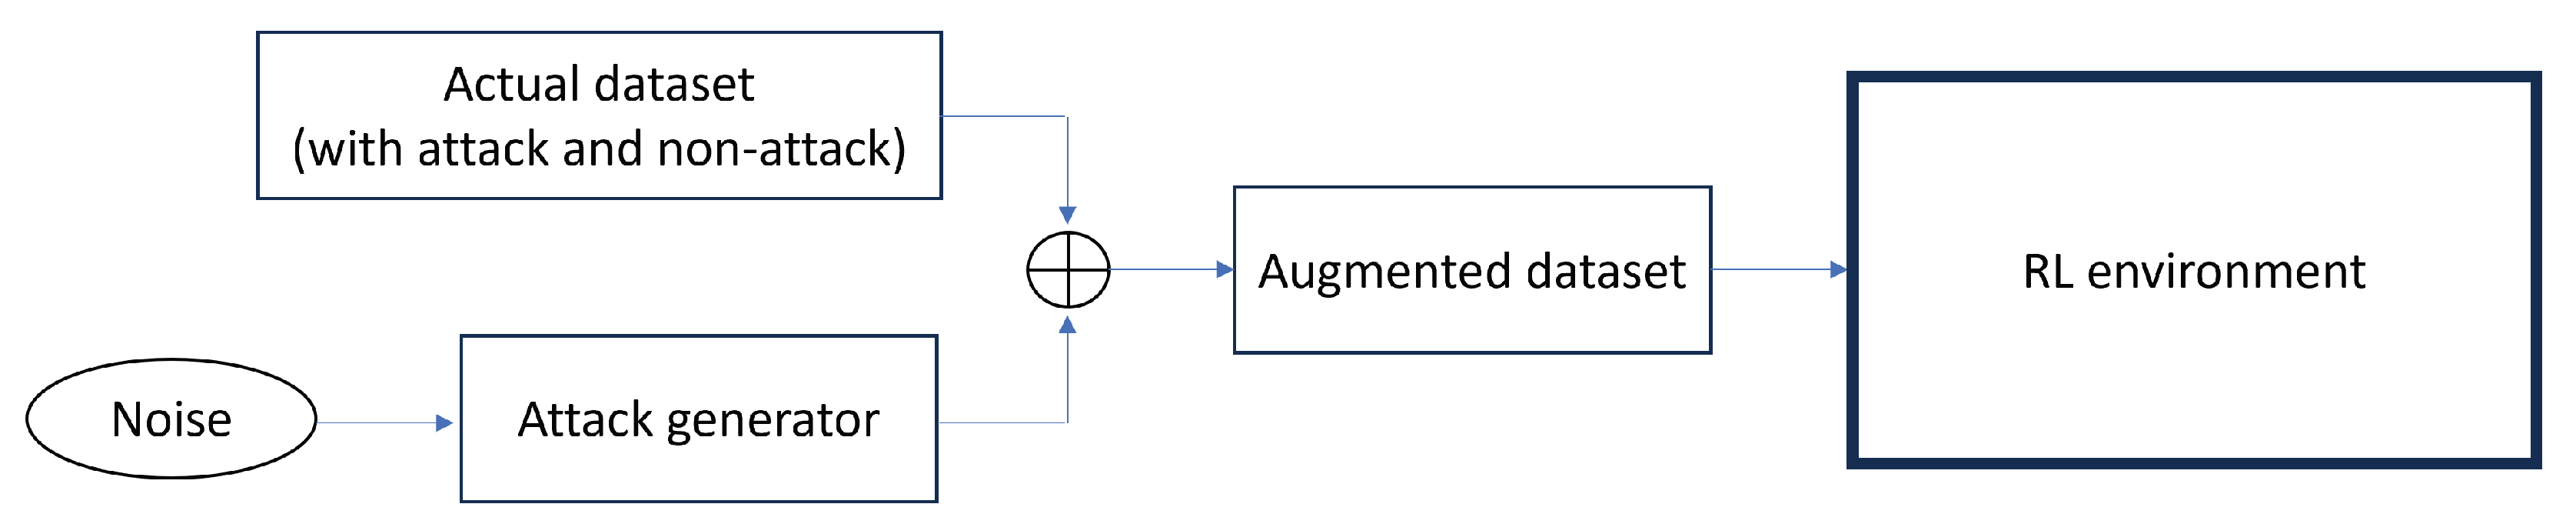
3.3. Conditional Tabular Generative Adversarial Network (CTGAN)
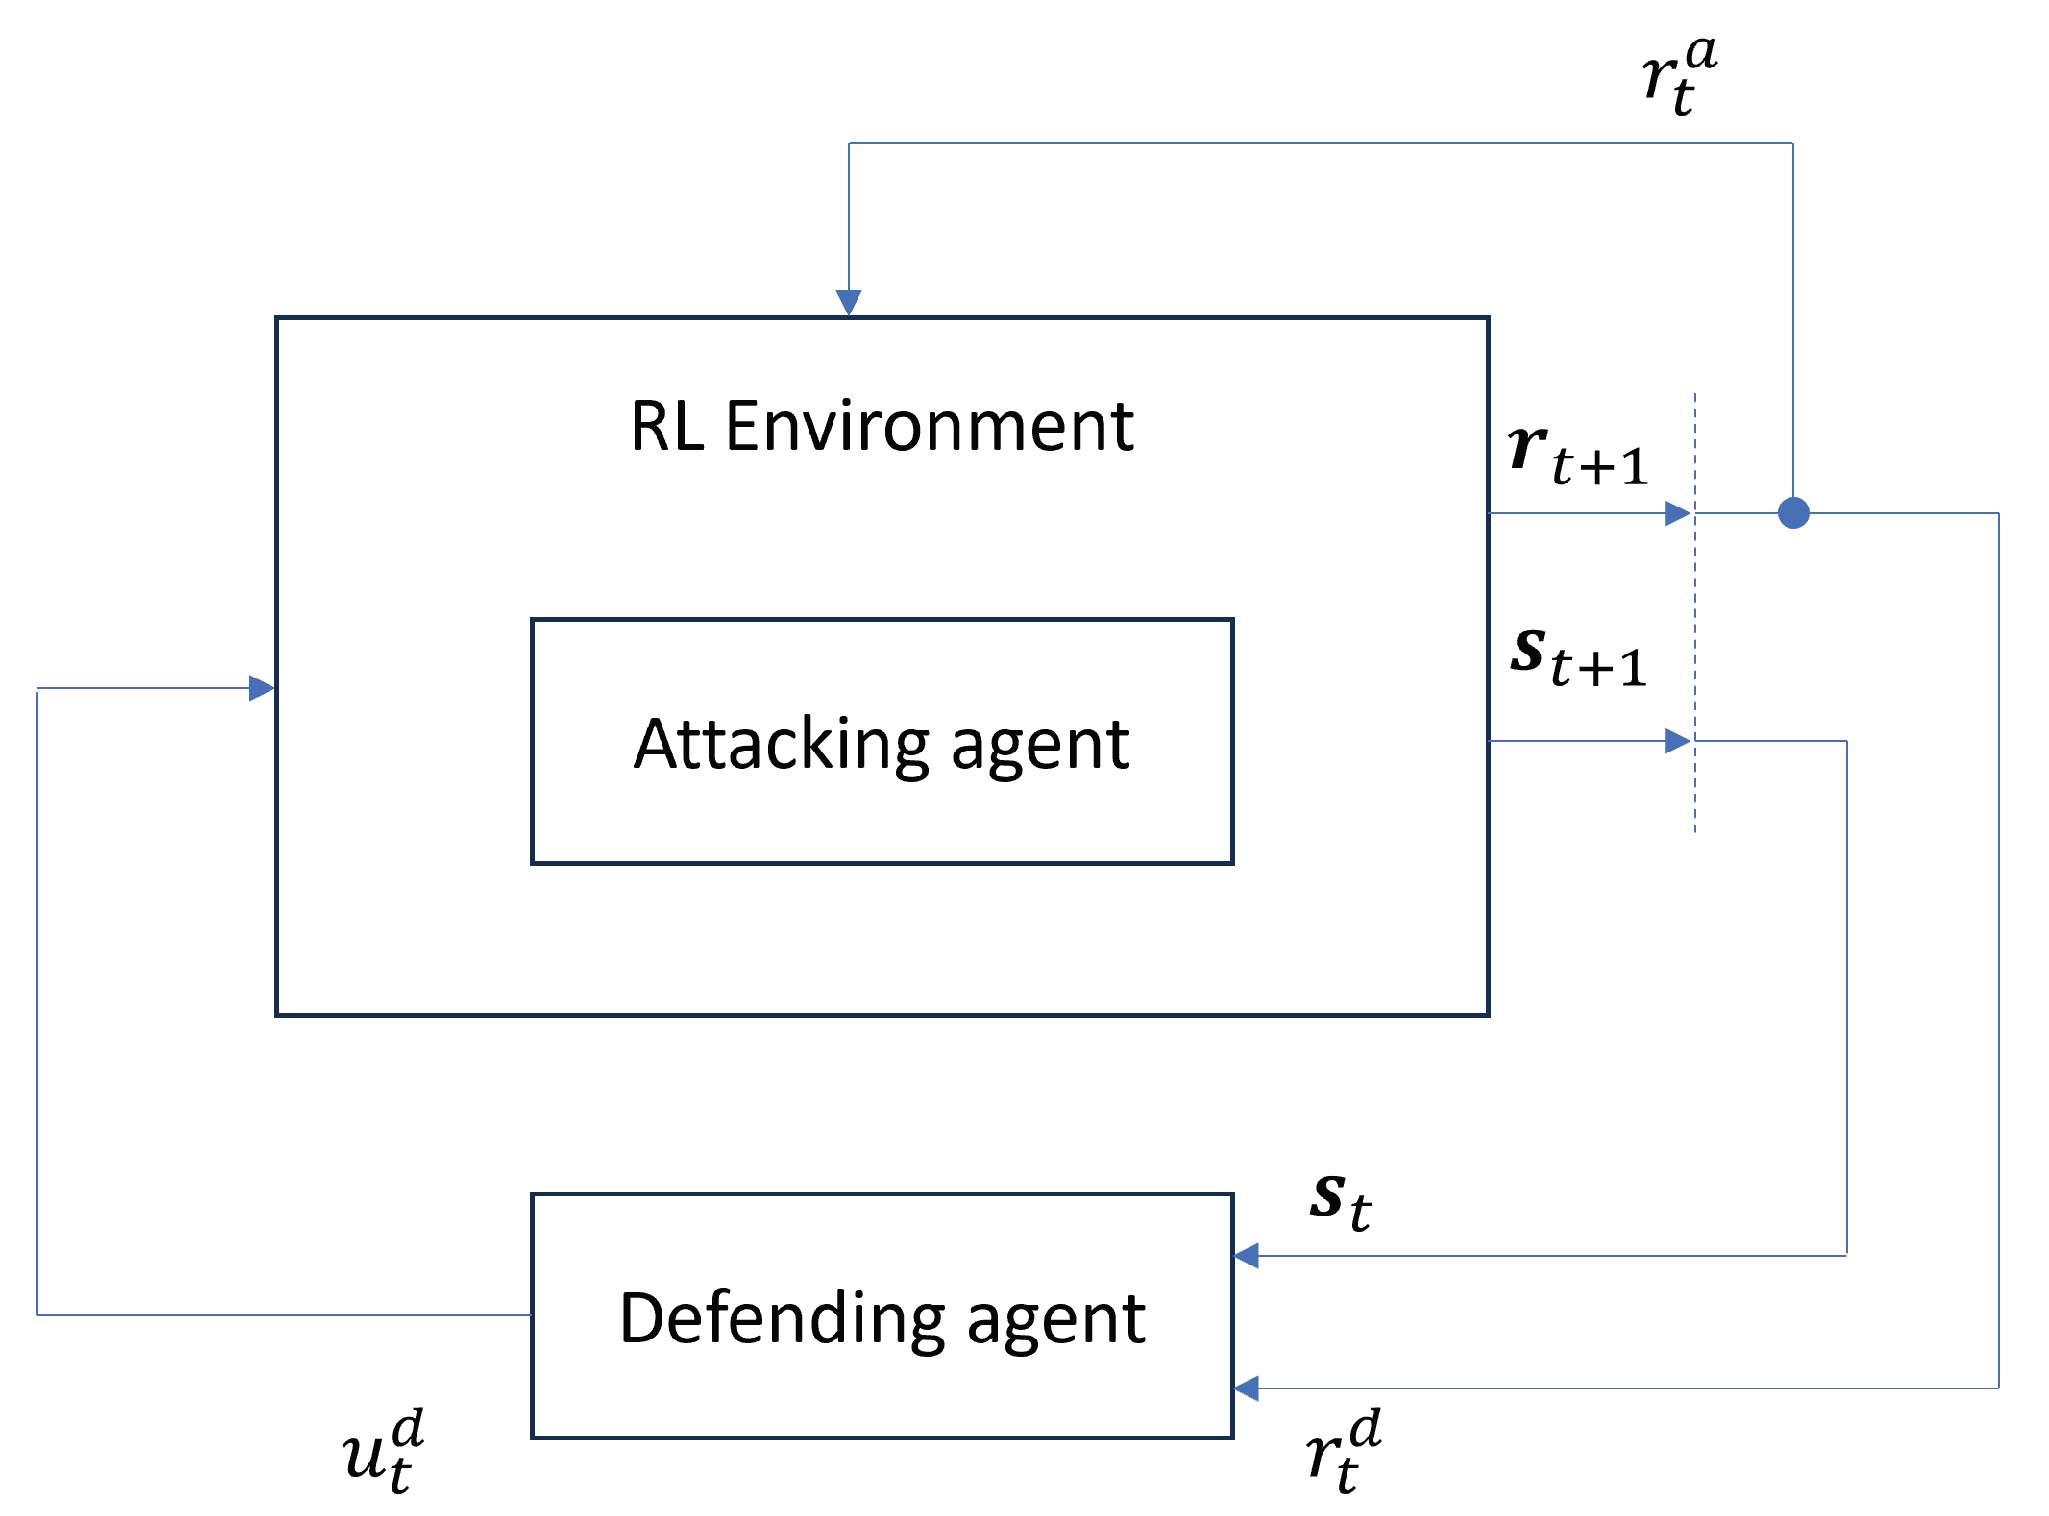
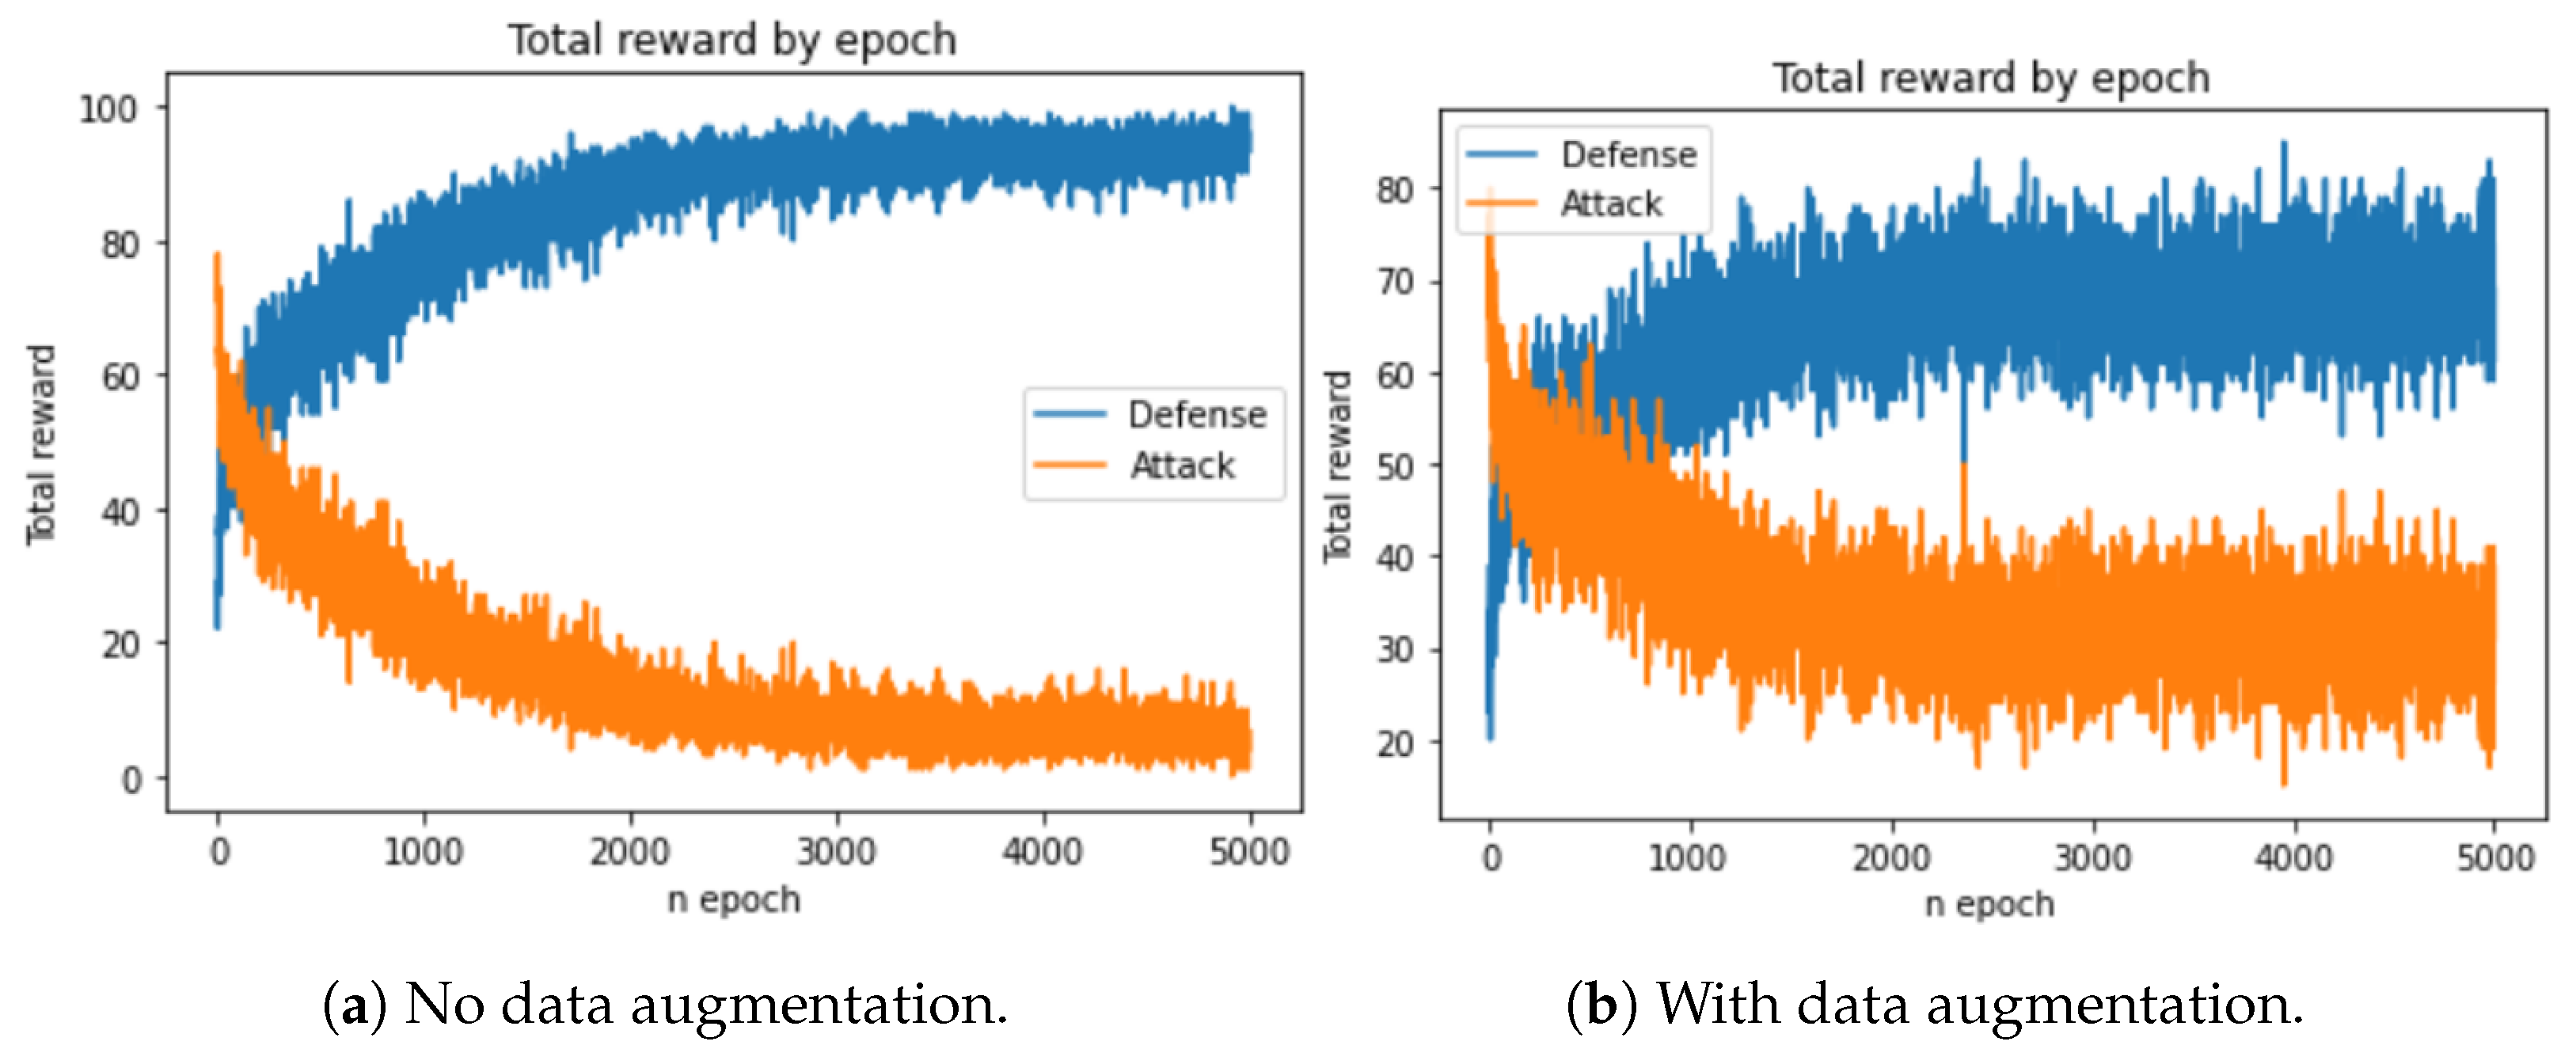
3.4. Adversarial Environment Reinforcement Learning (AE-RL)
4. Results and Discussion
5. Conclusions and Future Work
Author Contributions
Funding
Data Availability Statement
Acknowledgments
Conflicts of Interest
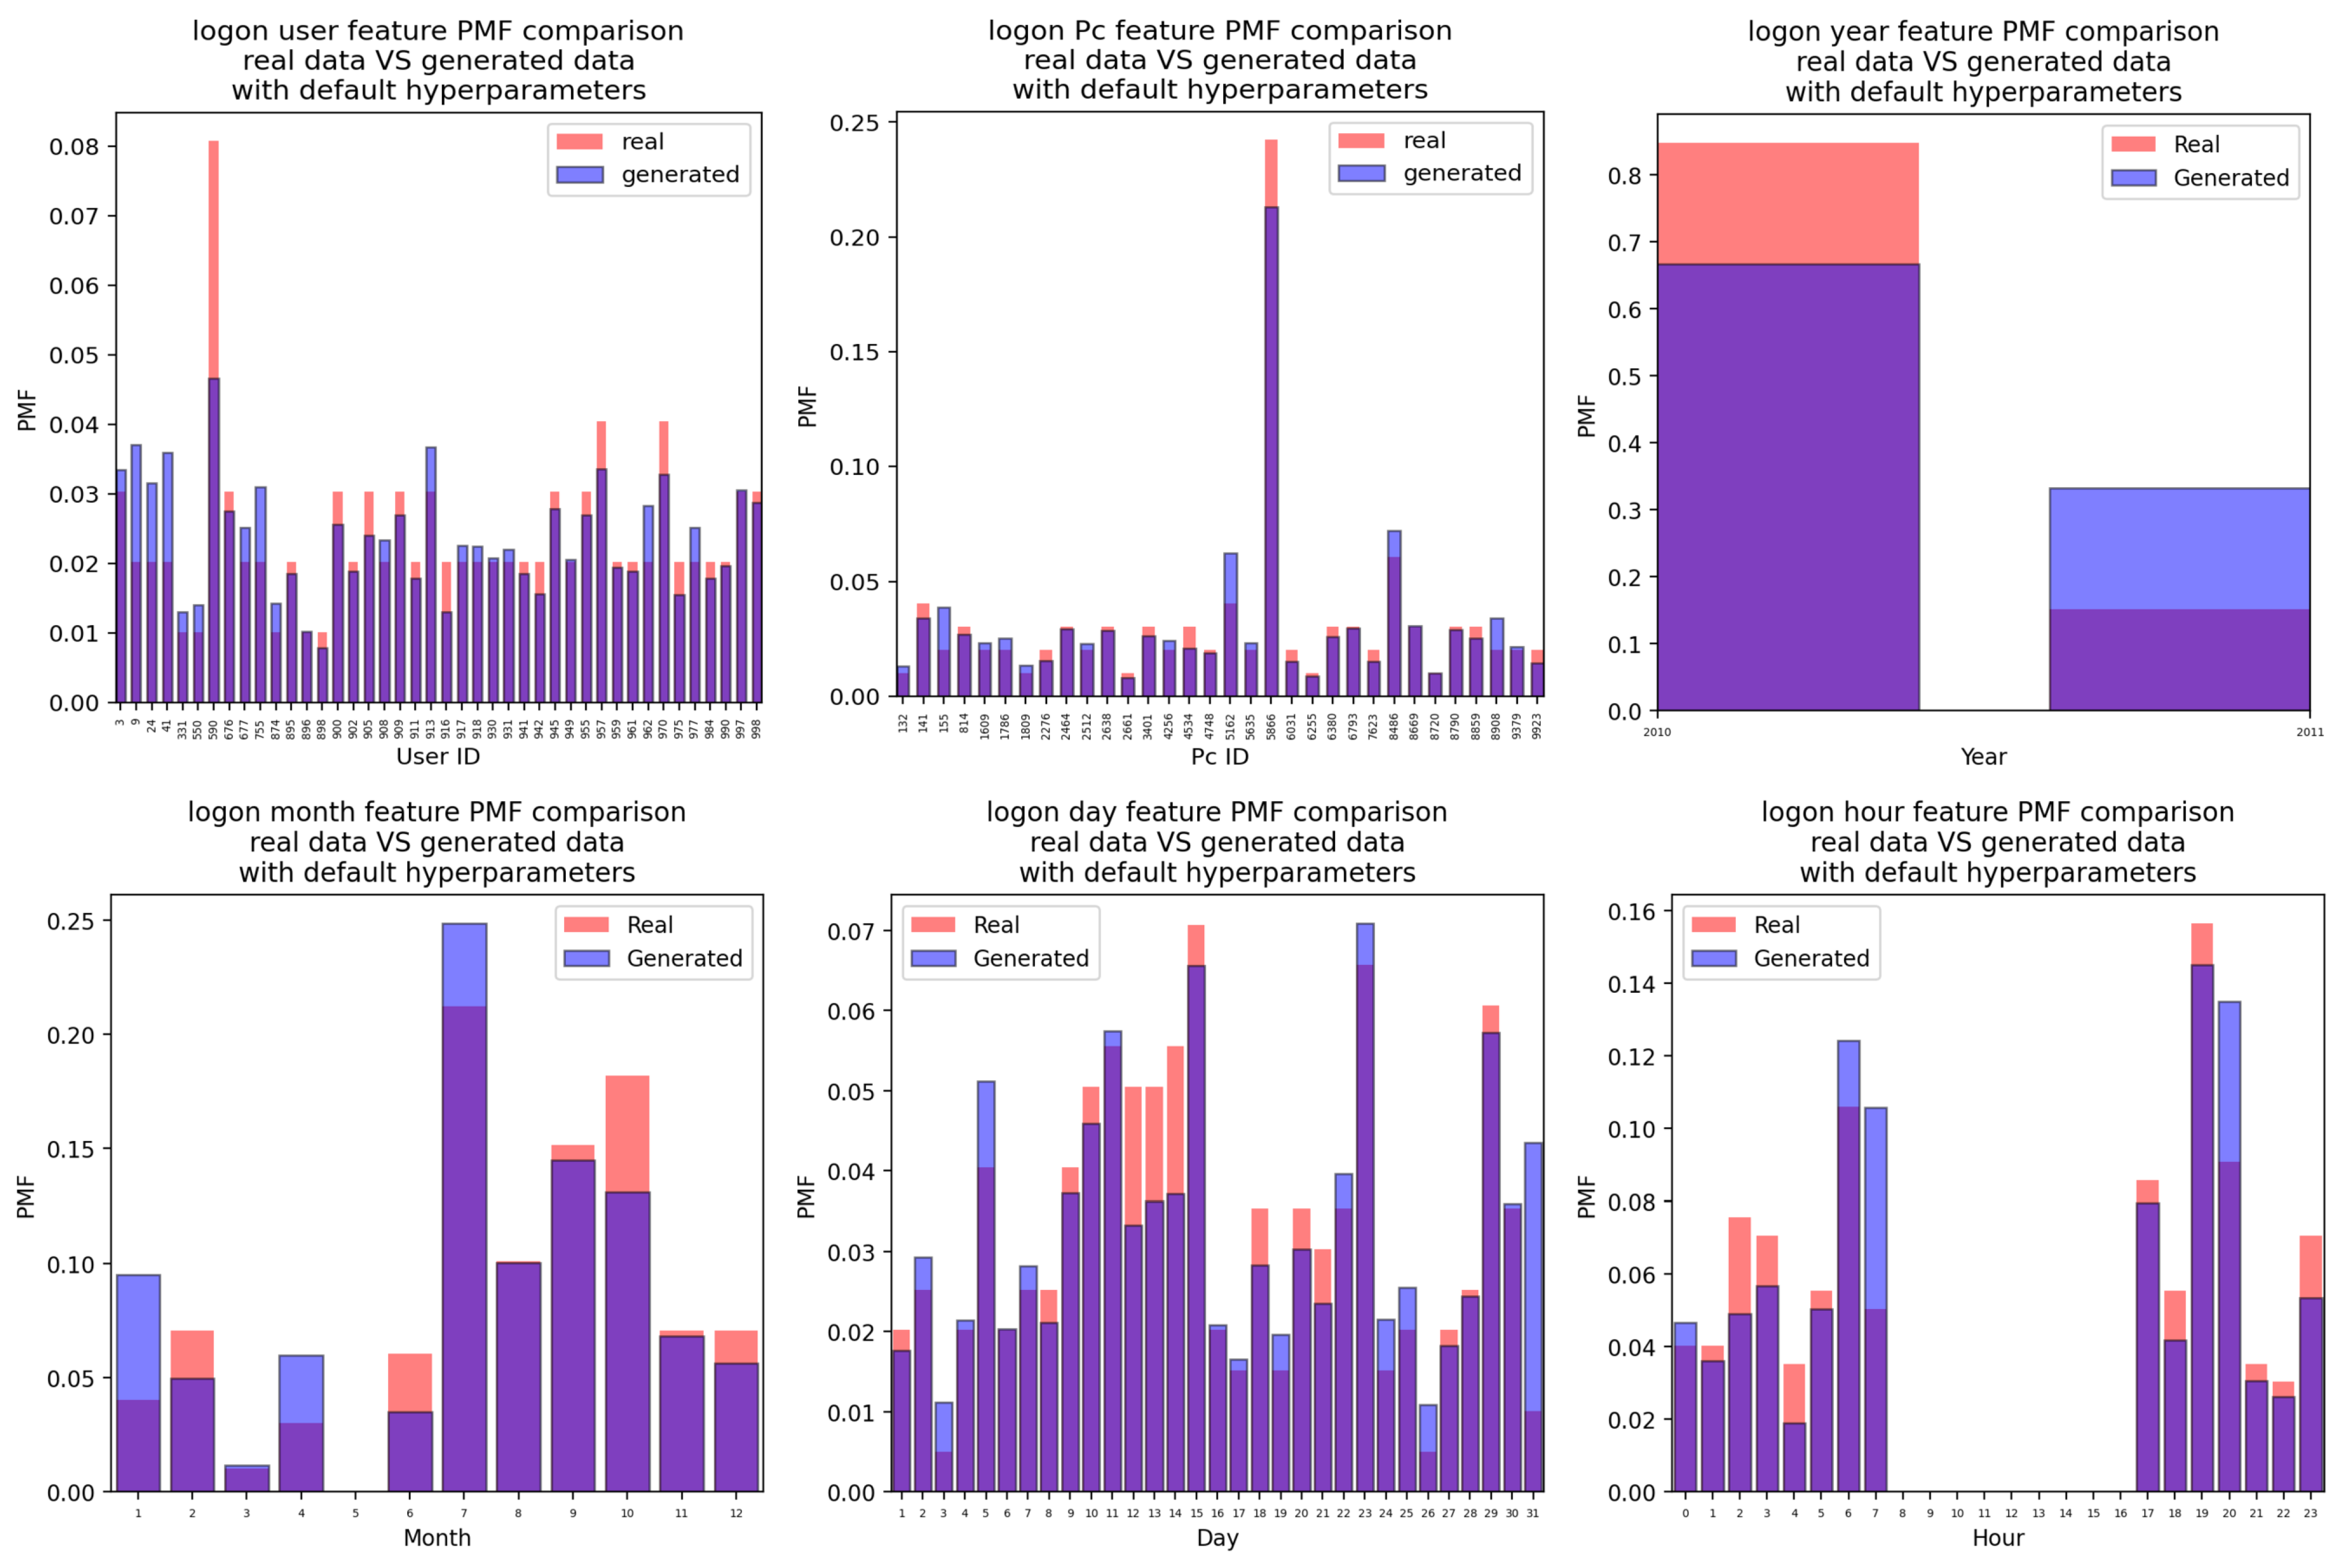
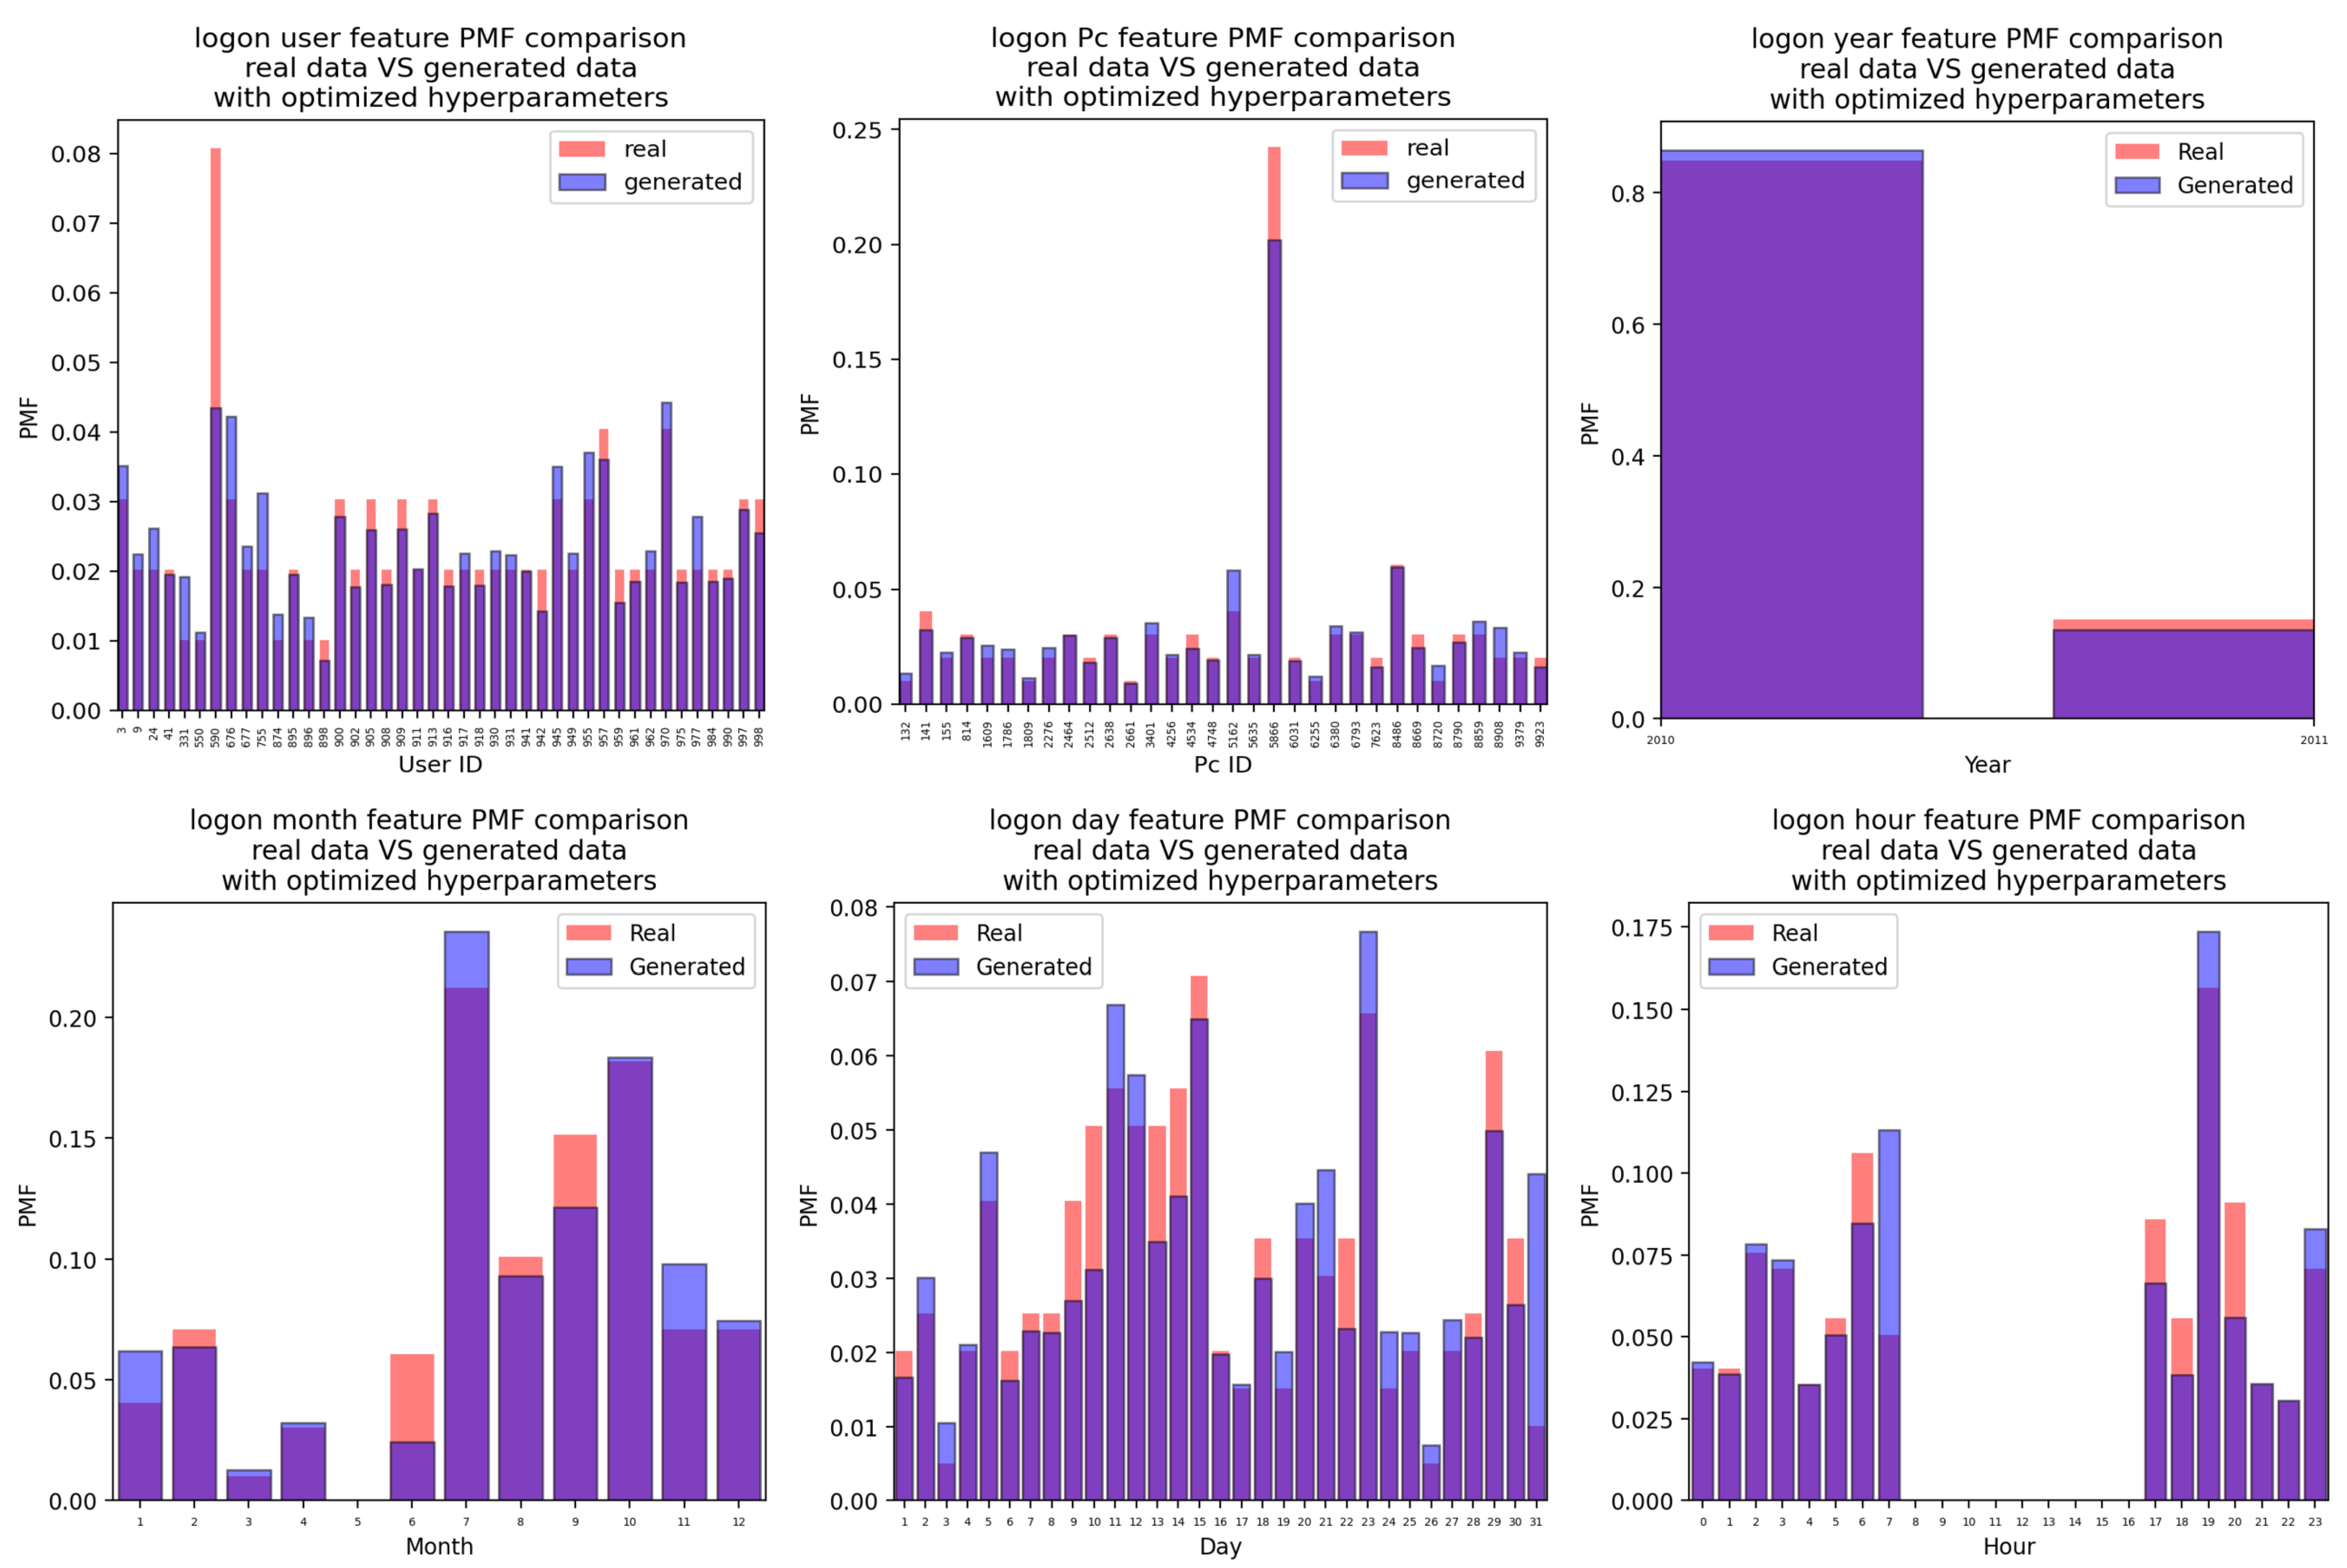
Appendix A. The Comparison of the Probability Mass Functions (PMFs) of the Original CMU-CERT Attacks to the PMFs of the Attacks Generated with the CTGAN
Appendix A.1. Logon Attacks
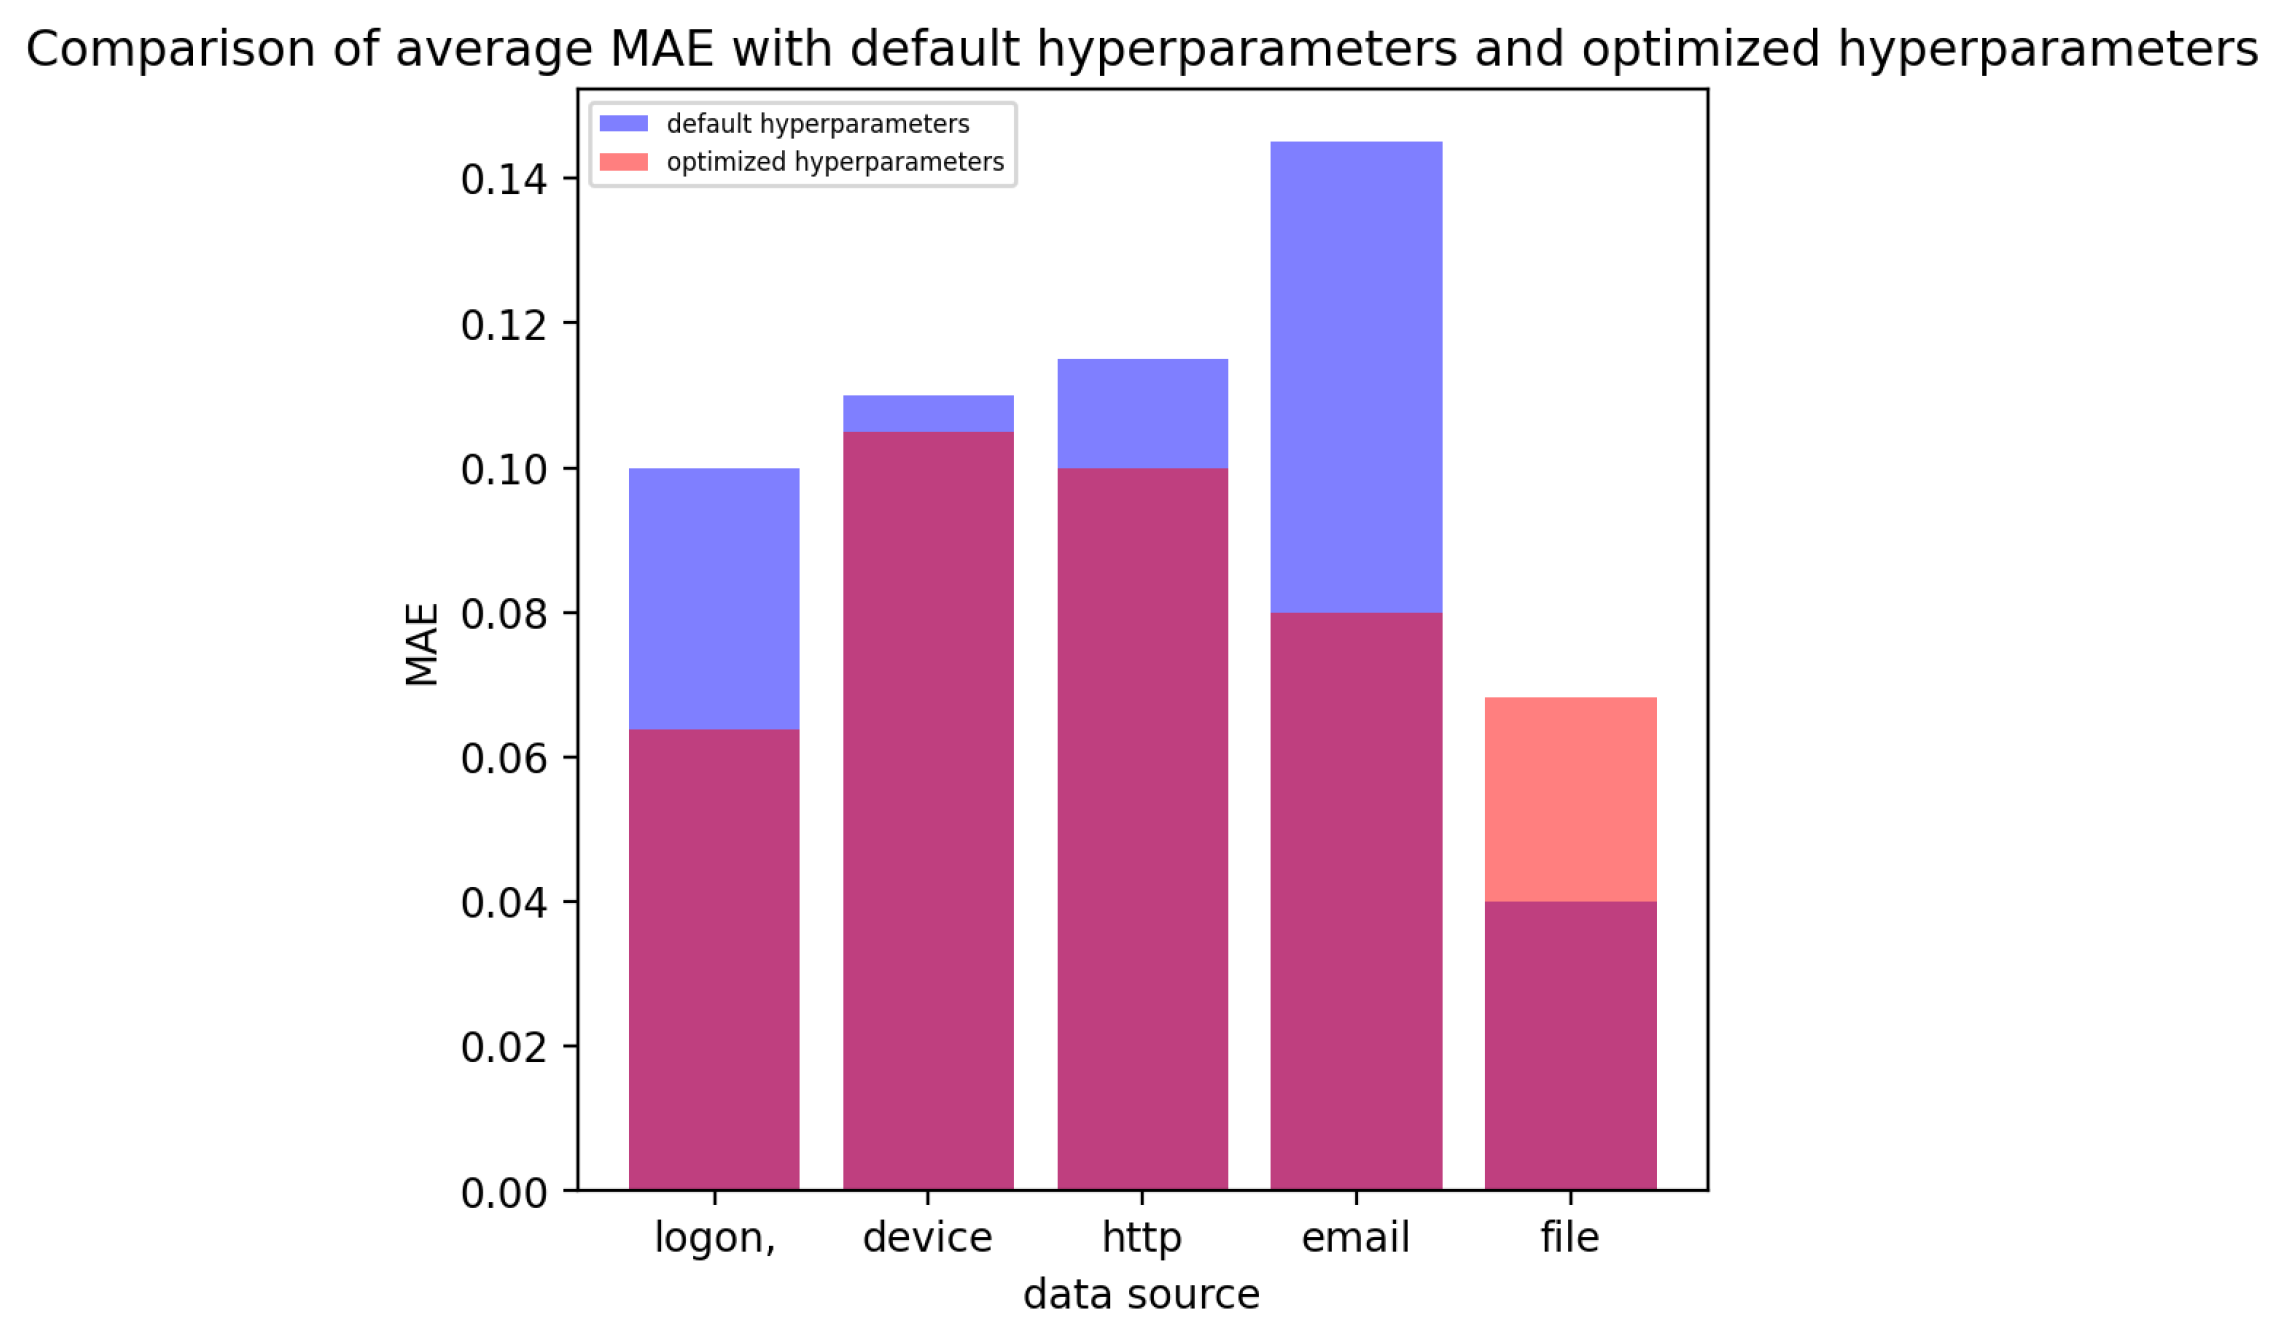
Appendix A.1.1. For the Case of the Attacks Generated Using the CTGAN with Default Hyperparameter Values

Appendix A.1.2. For the Case of the Attacks Generated Using the CTGAN with Optimized Hyperparameter Values

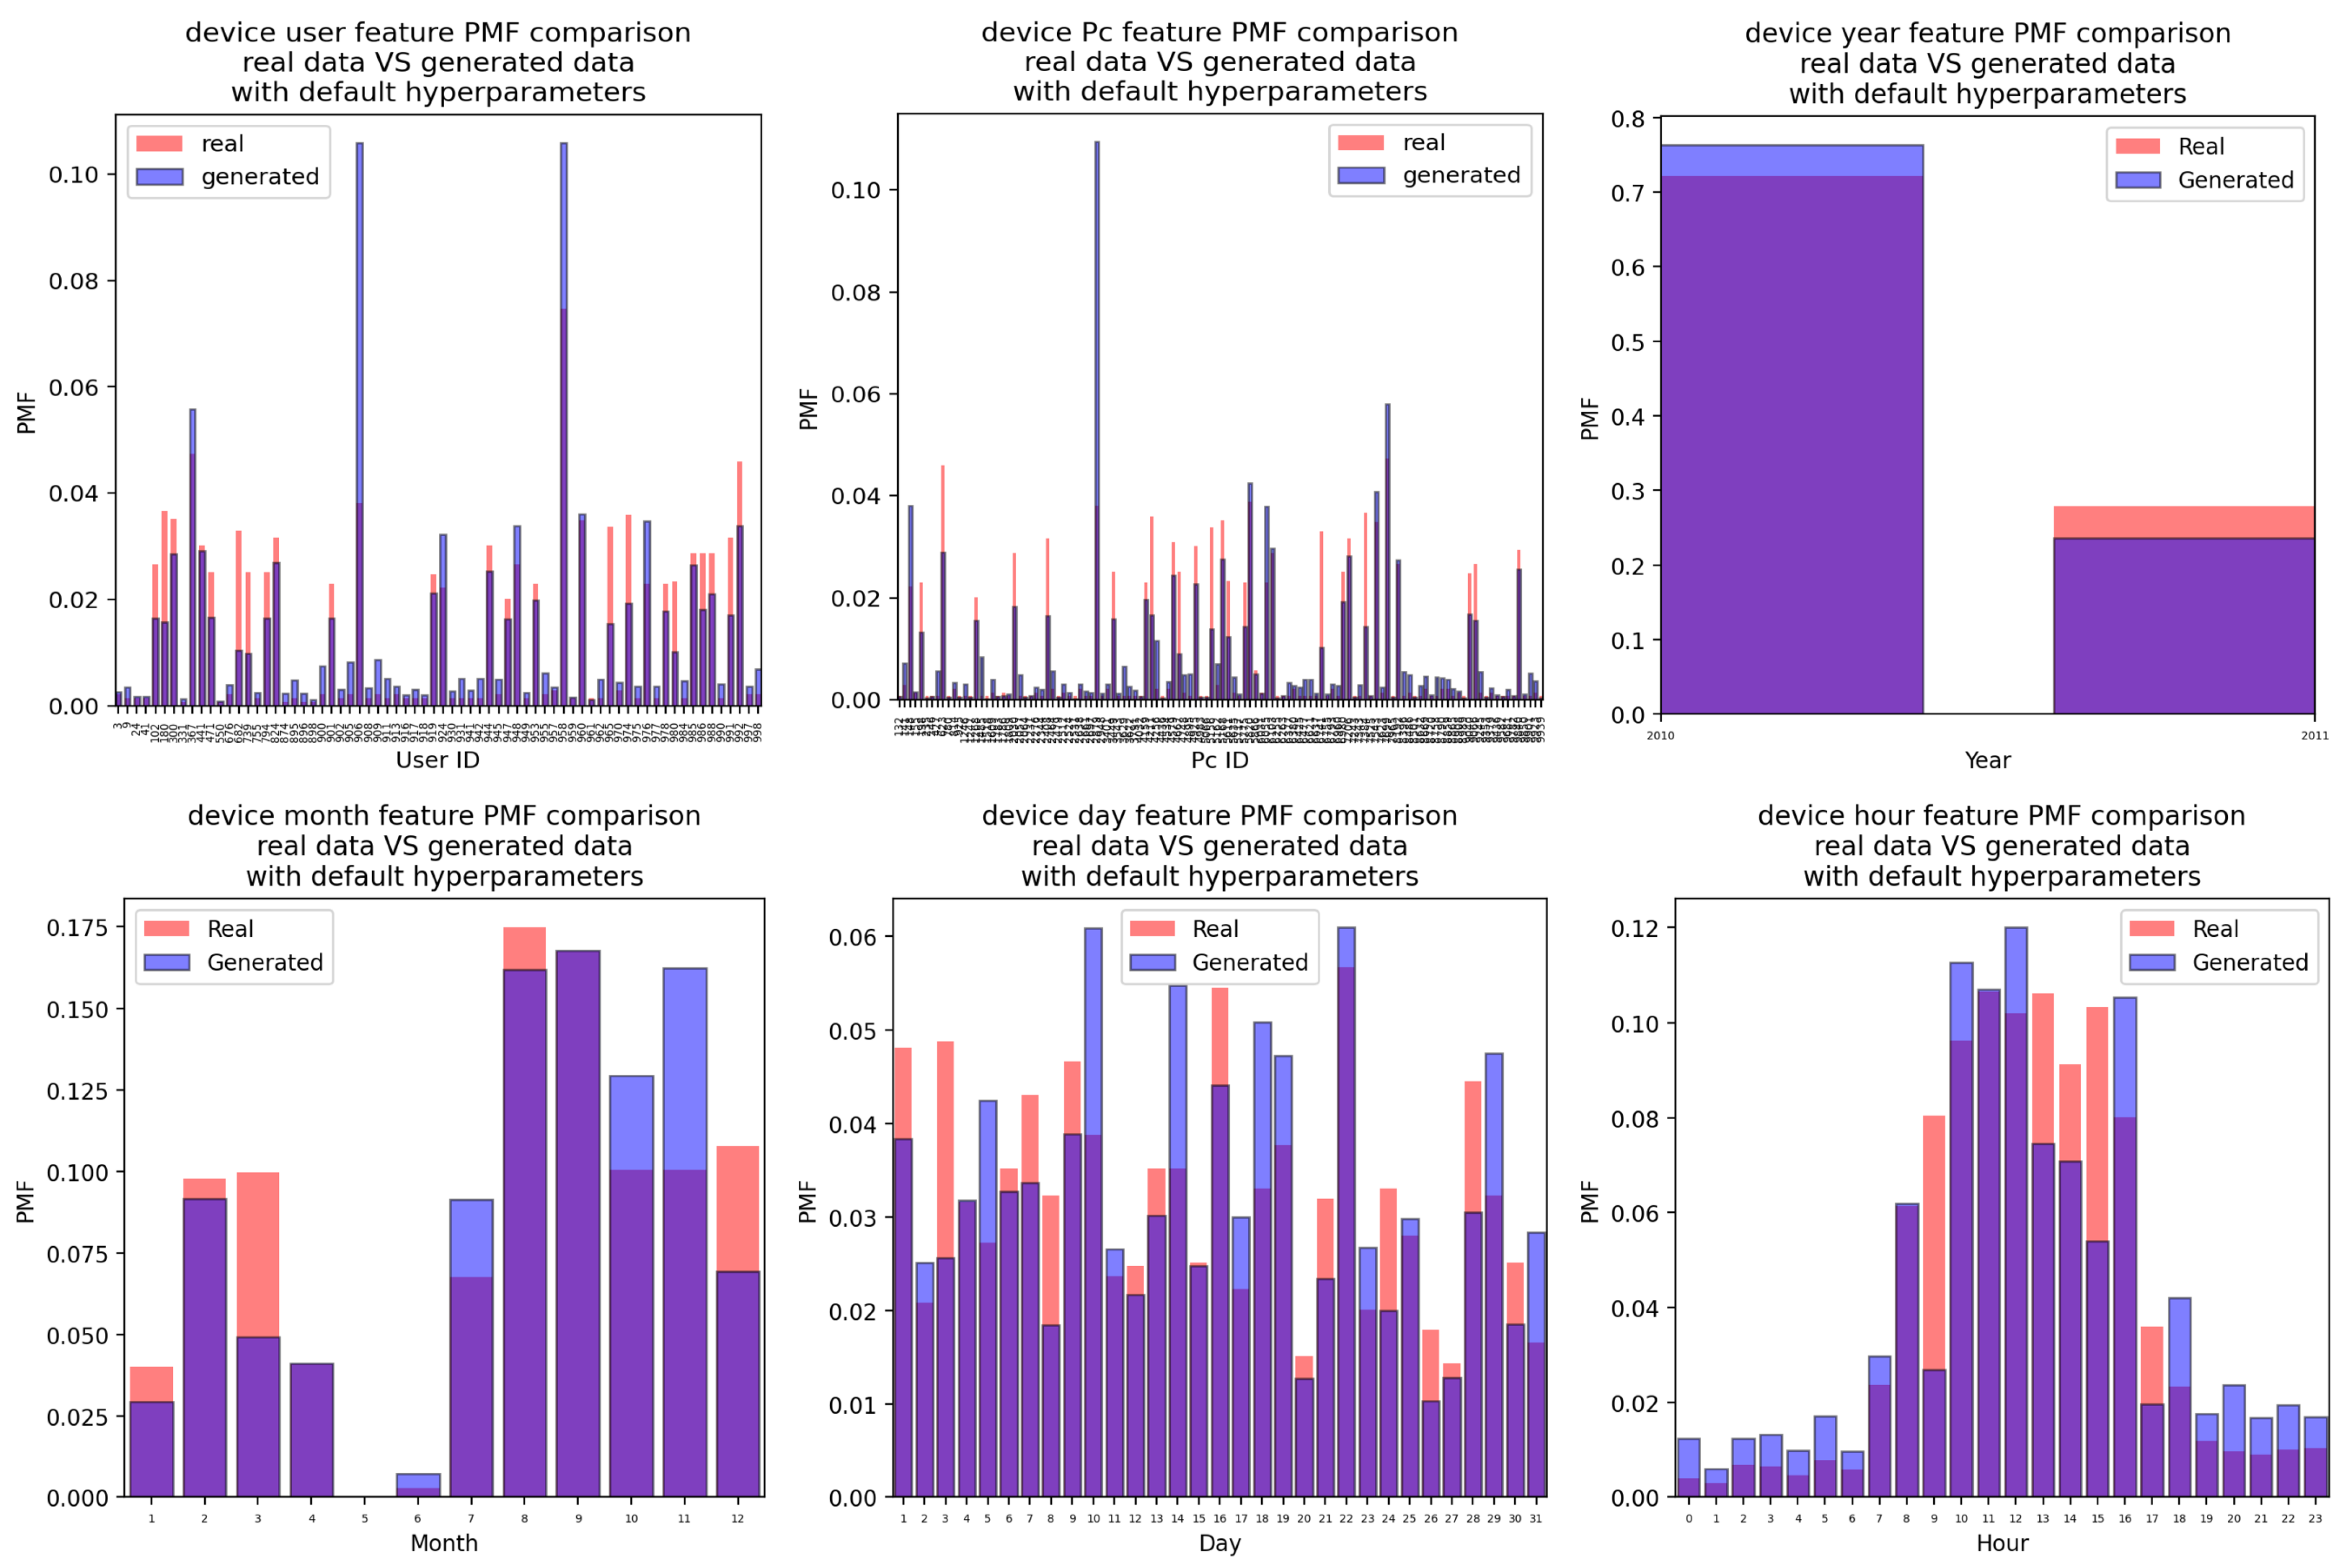
Appendix A.2. Device Attacks
Appendix A.2.1. For the Case of the Attacks Generated Using the CTGAN with Default Hyperparameter Values

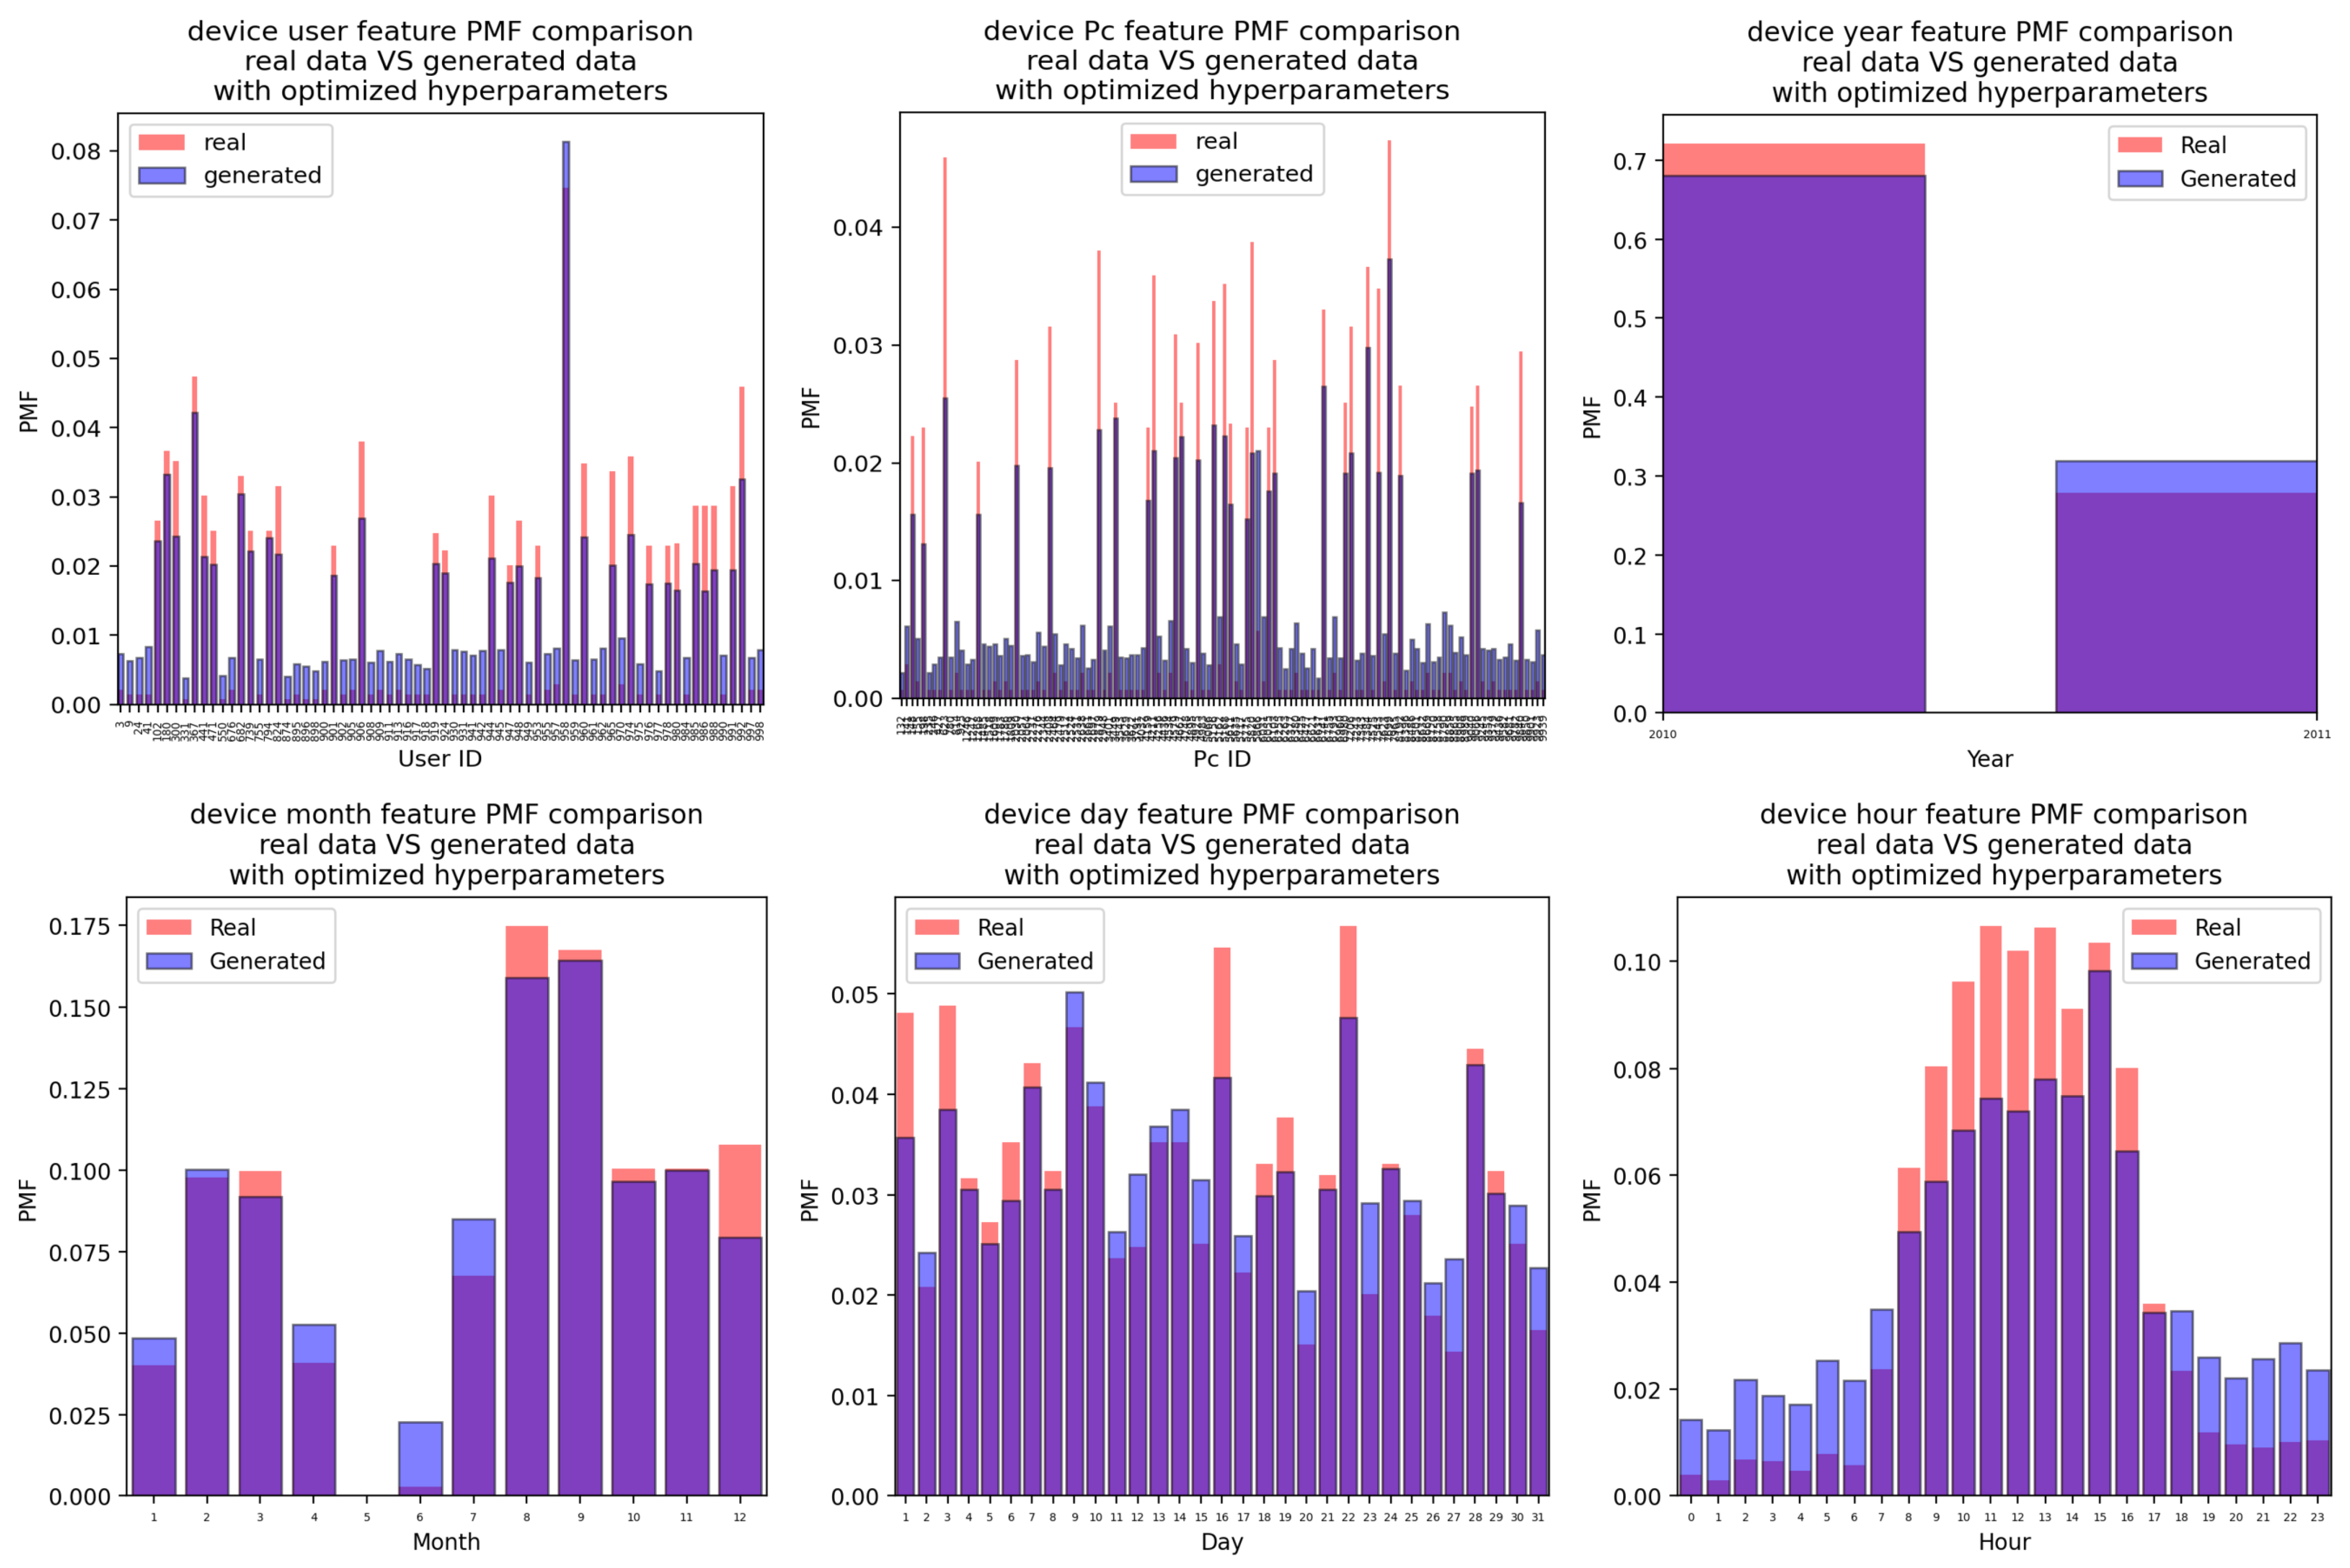
Appendix A.2.2. For the Case of the Attacks Generated Using the CTGAN with Optimized Hyperparameter Values

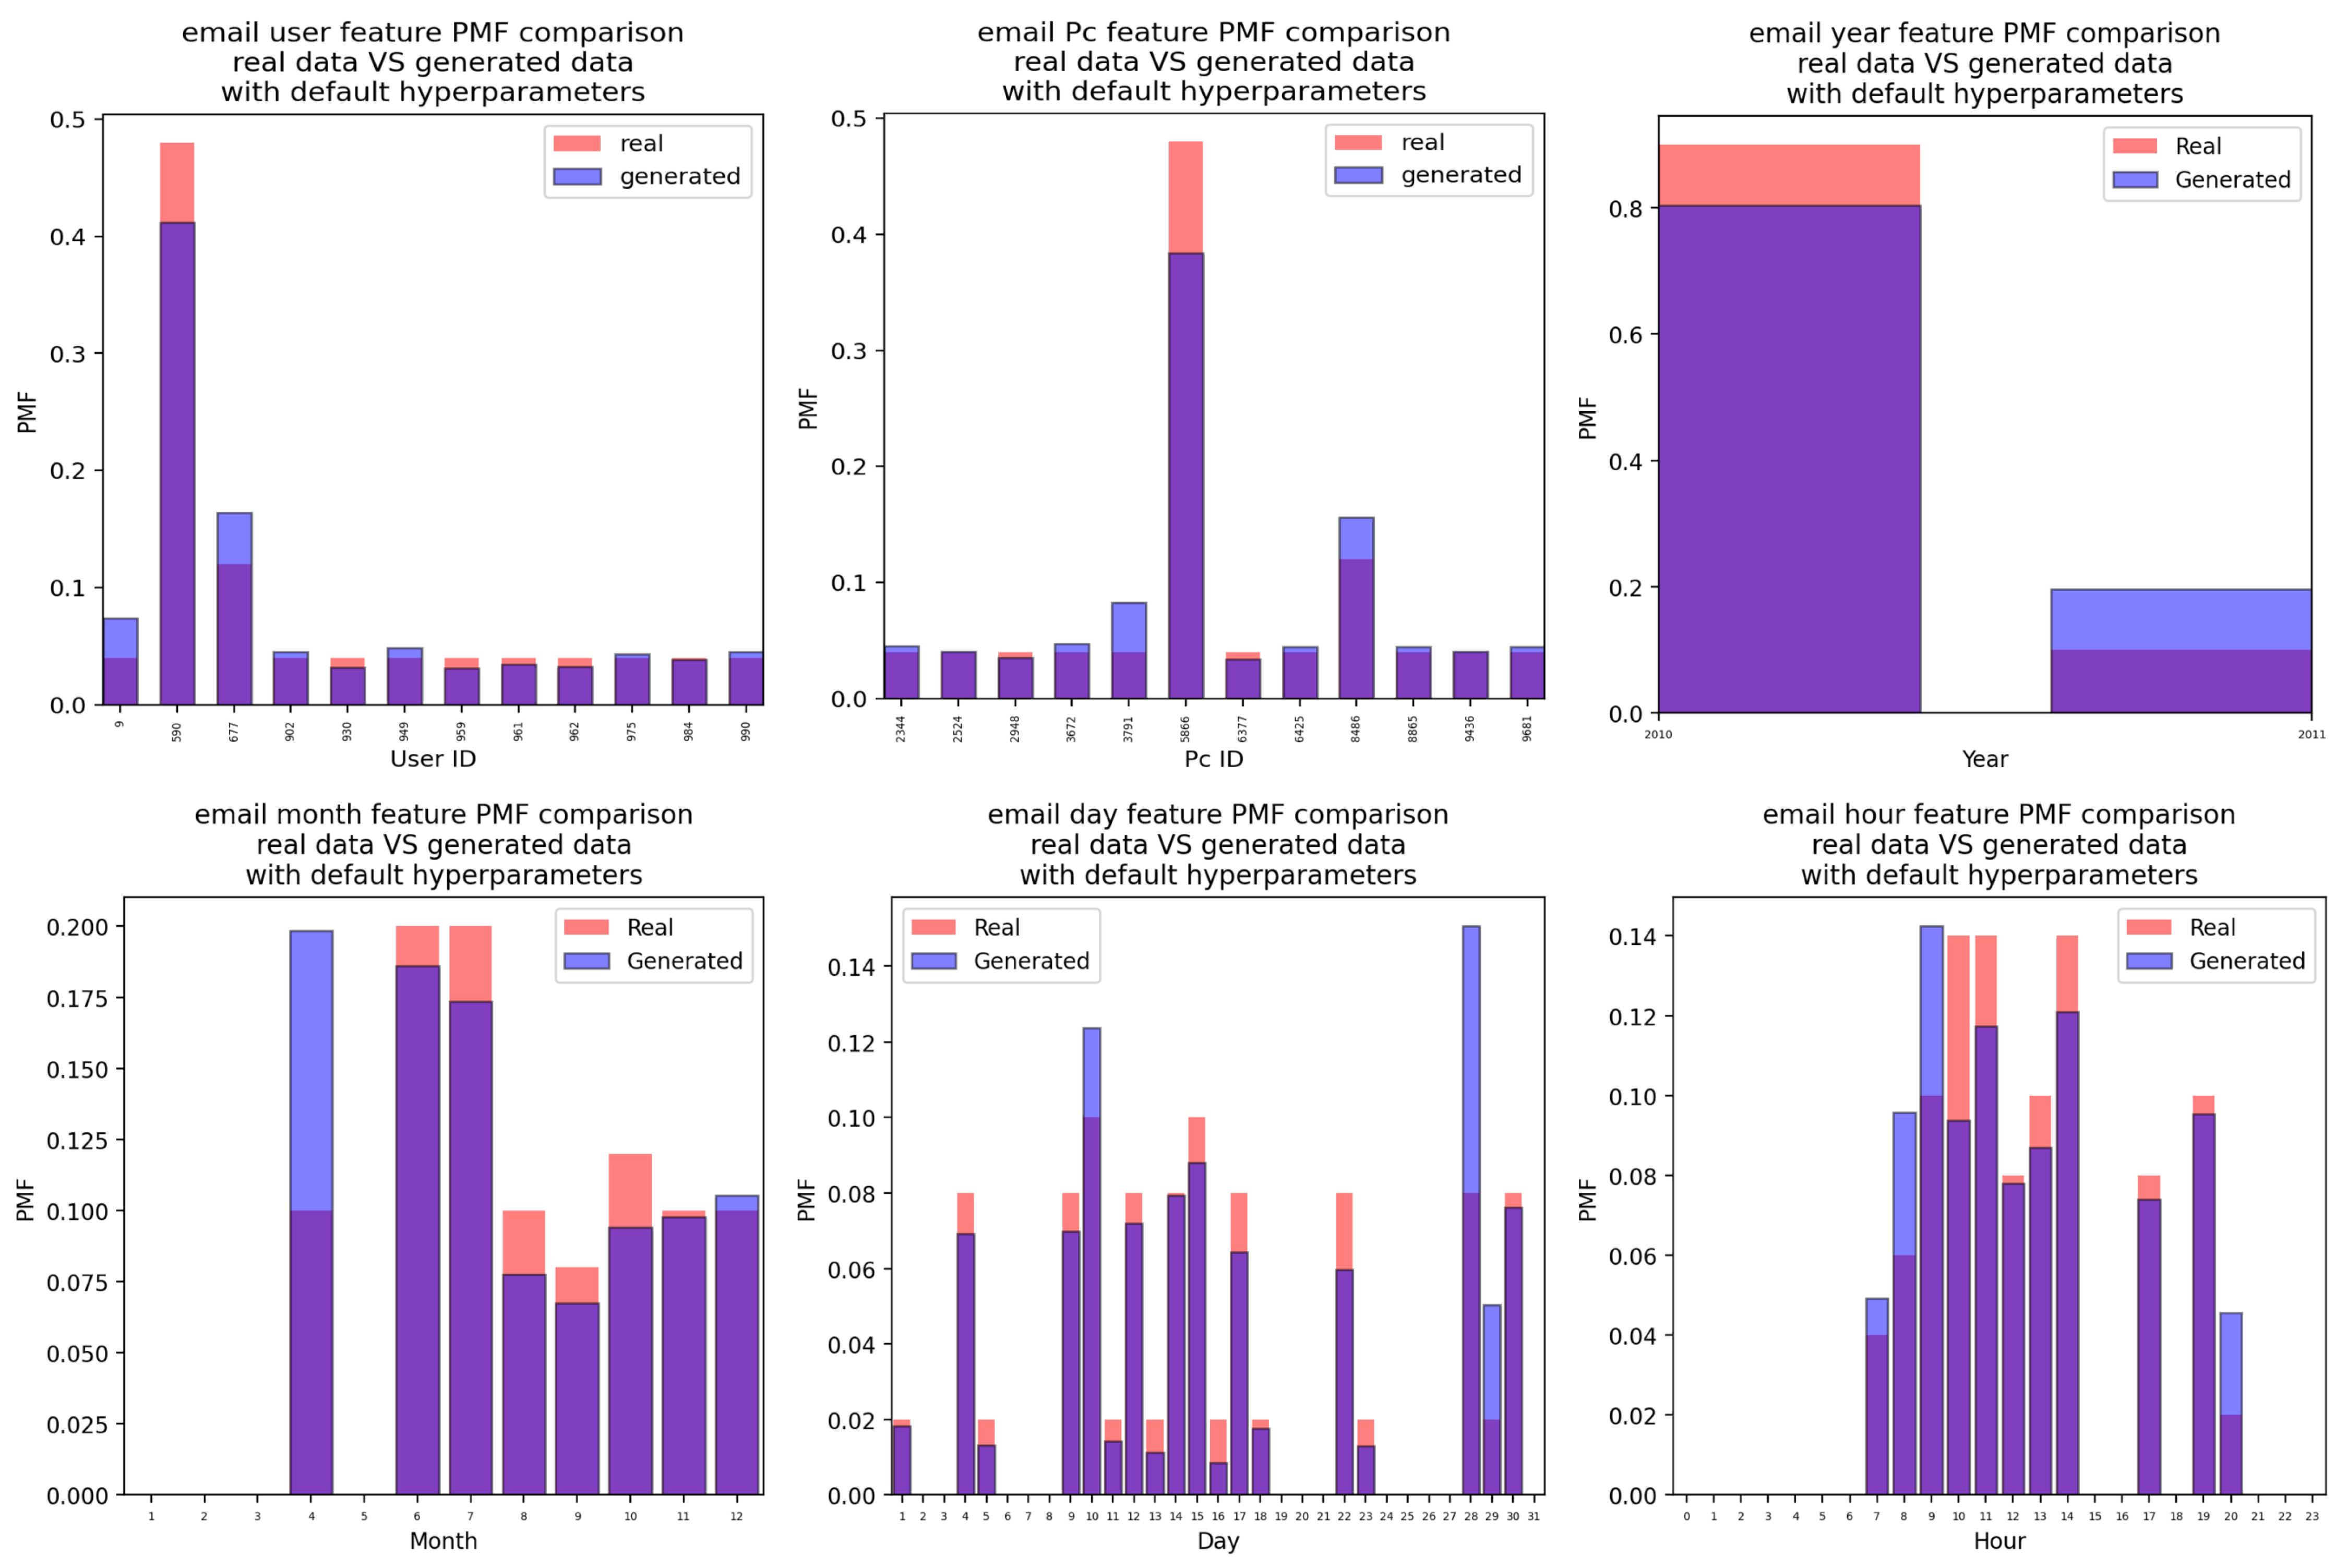
Appendix A.3. Email Attacks
Appendix A.3.1. For the Case of the Attacks Generated Using the CTGAN with Default Hyperparameter Values

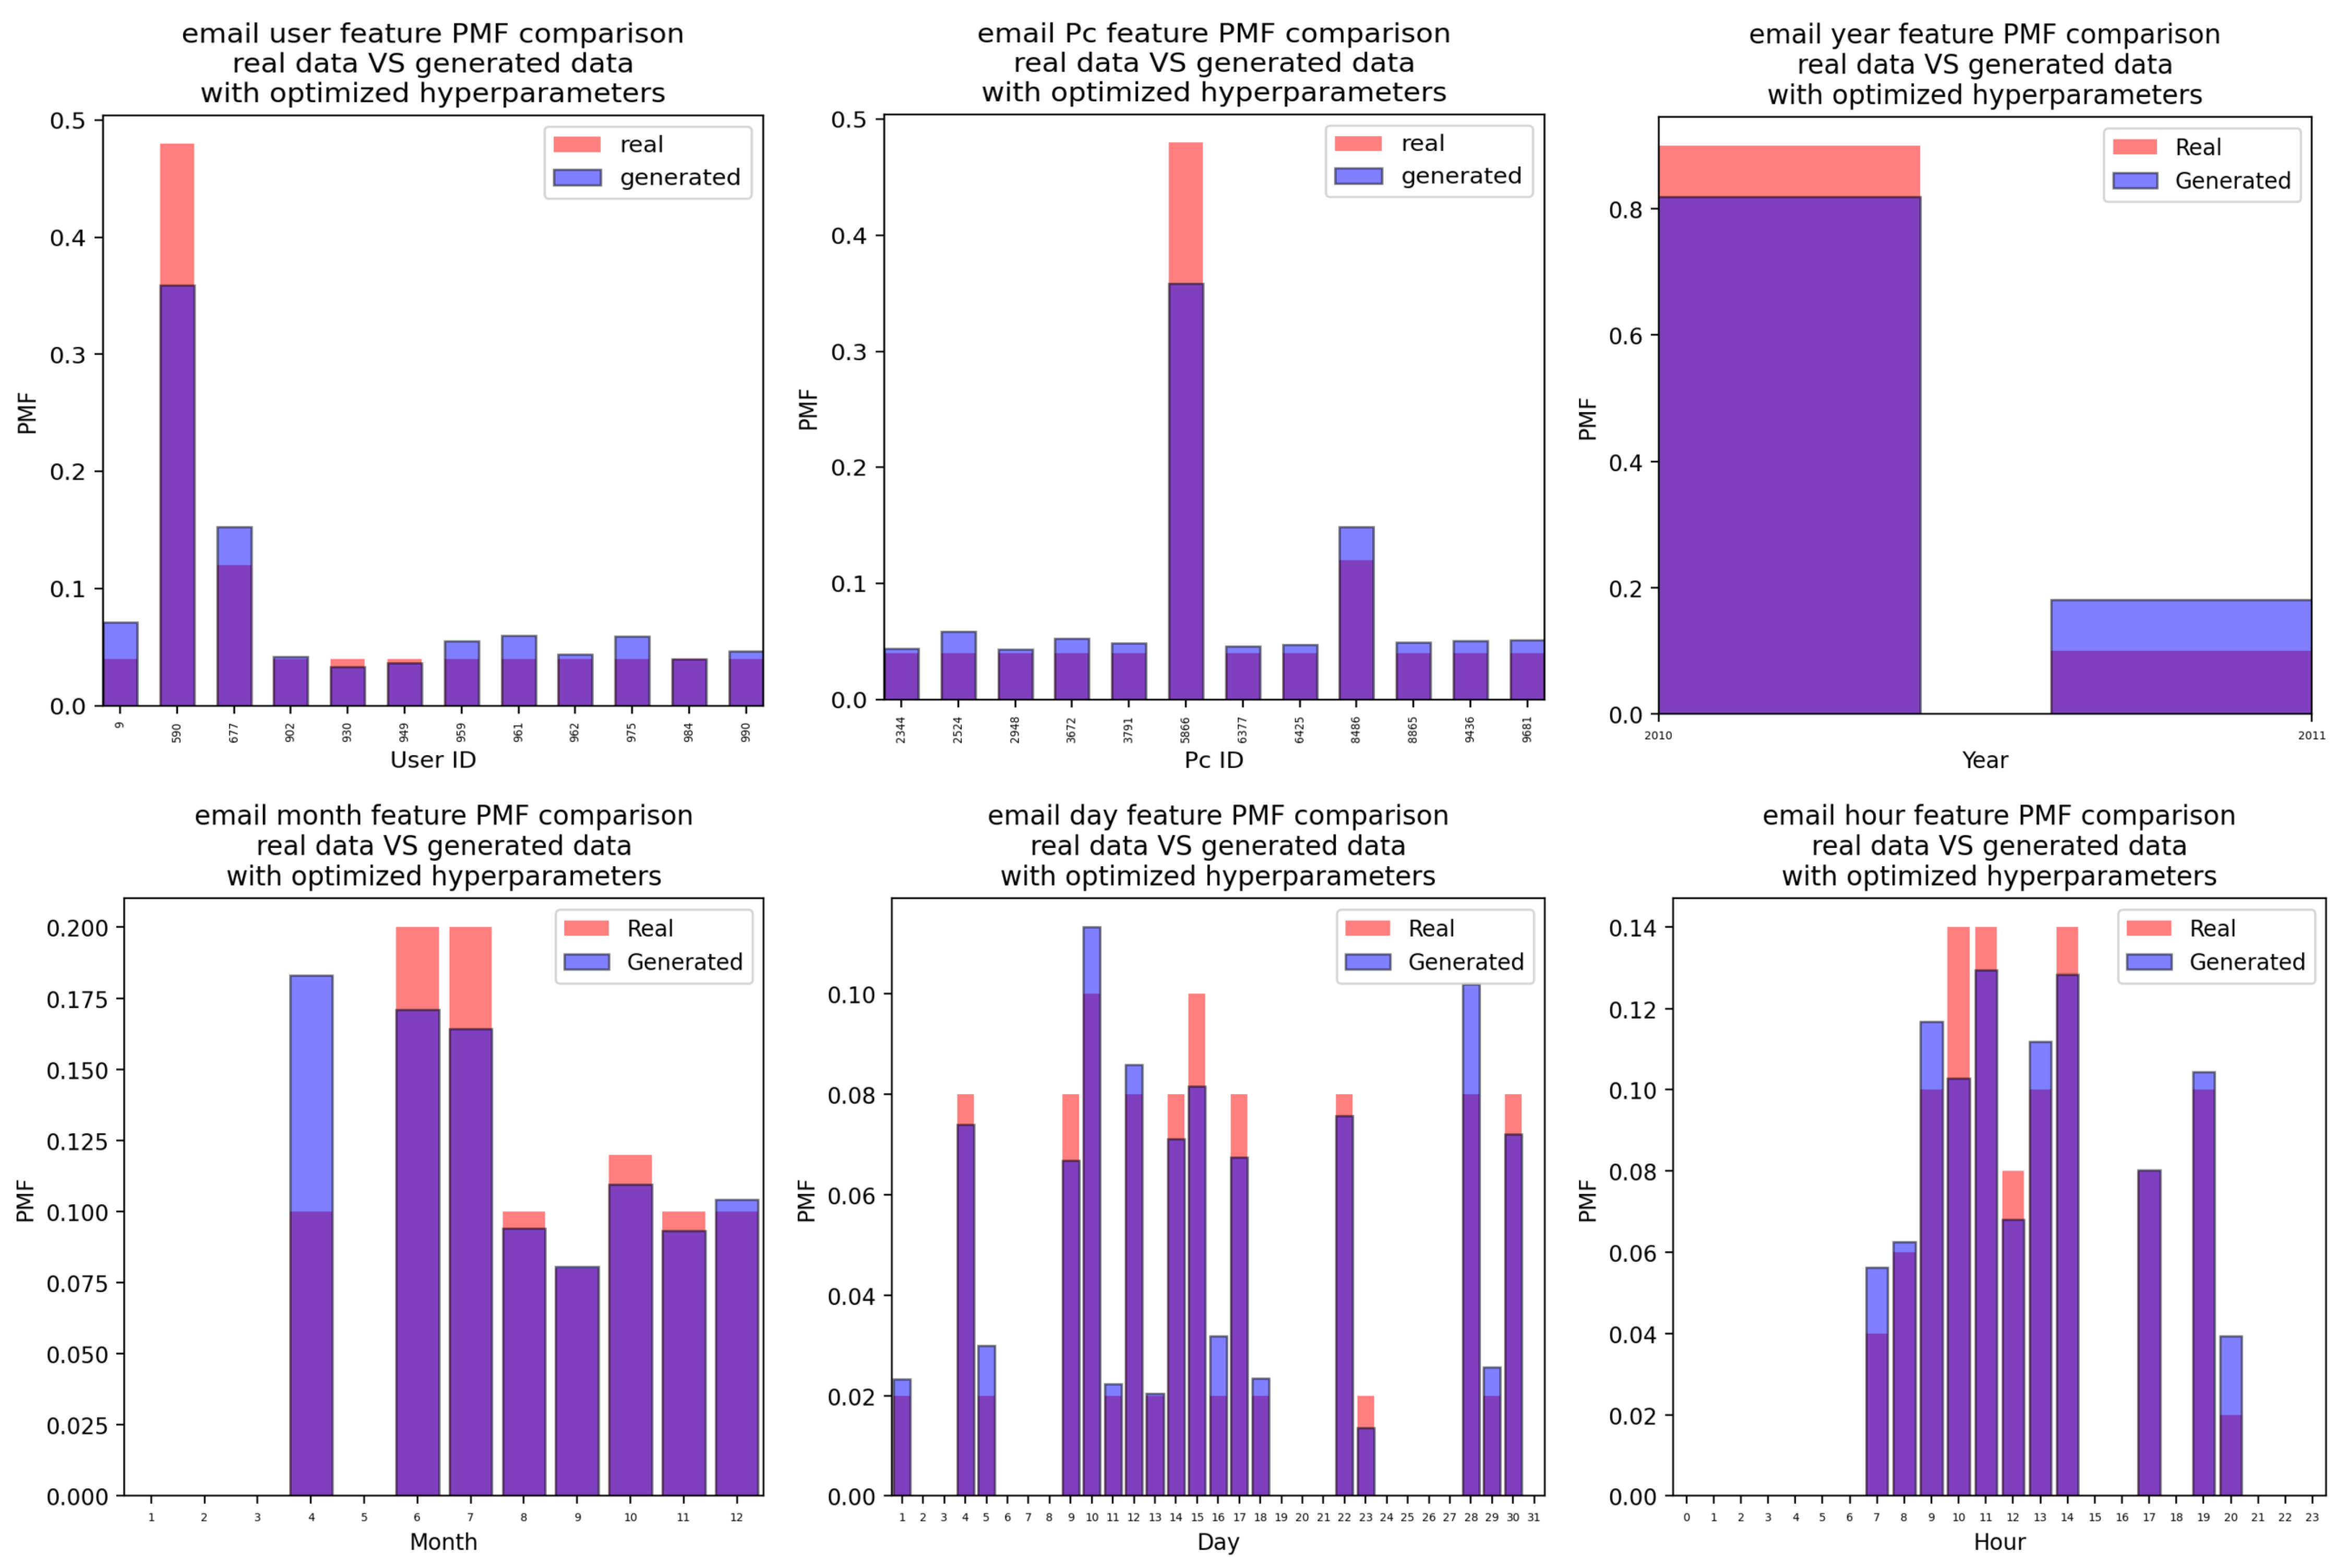
Appendix A.3.2. For the Case of the Attacks Generated Using the CTGAN with Optimized Hyperparameter Values

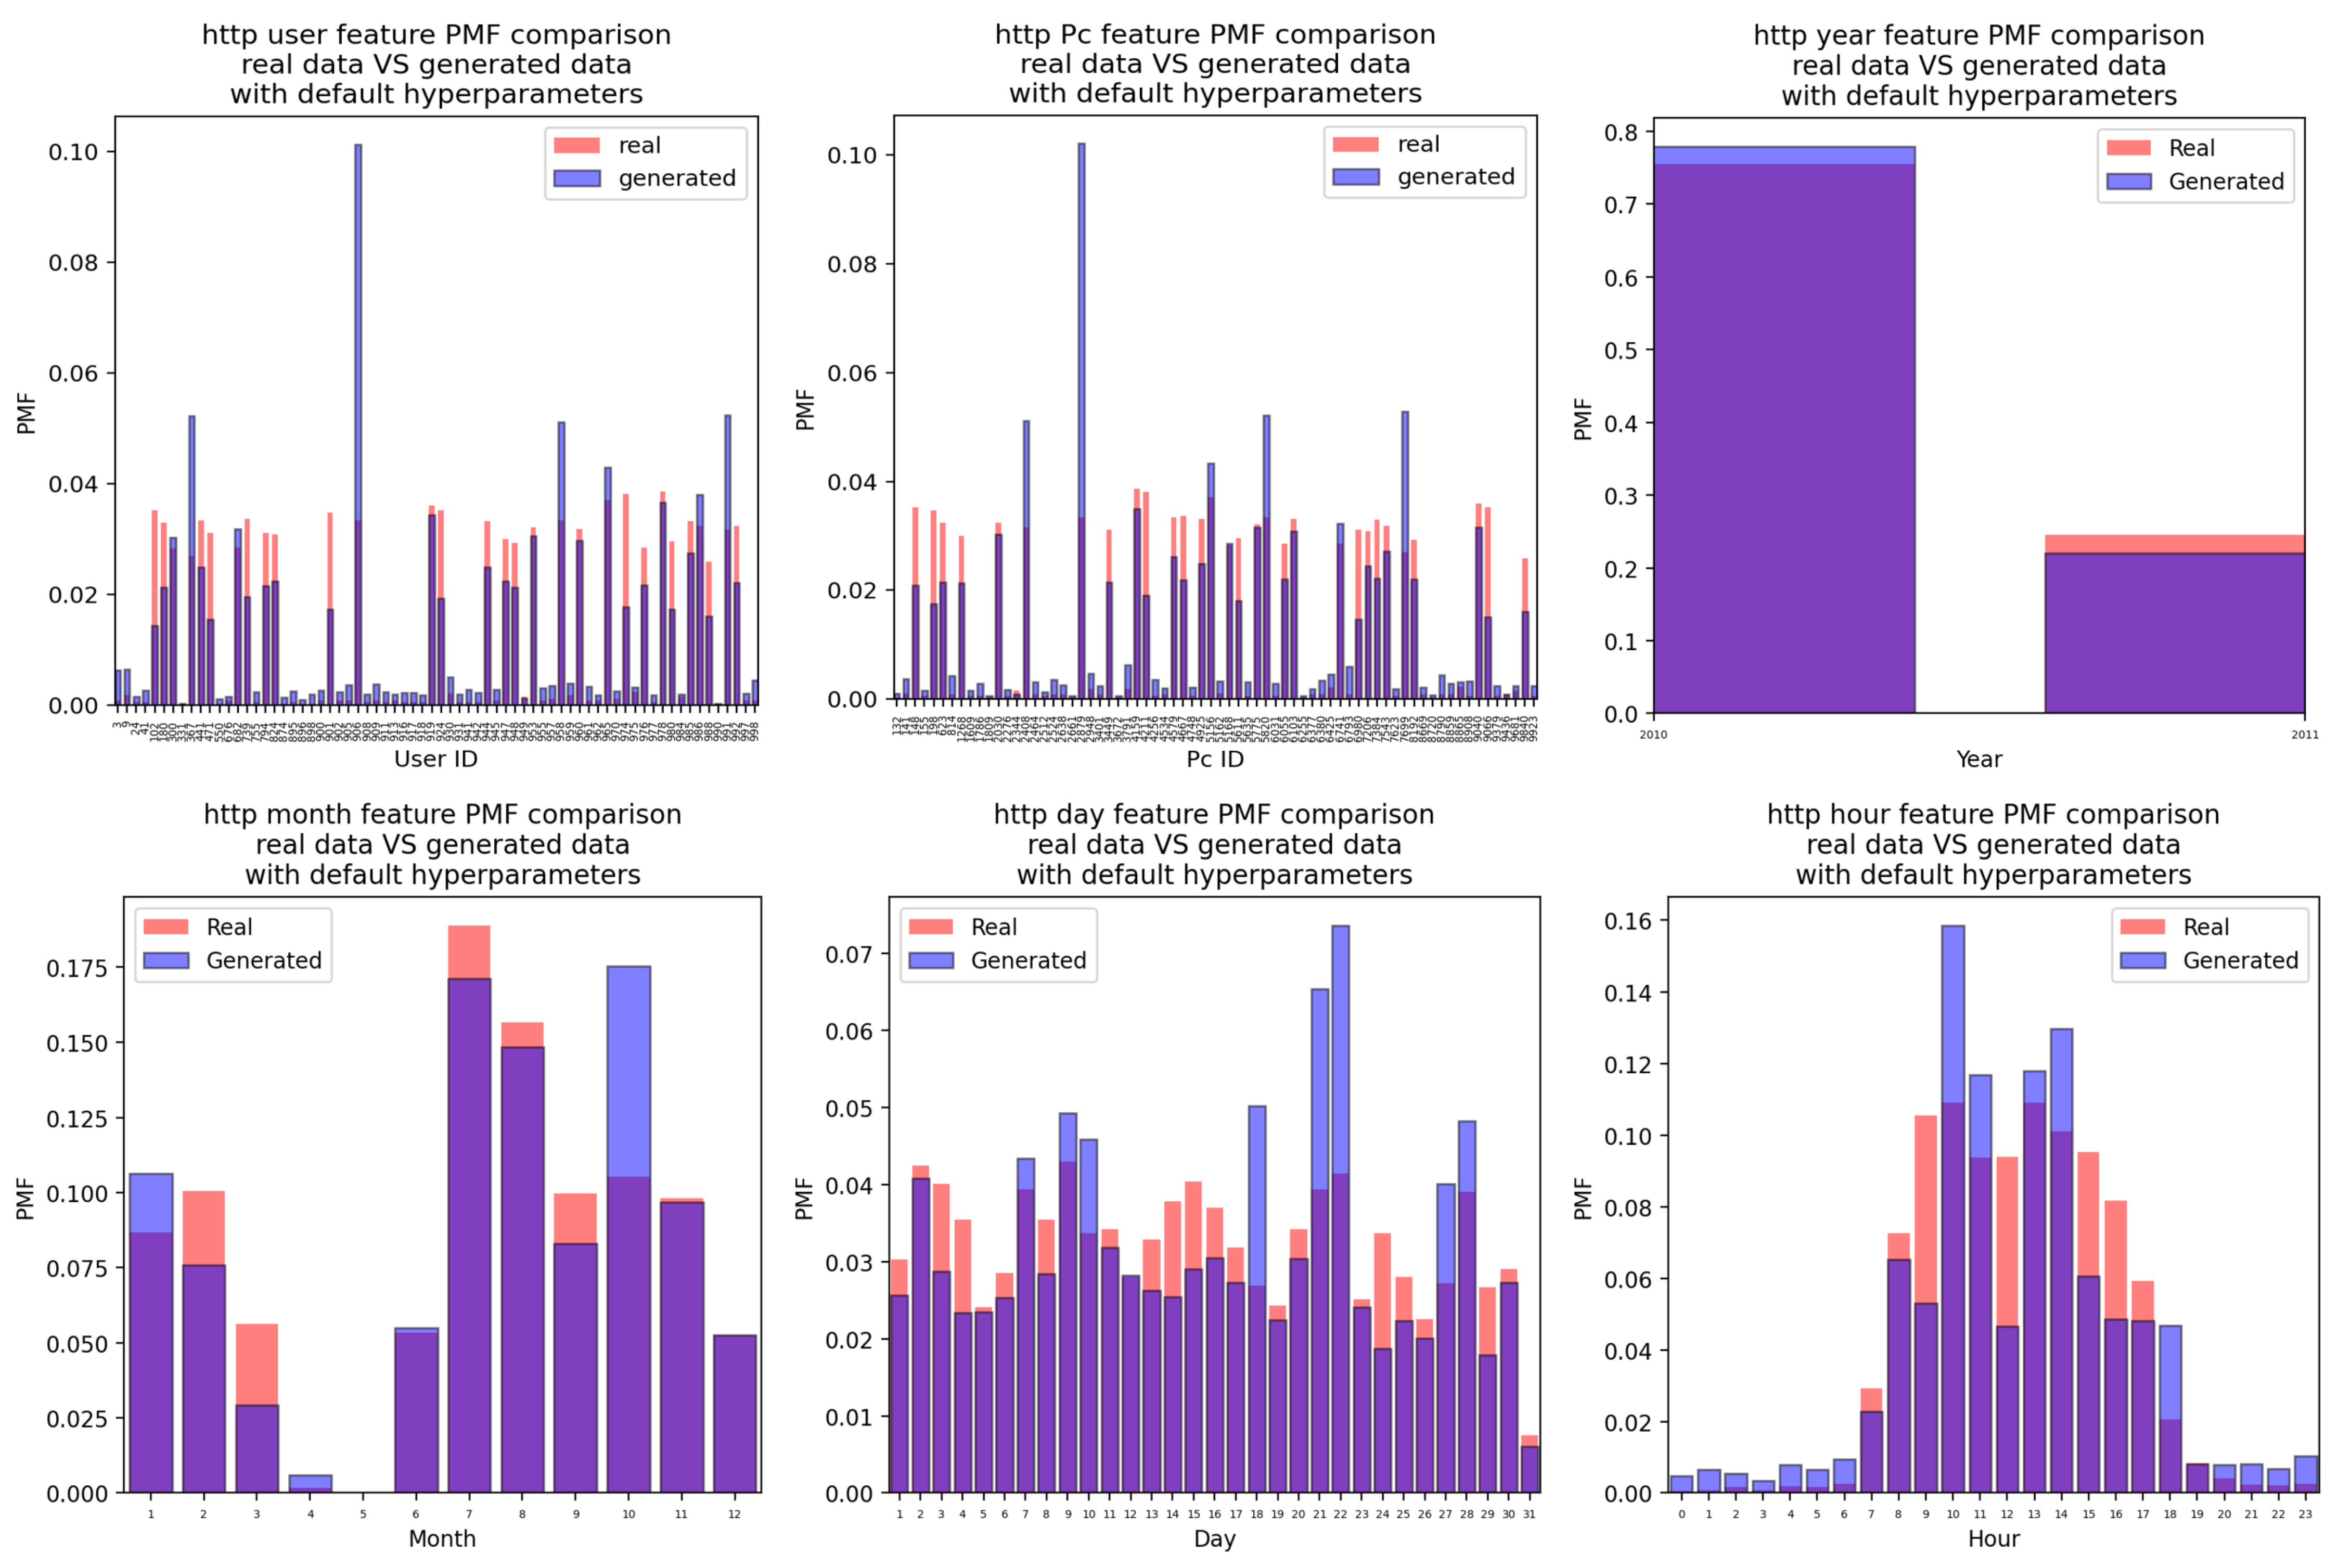
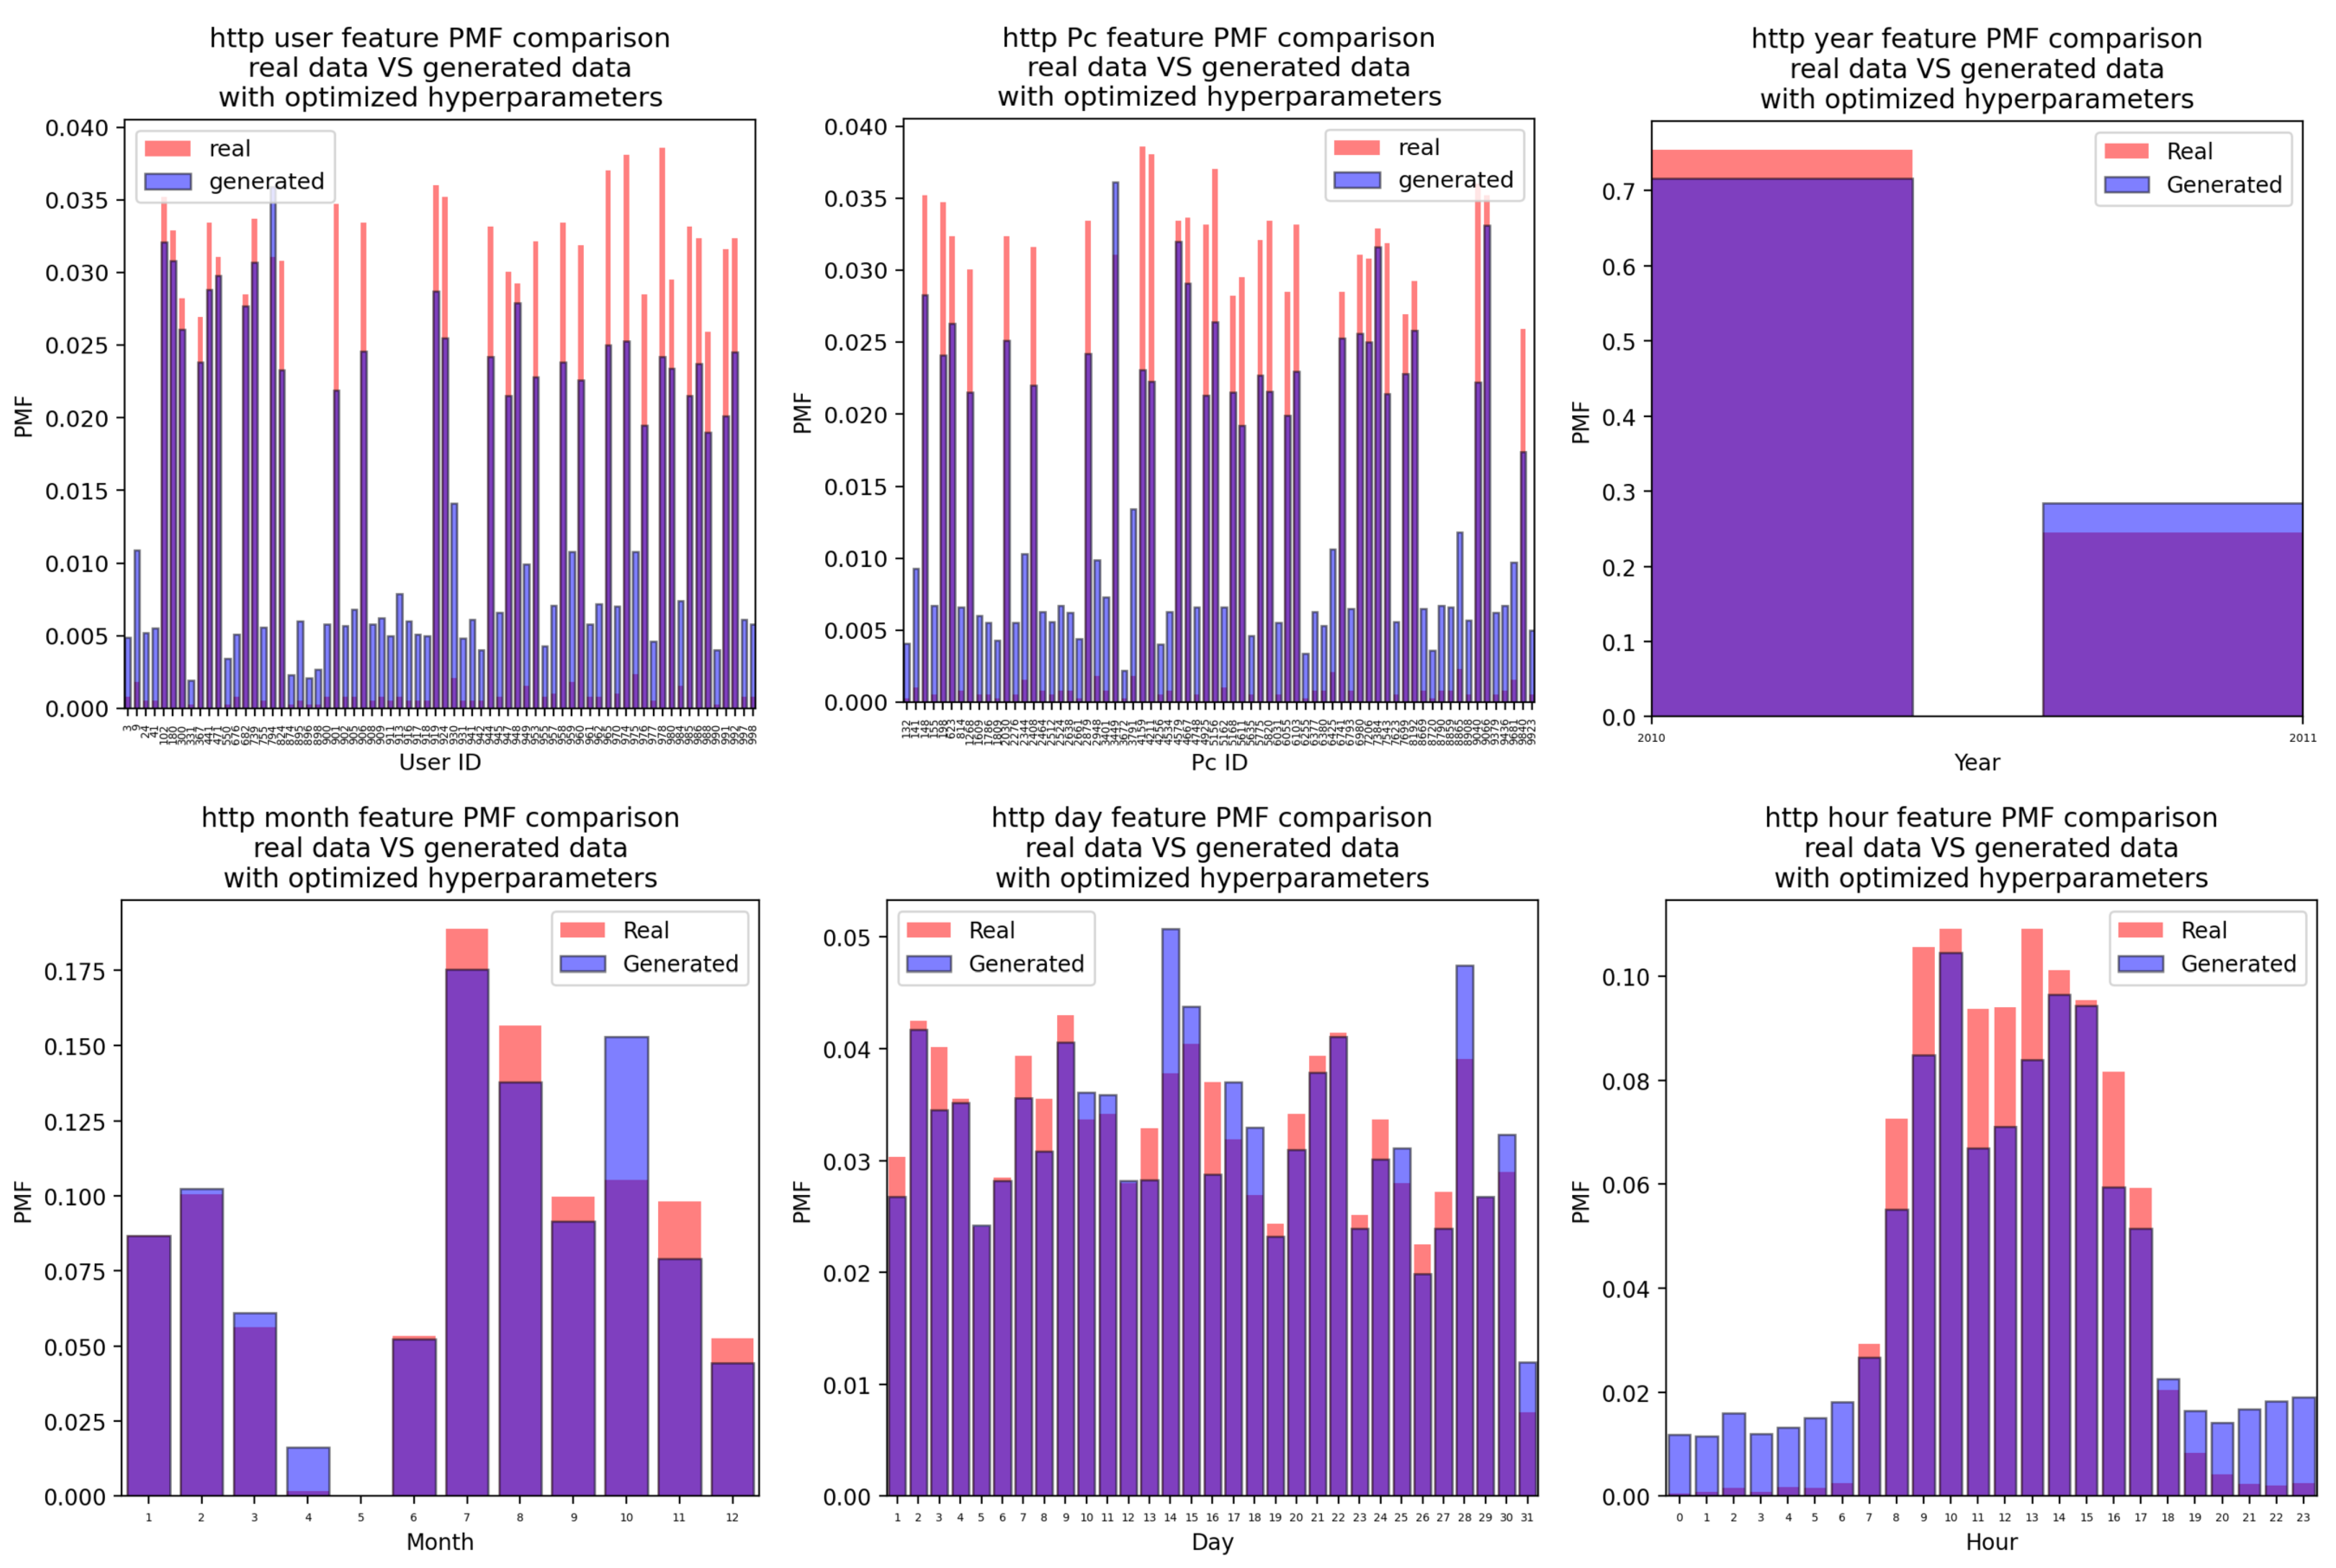
Appendix A.4. HTTP Attacks
Appendix A.4.1. For the Case of the Attacks Generated Using the CTGAN with Default Hyperparameter Values

Appendix A.4.2. For the Case of the Attacks Generated Using the CTGAN with Optimized Hyperparameter Values

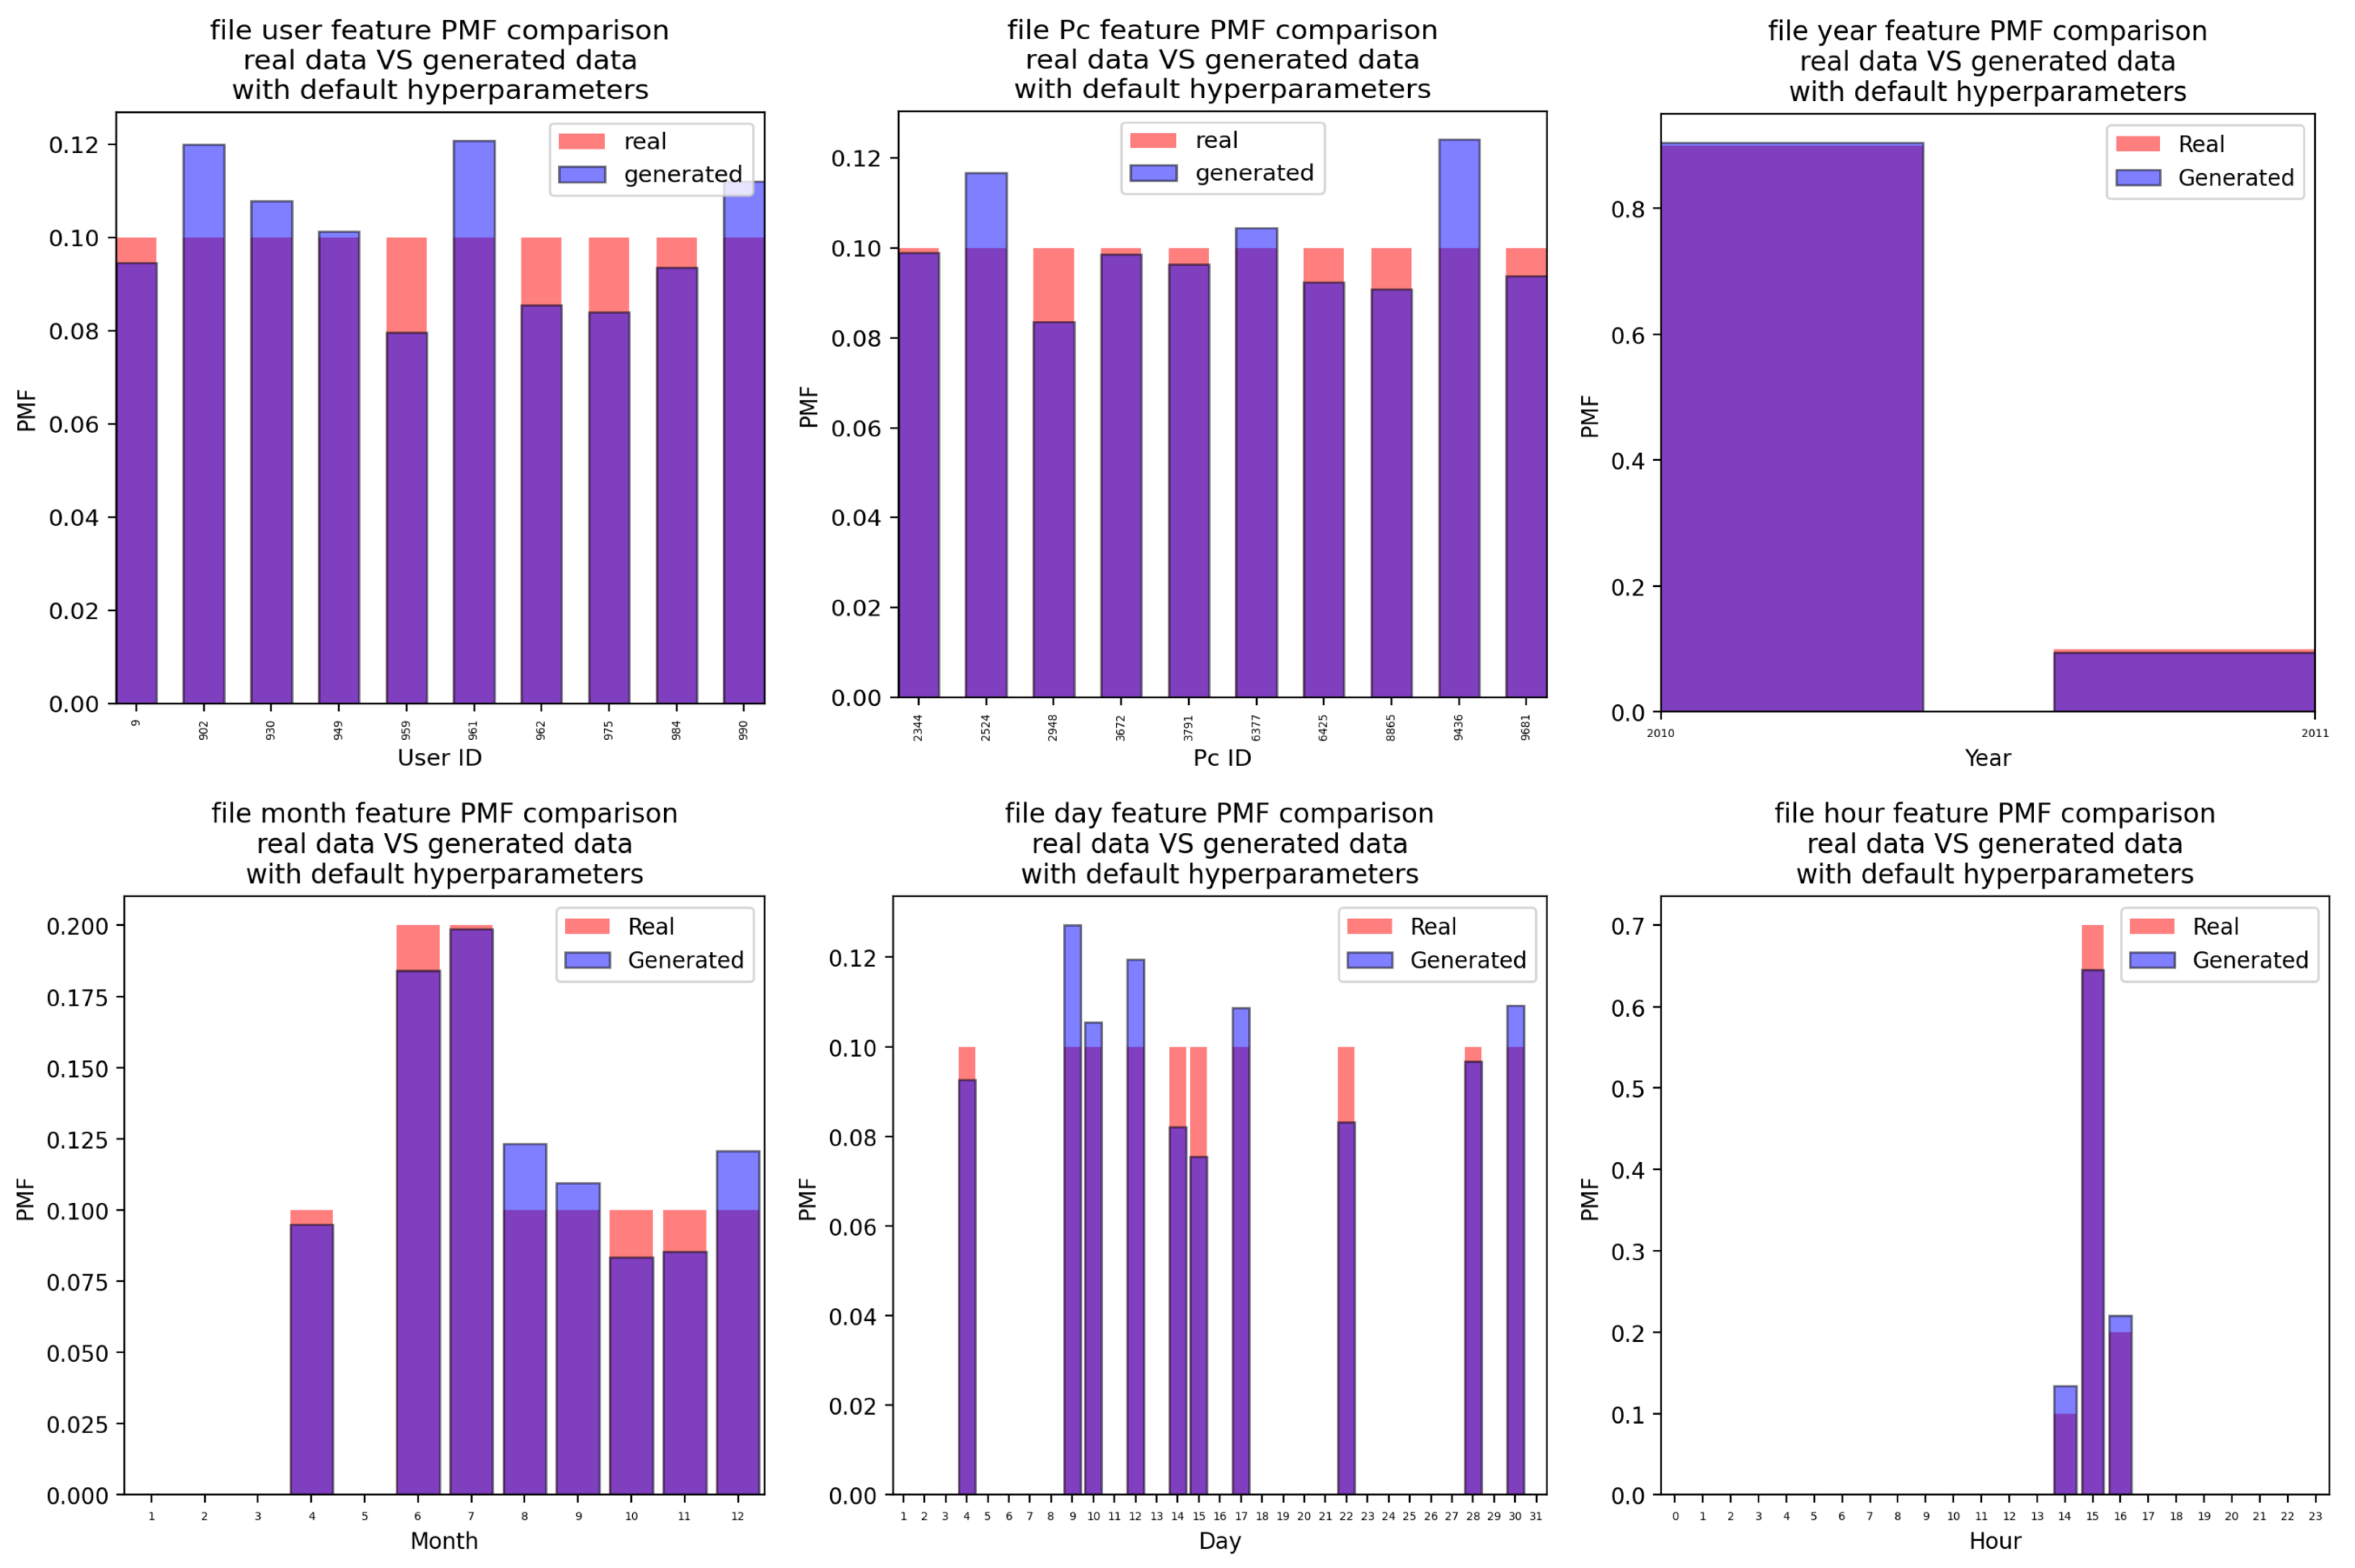
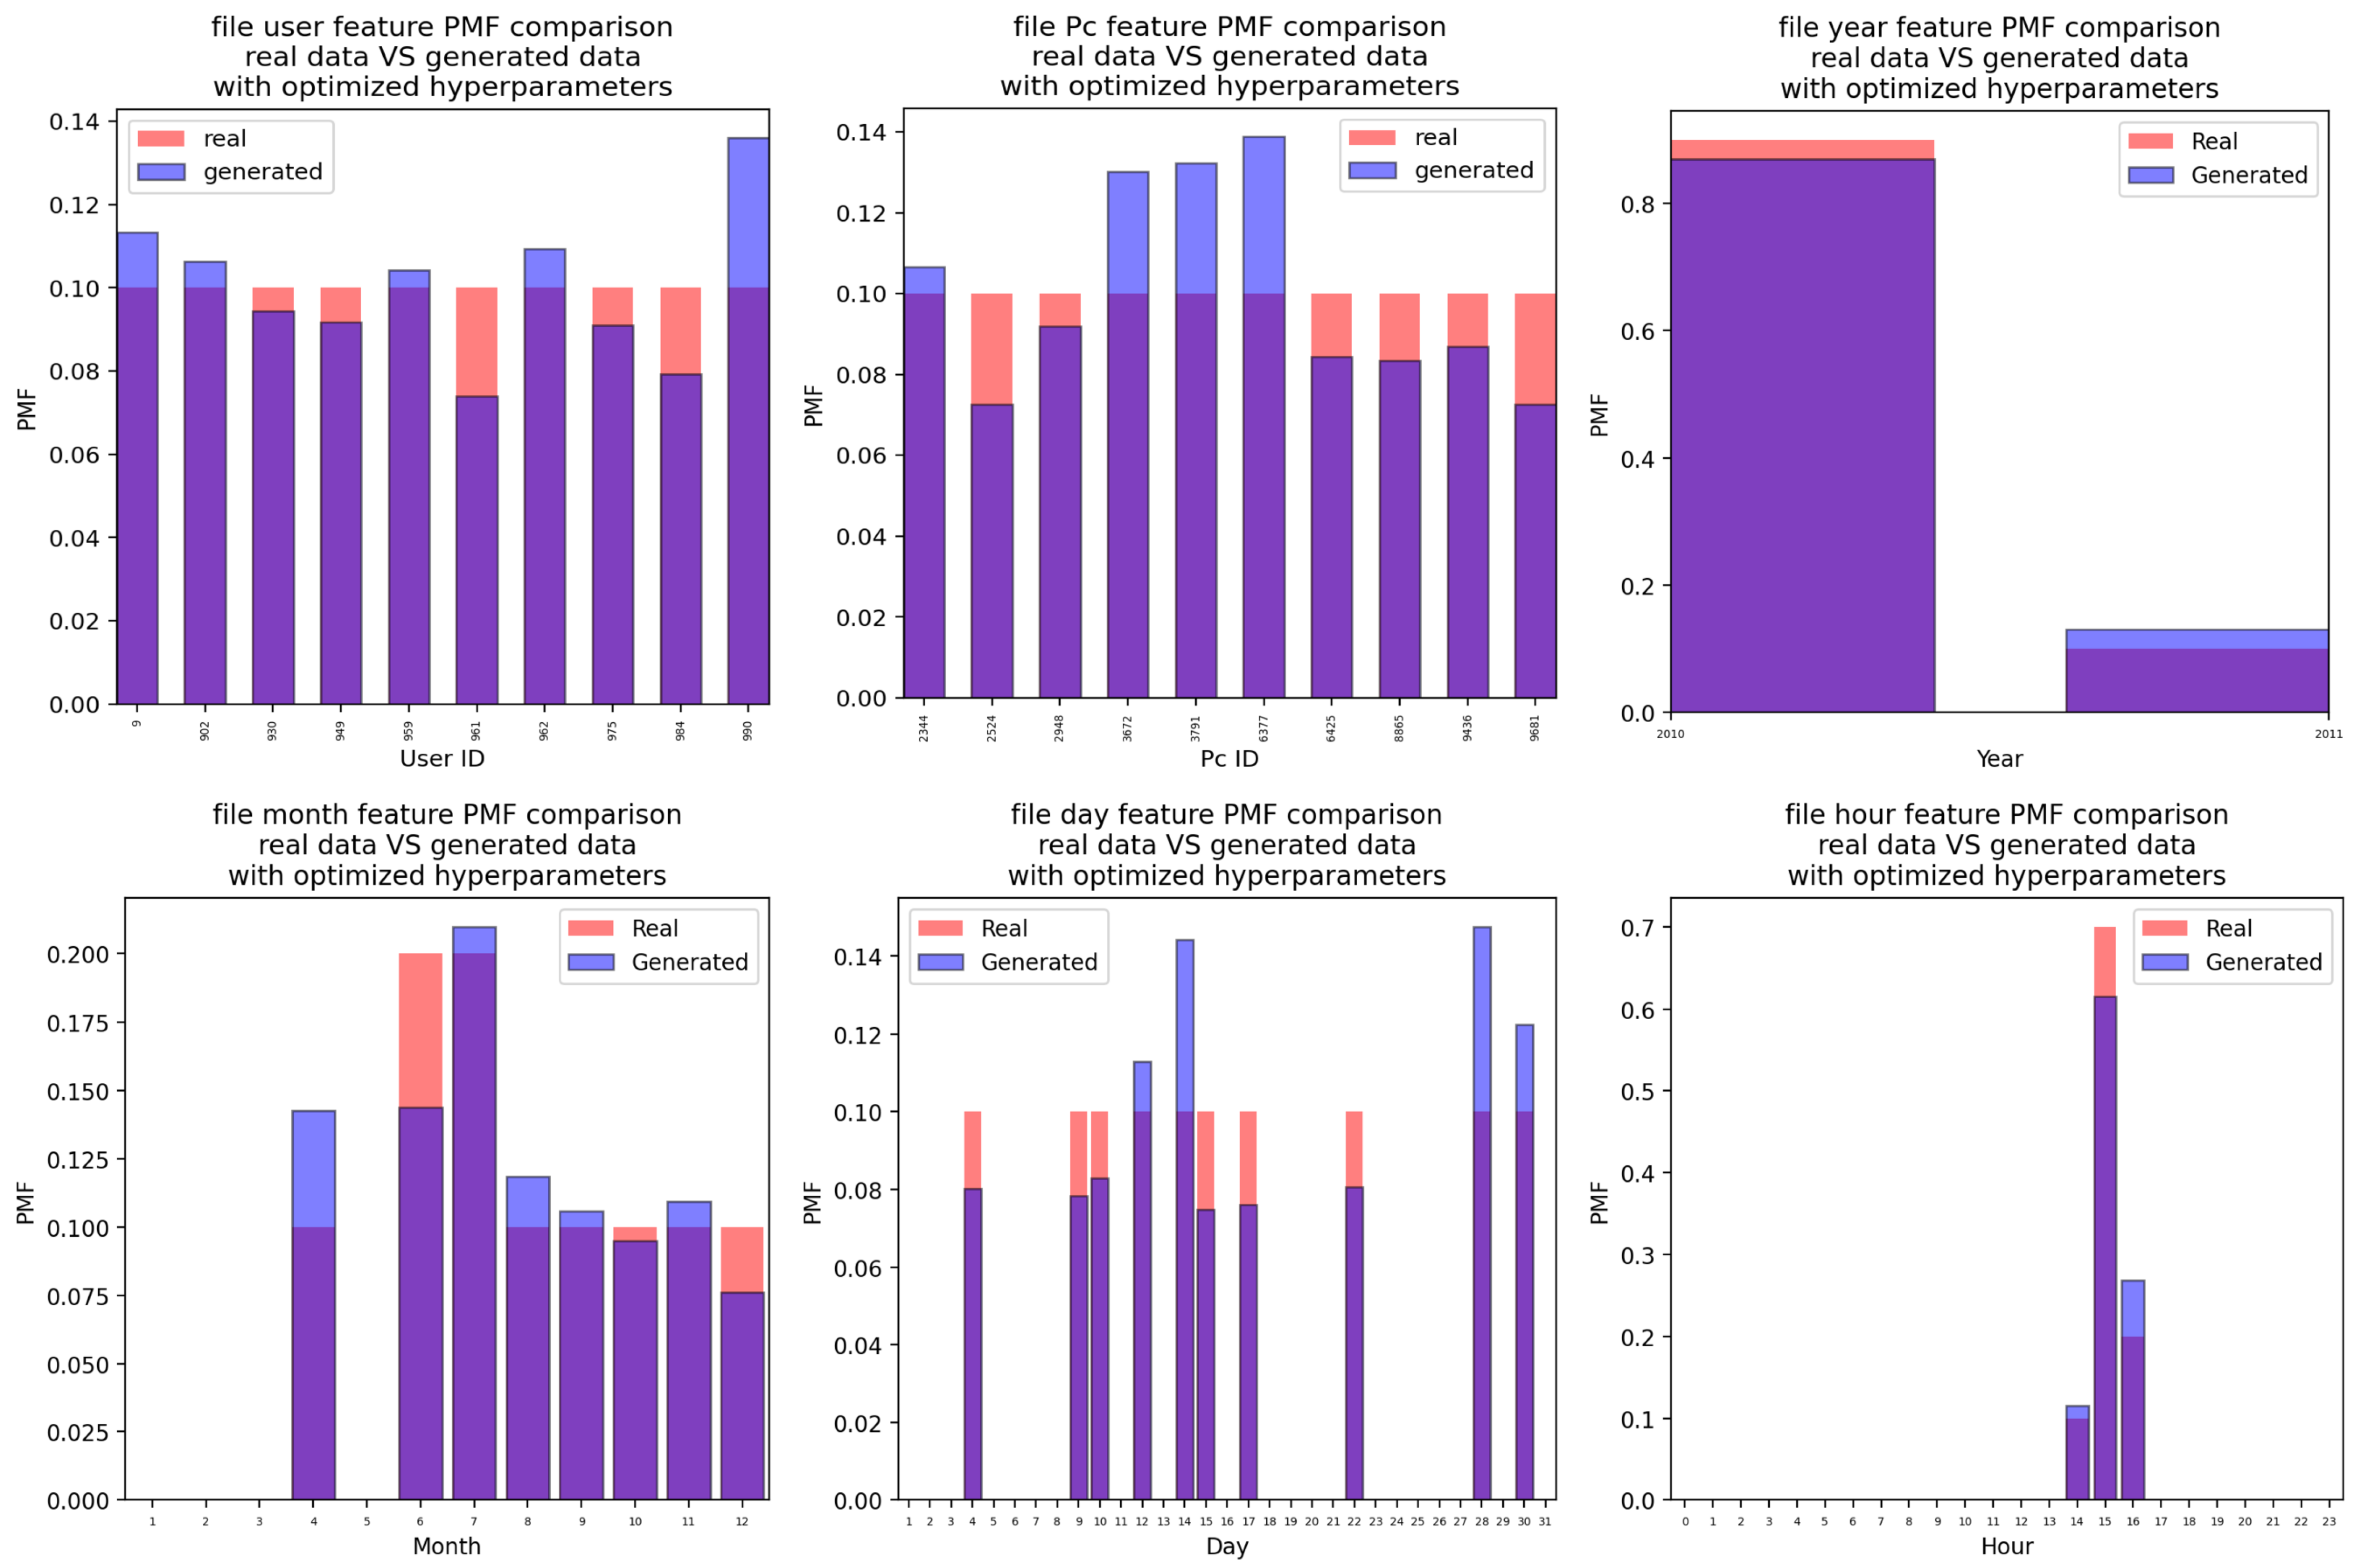
Appendix A.5. File Attacks
Appendix A.5.1. For the Case of the Attacks Generated Using the CTGAN with Default Hyperparameter Values

Appendix A.5.2. For the Case of the Attacks Generated Using the CTGAN with Optimized Hyperparameter Values

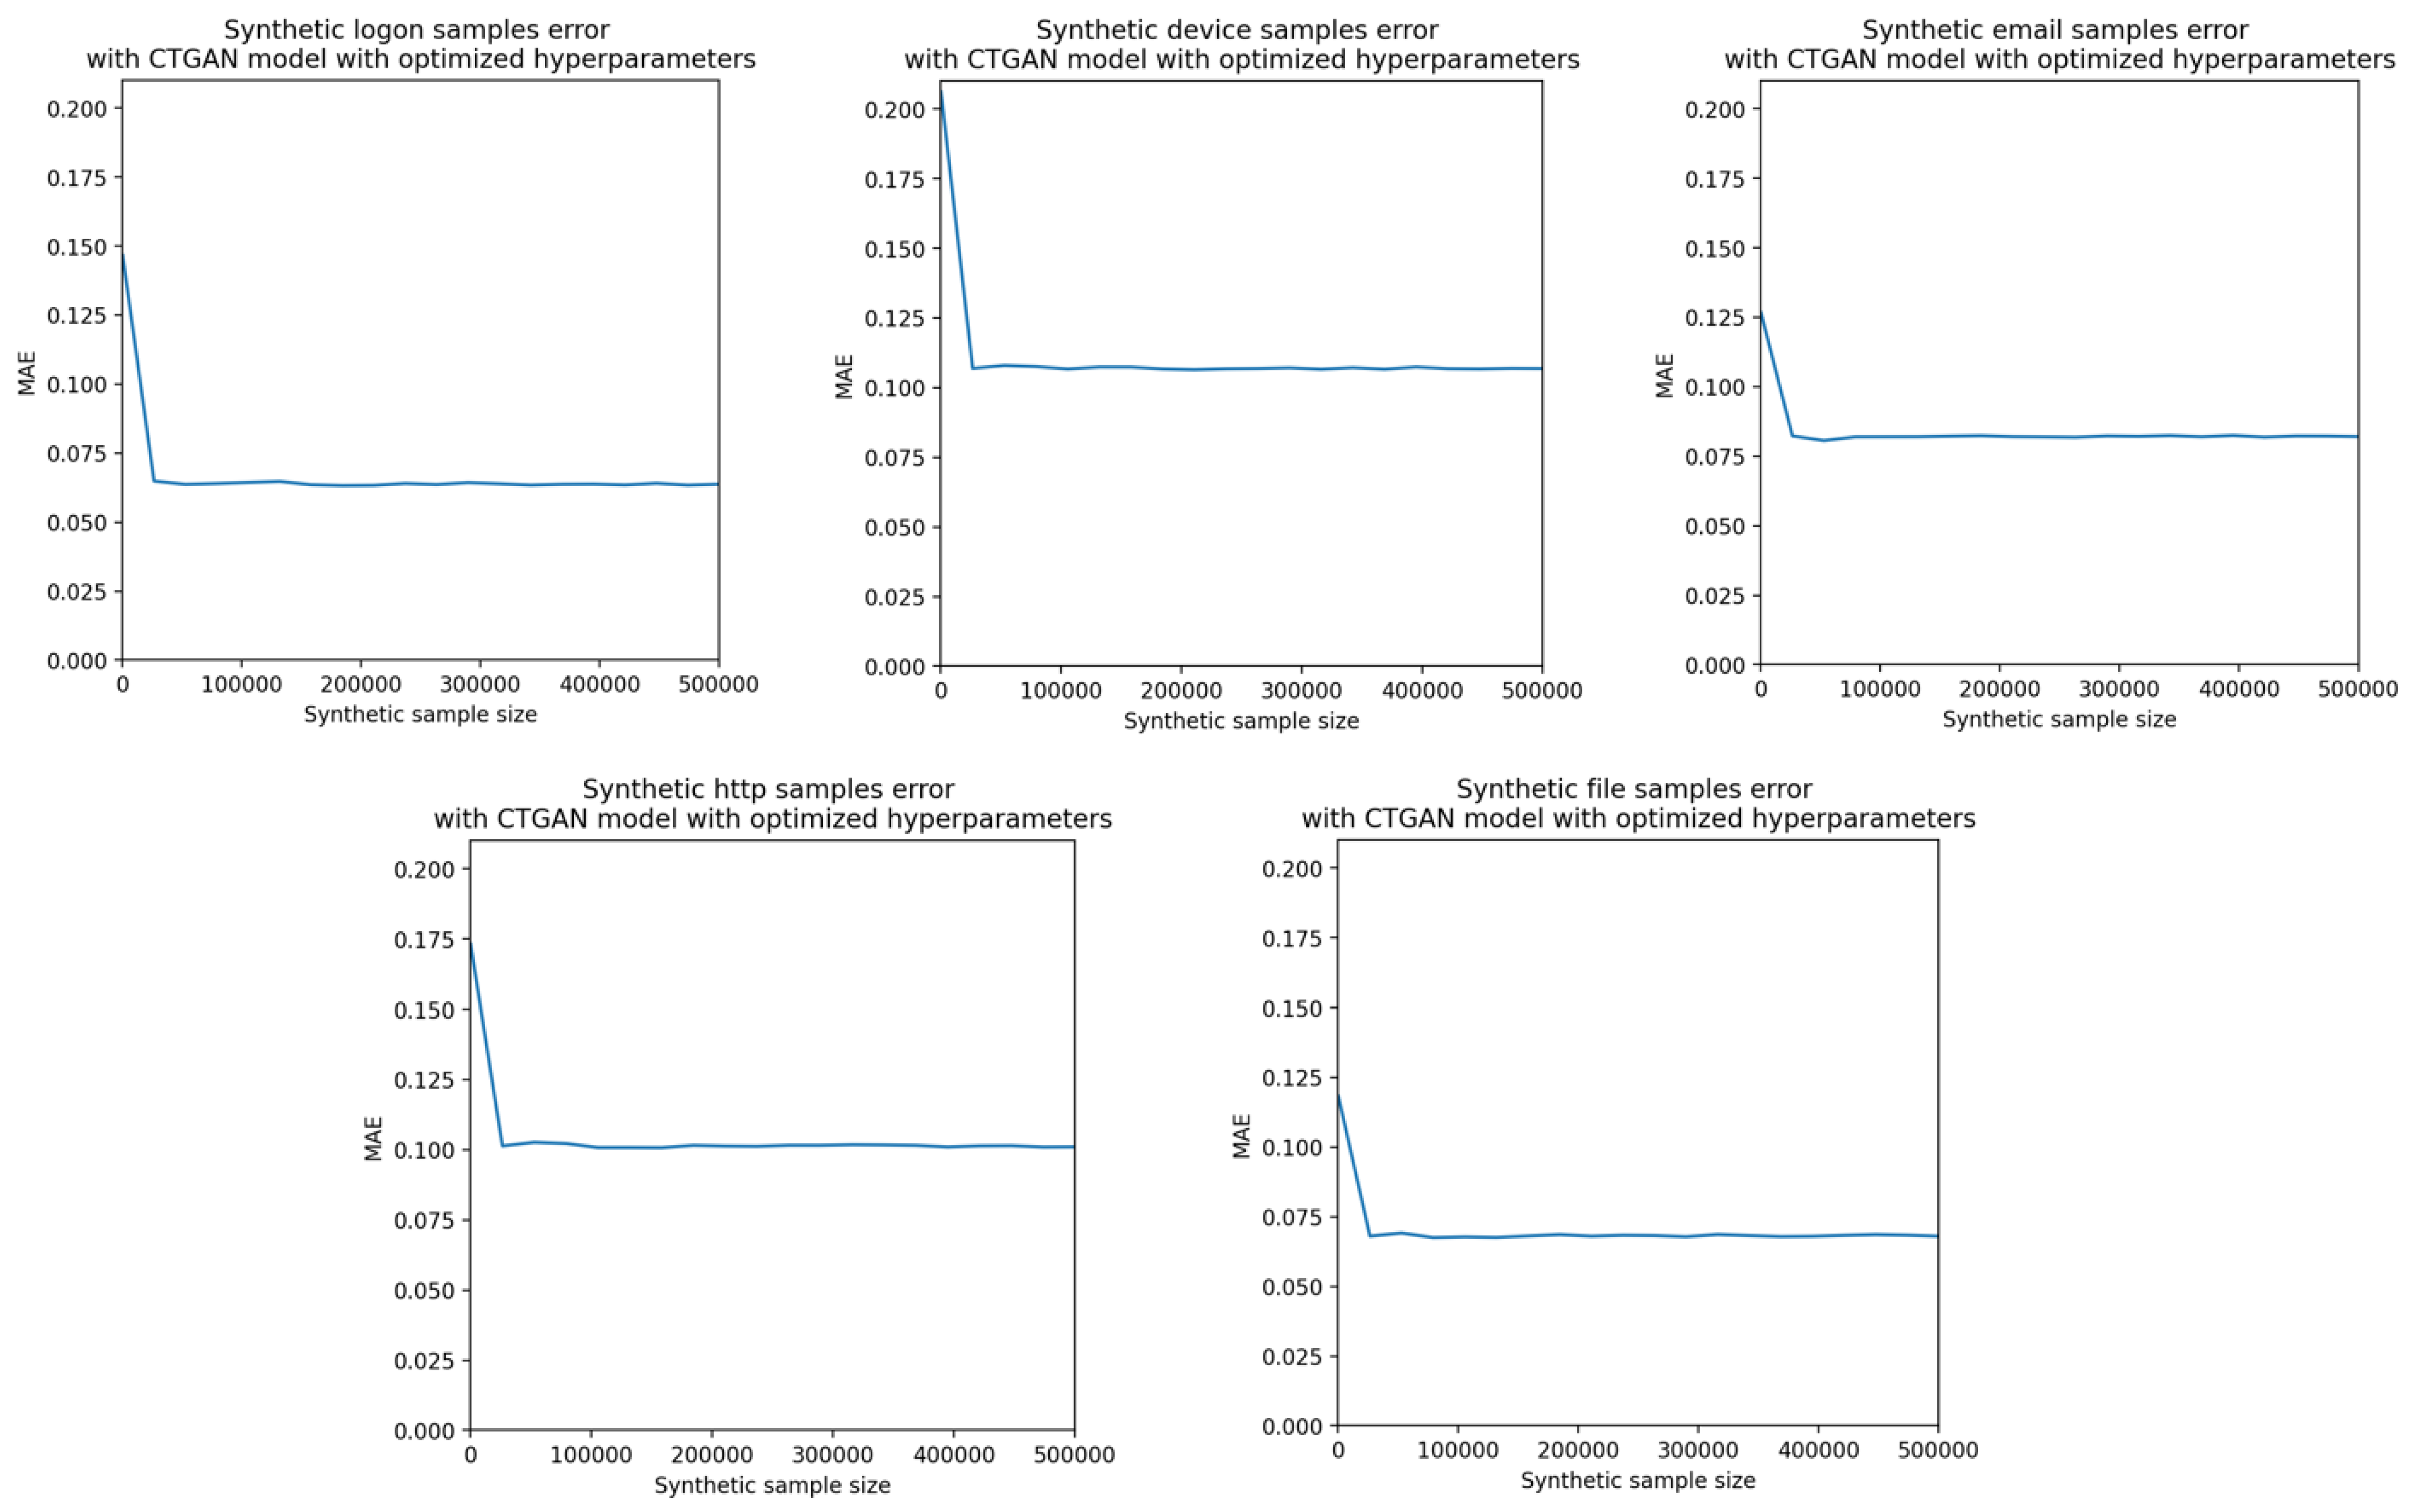
Appendix B. The Mean Absolute Error (MAE) (between the Probability Mass Functions (PMFs) of the Original Attacks and of the Attacks Generated Using the CTGAN with Optimized Hyperparameter Values) as Function of the Number of Attacks Sampled from the PMFs Estimated Using the CTGAN

References
- Azaria, A.; Richardson, A.; Kraus, S.; Subrahmanian, V. Behavioral analysis of insider threat: A survey and bootstrapped prediction in imbalanced data. IEEE Trans. Comput. Soc. Syst. 2014, 1, 135–155. [Google Scholar] [CrossRef]
- Trzeciak, R.; CERT INSIDER THREAT CENTER. The CERT Insider Threat Database. Carnegie Mellon University, Software Engineering Institute’s Insights (Blog). 2011. Available online: https://insights.sei.cmu.edu/blog/the-cert-insider-threat-database/ (accessed on 24 July 2023).
- Glasser, J.; Lindauer, B. Bridging the gap: A pragmatic approach to generating insider threat data. In Proceedings of the Security and Privacy Workshops, San Francisco, CA, USA, 23–24 May 2013; IEEE: New York, NY, USA, 2013; pp. 98–104. [Google Scholar]
- Tavallaee, M.; Bagheri, E.; Lu, W.; Ghorbani, A.A. A detailed analysis of the KDD CUP 99 data set. In Proceedings of the IEEE Symposium on Computational Intelligence for Security and Defense Applications, Ottawa, ON, Canada, 8–10 July 2009; IEEE: New York, NY, USA, 2009; pp. 1–6. [Google Scholar]
- Sharafaldin, I.; Lashkari, A.H.; Ghorbani, A.A. Toward generating a new intrusion detection dataset and intrusion traffic characterization. In Proceedings of the 4th International Conference on Information Systems Security and Privacy (ICISSP), Funchal, Portugal, 22–24 January 2018; SciTePress: Setubal, Portugal, 2018. [Google Scholar]
- Xu, L.; Skoularidou, M.; Cuesta-Infante, A.; Veeramachaneni, K. Modeling tabular data using conditional GAN. Adv. Neural Inf. Process. Syst. 2019, 32, 7335–7345. [Google Scholar]
- Caminero, G.; Lopez-Martin, M.; Carro, B. Adversarial environment reinforcement learning algorithm for intrusion detection. Comput. Netw. 2019, 159, 96–109. [Google Scholar] [CrossRef]
- Van Hasselt, H.; Guez, A.; Silver, D. Deep reinforcement learning with double Q-learning. In Proceedings of the AAAI Conference on Artificial Intelligence, Phoenix, AZ, USA, 12–17 February 2016; AAAI Press: Washington, DC, USA, 2016; Volume 30. [Google Scholar]
- Huber, P.J. Robust estimation of a location parameter. In Breakthroughs in Statistics: Methodology and Distribution; Springer: New York, NY, USA, 1992; pp. 492–518. [Google Scholar]
- Brown, P.; Brown, A.; Gupta, M.; Abdelsalam, M. Online malware classification with system-wide system calls in cloud IaaS. In Proceedings of the 23rd International Conference on Information Reuse and Integration for Data Science (IRI), Virtual Conference, 9–11 August 2022; pp. 146–151. [Google Scholar]
- Bergstra, J.; Bardenet, R.; Bengio, Y.; Kégl, B. Algorithms for hyper-parameter optimization. Adv. Neural Inf. Process. Syst. 2011, 24, 2546–2554. [Google Scholar]
- McCarthy, A.; Ghadafi, E.; Andriotis, P.; Legg, P. Functionality-preserving adversarial machine learning for robust classification in cybersecurity and intrusion detection domains: A survey. J. Cybersecur. Priv. 2022, 2, 154–190. [Google Scholar] [CrossRef]
- Gayathri, R.G.; Sajjanhar, A.; Xiang, Y.; Ma, X. Anomaly detection for scenario-based insider activities using CGAN augmented data. In Proceedings of the 20th International Conference on Trust, Security and Privacy in Computing and Communications (TrustCom), Shenyang, China, 20–22 October 2021; IEEE: New York, NY, USA, 2021; pp. 718–725. [Google Scholar] [CrossRef]
- Yuan, F.; Shang, Y.; Liu, Y.; Cao, Y.; Tan, J. Data augmentation for insider threat detection with GAN. In Proceedings of the 32nd International Conference on Tools with Artificial Intelligence (ICTAI), Baltimore, MD, USA, 9–11 November 2020; IEEE: New York, NY, USA, 2020; pp. 632–638. [Google Scholar] [CrossRef]
- Gayathri, R.G.; Sajjanhar, A.; Xiang, Y. Adversarial training for robust insider threat detection. In Proceedings of the International Joint Conference on Neural Networks (IJCNN), Padua, Italy, 18–23 July 2022; IEEE: New York, NY, USA, 2022; pp. 1–8. [Google Scholar] [CrossRef]
- Ali-Gombe, A.; Elyan, E. MFC-GAN: Class-imbalanced dataset classification using multiple fake class generative adversarial network. Neurocomputing 2019, 361, 212–221. [Google Scholar] [CrossRef]
- Sood, T.; Prakash, S.; Sharma, S.; Singh, A.; Choubey, H. Intrusion detection system in wireless sensor network using conditional generative adversarial network. Wirel. Pers. Commun. 2022, 126, 911–931. [Google Scholar] [CrossRef]
- Chen, T.; Guestrin, C. XGBoost: A scalable tree boosting system. In Proceedings of the 22nd ACM SIGKDD International Conference on Knowledge Discovery and Data Mining, San Francisco, CA, USA, 13–17 August 2016; ACM: New York, NY, USA, 2016; pp. 785–794. [Google Scholar]
- OpenAI. ChatGPT: Large Language Model. 2023. Available online: https://chat.openai.com/ (accessed on 20 July 2023).
- Gupta, M.; Akiri, C.; Aryal, K.; Parker, E.; Praharaj, L. From ChatGPT to ThreatGPT: Impact of generative AI in cybersecurity and privacy. IEEE Access 2023. [Google Scholar] [CrossRef]
- Aryal, K.; Gupta, M.; Abdelsalam, M. A survey on adversarial attacks for malware analysis. IEEE Commun. Surv. Tutor. 2022, 25, 467–496. [Google Scholar]
- Elderman, R.; Pater, L.J.J.; Thie, A.S.; Drugan, M.M.; Wiering, M.A. Adversarial reinforcement learning in a cyber security simulation. In Proceedings of the 9th International Conference on Agents and Artificial Intelligence (ICAART), Porto, Portugal, 24–16 February 2017; SciTePress Digital Library: Setubal, Portugal, 2017; pp. 559–566. [Google Scholar]
- Sethi, K.; Madhav, Y.V.; Kumar, R.; Bera, P. Attention based multi-agent intrusion detection systems using reinforcement learning. J. Inf. Secur. Appl. 2021, 61, 102923. [Google Scholar] [CrossRef]
- Mnih, V.; Kavukcuoglu, K.; Silver, D.; Rusu, A.A.; Veness, J.; Bellemare, M.G.; Graves, A.; Riedmiller, M.; Fidjeland, A.K.; Ostrovski, G.; et al. Human-level control through deep reinforcement learning. Nature 2015, 518, 529–533. [Google Scholar] [CrossRef] [PubMed]
- Jin, X.; Liang, J.; Tong, W.; Lu, L.; Li, Z. Multi-agent trust-based intrusion detection scheme for wireless sensor networks. Comput. Electr. Eng. 2017, 59, 262–273. [Google Scholar] [CrossRef]
- Krishnan Sadhasivan, D.; Balasubramanian, K. A fusion of multiagent functionalities for effective intrusion detection system. Secur. Commun. Netw. 2017, 2017, 6216078. [Google Scholar] [CrossRef]
- Freund, Y.; Schapire, R.E. A desicion-theoretic generalization of on-line learning and an application to boosting. In Proceedings of the European Conference on Computational Learning Theory, Barcelona, Spain, 13–15 March 1995; Springer: Berlin/Heidelberg, Germany, 1995; pp. 23–37. [Google Scholar]
- Cohen, W.W. Fast effective rule induction. In Machine Learning Proceedings; Elsevier: Amsterdam, The Netherlands, 1995; pp. 115–123. [Google Scholar]
- Stolfo, S.; Fan, W.; Lee, W.; Prodromidis, A.; Chan, P. KDD Cup 1999 Data; UCI Machine Learning Repository; University of California: Irvine, CA, USA, 1999. [Google Scholar] [CrossRef]
- Boyer, S.A. Supervisory Control and Data Acquisition; International Society of Automation (ISA): Pittsburgh, PA, USA, 1999. [Google Scholar]
- Achbarou, O.; El Kiram, M.A.; Bourkoukou, O.; Elbouanani, S. A new distributed intrusion detection system based on multi-agent system for cloud environment. Int. J. Commun. Netw. Inf. Secur. 2018, 10, 526. [Google Scholar] [CrossRef]
- Suwannalai, E.; Polprasert, C. Network intrusion detection systems using adversarial reinforcement learning with deep Q-network. In Proceedings of the 18th International Conference on ICT and Knowledge Engineering (ICT&KE), Bangkok, Thailand, 18–20 November 2020; IEEE: New York, NY, USA, 2020; pp. 1–7. [Google Scholar]
- Ma, X.; Shi, W. AESMOTE: Adversarial reinforcement learning with SMOTE for anomaly detection. IEEE Trans. Netw. Sci. Eng. 2020, 8, 943–956. [Google Scholar] [CrossRef]
- Chawla, N.V.; Bowyer, K.W.; Hall, L.O.; Kegelmeyer, W.P. SMOTE: Synthetic minority over-sampling technique. J. Artif. Intell. Res. 2002, 16, 321–357. [Google Scholar] [CrossRef]
- Bishop, C.M.; Nasrabadi, N.M. Pattern Recognition and Machine Learning; Springer: New York, NY, USA, 2006; Volume 4. [Google Scholar]
- Jang, E.; Gu, S.; Poole, B. Categorical reparameterization with Gumbel-Softmax. In Proceedings of the International Conference on Learning Representations (ICLR), Toulon, France, 24–26 April 2017. [Google Scholar]
- Gulrajani, I.; Ahmed, F.; Arjovsky, M.; Dumoulin, V.; Courville, A.C. Improved training of Wasserstein GANs. In Proceedings of the 31st Advances in Neural Information Processing Systems, Red Hook, NY, USA, 4–9 December 2017; Volume 30. [Google Scholar]
- Kingma, D.P.; Ba, J. Adam: A method for stochastic optimization. In Proceedings of the International Conference on Learning Representations (ICLR), San Diego, CA, USA, 7–9 May 2015. [Google Scholar]


| Hyperparameters | Meaning |
|---|---|
| Batch size | The size of the samples employed to optimize the GAN’s parameters |
| Discriminator decay | A weight decay employed by the Adam optimizer for the discriminator neural network |
| Discriminator learning rate | The initial learning rate used by the Adam optimizer for the discriminator neural network |
| Discriminator steps | The steps for the discriminator neural network |
| Generator decay | A weight decay employed by the Adam optimizer for the generator neural network |
| Generator learning rate | The initial learning rate used by the Adam optimizer for the generator neural network |
| Log frequency | An indicator parameter for if the PMF is defined with the logarithmic function. |
| Characteristics | Values |
|---|---|
| PC | HP-Z2-Tower-G4-Workstation |
| CPU | Intel® Core™ i7-8700 CPU @ 3.20 GHz × 12 |
| RAM | 15.5 GiB |
| GPU | NVIDIA GP106GL [Quadro P2200] |
| Disk | 1.5 TB |
| OS | Ubuntu 20.04.6 LTS |
| Python IDE | Spyder 3.3.6 |
| Python | 3.8.10 |
| Hyperopt | 0.2.7 |
| Keras | 2.7.0 |
| Tensorflow | 2.7.0 |
| Torch | 1.8.0 |
| CTGAN [6] | 0.7.0 |
| Hyperparameters | Default | Logon CTGAN | Device CTGAN | Http CTGAN | Email CTGAN | File CTGAN |
|---|---|---|---|---|---|---|
| Batch size | 500 | 390 | 450 | 600 | 90 | 60 |
| Discriminator decay | ||||||
| Discriminator learning rate | ||||||
| Discriminator steps | 1 | 8 | 2 | 2 | 7 | 7 |
| Generator decay | ||||||
| Generator learning rate | ||||||
| Log frequency | True | True | True | True | True | False |
| Scenario | F1-Score (Unbalanced) | F1-Score (Balanced) | Difference Rate (%) | Precision (Unbalanced) | Precision (Balanced) | Difference Rate (%) | Recall (Unbalanced) | Recall (Balanced) | Difference Rate (%) |
|---|---|---|---|---|---|---|---|---|---|
| Normal | 0.9601 | 0.8552 | −11 | 0.9999 | 0.9200 | −8 | 0.9234 | 0.7990 | −13 |
| Scenario 1 | 0.0620 | 0.5915 | 853 | 0.0321 | 0.5643 | 1658 | 0.9349 | 0.6214 | −34 |
| Scenario 2 | 0.0142 | 0.5769 | 3 965 | 0.007 | 0.5146 | 7097 | 0.9652 | 0.6564 | −14 |
| Scenario 3 | 0.0078 | 0.5502 | 6 992 | 0.0039 | 0.4210 | 10,707 | 0.9202 | 0.7940 | −23 |
| Attack/Normal | 0.0463 | 0.7617 | 15 | 0.0237 | 0.6826 | 28 | 0.9667 | 0.8619 | −11 |
Disclaimer/Publisher’s Note: The statements, opinions and data contained in all publications are solely those of the individual author(s) and contributor(s) and not of MDPI and/or the editor(s). MDPI and/or the editor(s) disclaim responsibility for any injury to people or property resulting from any ideas, methods, instructions or products referred to in the content. |
© 2023 by the authors. Licensee MDPI, Basel, Switzerland. This article is an open access article distributed under the terms and conditions of the Creative Commons Attribution (CC BY) license (https://creativecommons.org/licenses/by/4.0/).
Share and Cite
Mouyart, M.; Medeiros Machado, G.; Jun, J.-Y. A Multi-Agent Intrusion Detection System Optimized by a Deep Reinforcement Learning Approach with a Dataset Enlarged Using a Generative Model to Reduce the Bias Effect. J. Sens. Actuator Netw. 2023, 12, 68. https://doi.org/10.3390/jsan12050068
Mouyart M, Medeiros Machado G, Jun J-Y. A Multi-Agent Intrusion Detection System Optimized by a Deep Reinforcement Learning Approach with a Dataset Enlarged Using a Generative Model to Reduce the Bias Effect. Journal of Sensor and Actuator Networks. 2023; 12(5):68. https://doi.org/10.3390/jsan12050068
Chicago/Turabian StyleMouyart, Matthieu, Guilherme Medeiros Machado, and Jae-Yun Jun. 2023. "A Multi-Agent Intrusion Detection System Optimized by a Deep Reinforcement Learning Approach with a Dataset Enlarged Using a Generative Model to Reduce the Bias Effect" Journal of Sensor and Actuator Networks 12, no. 5: 68. https://doi.org/10.3390/jsan12050068