Article

Extraction of Hidden Authentication Factors from Possessive Information

by
Nilobon Nanglae
,
Bello Musa Yakubu
* and
Pattarasinee Bhattarakosol
*
Department of Mathematics and Computer Science, Faculty of Science, Chulalongkorn University, Bangkok 10330, Thailand
*
Authors to whom correspondence should be addressed.
J. Sens. Actuator Netw. 2023, 12(4), 62; https://doi.org/10.3390/jsan12040062
Submission received: 7 June 2023 / Revised: 24 July 2023 / Accepted: 8 August 2023 / Published: 11 August 2023
(This article belongs to the Special Issue Advances in Security of Cyber-Physical Systems)

Abstract

:
Smartphones have emerged as a ubiquitous personal gadget that serve as a repository for individuals’ significant personal data. Consequently, both physiological and behavioral traits, which are classified as biometric technologies, are used in authentication systems in order to safeguard data saved on smartphones from unauthorized access. Numerous authentication techniques have been developed; however, several authentication variables exhibit instability in the face of external influences or physical impairments. The potential failure of the authentication system might be attributed to several unpredictable circumstances. This research suggests that the use of distinctive and consistent elements over an individual’s lifespan may be employed to develop an authentication classification model. This model would be based on prevalent personal behavioral biometrics and could be readily implemented in security authentication systems. The biological biometrics acquired from an individual’s typing abilities during data entry include their name, surname, email, and phone number. Therefore, it is possible to establish and use a biometrics-based security system that can be sustained and employed during an individual’s lifetime without the explicit dependance on the functionality of the smartphone devices. The experimental findings demonstrate that the use of a mobile touchscreen as the foundation for the proposed verification mechanism has promise as a high-precision authentication solution.

1. Introduction

The first smartphone was the Simon Smartphone, which was introduced by IBM in 1992 [1,2]. Since then, smartphones have been used for a wide range of activities in addition to making and receiving phone calls, including gaming, accessing social networks, and storing data, all of which are referred to as “everyday activities” [3]. Smartphones with mobile applications are also frequently used for financial transactions, email, e-health apps, and connection to the Internet of Things (IoT) [4]. Thus, a significant amount of information is stored on or delivered by mobile applications. A significant proportion of this information is private and important.
For this reason, smartphone security is a significant issue, and users require an efficient authentication method to protect their devices. Traditional authentication mechanisms, such as personal identification numbers (PINs), passwords, and patterns, can be easily bypassed through malicious attacks, regardless of their strength and complexity [5]. Moreover, the owner may forget them. With smartphones, cyberattacks are a particular risk from third parties [6]; hence, standard security procedures using two-factor authentication, such as a password and card, should be used. However, users may lose the card or forget the password and lock themselves out of the system.
A powerful alternative security method is the use of biometrics to protect valuable data. Biometric data can be divided into two main categories: physiological and behavioral [7]. Physiological biometrics include the iris, retina, face, and fingerprint measurements, while behavioral biometrics include actions such as handwriting, voice recognition, and keystroke recognition. Physiological biometrics are used more widely in commercial products, but behavioral biometrics are gaining popularity because a person’s “action by instinct” cannot be changed or replicated. Security control research shows that the quality of biometric protection is fairly high. For example, keystroke features and sensors on a smartphone can achieve 97.90% accuracy [8], gain data from smartphones can be utilized to provide an accuracy of 98.79% [9], the average recognition of touch gestures based on interactions with phones is 74.97% [10], 98.30% accuracy can be reached based on a user’s daily behavior on a mobile device [11], and using the unique keypad on a smartphone to enter PINs, the Equal Error Rate (EER) is 10.01% according to the keystroke dynamics [12]. Furthermore, earlier research has mainly focused on static keystrokes, analyzing users’ fixed-text typing habits. Higher performance precision is achieved by static keystroke dynamics.
Moreover, biometric technologies can improve security in several ways. Multi-biometrics make use of the capabilities and advantages of each biometric to overcome the limitations of each individual biometric, resulting in a highly accurate identification and verification process. A biometrics system that uses more than one biometric identifier, such as a combination of the iris and fingerprint, obtains values for false acceptance rate (FAR), false rejection rate (FRR), and enrollee false acceptance rate (EFAR) between 0 and 1 [13]. A combination of fingerprint, iris, and palm prints on a secret key can identify an imposter with an FAR of 94.54 and a FRR of 0.15% [14]. Another system incorporates user actions including touch gestures, keystroke dynamics, app usage statistics, Wi-Fi, and GPS position when users interact naturally with their smartphones, with an average accuracy of 82.2% to 97.1% [15]. When combined, the electrocardiogram (ECG) and finger vein biometric systems provide a high level of performance, with an equal error rate (EER) of 0.12% [16]. Furthermore, mobile device usage data can be used for authentication. An individual’s pattern can be defined as a user’s interaction behavior with a smartphone application or service. When using a phone, authentication systems can employ motion and hold posture (which accelerate and record the variation model of micro hand motions and hold patterns), which have a 97% accuracy [17]. Furthermore, the use of mobile device-based keystrokes and swipe dynamics provides identification results with an accuracy of up to 94.26% [18]. Authenticating a smartphone with an accuracy of 97.15% may be achieved using several smartphone sensors. These sensors include keystroke, GPS position, accelerometer, gyroscope, magnetometer, linear accelerometer, gravity, and rotation sensors [19]. The performance of many biometric criteria is shown in Table 1.
However, although biometrics can efficiently detect imposters, they have some limitations. For instance, keystroke dynamics describes a person’s typing rhythm, which can be affected by emotions and physical injury [20]. Moreover, typing patterns can change according to the environment or equipment [21,22]. Furthermore, facial recognition may fail if someone has had plastic surgery, while it has been found that twins can access each other’s devices, as was the case when Apple first introduced facial recognition to unlock the iPhone X, iPhone XS Max, iPhone XR, and iPhone 12 [23,24,25]. The accuracy of physiological biometrics can also be degraded over time, as the human body changes unavoidably every day. Biometric data must, therefore, be updated periodically. Thus, there are limitations to both physiological and behavioral biometric authentication [26], and they are not as flexible as expected. Although these security measures are difficult to bypass, they can fail due to changes in the owner, either intentional or not. Table 2 presents the efficiency and dependency of some existing methods under the sustainability metrics.
Despite these limitations, biometrics continue to be regarded as the most effective authentication methods and are frequently employed. In addition, biometrics are growing increasingly intricate when they are integrated with other systems, such as a PIN, to improve their accuracy. Some individuals with physical problems or impairments may have difficulty providing reliable biometric authentication data. Those with hand or arm injuries may fail to provide reliable fingerprints, and those with visual problems may find it challenging to utilize the retinal scanning device. In addition, the biometric system of the facial recognition system may be unable to distinguish a face after significant surgery. In addition, the behavioral biometric detection based on keystroke dynamics may produce an incorrect identification value if the owner has an unstable disposition. A user’s stability is crucial: this include focusing on personal abilities and integrating diverse biometric elements for enhanced authentication procedures. Durability and individual abilities contribute to enhanced resistance against impersonation attempts, ensuring long-lasting authentication. Consequently, detection mistakes can be brought on by these unreliable biometric parameters. Therefore, malicious software can readily compromise authentication.
Problem statement: Existing smartphone authentication methods, including traditional mechanisms such as PINs and passwords, as well as biometric-based approaches, have various security, reliability, and user-friendliness limitations. PINs and passwords are easily circumvented or forgotten [27], whereas biometric measures such as fingerprint and facial recognition are susceptible to errors and attacks [28]. In addition, biometric data are subject to change over time, compromising the integrity of authentication systems [29,30,31,32]. Therefore, an enhanced authentication method that addresses these limitations and offers robust security, usability, and adaptability for smartphone users is necessary.
Aims and objectives: This study presents a multi-biometric authentication method that incorporates behavioral biometric factors. The objective is to address the shortcomings of single biometric authentication methods and the need for more robust and secure systems. Utilizing multiple biometrics, including physical and behavioral characteristics, the approach aims to enhance the authentication system’s uniqueness, stability over time, and individual skill. The goal is to present an authentication method that is difficult to imitate, trustworthy for an individual’s entire existence, and device-independent.
Contributions: This study presents novel security protection measures based on a user’s profile and behavioral biometrics in order to provide system stability across the lifetime of a biometric authentication system. This is anticipated to give a collection of variables that support a lifelong authentication categorization system if users continue to function without undergoing abnormal changes due to accidents, surgery, or other similar events.
The main contributions of this work are listed as follows:
  • The efficacy of an authentication system based on seven physiological and biological biometrics derived from commonly used personal behavioral biometrics.
  • The discovery of self-classifying alphabets using individual data is made.
  • The development of a security system based on several biometric measurements of an individual’s profile information that is useful for the duration of the individual’s life.

2. Different Attacks on Biometric Authentication Models

This section discusses the various biometric authentication model attacks that have been launched. In the majority of cases, the primary goal of an attacker is to obtain sensitive user data. To achieve their objectives, attackers rely heavily on the user information obtained during authentication. This can be accomplished through a variety of techniques, such as monitoring, brute force, guesswork, and shoulder surfing [28]. In this type of attack, the perpetrator intercepts communications between a user’s phone and mobile software servers in order to obtain sensitive information, such as a PIN or password, that could be used to access the system. In order to gain access to the system, attackers may also use replay attacks, in which they record and reproduce the biometric data of a legitimate user [33].
The brute-force attack method (also known as a password-guessing attack) is frequently used in hacking [33,34], despite the fact that there are numerous other attack methods. An attacker employs a brute-force attack when he or she repeatedly attempts every possible combination of characters to guess a password. An adversary gained access to T-server Mobile and databases by using a brute-force logon technique [35]. Attackers also use deception assaults, in which they construct a false biometric sample that is similar enough to the real one to fool the system into granting access [36]. It is also essential to note that biometric systems are susceptible to social engineering attacks, in which a perpetrator manipulates or fools a user into divulging sensitive information.
Numerous attacks have been implemented [33], some of which have successfully passed the authentication process as if they were authentic authenticated users; as a result, security measures are being strengthened to protect these operations. As a result, in the first line of defense, every system must be more precise and possess more robust entropy authentication. Clearly, this is the case. Table 3 displays several framework schemes for authentication architectures.
According to the research presented in Table 2, an efficient authentication system should offer a high level of security performance while also being simple, user-friendly, and cost-effective. Moreover, mobile-authentication techniques typically employ at least two-factor authentication for the heightened protection of users’ sensitive data.

3. System Model

The proposed method uses mobile devices with an application deployed to capture the personal characteristics of the users. Figure 1 demonstrates that the system consists of additional processes, such as personal characteristic capture (data collection and enrollment phase) and the user authentication phase, which consists of data preprocessing, feature extraction, classification, and validation.
The method allows users to input their confidential information, such as their name, last name, email address, and mobile phone number, since this information is unique to each individual. The users are anticipated to be most proficient at entering their own confidential information. Therefore, the typing characteristics of each individual’s information can be used for validation. The data was stored on a private, secure cloud server, and access to the data was rigorously regulated to ensure that it was only used for the study’s purposes. Before being stored, the data was encrypted, and only authorized personnel had access to the data.

Adversary Model

This section discusses the adversary’s characteristics in relation to this work. The main objective of adversaries is to acquire sensitive user information. In order to achieve their objective, as depicted in Figure 2, the adversary attempts to acquire the user’s information during the authentication data entry procedure. This can be accomplished through a variety of techniques, including eavesdropping, brute force, guesswork, and shoulder surfing. In order to obtain access to the system, the adversaries may also employ replay attacks, in which they record and reproduce the biometric data of a legitimate user. They may employ deception attacks, in which they generate a biometric sample that is sufficiently similar to the real one to fool the system into granting access. However, it is assumed that the adversary cannot manipulate or compromise the storage server or database.

4. Proposed System and Methodology Used

The proposed model consists of the front end of a web-based mobile application that employs a self-implemented keyboard that mimics the touchscreen keyboard found on iOS devices. Based on Figure 3, the application enables users to type their profile information accurately and in a manner that is familiar to them, emulating their typical smartphone typing behavior. The application is utilized during both the data collection/enrollment and user authentication phases. These phases were integral to the proposed model and will be discussed in detail in the following sections.

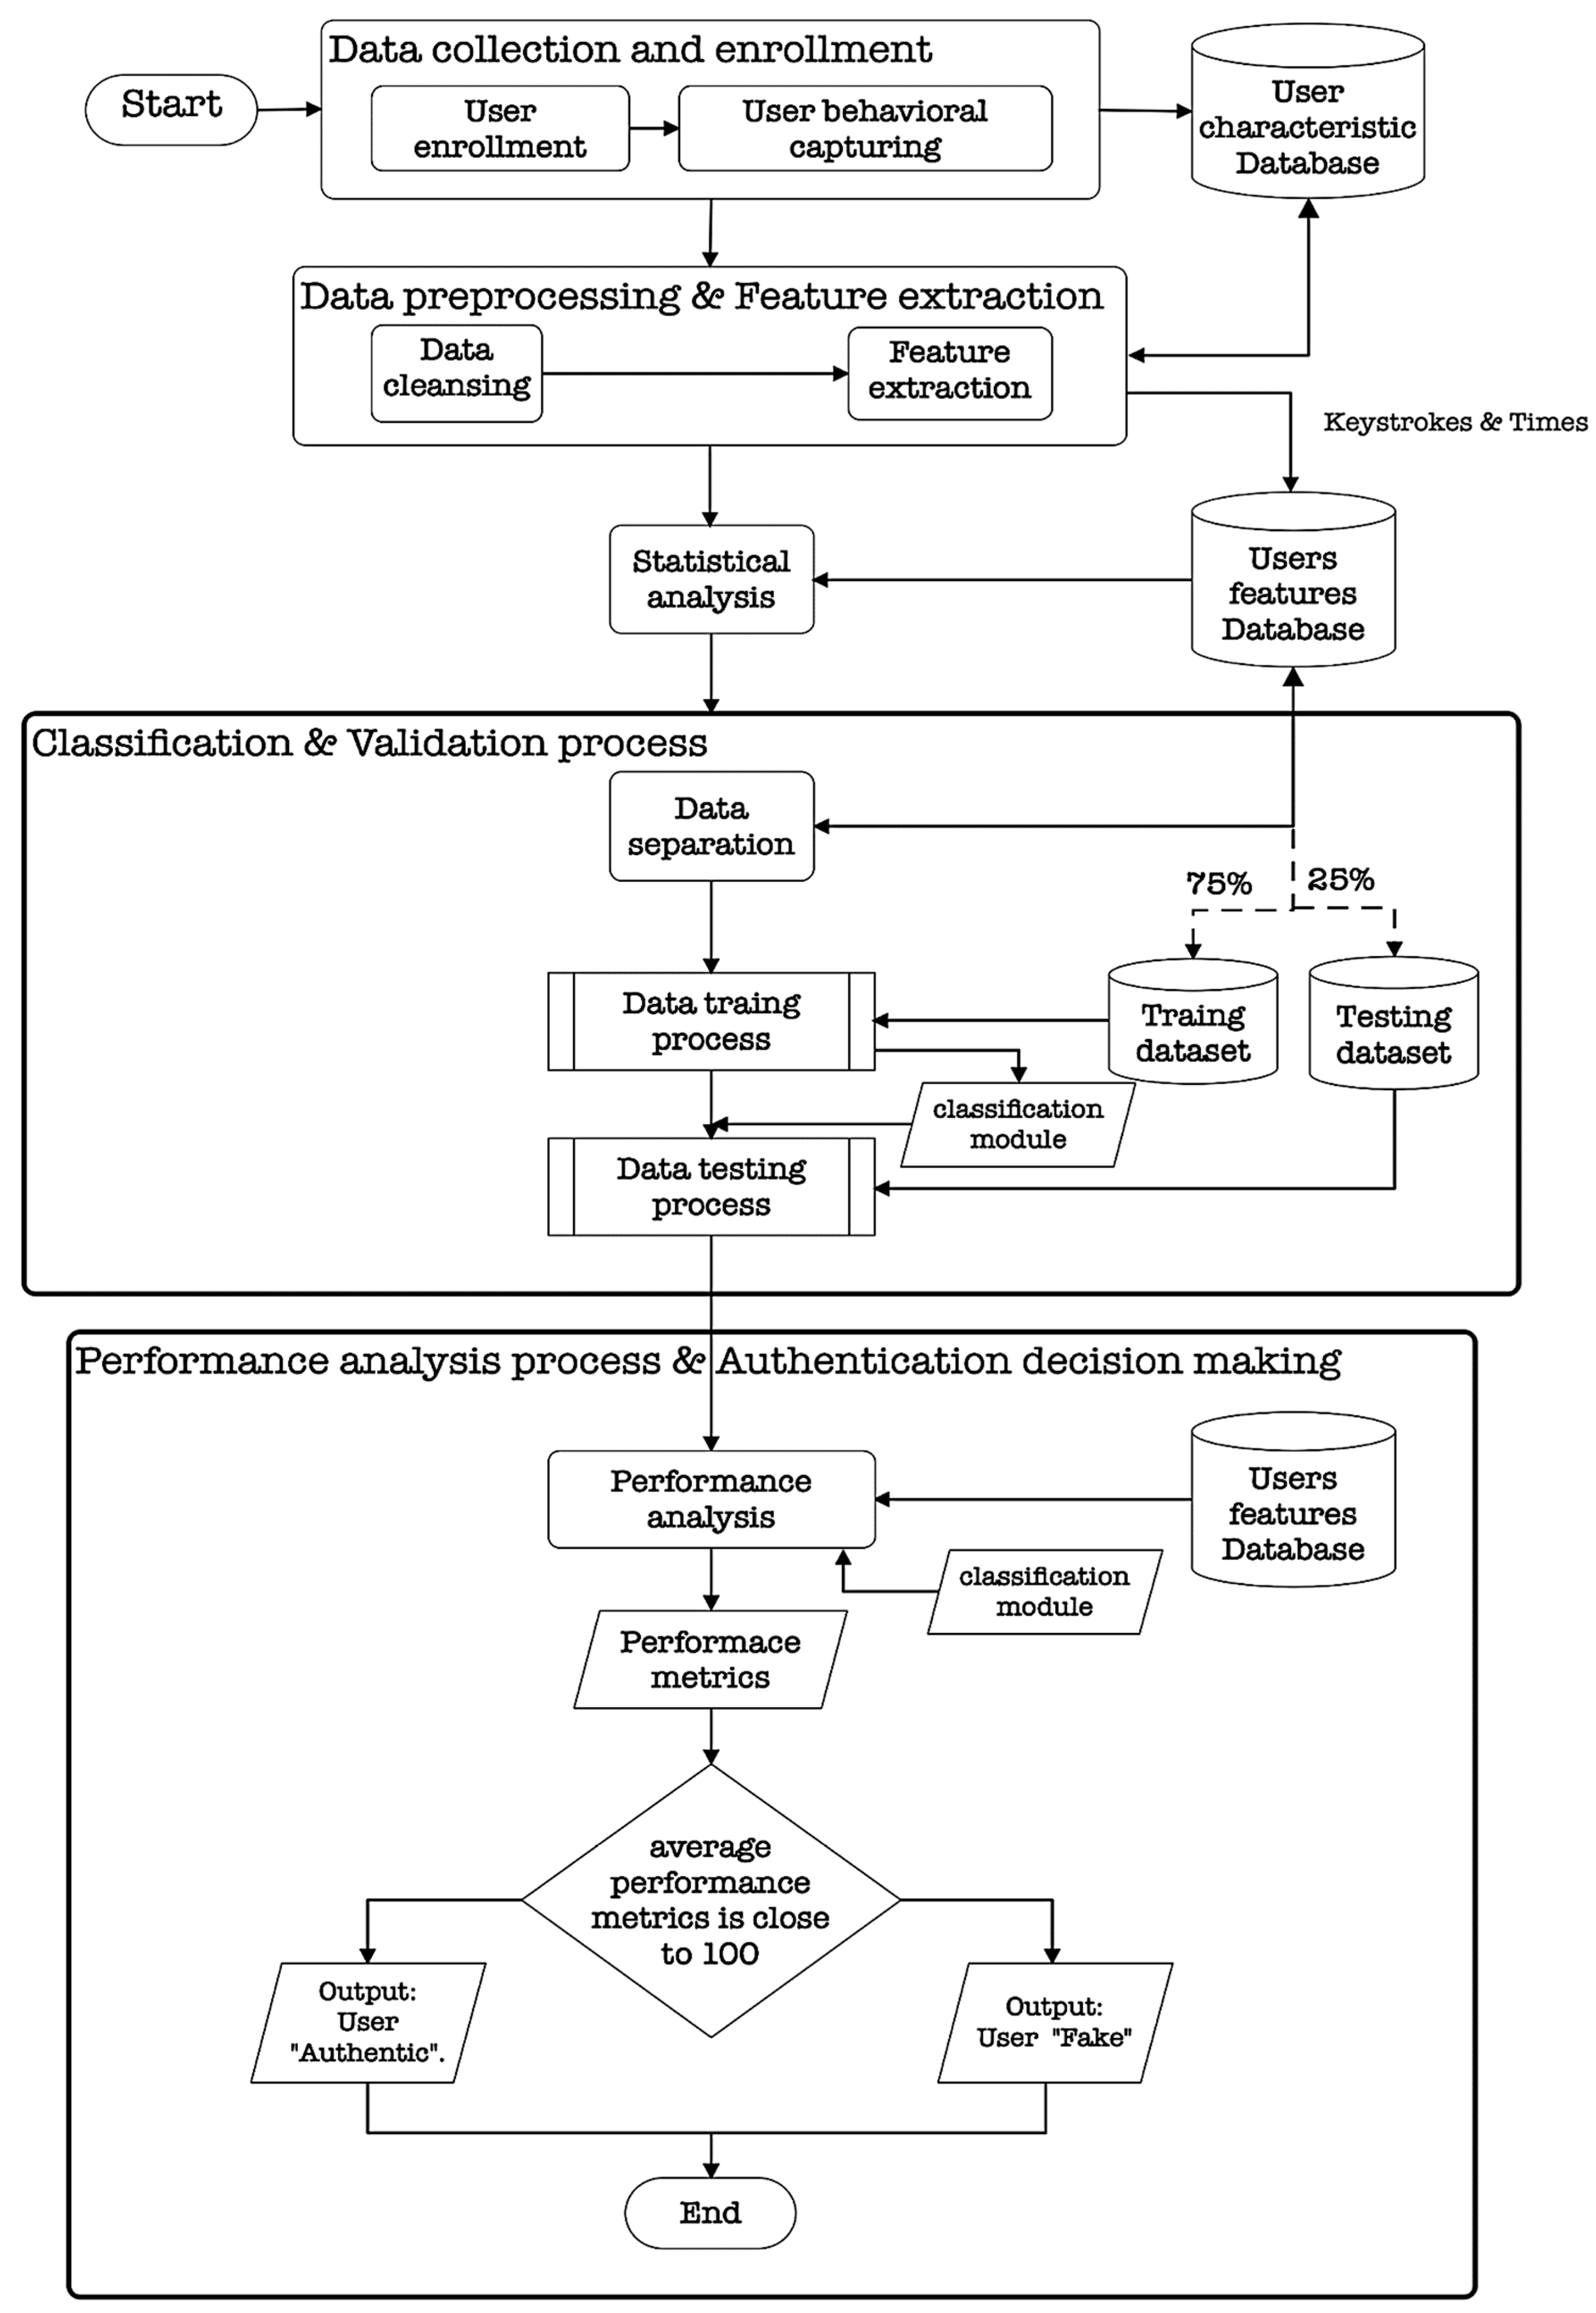
4.1. Data Collection and Enrollment Phase

In this research, 45 third-year undergraduate Computer Science students from the Faculty of Science at Chulalongkorn University were chosen, as they are all conversant with technology and use contemporary smartphones. Consent was obtained from all students (subjects) who participated in the study. Consequently, these subjects have all consented to participate in this phase of data collection. This phase focused on obtaining biometric factors for the authentication classification system that are efficient and indestructible. The iPhone 7 was used for the data collection phase of this study due to its popularity among the study participants, its screen size of 4.7 inches (60.9 cm2), and its advanced features, including a light sensor, proximity sensor, accelerometer, barometer, gyroscope, and multi-touch display with in-plane switching (IPS) technology.
The web-based application was initially installed on the participants’ devices. Initial consideration was given to factors that are intimately associated with the participant’s entire life and with which they are very familiar. These variables include their first and surname, email address, phone number, and gender. Each participant is required to input these attributes ten times, along with additional information such as age range, level of education, and posture, via the application interface on their respective devices. The data collection period spans ten (10) working days, during which participants interact with a web-based application.
The entered data, including timing keystroke values and other characteristics, were saved in a MySQL database that serves as the application’s infrastructure. Each type of data is stored in separate tables within a MySQL database. Within each table, individual characters and their related data are recorded as single separate record. For example, if the sample name is “sam”, it is recorded in the format “s, a, m”, along with other relevant information such as fingertip and finger pressure. A private cloud system was used to store the data, ensuring its security and accessibility for further analysis, as depicted in Figure 4.

4.2. User Authentication Phase

To achieve the authentication process of an arbitrary access requesting user, the system using the web-based mobile application will instruct the user to enter his identical personal profile. With this, the data will be further processed for authentication. The captured dataset was used to calculate the training and testing ratios, which were 75 percent and 25 percent, respectively. The following subsections discuss all the relevant steps needed for the captured data to be processed for authentication.

4.2.1. Data Preprocessing and Feature Extraction

As soon as all participant data had been compiled, outliers, missing values, and incomplete records were removed. After removing special characters such as interword spaces, the texts were entered into the database. Example: sample@yahoo.com becomes “sampleyahoocom” To eradicate outliers, the empirical method with a 95% confidence level was utilized. Therefore, valid data had to be within two standard deviations of the mean (mean plus or minus two std). As each character was recorded as a separate record in a database table, the time boundary for each character was calculated and used to remove all outliers. For the execution phase, only the 10 most frequent alphabets were chosen. During this stage, all keystroke characteristics, including dwell time, latency time, interval time, flight time, and up to up time, were calculated as given in Figure 5. In the realm of keystroke dynamics, a range of features are derived to capture distinct aspects of typing behavior. These features are calculated using specific formulas, as exemplified in Figure 5. The figure visually demonstrates the interconnections between different variables and elucidates the computational process.
(a)
Dwell Time: Dwell time represents the time interval between pressing and releasing a key.
(b)
Interval Time: Interval time measures the duration between consecutive key presses.
(c)
Latency Time: Latency time denotes the delay between pressing a key and the display of the corresponding character on the screen.
(d)
Flight Time: Flight time quantifies the duration between releasing one key and pressing the next key.
(e)
Up to Up Time: Up to up time captures the duration between releasing one key and releasing the subsequent key.
Although numerous factors were extracted from the input data, only a few could be used to uniquely identify an individual. Thus, statistical evidence was necessary to optimize the number of relevant factors. The following is a discussion of the statistical analysis methodology that was utilized.

4.2.2. Statistical Analysis

After acquiring a clean data set via the outlier reduction procedure, statistical analysis was conducted to determine the impact variables for all time values collected while participants entered data. Two independent tests, a completely randomized design, and an ANOVA were used to determine the effects of the factors on the keystroke characteristics. In these two methods of analysis, the observation values were keystroke characteristics such as dwell duration, interval time, up-to-up time, etc., while the factors were gender (since our participants consisted of both men and women) and fingertip area.
Consequently, based on the selected observation values, gender and fingertip regions are potential factors that can influence keystroke characteristics that contribute to an individual’s unique personality. This is because males typically press harder on the screen than women; therefore, the finger pressure area or fingertip area of a man’s typing will be larger than that of a woman’s typing. Likewise, fingers that press firmly tend to rise more slowly than those that press lightly. Thus, all keystroke characteristics are associated with a slow lifting speed. Since all keystroke characteristics are observation variables, and their values are typically influenced by gender and finger pressure, which affect the fingertip region, it is presumed that the significant factors are gender and fingertip size. Hence, the following hypotheses were drawn:
Hypothesis 1 (H1).
There is a significant difference in mean values of keystroke features between males and females.
Hypothesis 2 (H2).
There is at least one significant difference in a keystroke mean from other keystroke means when the fingertips areas are different.
Proof: 
After the data was collected, all outliers and missing data were eliminated using an empirical rule. The datasets were then checked for normal distribution using the Kolmogorov–Smirnov test with a 95% confidence level. As every p-value was equal to zero, which was less than the significance level, the results revealed that there was no normal distribution of all data factors. Thus, all tests were required to be non-parametric as a result. Consequently, the Mann–Whitney U test was performed to distinguish the effect of genders on all keystroke features. The results showed that gender affected the dwell time, interval time, latency time, flight time, and up-to-up time, with a confidence level of 95%, because all the p-values were equal to 0.00. So, the mean values of dwell time, interval time, latency time, flight time, and up-to-up time between males and females were significantly different. Moreover, since the fingertips contain more than one specific size, the comparisons for classifying the different effects of various sizes of fingertips on keystroke features had to be analyzed using the Kruskal–Wallis test. The analysis results showed that the size of the finger-tips significantly affected at least the mean of one of the following values: dwell time, latency time, flight time, up-to-up time, and finger pressure. All p-values for these tests were zero, which was less than the significant level. Therefore, it can be concluded that there is a significant difference between the mean values of keystroke features between males and females, and there is at least one significant difference of a keystroke mean from other keystroke means when the fingertips areas are different. □

4.2.3. Classification and Validation

It is important to recall that the purpose of this work was to identify authorized or unauthorized individuals based on specific factors. Thus, it was determined that a decision tree model is adequate for authentication classification, but it may lead to underfitting and overfitting. As a result, a decision tree model referred to as Gradient-boosted trees (GBT) [40] was chosen as the classification model in order to both improve the fragrance and address the challenges. By minimizing previous tree errors, these trees transform poor learners into strong ones, ensuring nearly flawless performance. Gradient-boosted trees can be used to generate predictive models for regression and classification problems, where each successive tree enhances the accuracy of the preceding tree.
Therefore, the GBT mechanism was used to process the authentication classification model. The one-for-all strategy was employed, which is a training procedure for binary classification in which one class represents positive samples and the remainder represent negative samples [41]. The training was also set to split each dataset into 75% training set and 25% testing set. RapidMiner version 9.7 was used to execute the algorithm on a MacBook Pro with a dual-core Intel Core i5 processor and 8 GB of RAM by inputting the parameters from the selected factors (gender and fingertip area). The model’s performance metrics consist of accuracy, precision, and recall. The metric relationships were used to determine the suitability and accuracy of the access-requesting user authentication factors. In other words, a particular user is considered relevant and authentic if the returned performance metrics have average values that are close to 100 percent. The results reveal, in the order obtained, the performance of the testing model and user model template based on the sample type. The user model template refers to a pre-established framework designed to systematically organize and arrange user-related data inside a categorization model. The dataset comprises input characteristics and their matching output labels, which are used for prediction purposes. In the proposed authentication categorization system, the template incorporates various keystroke dynamics data such as dwell time, flight time, latency time, interval time, and others. The output label indicates the authentication status of the user. The user model template functions as a framework for training the classification model and generating predictions for new user data. This allows the model to acquire knowledge from past data and apply patterns to effectively categorize new users, taking into account factors such as keyboard behavior or other pertinent aspects. Figure 6 depicts the authentication phase procedures for users. Figure 7 summarizes the overarching operational principle of the proposed model. It describes the flow of the entire model operation, from data collection and enrollment to user authentication/validation procedures, which, when implemented correctly, allow for effective user authentications.

5. Experimental Setup and Performance Metrics

The proposed was implemented using RapidMiner version 9.7 and RapidMiner v6, which are data science platforms that provide a graphical user interface (GUI) for building and executing machine learning workflows. A web-based application was developed using PHP and JavaScript to collect personal data from the participants. The data were entered using the touchscreen keyboard, and the entered keystrokes and related features were stored in a MySQL database for further analysis and processing. This application was loaded and run on an iOS-based smartphone. The Gradient Boosted Trees algorithm was used as the classifier for training the data of users. It is a machine learning algorithm that combines multiple weak predictive models (decision trees) to create a strong predictive model. An empirical approach was employed with a 95% confidence level during data cleaning, which involved eliminating outliers, missing values, special characters or spaces, and incomplete records from the dataset. In addition, the following parameter settings were adopted in the experiments:
  • This experiment’s intended audience consisted of individuals who regularly use smartphones. To prevent bias in the evaluation procedure, the sample was selected at random under strict control conditions.
  • To safeguard the participants’ confidential information, pseudonyms were used in lieu of their actual identities.
  • The data capture process involved using mobile devices, specifically the iPhone 7, which has a touchscreen and additional sensors such as a light sensor, proximity sensor, accelerometer, barometer, and gyroscope. The choice of this device was based on its widespread use and intermediate screen size.
  • A total number of 45 participants (i.e., N = 45) were considered based on Yamane’s equation [42], n = N ( 1 + N e 2 ) , which was used to calculate the required sample size n . Hence, a sample size of 31 was necessary for an error of 0.1. This condition was satisfied because there were 38 volunteers for the experiment.
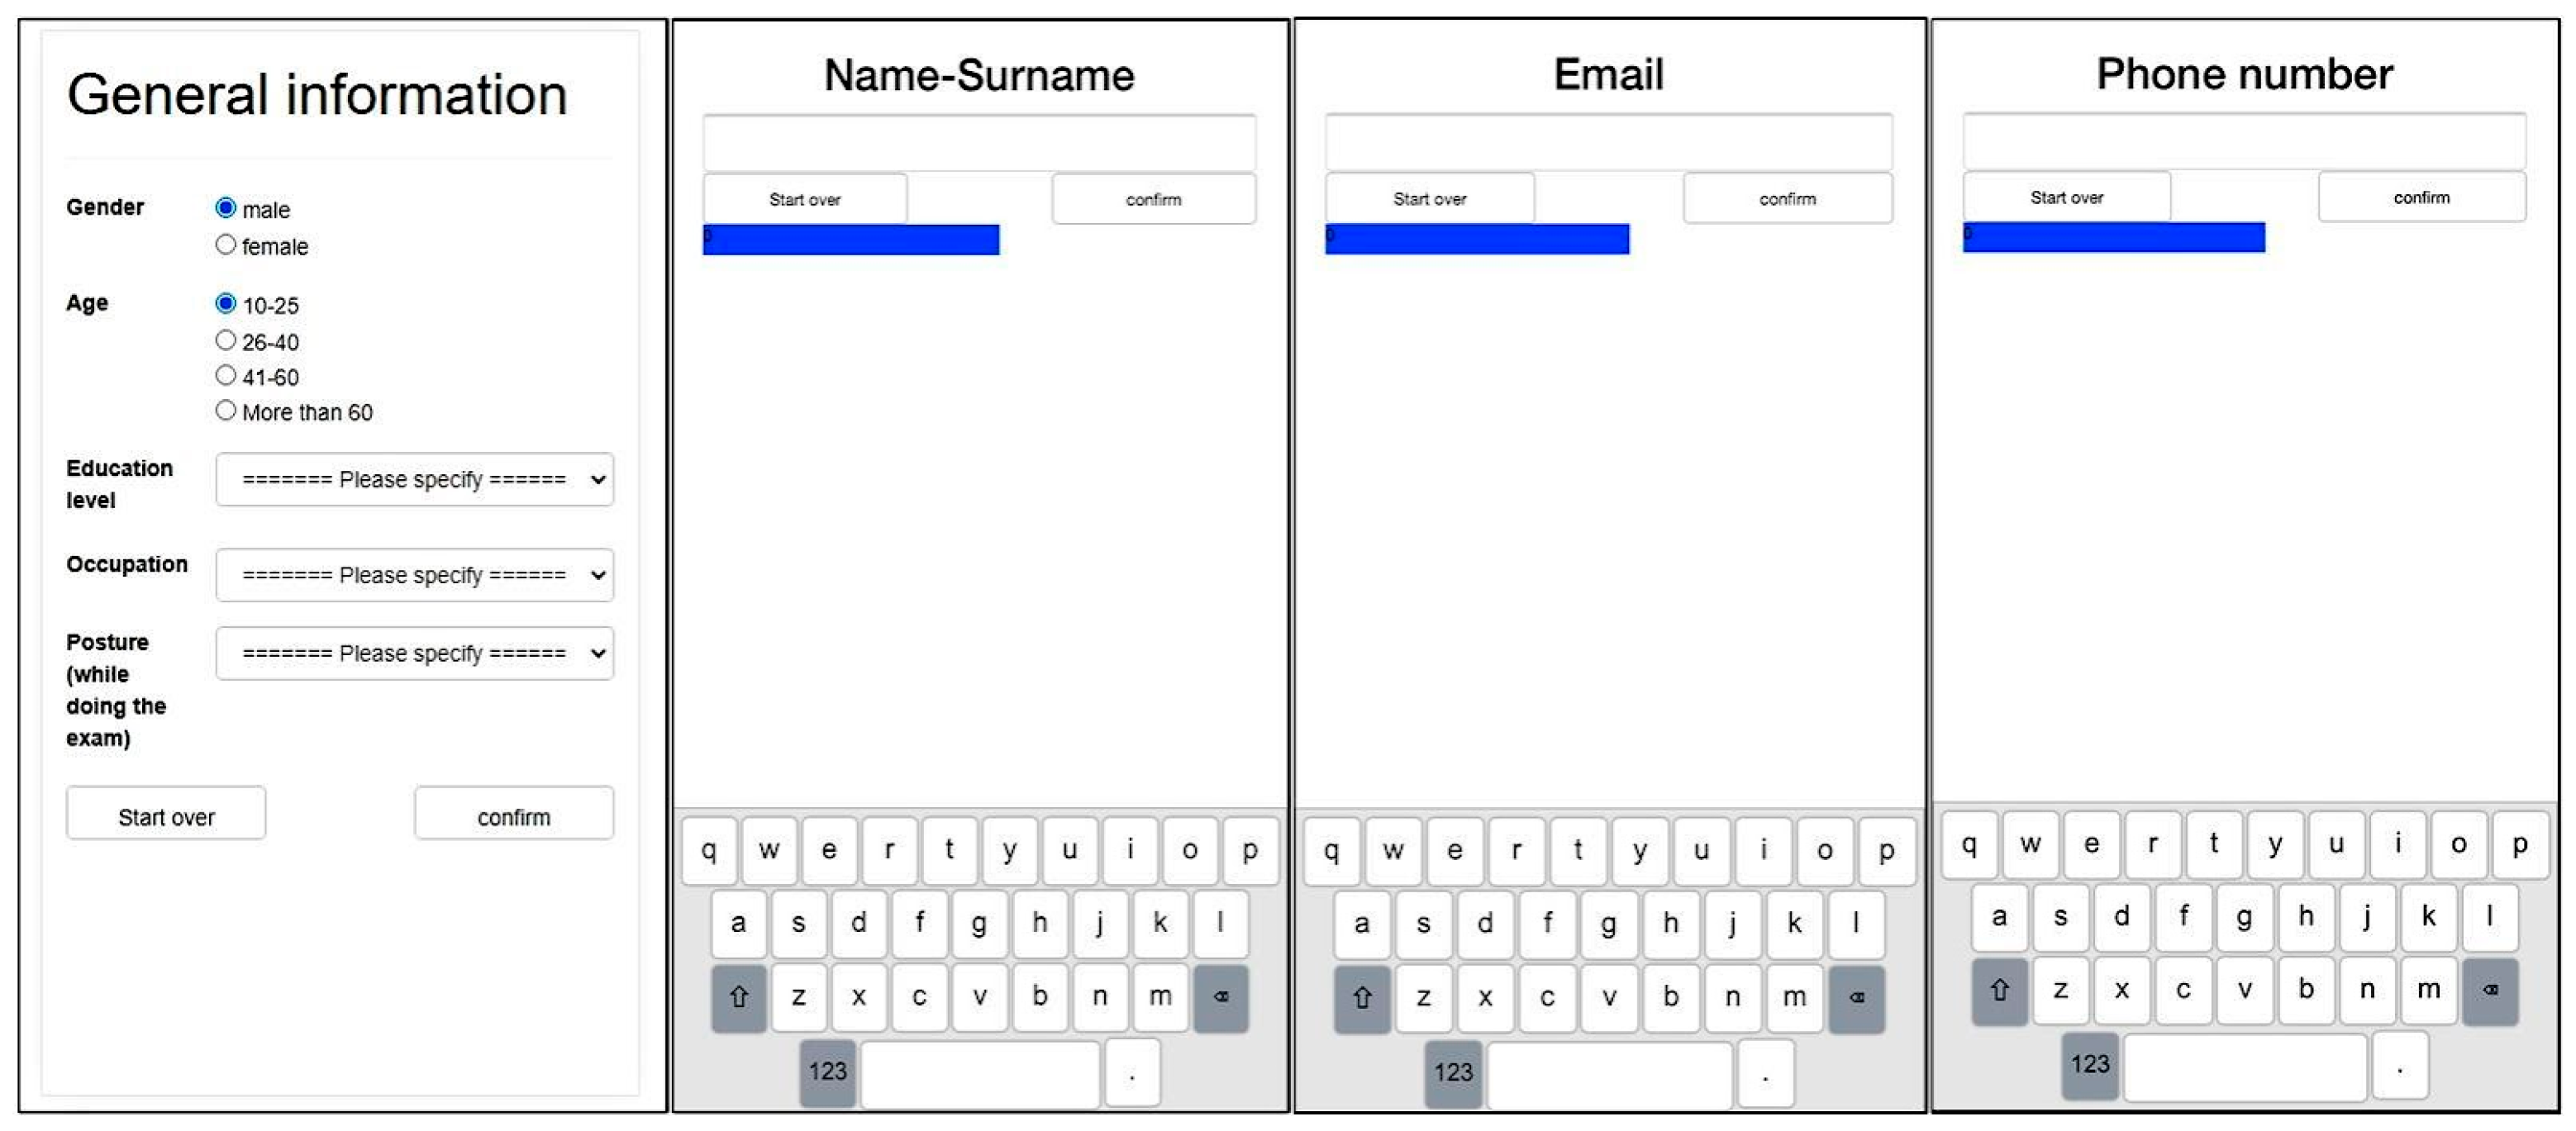
  • Each participant was instructed to enter their personal information, including their name, surname, email address, and mobile phone number, using the touchscreen keyboard of the mobile device. All participants were instructed to sit while they were entering their data via the smartphone’s touchscreen, ensuring that there was no environmental variation. This data-entry process was performed ten times over the course of ten days to capture consistent typing patterns.
  • The entered data, including the timing keystroke values and other features, were stored in a MySQL database. Each keystroke, along with its associated data, was recorded as a separate record in the database. The data was stored on a private cloud system, ensuring its security and accessibility for further analysis.
  • Each data was picked and split into 2 datasets: these were the training set, 75%, and testing set, 25%, as depicted in Figure 6. This process is essential to evaluate the model’s generalization performance on unseen data. So, comprising 25% of the data is to provide an unbiased assessment of the model’s performance on unseen instances and evaluate its generalization capabilities. It helps validate the model’s accuracy and effectiveness beyond the specific user or data it was trained on.
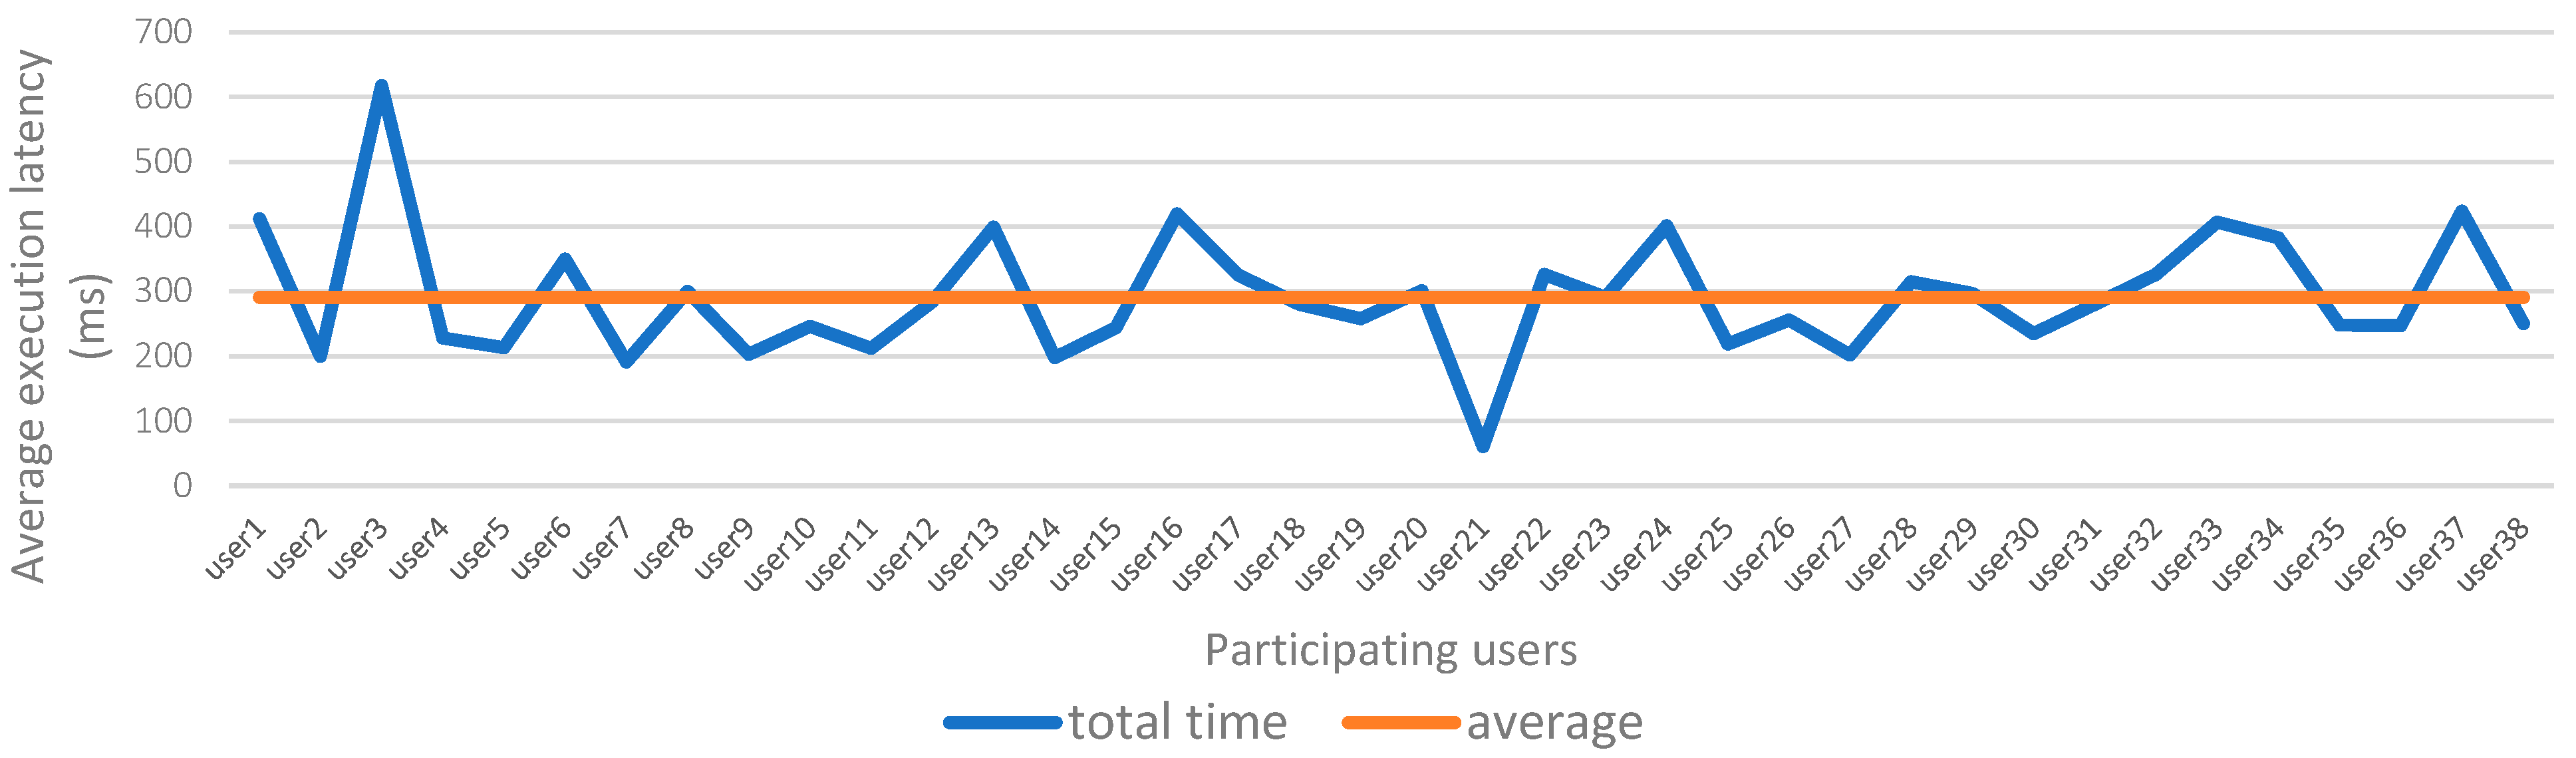
  • Each user’s separate classification model was trained individually for 290.79 milliseconds on average. This means that a specific model was created and trained for each individual user based on their unique data and characteristics.
    The target variables used for training and validation depended on the specific classification task and the goal of the model. In the given context, the target variable would be whether the input data corresponds to the genuine user or an imposter. The model was trained to predict this target variable based on the input features such as gender, fingertip, finger pressure, dwell time, flight time, interval time, latency time, and up-to-up time.
In this work, the following performance metrics were used to evaluate the proposed user authentication system. The optimal values for accuracy, precision and recall in this work were 100%, while the worst value was 0%.
  • Accuracy: Accuracy measures the overall correctness of the authentication system in correctly identifying the genuine user and detecting potential attacks. It is calculated as the ratio of the correctly classified instances to the total number of instances. It is given as the ratio ( t p + t n ) / ( t p + t n + f p + f n ) . In this, t p , t n , f p , f n are the number of true positives, true negatives, false positives and false negatives, respectively.
  • Precision: Precision measures the proportion of correctly identified genuine users among all instances classified as genuine. It provides insight into the system’s ability to minimize false positives and accurately identify the legitimate user. It is given as ratio t p / ( t p + f p ) , where t p is the number of true positives and f p the number of false positives.
  • The recall is, intuitively, the classifier’s capacity to identify all genuine users. The recall is given as ratio t p / ( t p + f n ) , where t p is the number of true positives and f n the number of false negatives. The optimal value is 100%, while the worst value is 0%.
  • Attack Detection Accuracy: This metric specifically measures the accuracy of the system in detecting and classifying attacks or imposters. It indicates how well the system can differentiate between genuine users and unauthorized individuals attempting to gain access.
  • The execution time: The execution time refers to the time it takes to train the user data using the proposed authentication system.

6. Results and Evaluation

This section presents the experimental results evaluating the performance of the proposed model in terms of accuracy, precision, recall, attack detection accuracy, and execution time. In this study, 38 actual users were used to evaluate the identification effectiveness of the proposed model in terms of accuracy, precision, recall, and execution latency. Similarly, we compared the experimental results of the proposed model’s attack detection accuracy to that of the benchmark. The purpose of this study is to evaluate how well the proposed model identifies malicious users.

6.1. Accuracy, Precision, Recall and Execution Time Evaluation Results

Figure 8 depicts the experimental outcomes generated by the proposed model with respect to accuracy, precision, and recall. The experimental results indicate that the proposed model can authenticate all users with an average accuracy of 97.59 percent across all users. Similarly, the authentication process also achieved an average precision of 97.62 percent and an average recall of 99.97 percent across all users. The proposed authentication system can be used to validate all users with an excellent performance of high values of accuracy, precision, and recall. The system is able to accurately classify and authenticate users based on their input data, as demonstrated by these results.
This model’s execution latency was proportional to its average computing cost. The average execution latency of the proposed model is depicted in Figure 9. The Gradient Boosted Tree significantly reduced latency in the proposed model. In addition, as the number of participants increased, the model’s latency variation was minimal. According to Figure 9, which displays the total average time values for each user, the total time required by each user ranged from 61 to 618 milliseconds, while the average time for all users was 290.79 milliseconds. With a value of 290.79 milliseconds, the average time required by the model to complete the authentication procedure was consistent. This indicates that users require a comparable quantity of time, on average, for the completion of the authentication procedure.

6.2. Attack Detection Accuracy Evaluation Results

In this section, we compare the attack detection accuracy of the proposed GBT-based mode to that of one of the most analogous existing Support Vector Machine (SVM)-based models [43]. Based on its context and the fact that it is contemporary and comparable to our proposed model, the approach in [43] was regarded as the considered benchmark model in this study. Both models were evaluated using 10%, 20%, 30%, 40%, and 50% of malicious users to determine their ability to detect malicious users (attacks) in the system. The purpose of this comparison was to assess the accuracy of both models in identifying malicious users based on their typing patterns, including typing speed, key press duration, and force applied to the keys.
It is evident from Figure 10 that both approaches exhibited strong performance in identifying malicious individuals, with a high detection accuracy in all scenarios. However, their efficacy varied significantly as the proportion of malicious users rose.
  • Both approaches exhibited high detection accuracy at 10% malicious users, with the proposed model achieving 97.79% and the benchmark model achieving 96.24%. The proposed model performed marginally better in this scenario.
  • When the percentage of malicious users reached 20%, the accuracy of both models remained relatively high. However, the proposed method achieved a detection accuracy of 95.33%, while the benchmark model achieved a detection accuracy of 95.09%.
  • At 30% malicious users, the proposed model maintained a high detection accuracy of 94.86% whereas the benchmark model demonstrated a slightly reduced accuracy of 91.76%.
  • Similarly, the proposed model outperformed the benchmark model at 40% and 50% malicious users, achieving detection accuracies of 94.45% and 92.48%, respectively, whereas the benchmark model achieved detection accuracies of 91.55% and 90.99%, respectively.
Both approaches are capable of detecting dishonest participants during user authentication. Nevertheless, the proposed method consistently demonstrated greater detection accuracy than the benchmark model across all levels of malicious users. Due to its superior performance in precisely identifying malicious users, the proposed model could be regarded a preferred approach for fraud detection during user authentication based on the results.

7. Comparative Analysis with Other Similar Related Works

According to Table 4, the majority of biometrics methods degrade over time, particularly biometric factors such as gait detectors, touch gestures, voice, iris, fingerprint, and teeth. Some extant methods, such as analyzing a person’s walking gait, rely on the individual’s skill, as people of various ages walk with distinct patterns. However, the function of the device must capture the walking pattern. Consequently, the walking gait cannot be recorded if a mobile gait application is not installed on the device. The user’s interaction patterns while using a mobile smartphone served as an indicator for the behavior profiling procedure. This method is categorized as numerous biometrics, does not degrade over time, and is device-independent because it relies primarily on characteristics that vary little from day to day. Nonetheless, the frequency with which a smartphone is utilized may change when engaging software is installed or as the user’s proficiency increases. The proposed model, on the other hand, employs multiple biometrics that are stable over a person’s lifespan, device-independent, and based on an individual skill that cannot be imitated. Table 4 compares existing biometric authentication techniques with the proposed approach. The following subsections provide further categorizations for the comparative analysis.

7.1. Biometric Entropy-Based

Entropy is an essential parameter for biometric authentication systems, as it quantifies the randomness or uniqueness of biometric characteristics such as fingerprints and retinal scans. A high measure of entropy indicates a greater level of security. Table 5 displays the entropy measurements for various authentication factors. The proposed method adopted a mechanism that employs appropriate security factors based on each individual’s profile and where the maximum level of authentication protection can be attained, thereby achieving an incontestable higher entropy authentication. On the basis of the previously presented findings, it can be confirmed that the proposed approach outperformed other prior studies in terms of the appropriate security factors.
According to Table 6, the behavior profiling scheme, which monitors user behavior with a 98.3% accuracy rate, is relatively simple to implement and requires a smartphone. Users may require time to adapt to the monitoring, and implementation may necessitate development resources. The keystroke and mobile sensor scheme passively monitor user interaction with the device with a high degree of accuracy (96.47%). However, it requires explicit user interaction and may require time for users to master correct typing. The proposed method, which is based on the dynamics of keystroke biometrics, has distinct advantages, such as its reliance on unique and stable personal information such as name, surname, email address, and telephone number. It does not rely on the functionality of mobile phones, making it less susceptible to attack. The verification mechanism approach based on a mobile touchscreen could be a potential solution for high-precision authentication.

7.2. Computational Cost-Based

As can be seen in Table 7, while [11] proposed using a user’s daily interactions with their smartphone in conjunction with the values of keystroke dynamics, this approach has the disadvantage of requiring an always-executable CPU, which can result in power consumption on mobile devices if the owner uses the device for the authentication process at all times. Moreover, the technique described in [19] is based on multi-facial biometrics but requires the use of auxiliary hardware such as global positioning systems, accelerometers, gyroscopes, magnetometers, linear accelerometers, gravity modalities, and rotation modalities. However, the proposed method takes into consideration how each user logs in and necessitates no additional hardware or software CPU rate for every authentication procedure. Therefore, the use of this technology has reduced the computational cost of biometric sensors, which now require only a rudimentary keyboard to extract variables. These are the most prevalent sensors found in smartphones today. Table 7 presents a comparison with existing authentication methods based on computational cost.

7.3. Security Based

The proposed method addresses prospective threats in biometric authentication systems, such as brute force, deception, and social engineering, in terms of security analysis. It employs countermeasures including liveness detection and secure data-storage procedures. This paper examined the method of liveness detection as a means of identifying and detecting malicious users. The system is capable of authenticating the origin of a biometric sample and its essential characteristics, including gender, fingertip details, finger pressure, dwell time, flight time, interval time, latency time, and up-to-up time. The system, thereafter, determines the authenticity of the user, distinguishing between genuine individuals and potentially fraudulent or harmful entities, by using a selection of relevant criteria for the authentication process. The method employs a high level of security while remaining straightforward, user-friendly, and cost-effective. It also requires at least two-factor authentication, ensuring the security of user data and reducing the likelihood of unauthorized access.
Personal information is the most frequently entered data in all situations, including mobile registration. Therefore, the owner is more likely to be familiar with certain personal information characters than others, resulting in varying typing durations. Therefore, these details are distinct and cannot be duplicated by a potential adversary. However, such features are absent from other extant approaches, making them susceptible to vulnerabilities and attacks. Thus, the proposed method seeks to provide a comprehensive and secure biometric authentication system that addresses existing threats and flaws in existing systems.

8. Discussions

Particularly in the context of smartphone utilization, user authentication is essential for protecting the security and privacy of personal data. Traditional authentication techniques, such as PINs and passwords, are insufficient to protect against unauthorized access and malevolent attacks; therefore, it is essential to develop more dependable and sophisticated authentication techniques. This research intends to address the limitations of conventional authentication methods by proposing a novel method based on multi-biometric authentication utilizing behavioral biometrics. Utilizing physical and behavioral biometric factors such as keystroke dynamics, touch gestures, and user interaction behavior, the proposed system provides improved authentication reliability and accuracy.
Unique characteristics of the research include imitability, stability over time, and a reliance on individual abilities. By incorporating multiple biometric modalities and personal behavioral characteristics, the proposed system overcomes the flaws of single-factor authentication methods and provides a more robust and accurate authentication process, thereby enhancing the overall security of smartphone usage.
This research distinguishes itself in several ways, including its holistic approach to integrating physiological and behavioral biometric factors to create a comprehensive multi-biometric authentication system. The system accomplishes a higher level of authentication reliability and accuracy by incorporating a broad range of biometric modalities and personal behavioral characteristics. In addition, the research focuses on the consistency of authentication factors over time and individual skills, making it more resistant to impersonation attacks and addressing the limitations of single biometric systems.
This research makes substantial contributions to the field of user authentication by introducing a novel multi-biometric approach that overcomes the limitations of conventional methods. Its exhaustive nature, emphasis on stability and individual skills, and assimilation of multiple biometric factors make it superior and innovative in comparison to existing cloud storage authentication and biometrics research works.

9. Conclusions

This research proposes time-stable factors for the development of an authentication classification model to safeguard the system’s dependability. This research identified the supported factors of gender and the finger features, including the fingertip, based on this objective. The biometrics of keystroke dynamics were derived from the typing technique, which corresponds to the cadence of keystrokes. The keystroke cadence can then be used as a unique template of the user’s personal information entry that cannot be imitated by others. The values of the fingertip and finger features must be obtained only when the proprietor enters their full name, last name, email address, and phone number. In addition, an authentication classification model employing gradian boost tree running with all prescribed factors obtained average accuracy, precision, and recall values of 97.59%, 97.62%, and 99.97%, respectively, with an average execution time of 290.79 mms.
The proposed technique for biometric authentication aims to mitigate the potential security risks inherent in biometric systems. By implementing liveness detection, the proposed method aids in preventing deceptive attacks and safeguarding sensitive user data. In addition, the proposed method prioritizes user convenience, cost-effectiveness, and simplicity while maintaining a high level of security. The proposed method provides a secure and efficient means of authenticating users in the digital world of today by combining advanced biometric techniques and stringent security measures.

10. Future Work

The next stage of this work is to determine the bare minimum of these factors for an individual that can support the highest level of authentication detection, taking into account the study’s findings about the top ten personal significant characters in terms of frequency of typing and the different typing times. Furthermore, several authentication strategies will be offered, making use of the forthcoming discoveries.

Author Contributions

Conceptualization, N.N., B.M.Y. and P.B.; methodology, N.N.; software, N.N.; validation, N.N. and P.B.; formal analysis, N.N. and B.M.Y.; investigation, N.N. and B.M.Y.; resources, N.N., B.M.Y. and P.B.; data curation, N.N., B.M.Y. and P.B.; writing—original draft preparation, N.N.; writing—review and editing, B.M.Y. and P.B.; visualization, B.M.Y. and P.B.; supervision, P.B.; project administration, N.N., B.M.Y. and P.B.; funding acquisition, P.B. All authors have read and agreed to the published version of the manuscript.

Funding

This research was funded by (1) Chulalongkorn University Fund, (2) the 100th Anniversary Chulalongkorn University Fund for Doctoral Scholarships, and (3) the 90th Anniversary of Chulalongkorn University (Ratchadaphiseksomphot Endowment Fund).

Institutional Review Board Statement

Not applicable.

Informed Consent Statement

Informed consent was obtained from all subjects involved in the study.

Data Availability Statement

The data presented in this study are available on request from the corresponding author. The data are not available to the public because the project is still ongoing.

Acknowledgments

This research is supported by the Chulalongkorn University Fund, the 100th Anniversary Chulalongkorn University Fund for Doctoral Scholarships, the 90th Anniversary of Chulalongkorn University (Ratchadaphiseksomphot Endowment Fund), Chulalongkorn University, Bangkok, Thailand. The authors are thankful for the support.

Conflicts of Interest

The authors declare no conflict of interest. The funders had no role in the design of the study; in the collection, analyses, or interpretation of data; in the writing of the manuscript; or in the decision to publish the results.

References

  1. Smartphone History—The First Smartphone|SimpleTexting. Available online: https://simpletexting.com/where-have-we-come-since-the-first-smartphone/ (accessed on 8 October 2022).
  2. Vass, L.T. The Technological Evolution of the Smartphone. 28 April 2019. [Online]. Available online: https://papers.ssrn.com/abstract=3379257 (accessed on 8 October 2022).
  3. Keusch, F.; Wenz, A.; Conrad, F. Do you have your smartphone with you? Behavioral barriers for measuring everyday activities with smartphone sensors. Comput. Hum. Behav. 2022, 127, 107054. [Google Scholar] [CrossRef]
  4. El-Soud, M.W.A.; Gaber, T.; AlFayez, F.; Eltoukhy, M.M. Implicit authentication method for smartphone users based on rank aggregation and random forest. Alex. Eng. J. 2021, 60, 273–283. [Google Scholar] [CrossRef]
  5. Kokal, S.; Pryor, L.; Dave, R. Exploration of Machine Learning Classification Models Used for Behavioral Biometrics Authentication. In Proceedings of the 8th International Conference on Computer Technology Applications, Vienna, Austria, 12–14 May 2022. [Google Scholar] [CrossRef]
  6. Alsuhibany, S.A.; Alreshoodi, L.A.; Alsuhibany, C.A.S. Detecting human attacks on text-based CAPTCHAs using the keystroke dynamic approach. IET Inf. Secur. 2021, 15, 191–204. [Google Scholar] [CrossRef]
  7. Hassan, B.; Izquierdo, E.; Piatrik, T. Soft biometrics: A survey: Benchmark analysis, open challenges and recommendations. Multimed. Tools Appl. 2021, 1–44. [Google Scholar] [CrossRef]
  8. Anusas-Amornkul, T. Strengthening Password Authentication using Keystroke Dynamics and Smartphone Sensors. In Proceedings of the 9th International Conference on Information Communication and Management, Prague, Czech Republic, 23–26 August 2019. [Google Scholar] [CrossRef]
  9. Benegui, C. A Deep Learning Approach to Subject Identification Based on Walking Patterns. Procedia Comput. Sci. 2021, 192, 642–649. [Google Scholar] [CrossRef]
  10. Alqarni, M.A.; Chauhdary, S.H.; Malik, M.N.; Ehatisham-ul-Haq, M.; Azam, M.A. Identifying smartphone users based on how they interact with their phones. Hum.-Centric Comput. Inf. Sci. 2020, 10, 7. [Google Scholar] [CrossRef] [Green Version]
  11. Pang, X.; Yang, L.; Liu, M.; Ma, J. MineAuth: Mining Behavioural Habits for Continuous Authentication on a Smartphone. In Lecture Notes in Computer Science (Including Subseries Lecture Notes in Artificial Intelligence and Lecture Notes in Bioinformatics); Springer: Berlin/Heidelberg, Germany, 2019; Volume 11547 LNCS, pp. 533–551. [Google Scholar] [CrossRef]
  12. Choi, M.; Lee, S.; Jo, M.; Shin, J.S. Keystroke Dynamics-Based Authentication Using Unique Keypad. Sensors 2021, 21, 2242. [Google Scholar] [CrossRef] [PubMed]
  13. Aizi, K.; Ouslim, M. Score level fusion in multi-biometric identification based on zones of interest. J. King Saud. Univ.-Comput. Inf. Sci. 2022, 34, 1498–1509. [Google Scholar] [CrossRef]
  14. Joseph, T.; Kalaiselvan, S.A.; Aswathy, S.U.; Radhakrishnan, R.; Shamna, A.R. A multimodal biometric authentication scheme based on feature fusion for improving security in cloud environment. J. Ambient. Intell. Humaniz. Comput. 2021, 12, 6141–6149. [Google Scholar] [CrossRef]
  15. Acien, A.; Morales, A.; Vera-Rodriguez, R.; Fierrez, J. MultiLock: Mobile Active Authentication based on Multiple Biometric and Behavioral Patterns. In Proceedings of the MM’19: The 27th ACM International Conference on Multimedia, Nice, France, 25 October 2019. [Google Scholar] [CrossRef]
  16. El-Rahiem, B.A.; El-Samie, F.E.A.; Amin, M. Multimodal biometric authentication based on deep fusion of electrocardiogram (ECG) and finger vein. Multimed. Syst. 2022, 28, 1325–1337. [Google Scholar] [CrossRef]
  17. Zhang, X.; Zhang, P.; Hu, H. Multimodal continuous user authentication on mobile devices via interaction patterns. Wirel. Commun. Mob. Comput. 2021, 2021, 1–15. [Google Scholar] [CrossRef]
  18. Tse, K.W.; Hung, K. User Behavioral Biometrics Identification on Mobile Platform using Multimodal Fusion of Keystroke and Swipe Dynamics and Recurrent Neural Network. In Proceedings of the ISCAIE 2020—IEEE 10th Symposium on Computer Applications and Industrial Electronics, Penang, Malaysia, 18–19 April 2020; pp. 262–267. [Google Scholar] [CrossRef]
  19. Deb, D.; Ross, A.; Jain, A.K.; Prakah-Asante, K.; Prasad, K.V. Actions Speak Louder Than (Pass)words: Passive Authentication of Smartphone Users via Deep Temporal Features. In Proceedings of the 2019 International Conference on Biometrics, ICB 2019, Crete, Greece, 4–7 June 2019. [Google Scholar] [CrossRef]
  20. Gu, Y.; Wang, Y.; Wang, M.; Pan, Z.; Hu, Z.; Liu, Z.; Shi, F.; Dong, M. Secure User Authentication Leveraging Keystroke Dynamics via Wi-Fi Sensing. IEEE Trans. Ind. Inf. 2022, 18, 2784–2795. [Google Scholar] [CrossRef]
  21. Saini, B.S.; Kaur, N.; Bhatia, K.S.; Luhach, A.K. Analyzing user typing behaviour in different positions using keystroke dynamics for mobile phones. J. Discret. Math. Sci. Cryptogr. 2019, 22, 591–603. [Google Scholar] [CrossRef]
  22. Saini, B.S.; Singh, P.; Nayyar, A.; Kaur, N.; Bhatia, K.S.; El-Sappagh, S.; Hu, J.W. A Three-Step Authentication Model for Mobile Phone User Using Keystroke Dynamics. IEEE Access 2020, 8, 125909–125922. [Google Scholar] [CrossRef]
  23. Ulanoff, L. The iPhone X’s Face ID Can Be Fooled by Identical Twins|Mashable. Mashable SEA. 31 October 2017. Available online: https://mashable.com/article/putting-iphone-x-face-id-to-twin-test (accessed on 25 October 2022).
  24. Boyle, J. Twin Peeks: Identical Brothers Are Able to Unlock Each Other’s Phone—The Sunday Post. The Sunday Post, 26 November 2018. Available online: https://www.sundaypost.com/fp/twin-peeks-identical-brothers-able-to-unlock-each-others-phone/ (accessed on 25 October 2022).
  25. Chakravarti, A. Brothers Who Are Not Identical Twins Fool iPhone 12 Mini’s Face ID. India Today Group, 9 June 2021. Available online: https://www.indiatoday.in/technology/news/story/brothers-who-are-not-identical-twins-fool-iphone-12-mini-s-face-id-1812763-2021-06-09 (accessed on 25 October 2022).
  26. Abdulrahman, S.A.; Alhayani, B. A comprehensive survey on the biometric systems based on physiological and behavioural characteristics. Mater. Today Proc. 2021, 80, 2642–2646. [Google Scholar] [CrossRef]
  27. Devika, V.; Ankitha, C. Multi Account Embedded System with Enhanced Security. Int. Res. J. Eng. Technol. 2020. Online. Available online: www.irjet.net (accessed on 16 July 2023).
  28. Ali, G.; Dida, M.A.; Sam, A.E. Two-Factor Authentication Scheme for Mobile Money: A Review of Threat Models and Countermeasures. Future Internet 2020, 12, 160. [Google Scholar] [CrossRef]
  29. Cadd, S.; Islam, M.; Manson, P.; Bleay, S. Fingerprint composition and aging: A literature review. Sci. Justice 2015, 55, 219–238. [Google Scholar] [CrossRef]
  30. Technology, S.E. Can Fingerprints Change over Time?—Smart Eye Technology. 19 October 2020. Available online: https://getsmarteye.com/age-limit-do-fingerprints-change-overtime/ (accessed on 16 July 2023).
  31. Huang, Z.; Zhang, J.; Shan, H.; Key, S. When Age-Invariant Face Recognition Meets Face Age Synthesis: A Multi-Task Learning Framework. IEEE Trans. Pattern Anal. Mach. Intell. 2023, 45, 7917–7932. Available online: https://github (accessed on 16 July 2023). [CrossRef]
  32. Murad, M. Iris Patterns: One of the Most Stable Biometrics—Iris ID. Iris ID, 24 March 2021. Available online: https://www.irisid.com/iris-patterns-one-of-the-most-stable-biometrics/ (accessed on 16 July 2023).
  33. Javed, L.; Yakubu, B.M.; Waleed, M.; Khaliq, Z.; Suleiman, A.B.; Mato, N.G. BHC-IoT: A Survey on Healthcare IoT Security Issues and Blockchain-Based Solution. Int. J. Electr. Comput. Eng. Res. 2022, 2, 1–9. [Google Scholar] [CrossRef]
  34. Shah, P.G.; Ayoade, J. An Empricial Study of Brute Force Attack on Wordpress Website. In Proceedings of the 5th International Conference on Smart Systems and Inventive Technology, ICSSIT 2023, Tirunelveli, India, 23–25 January 2023; pp. 659–662. [Google Scholar] [CrossRef]
  35. Faircloth, C.; Hartzell, G.; Callahan, N.; Bhunia, S. A Study on Brute Force Attack on T-Mobile Leading to SIM-Hijacking and Identity-Theft. In Proceedings of the 2022 IEEE World AI IoT Congress, AIIoT 2022, Seattle, WA, USA, 6–9 June 2022; pp. 501–507. [Google Scholar] [CrossRef]
  36. Kuznetsov, A.; Oleshko, I.; Chernov, K.; Bagmut, M.; Smirnova, T. Biometric authentication using convolutional neural networks. In Lecture Notes in Networks and Systems, 152; Springer International Publishing: Cham, Switezrland, 2021; pp. 85–98. [Google Scholar] [CrossRef]
  37. Velásquez, I.; Caro, A.; Rodríguez, A. Kontun: A Framework for recommendation of authentication schemes and methods. Inf. Softw. Technol. 2018, 96, 27–37. [Google Scholar] [CrossRef]
  38. Ellavarason, E.; Guest, R.; Deravi, F.; Sanchez-Riello, R.; Corsetti, B. Touch-dynamics based Behavioural Biometrics on Mobile Devices—A Review from a Usability and Performance Perspective. ACM Comput. Surv. 2020, 53, 1–36. [Google Scholar] [CrossRef]
  39. Ometov, A.; Bezzateev, S.; Mäkitalo, N.; Andreev, S.; Mikkonen, T.; Koucheryavy, Y. Multi-Factor Authentication: A Survey. Cryptography 2018, 2, 1. [Google Scholar] [CrossRef] [Green Version]
  40. Friedman, J.H. Greedy function approximation: A gradient boosting machine. Ann. Stat. 2001, 29, 1189–1232. [Google Scholar] [CrossRef]
  41. Pawara, P.; Okafor, E.; Groefsema, M.; He, S.; Schomaker, L.R.B.; Wiering, M.A. One-vs-One classification for deep neural networks. Pattern Recognit. 2020, 108, 107528. [Google Scholar] [CrossRef]
  42. Singh, A.S.; Masuku, M.B. Sampling Techniques & Determination of Sample Size in Applied Statistics Research: An Overview. Int. J. Econ. Commer. Manag. 2014, 2, 1–22. Available online: http://ijecm.co.uk/ (accessed on 30 October 2022).
  43. Cui, Z.; Huang, A.; Chen, J.; Gao, S. Piezoelectric Touch Sensing-Based Keystroke Dynamic Technique for Multi-User Authentication. IEEE Sens. J. 2021, 21, 26389–26396. [Google Scholar] [CrossRef]
  44. Wang, D.; Gu, Q.; Huang, X.; Wang, P. Understanding Human-Chosen PINs: Characteristics, Distribution and Security. In Proceedings of the ASIA CCS’17: ACM Asia Conference on Computer and Communications Security, Abu Dhabi, United Arab Emirates, 2–6 April 2017. [Google Scholar]
  45. Wang, D.; Cheng, H.; Wang, P.; Huang, X.; Jian, G. Zipf’s law in passwords. IEEE Trans. Inf. Forensics Secur. 2017, 12, 2776–2791. [Google Scholar]
  46. Sutcu, Y.; Tabassi, E.; Sencar, H.T.; Memon, N. What is biometric information and how to measure it? In Proceedings of the 2013 IEEE International Conference on Technologies for Homeland Security (HST), Waltham, MA, USA, 12–14 November 2013; pp. 67–72. [Google Scholar]
  47. Krivokuca, V.; Gomez-Barrero, M.; Marcel, S.; Rathgeb, C.; Busch, C. Towards Measuring the Amount of Discriminatory Information in Finger Vein Biometric Characteristics Using a Relative Entropy Estimator. In Advances in Computer Vision and Pattern Recognition; Springer: Berlin/Heidelberg, Germany, 2020; pp. 507–525. [Google Scholar] [CrossRef] [Green Version]
  48. Inthavisas, K.; Lopresti, D. Secure speech biometric templates for user authentication. IET Digit. Libr. 2012, 1, 46–54. [Google Scholar] [CrossRef]
Figure 1. Architecture of the enrolment stage.
Jsan 12 00062 g001
Figure 2. Attack model on the proposed biometric system.
Jsan 12 00062 g002
Figure 3. Web-based mobile application for user data entry.
Jsan 12 00062 g003
Figure 4. Data collection and enrollment process.
Jsan 12 00062 g004
Figure 5. Illustrations of keystroke feature and formulas. P = press, R = release.
Jsan 12 00062 g005
Figure 6. Classification model stage.
Jsan 12 00062 g006
Figure 7. Overall working principle of the proposed model.
Jsan 12 00062 g007
Figure 8. The accuracy, precision and recall values per user.
Jsan 12 00062 g008
Figure 9. Average execution latency per user.
Jsan 12 00062 g009
Figure 10. Attack detection accuracy with increasing malicious users.
Jsan 12 00062 g010
Table 1. The performance of biometrics methods with different devices.
Factor BiometricsPerformanceDevice
AccuracyFRRFAREER
Keystroke dynamics [8]97.90%---------Smartphone
Gait detection [9]98.79%---------Smartphone
Touch gestures [10]74.97%---------Smartphone
Behavior profiling [11]98.5%---------Smartphone
Keystroke dynamics [12]---------10.01%Keypad on
Smartphone
Iris and Fingerprint [13]95.00%3.89%1.11%---Standard database
Fingerprint, iris, and palm print [14]---0.15%94.54%---Collecting
database
Touch dynamics (touch gestures and keystroking), accelerometer, gyroscope, Wi-Fi, GPS location and app usage [15]82.2–97.1%---------Smartphone sensor
ECG, finger vein [16]---------0.12%Database
Motion and hold posture, (accelerator and capture the variation model of micro hand motions and hold patterns) [17]97%------------
Keystroke, Swipe dynamics [18]94.26%---------Smartphone
Keystroke, GPS position, accelerometer, gyroscope, magnetometer, linear accelerometer, gravity, and rotation sensors [19]97.15%---------Smartphone
Table 2. Comparison among existing methods.
Factor BiometricsSingle FactorMultiple FactorsDegradation ProtectionDevice DependencyPersonal Skill
Keystroke dynamics [8]P P
Gait detection [9]P P
Touch gestures [10]P P
Behavior profiling [11] PPP
Keystroke dynamics
(Unique keypad on smartphone) [12]
P P
Iris and Fingerprint [13] P P
Fingerprint, iris, and palm print [14] P P
Touch dynamics [15] P P
ECG, finger vein [16] P P
Motion and hold posture [17] P P
Keystroke, swipe dynamics [18] P P
Keystroke, mobile sensors [19] P P
Table 3. Frameworks simplify authentication scheme selection.
Article TitleDescription
Kontun: A Framework for recommendation of authentication schemes and methods [37]There are three primary guidelines that all multimedia systems must follow to security: (1) ease of use and (2) simplicity, and (3) cost-effectiveness is a priority for the platform.
Touch-dynamics based Behavioral Biometrics on Mobile Devices—
A Review from a Usability and Performance Perspective [38]
Review touch-dynamics-based behavioral biometrics in terms of (1) usability and its impact on (2) authentication performance, including the (3) modalities of user involvement, the (4) quantity of enrollment data needed, (5) algorithmic performance accuracy, and (6) energy consumption.
Multi-Factor Authentication:
A Survey [39]
Thorough analysis of authentication methods that combine two or more authentication processes should increase (1) user verification security. These systems intelligently combine (2) knowledge, (3) biometrics, and (4) ownership.
Table 4. Differences between the proposed method and some existing methods.
Factor BiometricsSingleMultipleNon-DegradationDevice IndependentIndividual-SkillPerformance
Keystroke dynamics [8]P 97.00%
Gait detection [9]P 98.79%
Touch gestures [10]P 74.97%
Behavior profiling [11] PPP 98.50%
Keystroke dynamics
(Unique keypad on smartphone) [12]
P 89.99%
Iris and Fingerprint [13] P 95.00%
Fingerprint, iris, and palm print [14] P 94.54%
Touch dynamics [15] P 97.1%
ECG, finger vein [16] P EER 0.12%
Motion and hold posture [17] P 97.00%
Keystroke, swipe dynamics [18] P 94.26%
Keystroke, mobile sensors [19] P 97.15%
Proposed method PPPP97.59%
Table 5. The entropy measurements for different authentication factors.
Ref.Authentication FactorNumber of DigitsCharactersDatasetEntropy (Bits)
Wang D [44]PIN4-digit Numerical charactersDodonew, CSDN, Rockyou, Yahoo (total 3.4 M)8.41
PIN6-digitNumerical charactersDodonew, CSDN, Rockyou, Yahoo (total 6.4 M) 13.21
Wang D [45]Password 6-digit and 10-digitlowercase alphabet characters and numbers14 datasets (total 113.3 M)20–22
Sutcu Y [46]Iris ICE (High quality set—374 iris, 10 samples each) 8.9–10, 8.9–10 bits
Krivokuca V [47]Finger Vein VERA (220 fingers, two samples each) 4.2—13.2
UTFVP (360 fingers, four images each) 18.9–19.5
Inthavisas et al. [48]Combine password and voice 18–30
The proposed methodKeystroke10-digit PIN 38 samples51.7
Table 6. Comparison of biometric authentication schemes: behavior profiling, keystroke and mobile sensor, and the proposed method.
CategoryCriterionBehavior Profiling [11]Keystroke, Mobile Sensors [19]Proposed Method
UsabilityEase of useHigh (does not require explicit user interaction)Low (requires explicit user interaction)Low (requires explicit user interaction to type profile data)
Ease of learningMedium (user may need time to adjust to the monitoring)Low (user may need to learn to type correctly)Low (user may need to learn to type profile data correctly)
Need of using a deviceHigh (requires a smartphone)High (requires a smartphone)High (requires a smartphone)
Method’s reliabilityHigh (98.3% accuracy)High (96.47% accuracy)High (97.59% accuracy)
SecurityImportance of securityHigh (continuously monitors user behavior)High (passively monitors user behavior)High (relies on personal behavioral biometrics)
Resistance to well-known attacksHigh (relies on smartphone data)Low (keystroke dynamics can be easily replicated)Low (keystroke dynamics can be easily replicated)
CostsImplementation costsMedium (may require development resources)Medium (may require development resources)Medium (may require development resources)
Costs per userLow (minimal additional costs for users)Low (minimal additional costs for users)Low (minimal additional costs for users)
Server compatibilityN/A (occurs on the smartphone)N/A (occurs on the smartphone)N/A (occurs on the smartphone)
Need of acquiring licensesLow (minimal licensing requirements)Low (minimal licensing requirements)Low (minimal licensing requirements)
Available technologiesHigh (utilizes smartphone data)High (utilizes smartphone sensors)Low (limited to individual’s typing-skills)
OthersClient’s requirementsMedium (user may need to adjust behavior)Low (user may need to type correctly)Low (user may need to type profile data correctly)
Application contextMedium (may be limited to certain types of applications)Medium (may be limited to certain types of applications)Low (may be limited to certain types of applications requiring profile data input)
Norms and legislationLow (minimal legal restrictions)Low (minimal legal restrictions)Low (minimal legal restrictions)
Table 7. Comparison with existing authentication methods based on computational cost.
MethodsUsability PerspectiveCost EffectivenessPerformance
User FriendlyCost to ImplementExtra EquipmentConsume Space
Behavior profiling [11] PP P98.50%
Keystroke, mobile sensors [19] PPP97.15%
Proposed method P 97.59%
Disclaimer/Publisher’s Note: The statements, opinions and data contained in all publications are solely those of the individual author(s) and contributor(s) and not of MDPI and/or the editor(s). MDPI and/or the editor(s) disclaim responsibility for any injury to people or property resulting from any ideas, methods, instructions or products referred to in the content.

