1. Introduction
Due to the ageing of infrastructure and population expansion, improving sustainable water management is a crucial and increasingly important issue [
1]. By 2050, food expectancy is estimated to double due to the increase in world’s population, which might exceed 9 billion people [
2]. Insufficient water or inadequate water management systems will significantly constrain the increase in food production. In particular, droughts, erosions, and other climate culminations are worsening water scarcity. To address these challenges, various research and development activities affiliated with global research institutions embarking new solutions supported by more rational management were recently conducted to canvass different technological areas [
3,
4,
5]. Currently, besides from Goal 6 “Clean Water and Sanitation” of UN SDGs of the 2030 agenda for sustainable development [
6], water is involved in various sustainability targets and is essential in achieving a majority of other SDGs, such as poverty reduction, food production, healthier lifestyles, economic growth, and environmental sustainability. Sustainable water usage is also fundamental to combat climate change [
7].
In this regard, a new generation of innovative analytical tools offer a wide range of opportunities to address these challenges and transform raw data into actionable intelligence both strategically and tactically. Likewise, big data analytics can help in identifying infrastructure failures, reducing water losses, preventing overflows, and measuring asset health. Moreover, data can unlock operational efficiencies, identify maintenance opportunities, and guide long-term investment plans [
8].
Despite big data technology’s relative maturity as a cutting-edge ICT tool and its adoption in numerous sectors globally, uptake in the water industry for sustainable development purposes remains limited to date [
9]. For instance, multinational corporations, such as Coca-Cola, Pepsi, Nestle, Abbot, IBM, General Electric and other companies of similar capacity, which are working hard to reduce their freshwater dependencies; technology startups, such as Imagine H
2O, TaKaDu, and a few others that address the water–energy generation nexus and need for more intelligent infrastructure; and other companies that are advancing to become responsible water stewards need to reconsider their operational strategies for data acquisition, administration, and appropriate decision-making based on the obtained information, which could significantly enhance their performances as organizations [
10].
1.1. ICTs Role in Water Industry
The evolution of ICT in the water industry and its far-reaching effects towards sustainable environment attracted unparalleled recognition in recent years. It is observed that the continuous improvements in ICT tools and application methods are vital for a resilient water management infrastructure, as well as to preserve biodiversity in terrestrial and aquatic ecosystems [
11]. In fact, these advanced ICT systems are mainly smart sensors, bigdata analytics tools, and Internet of Things devices, which now lead the world’s collective economic, social, and cultural development [
12].
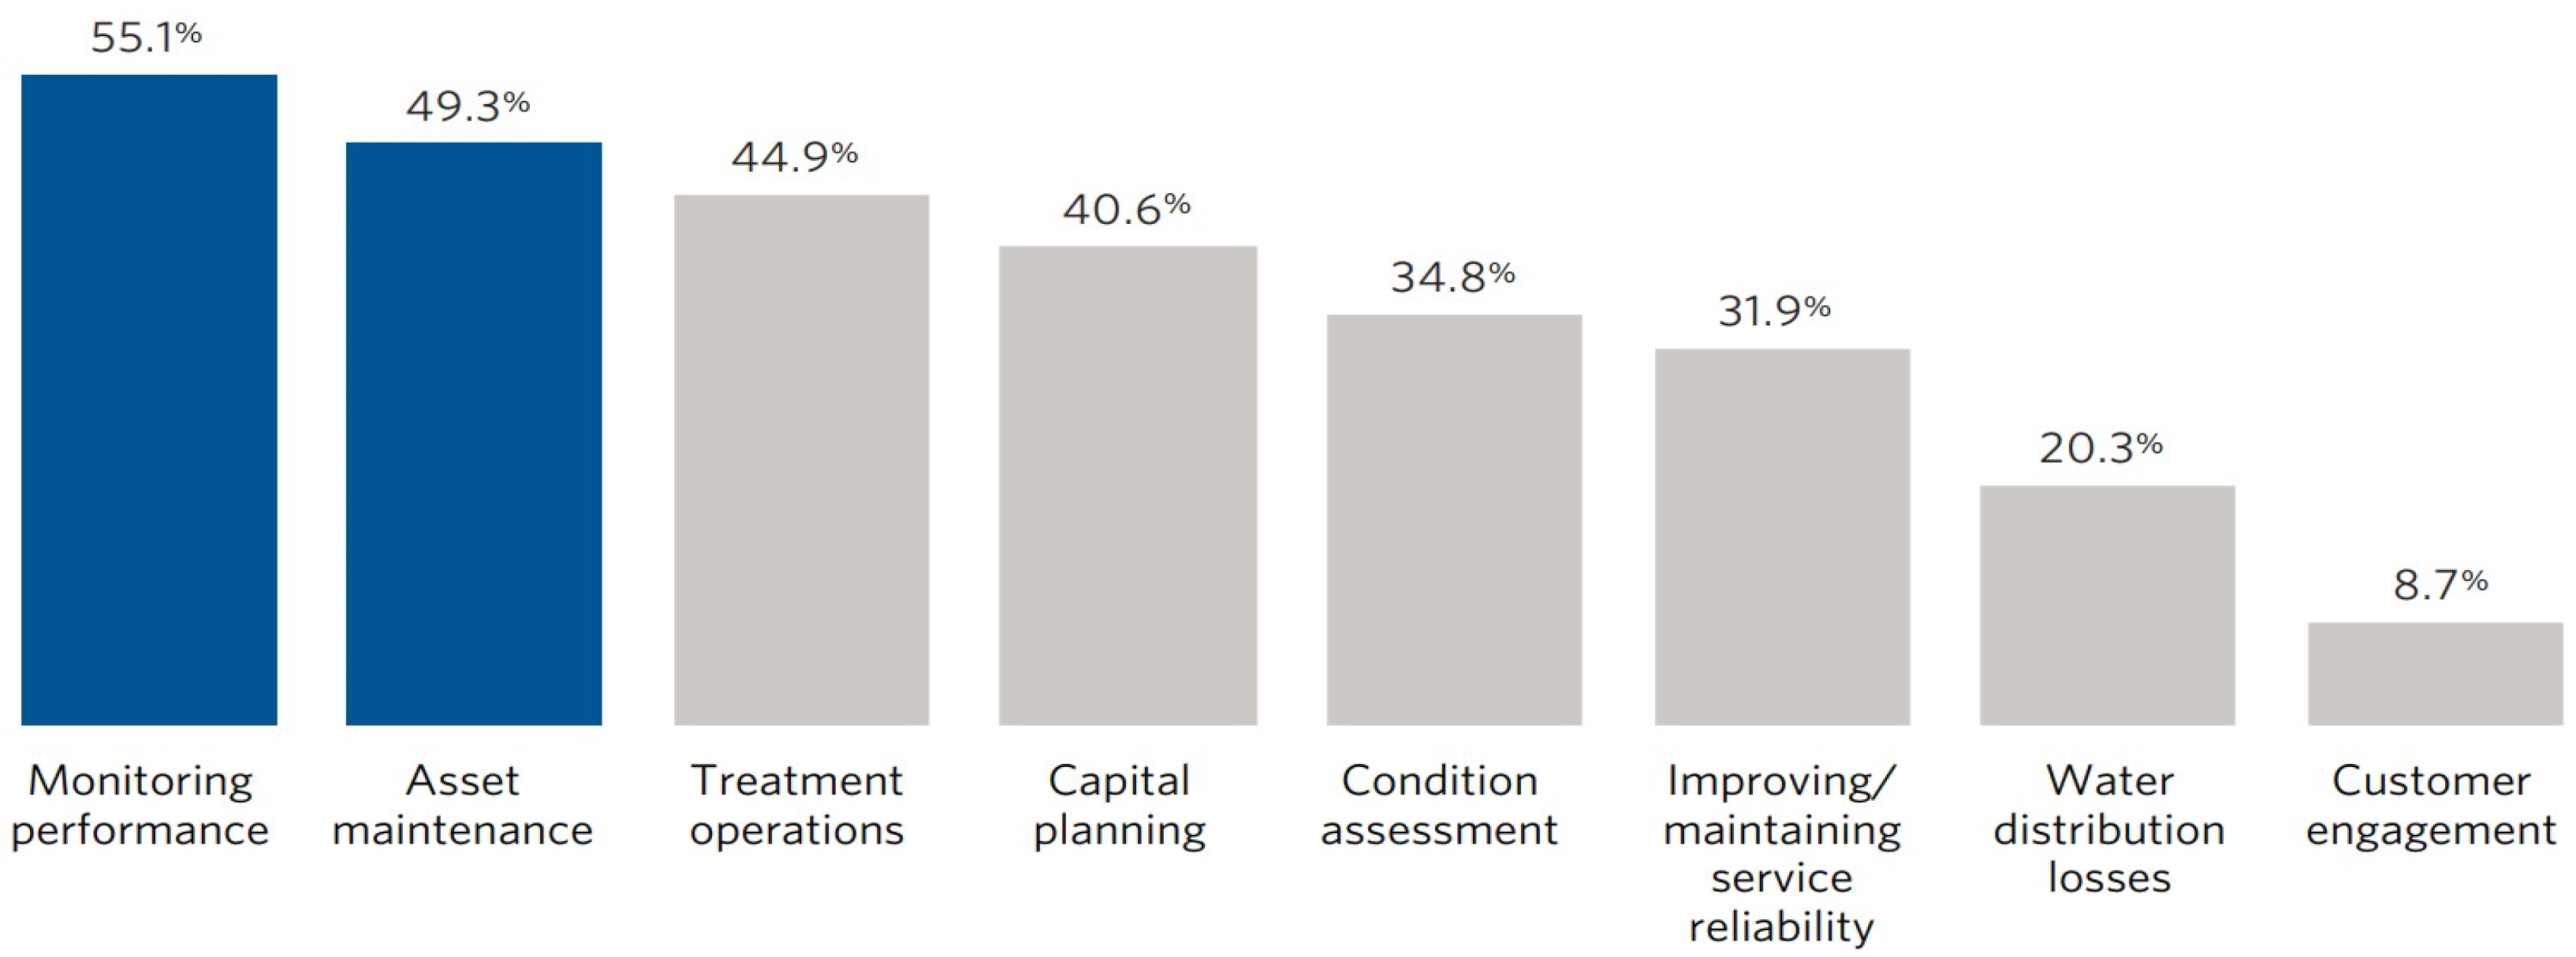
As we move into the era of innovation and technology, performance monitoring, asset maintenance, and treatment operations are identified as the top three operational areas in water resource management that data analytics and IoT sensor networks would help to improve the most [
13]. An illustration of this potential is shown in below
Figure 1, with results based on a survey conducted by Black and Veatch. Through improving these operational areas, businesses will be able to achieve lower operating costs, improve procedures, and extend asset life, which are some of the leading challenges in the water industry at present.
1.2. Smart Meters and Sensors
Smart meters and sensing systems are core ICT solutions that enable advanced water management. The automated systems mainly work as communication media for the total solution of sustainable water management framework, which typically helps to identify infrastructure failures and facilitates real-time controlled waterflow monitoring to prevent water losses. Moreover, the smart system measures the consumption and abstraction of water and automatically communicates the acquired information for tracking and billing purposes. This type of technological advancement helps to minimize water consumption, aid in improving outdated water infrastructure, and expand access and delivery of data acquisition to increase the returns-on-investments on account of reliability and transparency [
14]. In addition, more viable benefits endured through these smart meters and sensing system include optimized process operations, precise planning and decision making, reduced staffing, improved safety protection, and quality information [
12].
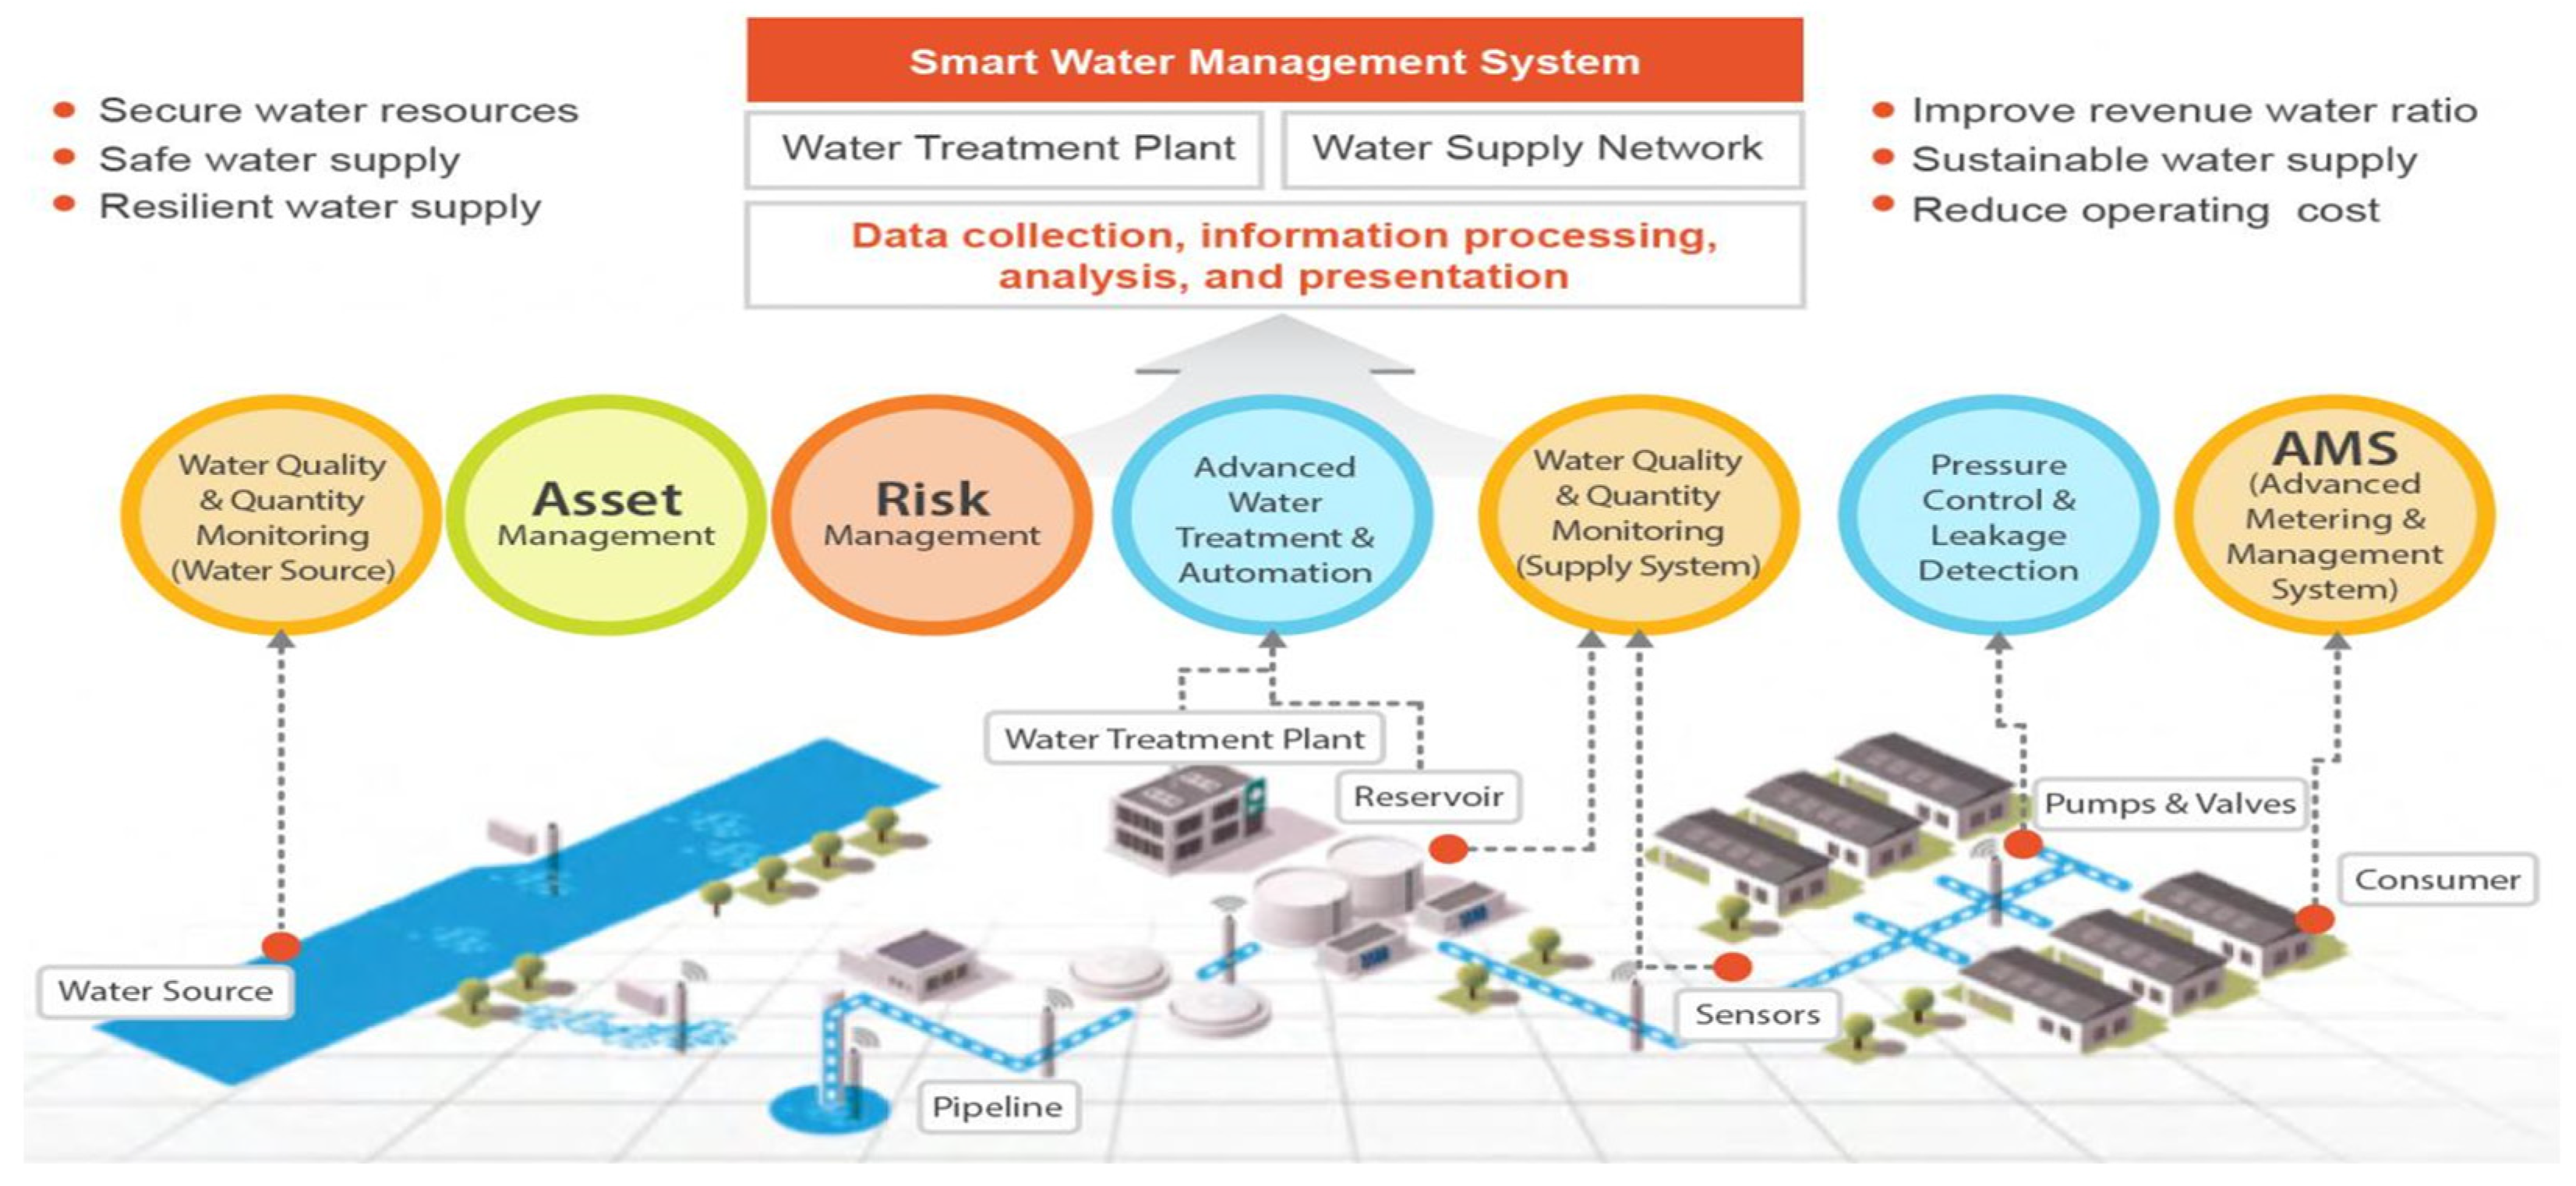
Figure 2 illustrates the benefits of an intelligent water management system, which consists of smart sensors’ networks and has the ability to detect, communicate, and optimize water solutions in real time. The illustration is adopted from an event report published by the Asian Development Bank that focused on PPPs and high-technology water solutions [
15].
1.3. Simulation Modeling in Water Industry
For the water-reliant process industry, computer-based simulation modeling technology is widely used as the decision support tool that provides long-term, cost-effective, and sustainable water solutions to large-scale and complex operational problems. Typically, it is a modeling technique used to imitate and evaluate the dynamic behavior of a real system in discrete time steps, which are represented via mathematical expressions and logical procedures in a programming environment that gives water managers and decision makers a clear path to recognize troubling trends, evaluate the underlying causes, and choose the best course of action for any proposed water handling system before it is put into practice. Traditional water management simulations are generally complex and dynamic models, with adjustments being made to essential parameters based on the system operational requirements needed to achieve optimal results.
Though applications of simulation modeling evolved over the years, the technique was first practiced dynamically with water resource management and its agricultural use in the late-1970s [
16]. Since then, the technology gained much global recognition among research scholars, with more research studies being conducted by academics to solve complex water-related operational problems using computer simulation tools.
For example, [
17] developed a dynamic simulation model using computer-programmed algorithms and STELLA modeling software tool to control the operation of supply pumps for water distribution in storage tanks. The created model simulated the fluctuating water levels of reservoirs in a water supply system and successfully estimated the cost of pumping operation in regular and emergency situations.
In [
18], the authors conducted a scenario-based study using the system dynamics simulation approach (SDSA) to analyze the interaction of various functions in a multipurpose reservoir operation system. The functions, which were investigated for their interactive effects in a reservoir, were hydropower production, environmental impacts, and landslide stability. The developed simulation model successfully demonstrated the reservoir’s characteristics of handling dynamic situations in an environmentally friendly operating condition.
In [
19], the authors performed a periodic sensitivity analysis of an industrial wastewater treatment plant (WWTP) using process simulation on a STOAT modeling software. The simulation study helped in identifying the contaminants removal efficiency of the plant and the most critical parameter affecting its performance.
In [
20], the authors revealed the interdependency of a multistage medium-scale reverse osmosis (RO) desalination plant performance on membrane type, configurations, and plant operating conditions. The study used a simulation model to investigate different brands of membranes to find the most suitable one that can achieve maximum plant performance with minimum energy consumption, and successfully proposed the Filmtec BW30LE-440 membrane type as the best fit to implement at the pilot plant for more efficient and sustainable operation.
1.4. Sustainable Water Management Situation in Pakistan
Pakistan is one of the nations most at risk from the negative effects of climate change [
21]. Pakistan’s rainfall patterns could be significantly impacted by the rising global temperature, posing a substantial threat in the form of more frequent and severe floods and extended droughts. [
22].
By 2030, there will likely be a water shortage in the country, which has a population of over 220 million people and rising water demand [
23]. By 2025, water demand is expected to increase by 10% annually, potentially reaching 338 billion cubic meters. However, the amount of water available per person in the whole country has decreased from 1700 cubic meters in 1992 to 1090 cubic meters in 2012 [
24]. Pakistan ranks quite low among the 122 countries assessed in terms of the quality of their drinking water, coming in at number 80 [
25]. Moreover, as a developing state, the country has limited financial capacity and insufficient funds allocated for the development of sustainable water infrastructure to meet their national targets [
26]. Traditionally, sustainable water management was closely associated with economic growth and poverty mitigation. However, it is unfortunate that the country’s overall performance is rather poor in terms of the water economy.
Owing to the depressive water management situation in Pakistan, it is crucial to integrate and analyze the country’s regulatory system and technological infrastructure for a holistic sustainable water development. In order to foster conservation, efficiency, production, and disaster relief, effective water management requires a strategy that integrates institutions, policies, skills, and technology.
1.5. Case Study: Pharmaceutical Water Treatment Plant
To carry out this research, a pilot-study method was used to empirically quantify and validate the measured operational data, while the pilot plant was operating at regular production efficiency. The study plant was based in Karachi, the capital city of Sindh state, Pakistan, which employs discrete sensors to carry out staged water treatment operations, water flow control, and quality monitoring. Therefore, to improve the plant’s operational efficiency, a mathematical modelling and simulation approach was employed.
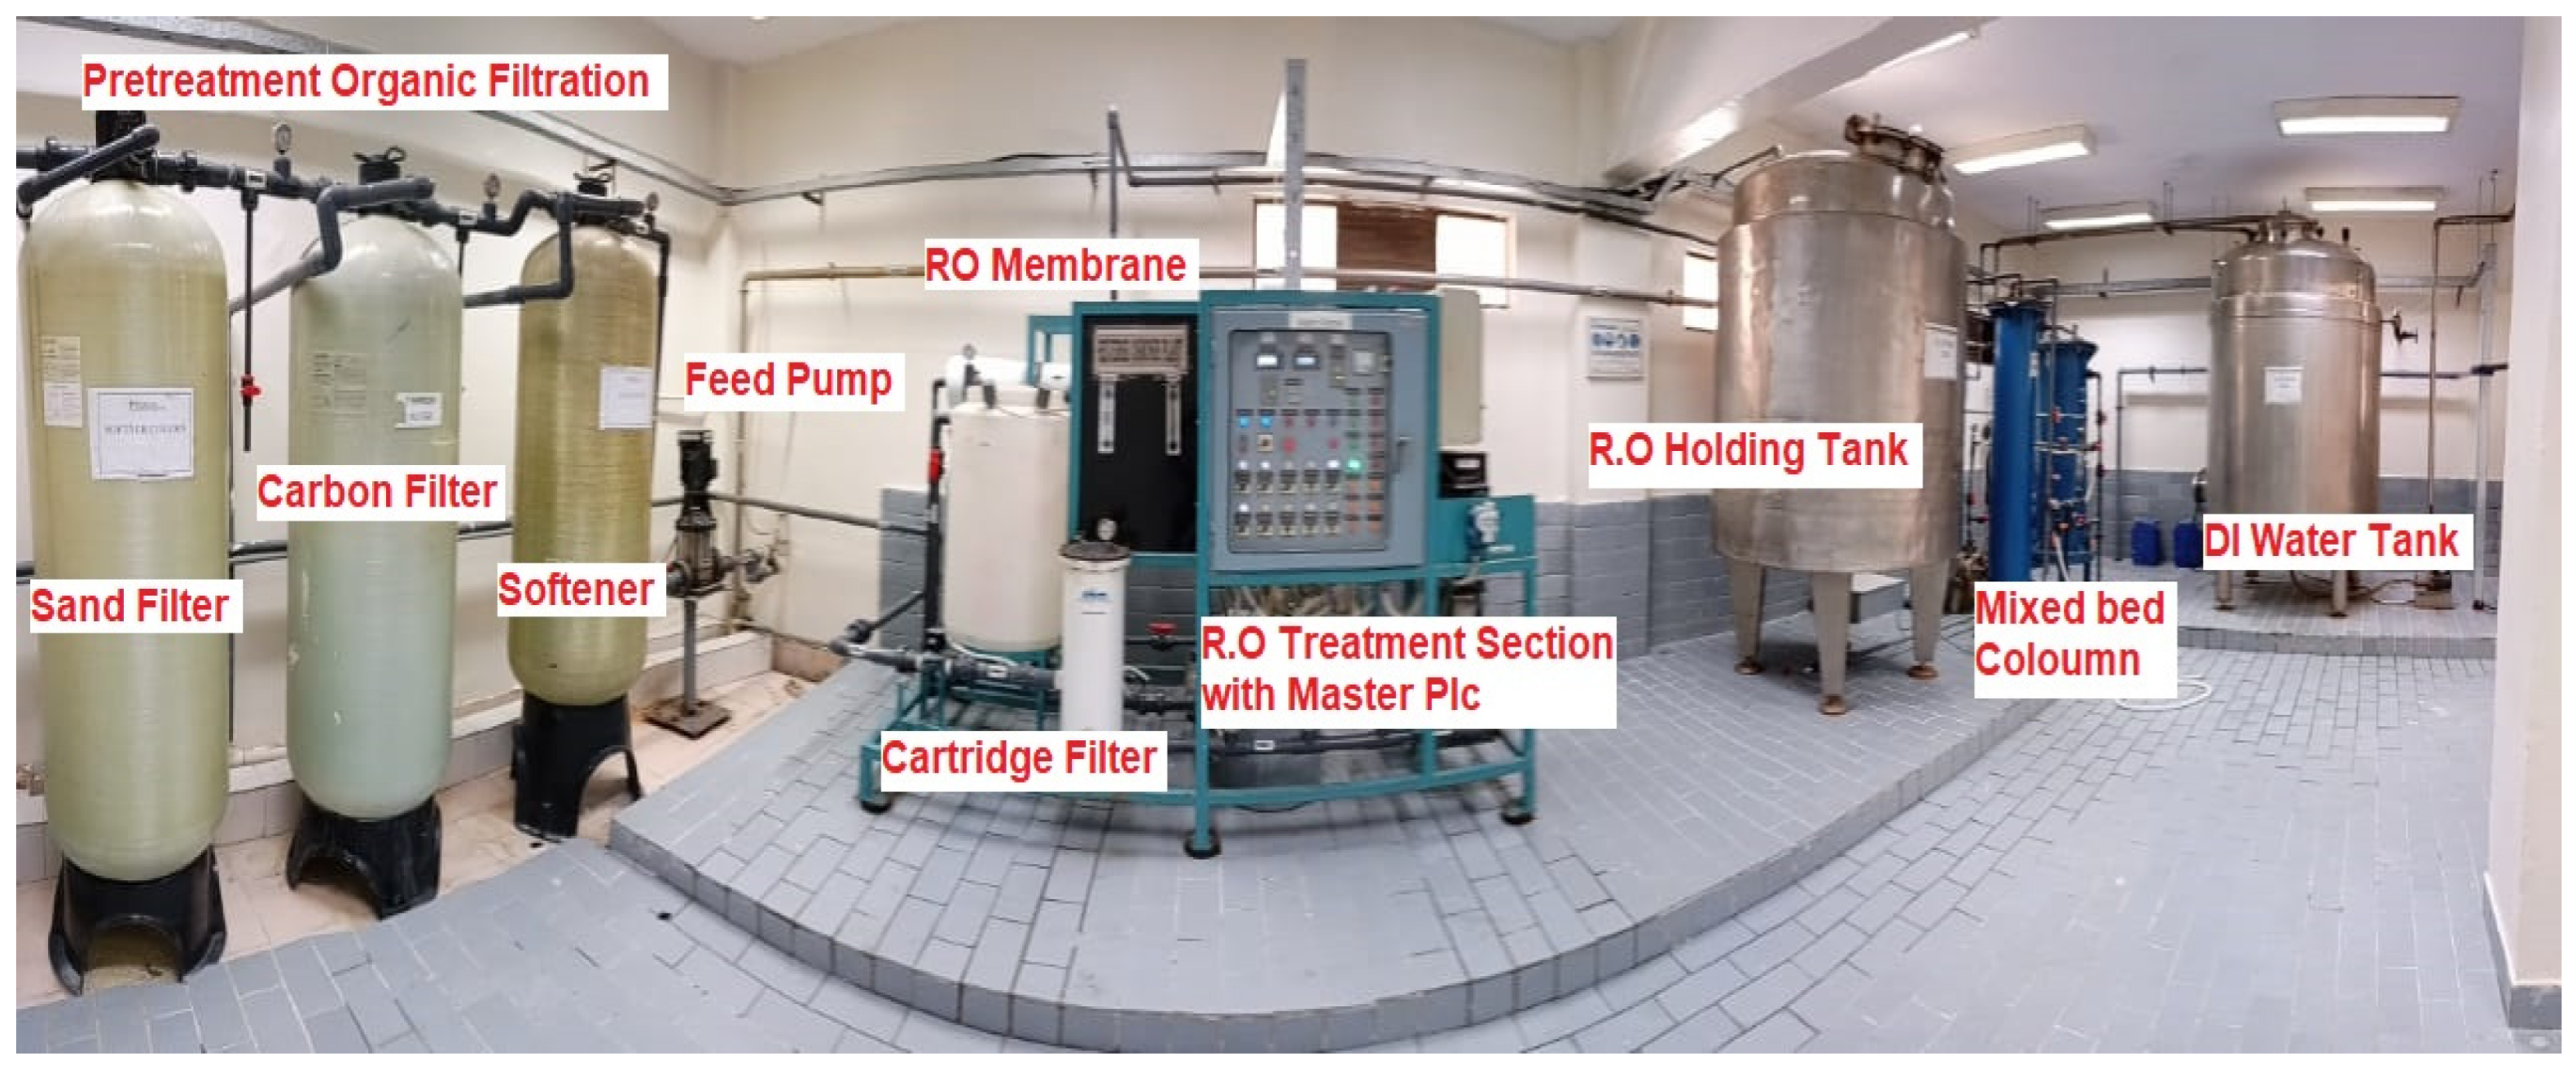
The main underground reservoir of the pilot water purification plant (
Figure 3) had a total storage capacity of 60,000 gallons, while its production capacity was 2800 LPH. The plant used 35,000 gallons of city lake water each day, of which approximately 30,000 gallons were treated and used each day to produce a variety of medical goods, namely syrups and pills, and in the sanitization of machine apparatus.
Table 1 presents the plant’s operational capacity.
2. Simulation Modeling and Results Analysis
This section exhibits the overall findings and analysis of the simulation modeling performed using MATLAB-Simulink on a pilot water treatment plant owned by a pharmaceutical manufacturing company. In particular, the pilot plant is equipped with traditional infrastructure used to maintain quality standards and satisfy production goals. Through applying a linear mathematical approach [
27] to key sub-systems, fundamental purification techniques were rigorously examined in the study. The reverse osmosis section, in particular, underwent empirical testing to examine the process and interdependencies of crucial parameters. Thus, through means of various plant sensors employed at the facility, performance of key parameters was closely observed to evaluate the treatment process via comparing the real measured data with the findings of the simulation model, which served as a system validation and process optimization.
2.1. RO Plant Schematic
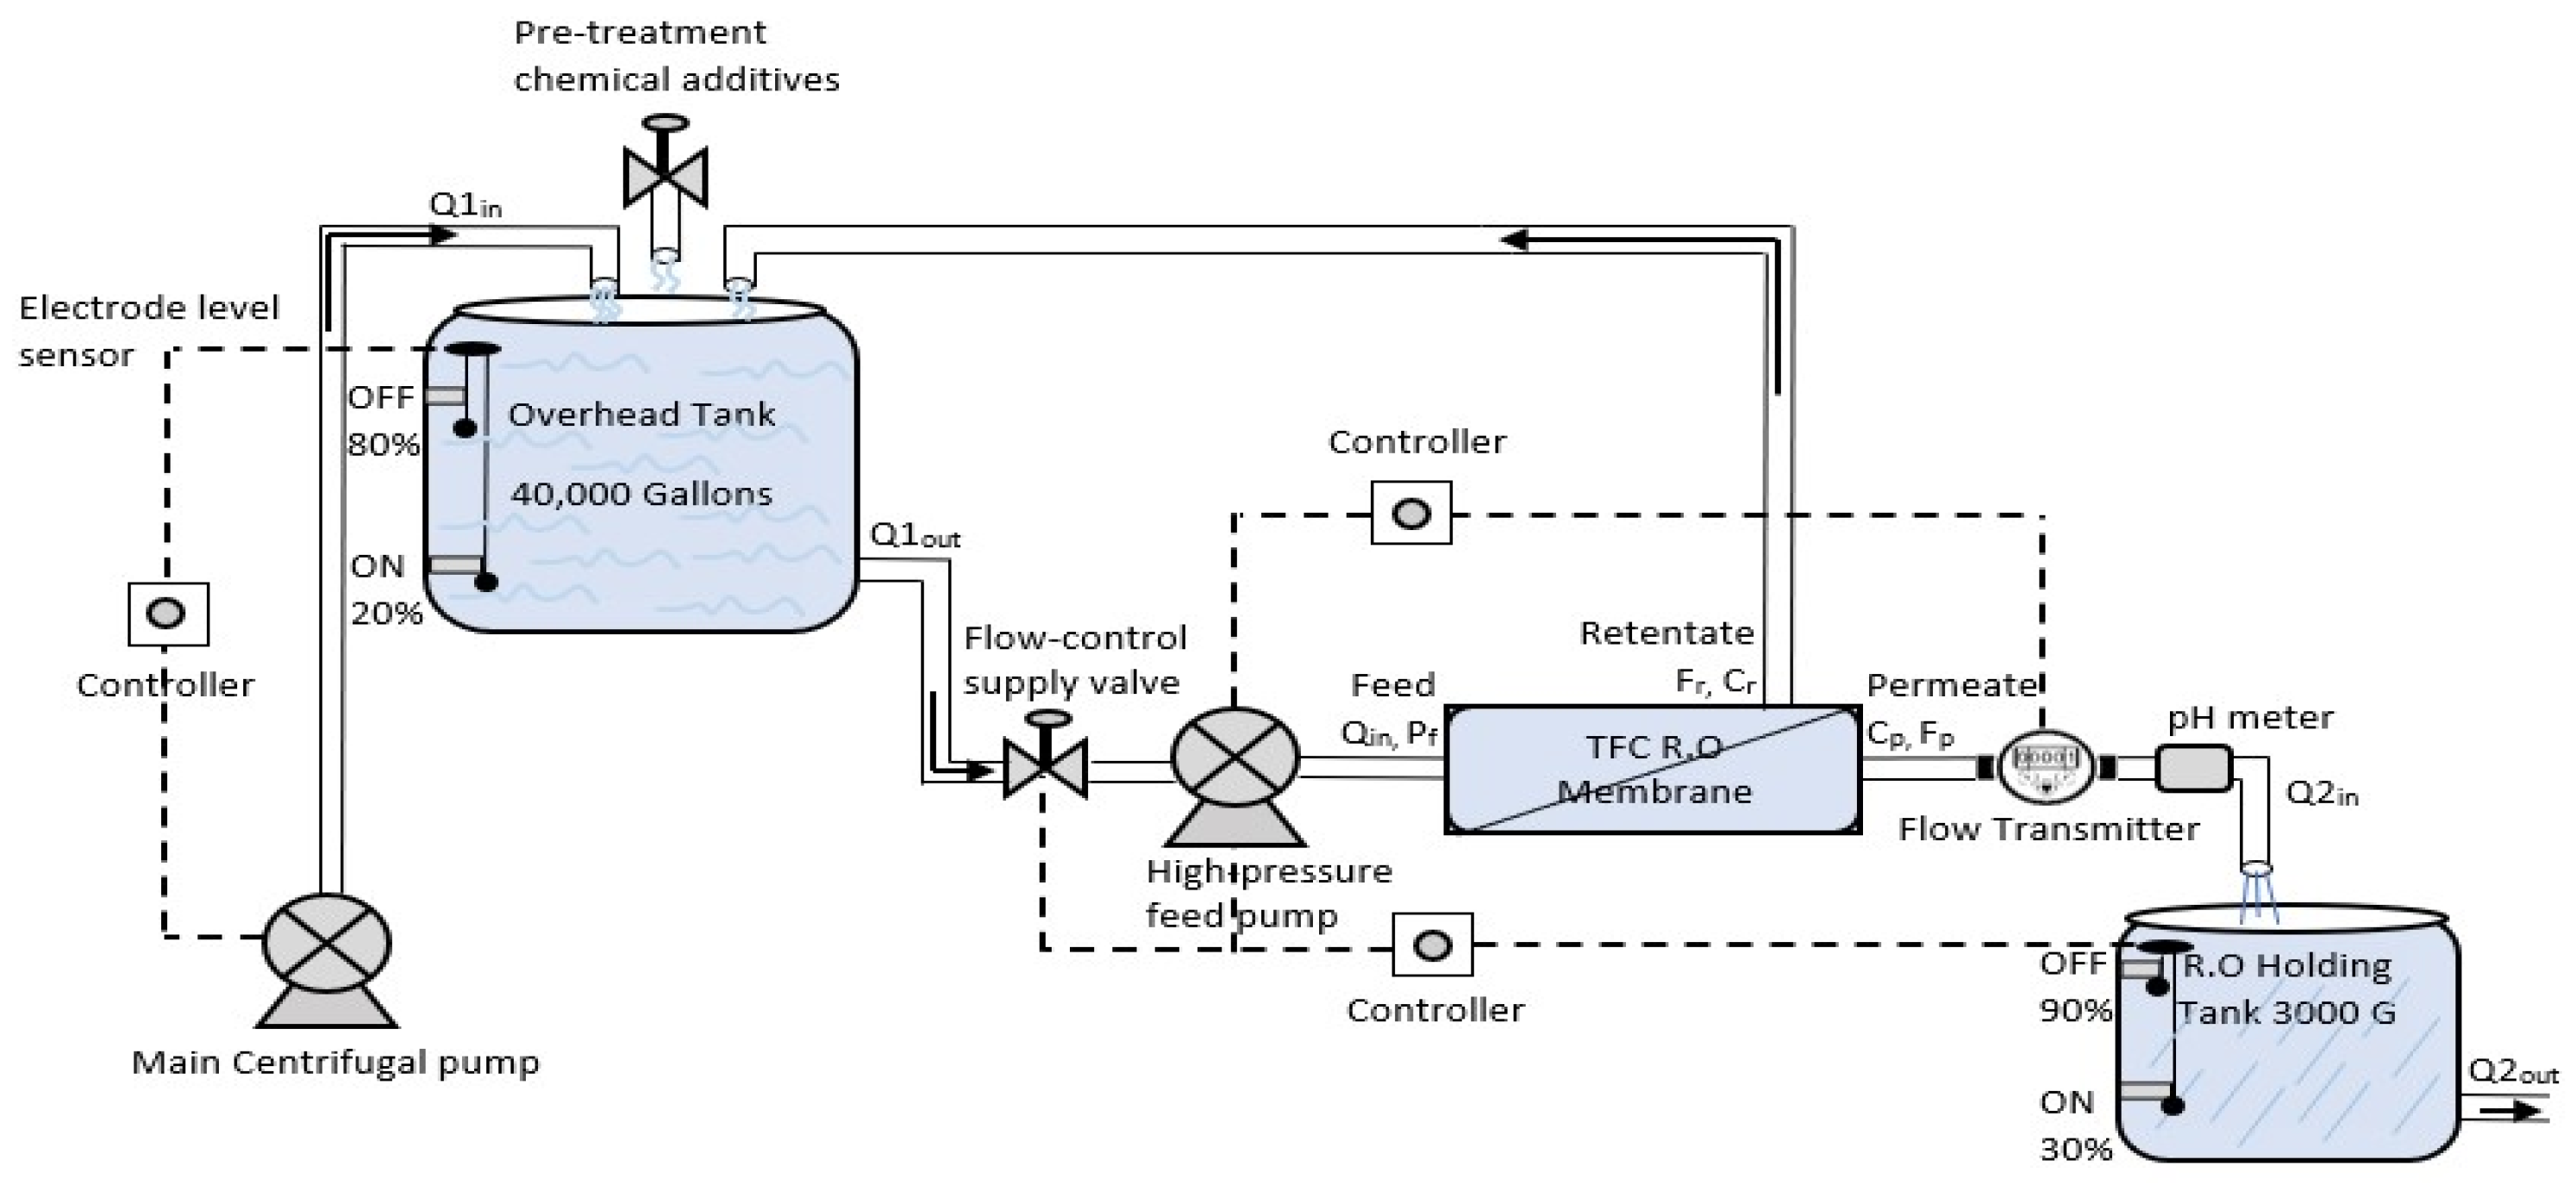
The simulation model for the RO section of a complete pilot water treatment plant is illustrated conceptually in
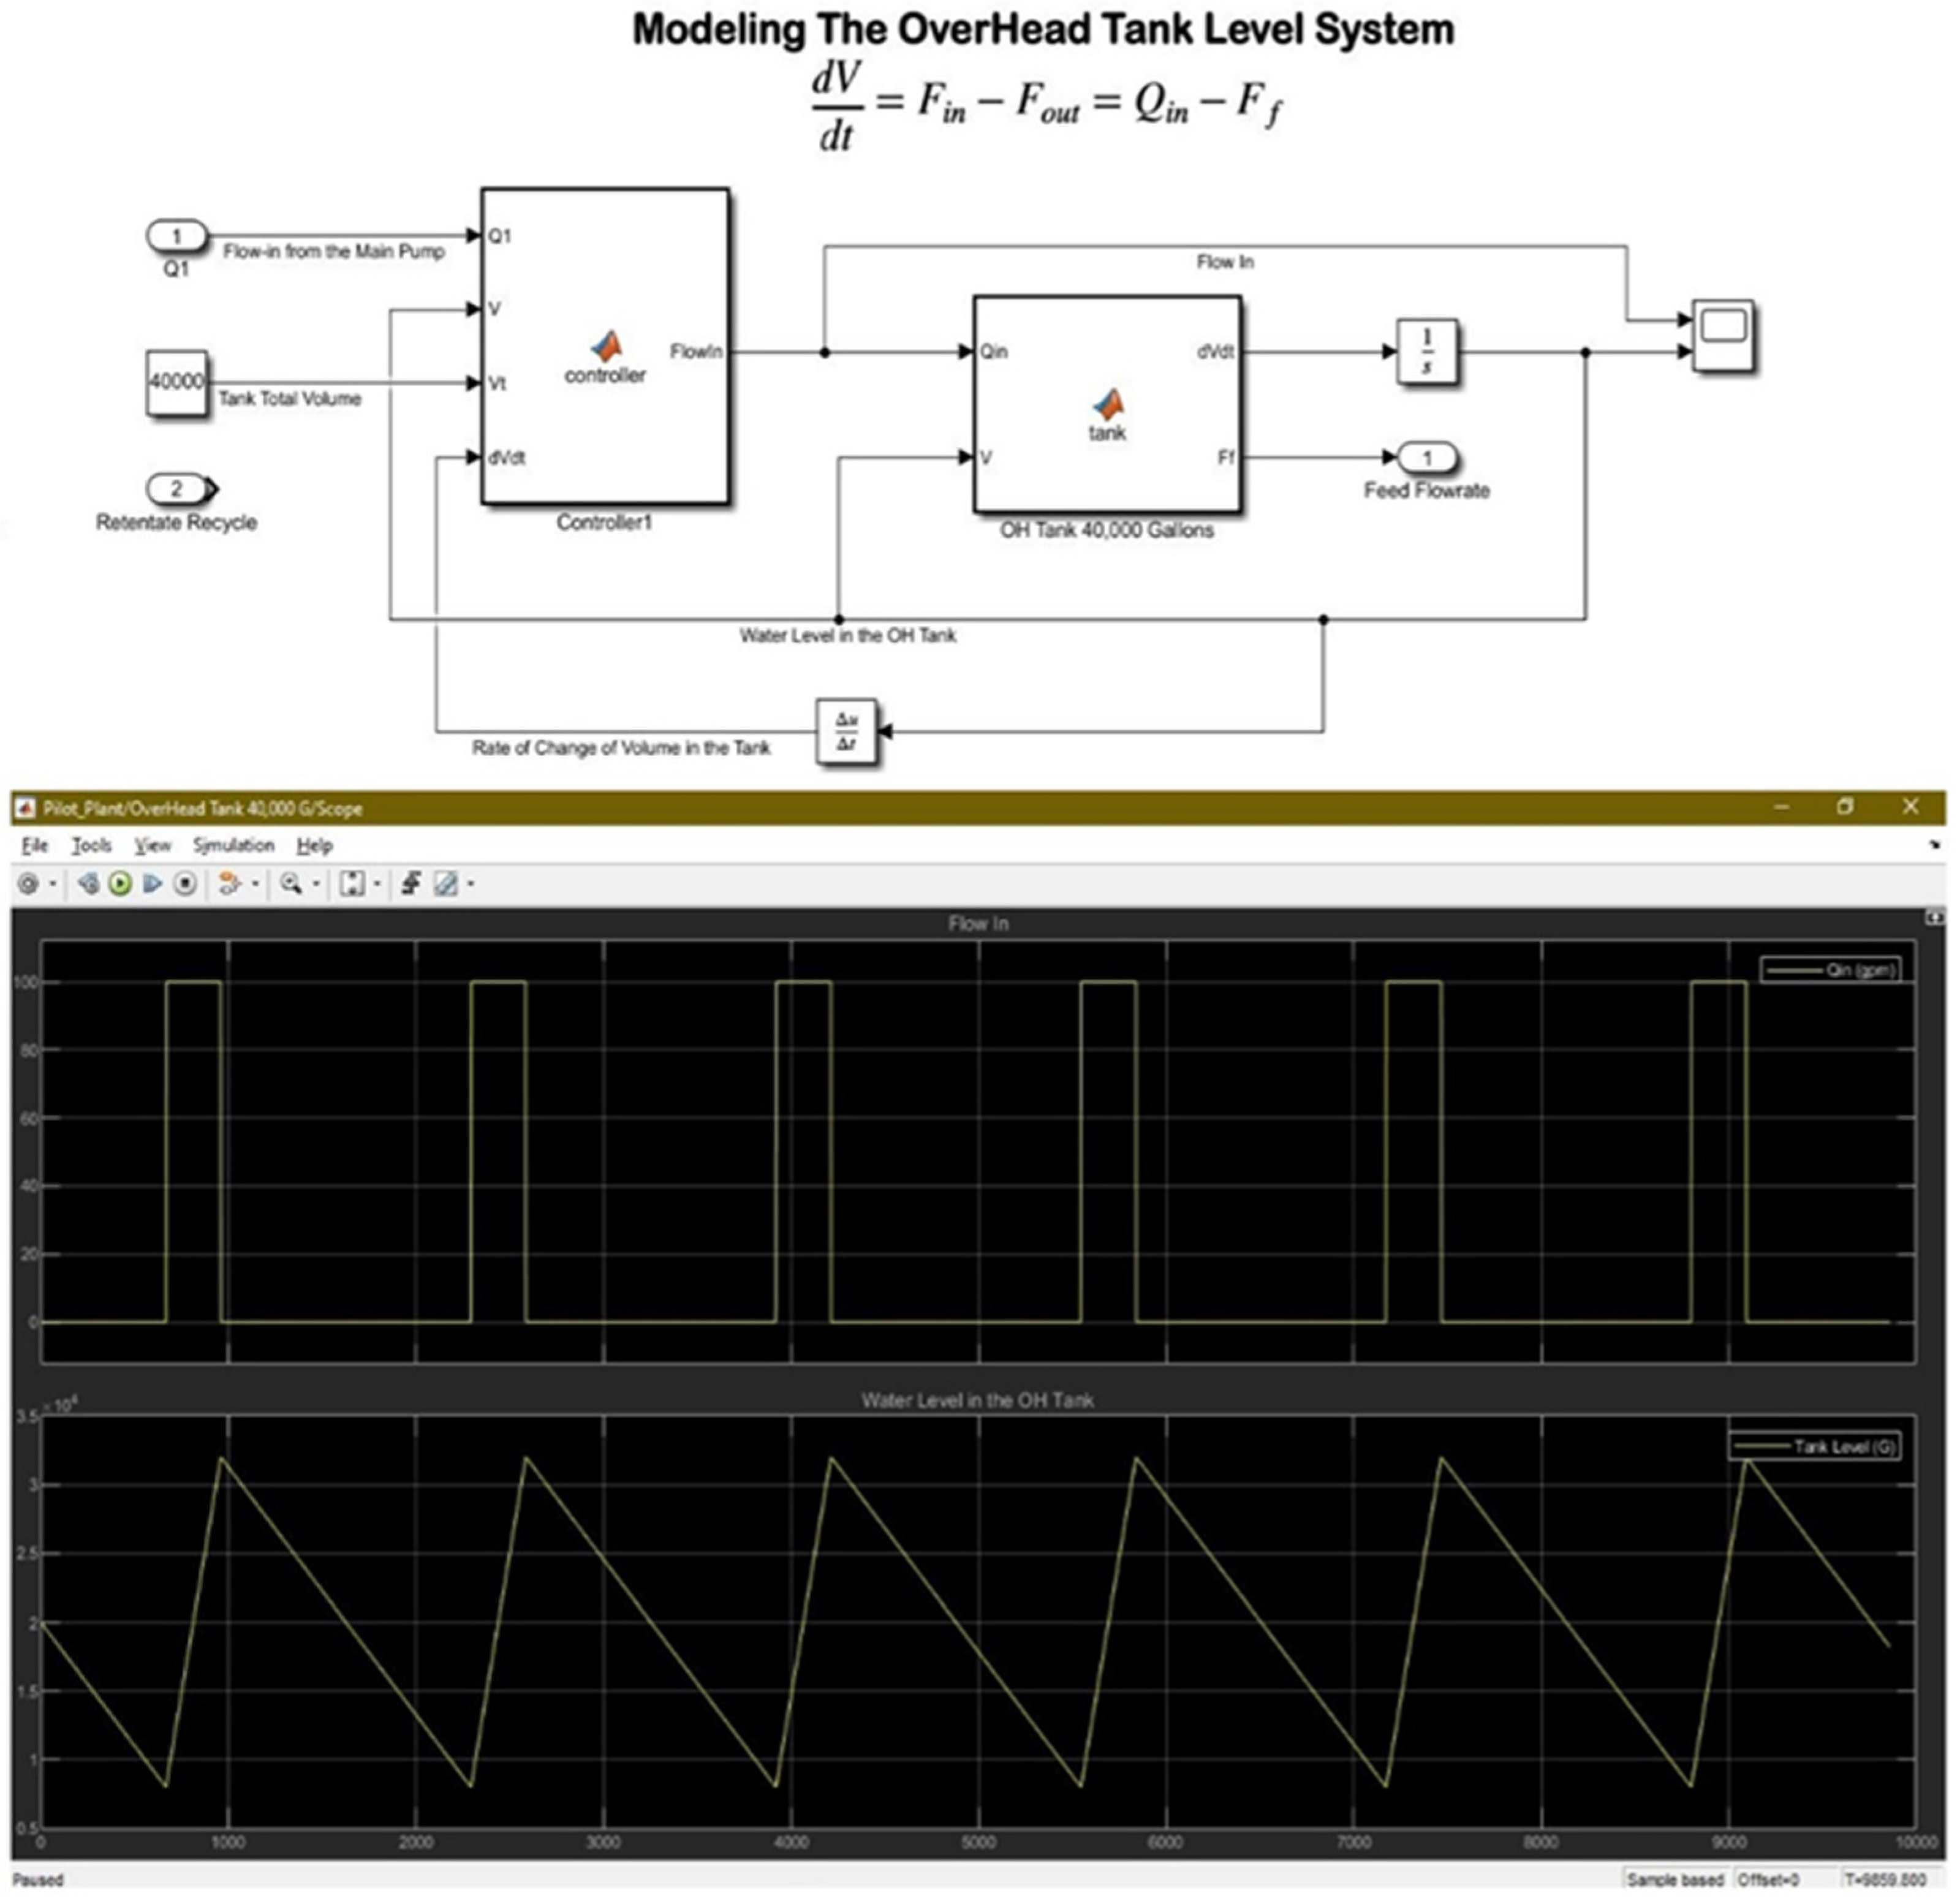
Figure 4 and examined in this section for process analysis and control optimization. The first tank model in the figure aims to simulate the operation of an overhead tank with a total capacity of 40,000 gallons and projected inflows and outflows of 100 gpm and 18 gpm, respectively, to the feed side of the membrane. An analogue electrode level sensor is programmed to automatically control the water level in the OH tank employed from the top of the reservoir, transmitting the signal through the controller to the main centrifugal pump to turn the motor supply on or off at the pre-defined liquid levels in the tank: 8000 Gallons (low-level) and 32,000 Gallons (high-level), respectively.
Figure 4 contains the developed simulation model of the overhead tank level system.
2.2. Simulation Modeling of Analogue Electrode Level Sensor in OH Tank
Figure 5 presents two simultaneous output graphs obtained from the designed simulation model of the overhead tank level control system. In the graph, the upper plot presents the turning on/off of the main centrifugal pump connected with a controller that transmits the incoming water stream to the overhead tank system with an estimated inflow rate (Q
1in) of 100 gpm, while the lower plot represents the continuous change in the water volume of the OH tank.
As illustrated, when the liquid volume in the tank hits the minimum level (0.8 × 10⁴ Gallons), the supply stream to the tank starts with an inflow rate (Q1in) of 100 gpm. While the tank volume reaches to maximum level (3.2 × 10⁴ Gallons), the supply stream from the centrifugal pump stops until it again reaches the minimum level. Here, it is important to note that the outflow (Q1out) is discharging at a rate of 18 gpm to the feed stream of RO unit. Since the total tank volume (Vt), volumetric inflow, and outflow rates are known parameters, the estimated time duration to completely fill the tank to maximum level is calculated as 4 h, while the system took 22 h to fully drain the tank and reach the minimum level. In general, this is a real-time continuous process designed and programmed using computer simulation modeling tool.
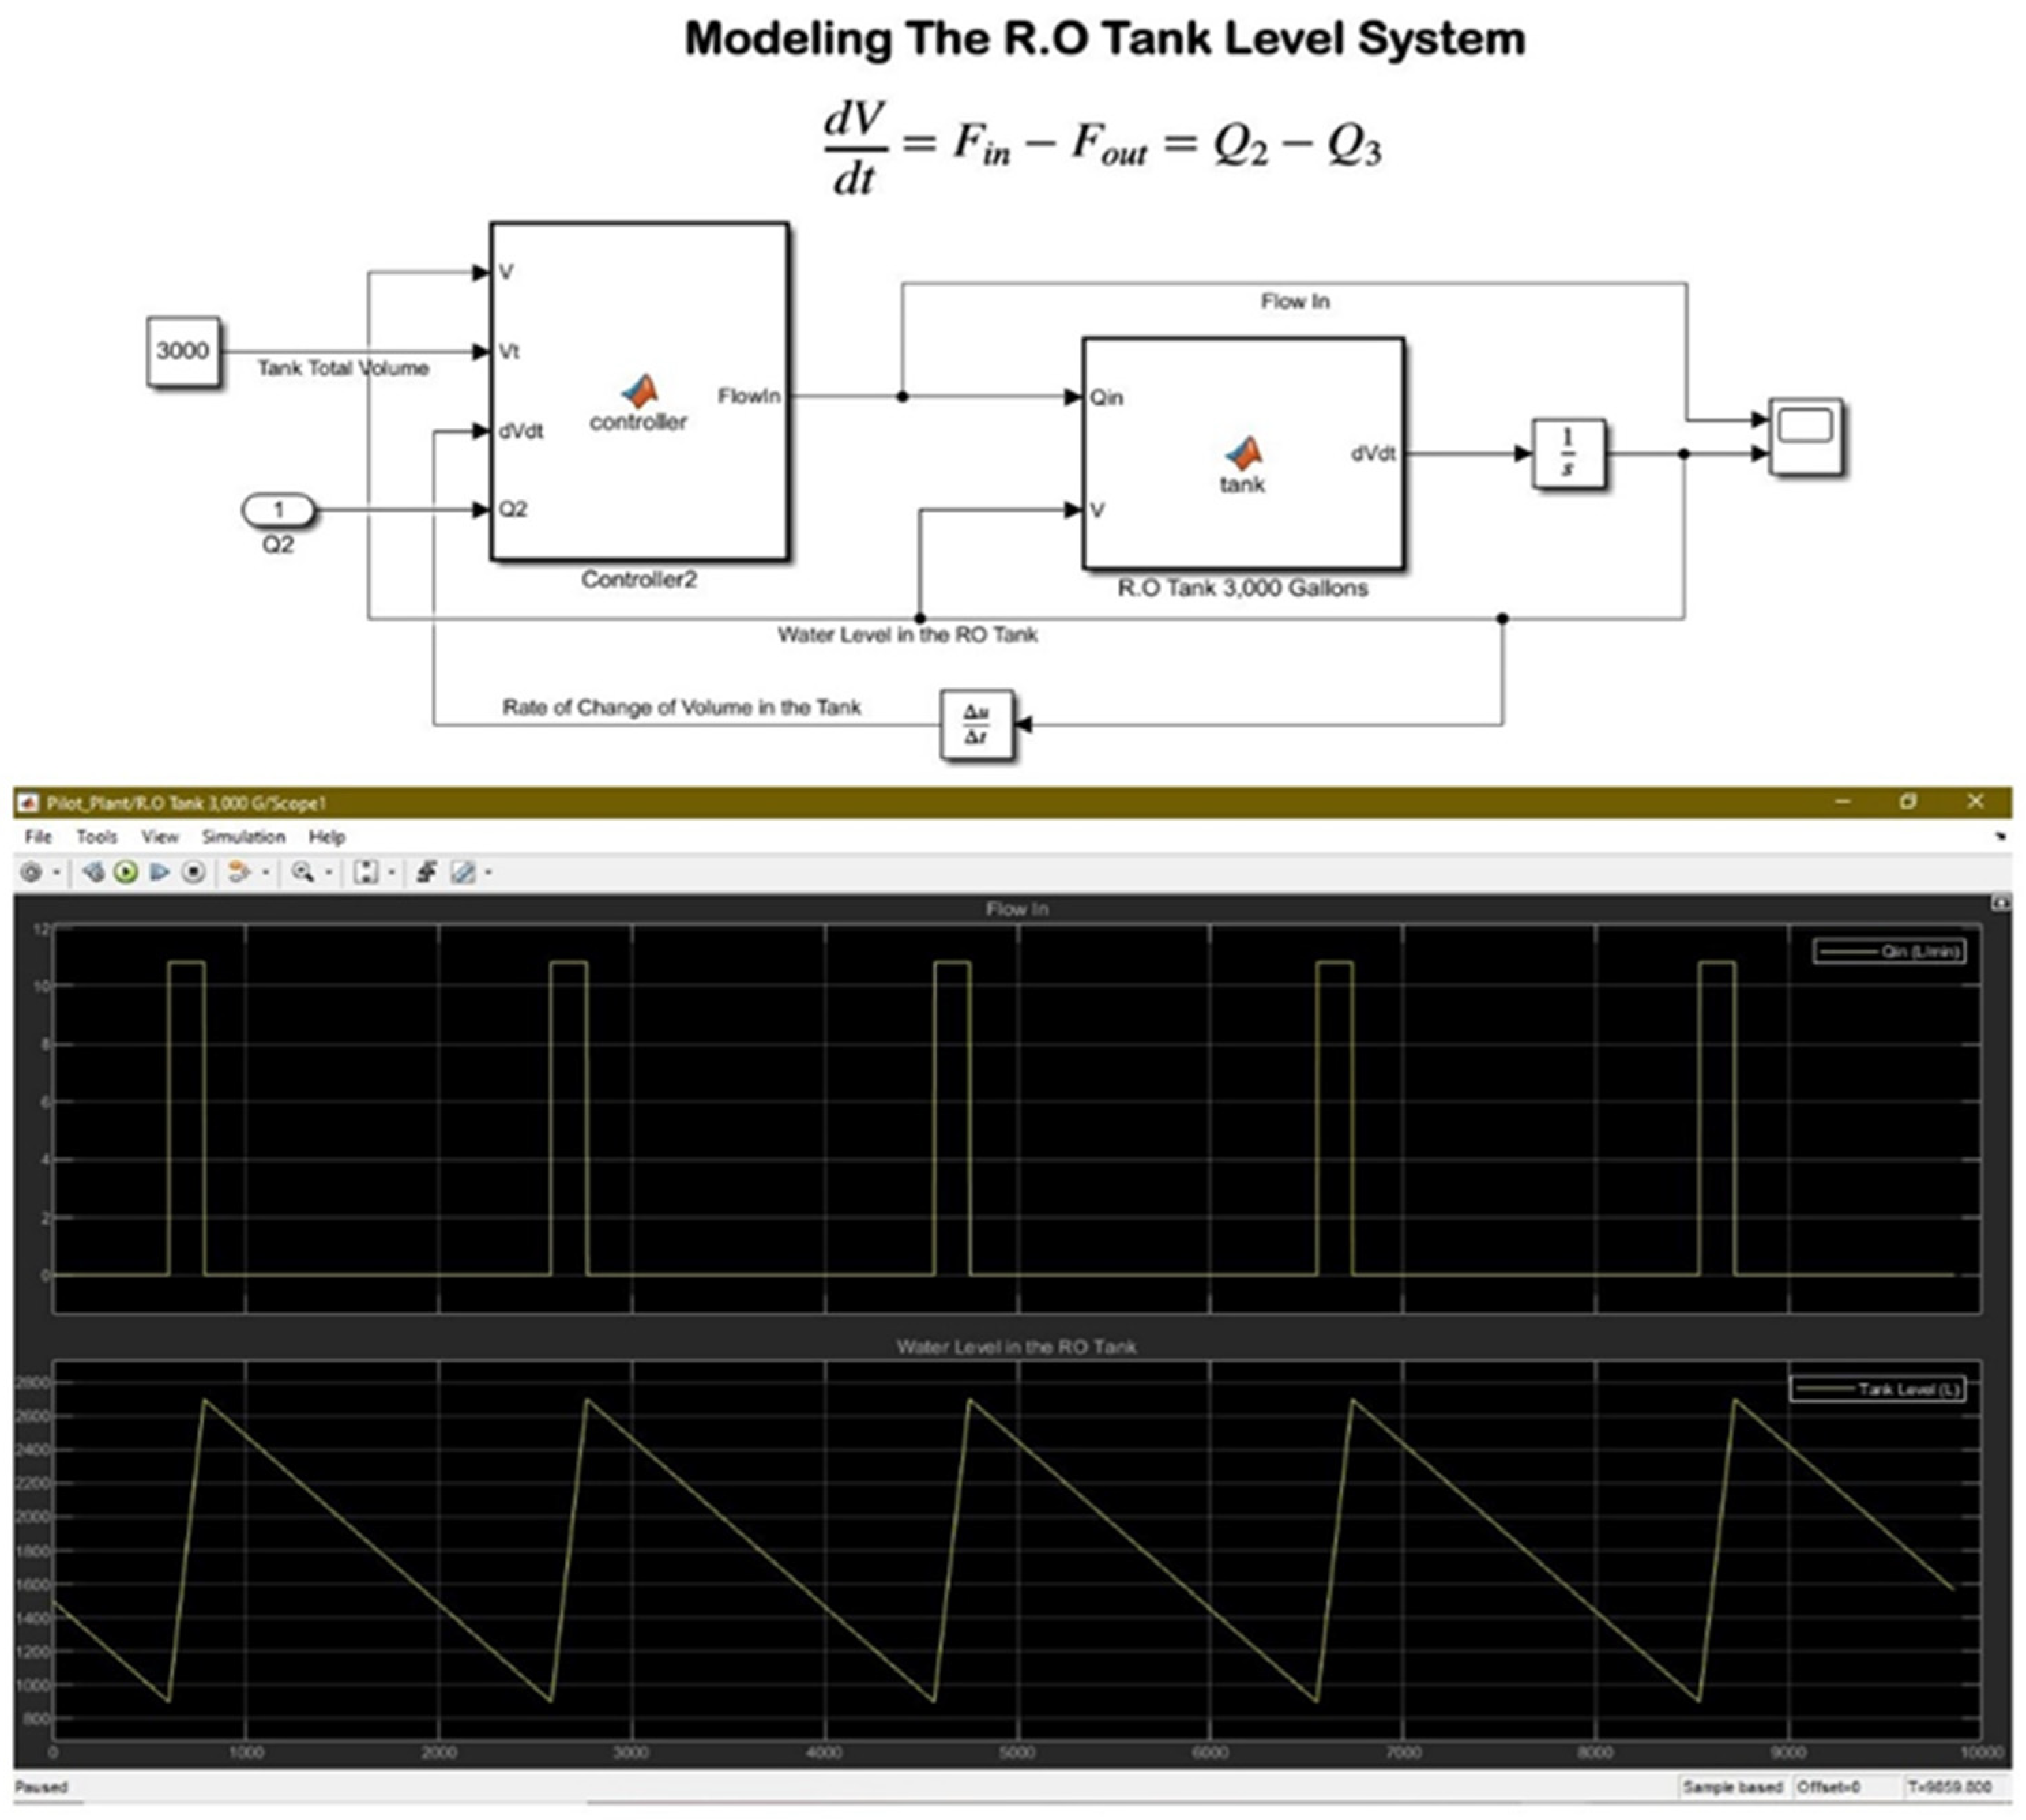
Furthermore, the system’s second tank model was designed to imitate the operation of the RO holding reservoir, which has a 3000 Gallon total capacity. This tank stores the purified water after RO treatment for additional post-treatment procedures. Thus, the rate of inflow to the RO tank is the permeate flowrate of the RO membrane, measured as 10 gpm approximately. In the same way, the analogue electrode level sensor is employed from the top to actively monitor and control the liquid level in the reservoir. Thus, the flow control supply valve is opened or closed with a delay to the hp-pump motor positioned before the RO membrane after the level sensor delivers a signal to the controller based on the pre-defined liquid levels, i.e., 900 Gallons (low-level) and 2700 Gallons (high-level).
Figure 6 presents the developed simulation model of the RO holding tank level system.
2.3. Simulation Modeling of Analogue Electrode Level Sensor in RO Holding Tank
Figure 6 presents two continuous concurrent output graphs obtained from the designed simulation model of the RO holding tank level control system. In the graph, the upper plot presents the turning on/off of the RO flux inflow to the holding tank. In this tank, the liquid level sensor controls the solenoid supply valve with a delay to the hp-pump motor implemented before the RO membrane to control the feed pressure. Thus, the varying permeate flowrate (
Fp) of RO membrane is the flux inflow rate (Q
2in) to the RO holding tank, which is measured as 6.00–14.00 gpm.
However, the lower plot represents the continuous liquid levels in the RO tank. Therefore, when the tank volume reaches the low level (900 Gallons), it quickly starts to fill up with an inflow rate equivalent to the RO permeate flowrate. In the simulation, (Q
2in) is measured as 10.82 gpm. As the tank becomes completely filled with RO flux and hits the high level (2700 G), the incoming RO stream stops until it again drains to the low level. Practically, the outflow discharge rate (Q
2out) from the RO tank is taken as 1–5 gpm to transmit the product stream to further post-treatment sections in the plant, such as the deionization column.
Table 2 presents the operational parameters obtained from the running pilot plant.
2.4. RO Transport Simulation Model
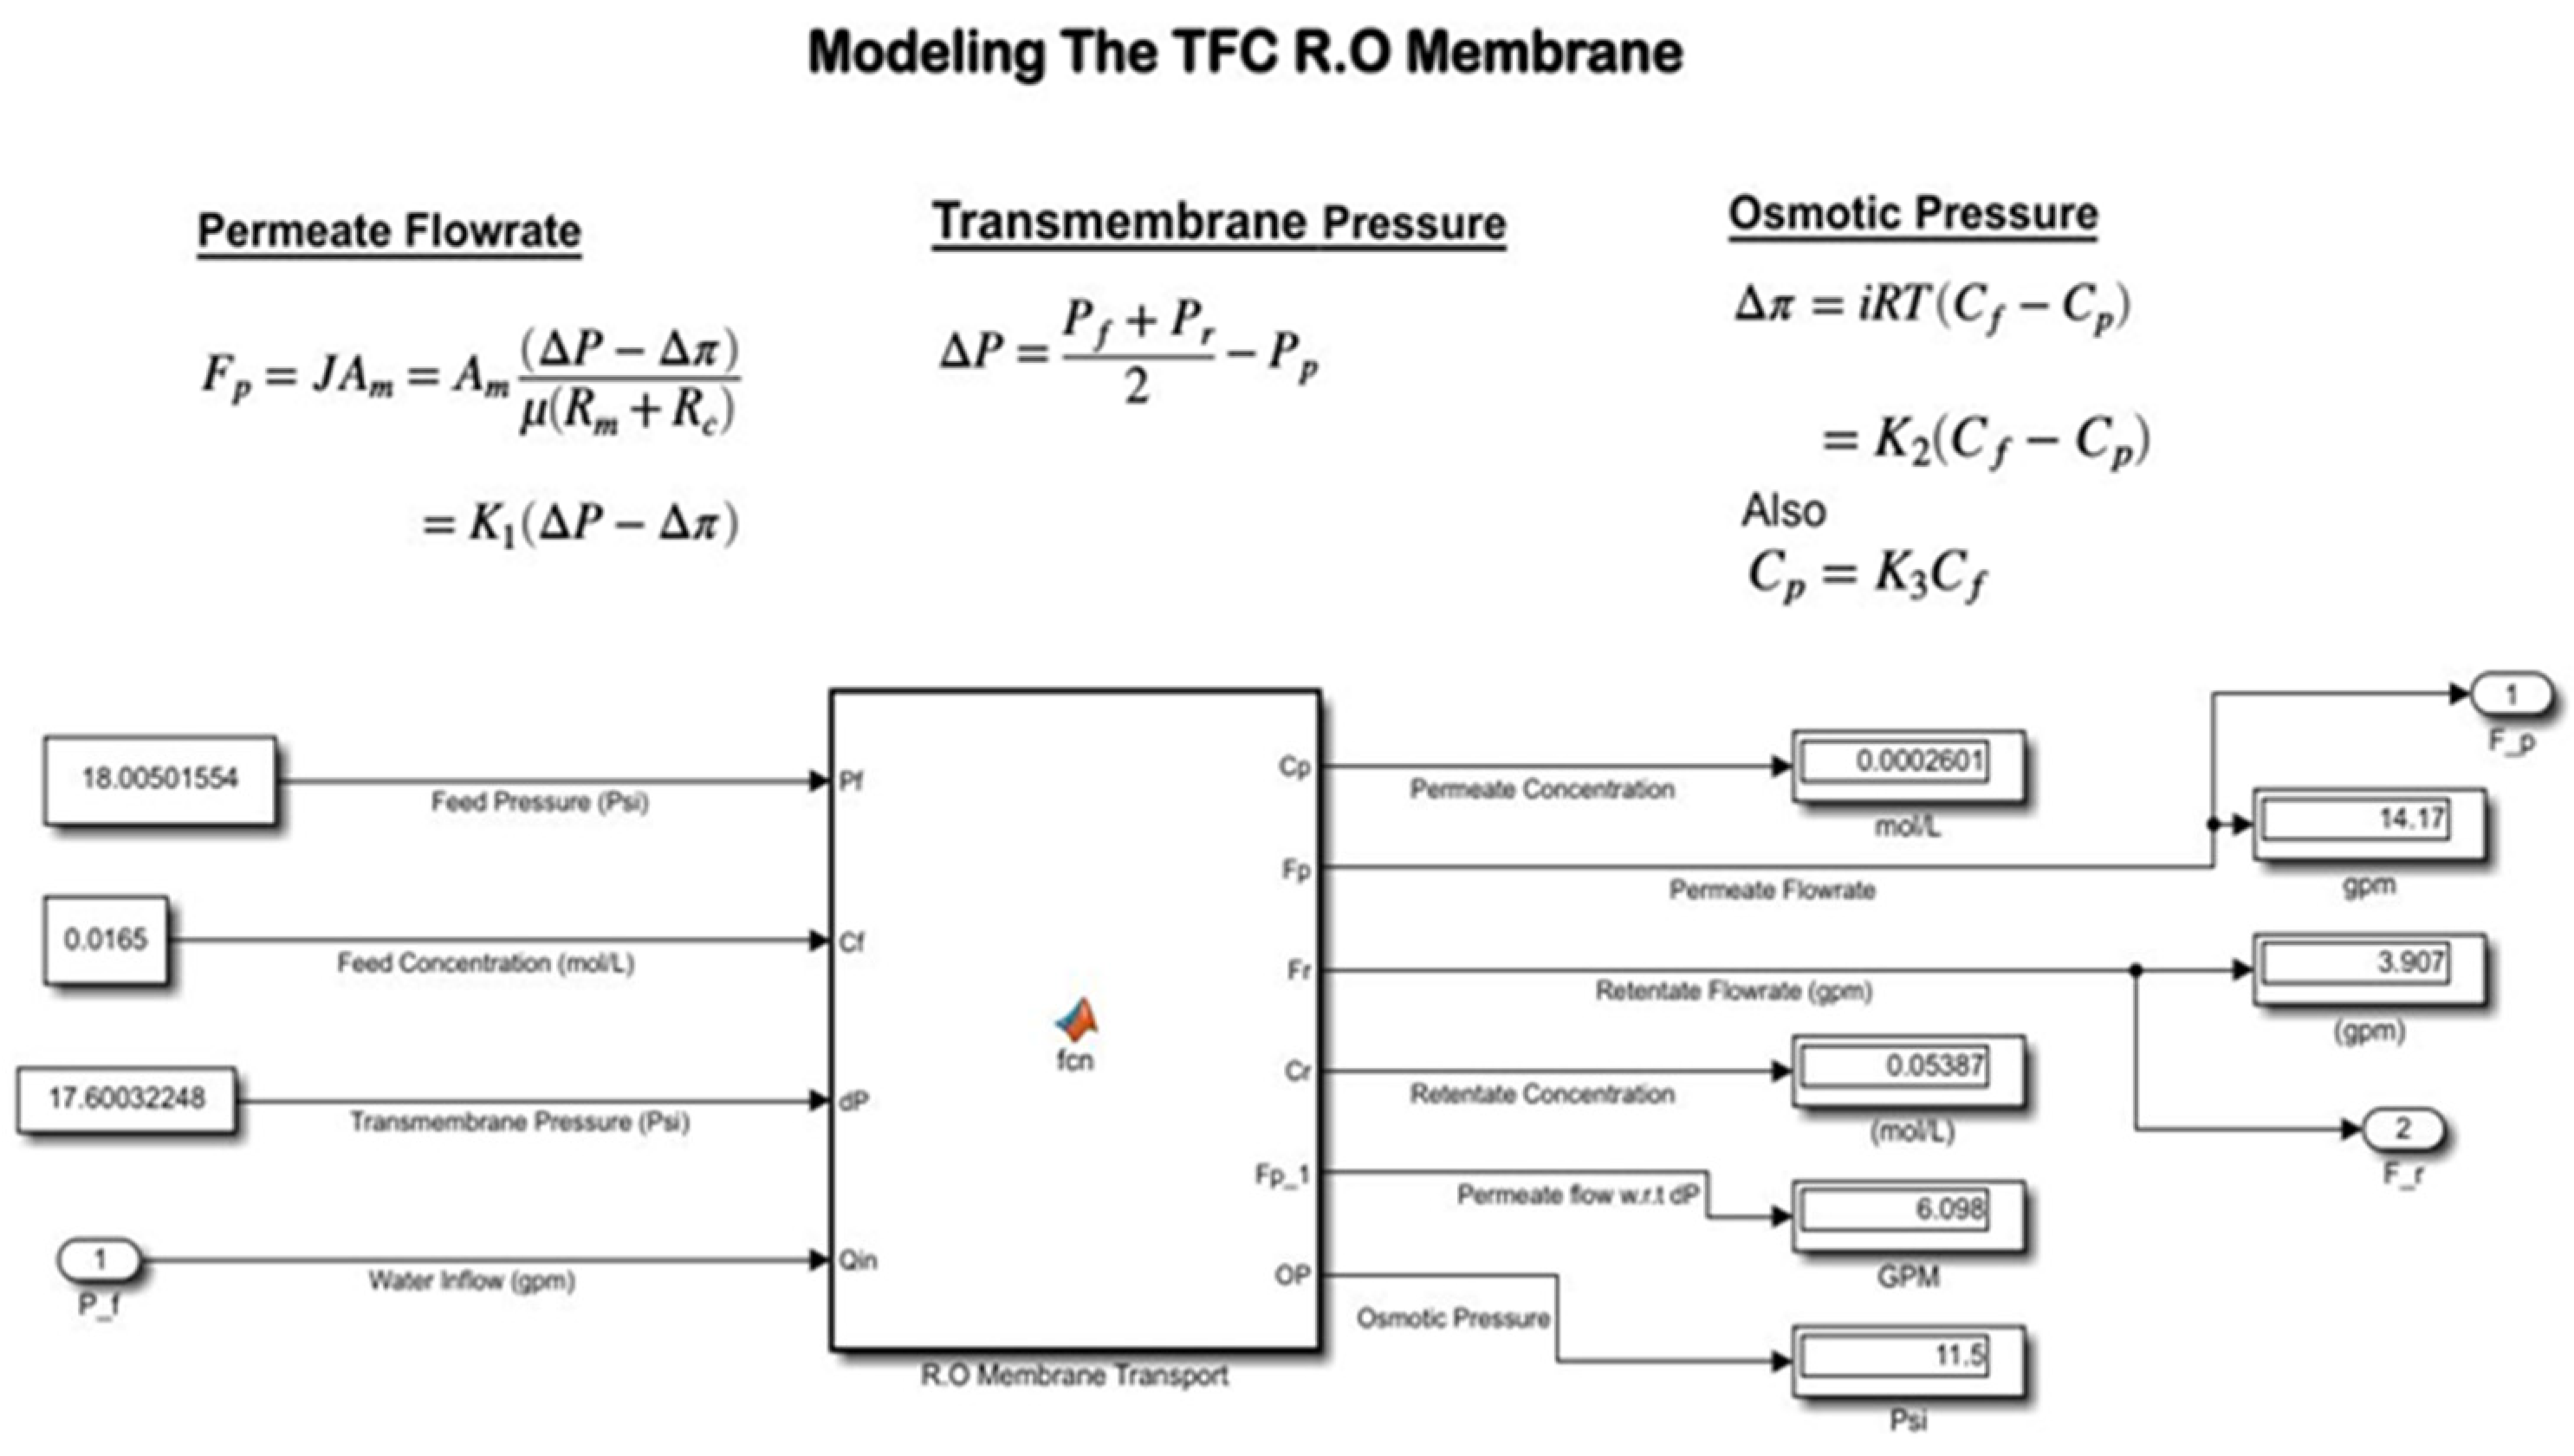
The semipermeable TFC RO membrane, for which the operational parameters and their functional capacities in the system are assessed, serves as the central component of the plant simulation model. The three waterflow pathways on the membrane are feed, permeate, and retentate. The volumetric flowrate (
Fp) across the membrane was continuously monitored in the model using a flow transmitter placed at the permeate side of the membrane. As such, this turbine-type flow sensor delivers a signal to the controller based on the permeate flowrate, which controls the speed of the hp-pump motor at the feed side of the membrane. The durability and efficacy of membrane performance are significantly driven via this automated adjustment of operational parameters. The concentrated solute, on the other hand, is rejected using the membrane’s retentate cycle and returned to the overhead tank. TDS sensors are used at membrane outputs to monitor the concentration of dissolved salts. As a result,
Figure 7 presents the simulation model that imitates the membrane transport process. The simulation results of the RO treatment section were examined based on the developed model for process analysis and performance enhancement via analyzing the proportionality of system’s operational parameters.
2.5. Simulation Results of Flow Transmitter at RO Permeation
The results from the flow transmitter used at RO permeation in the model (see
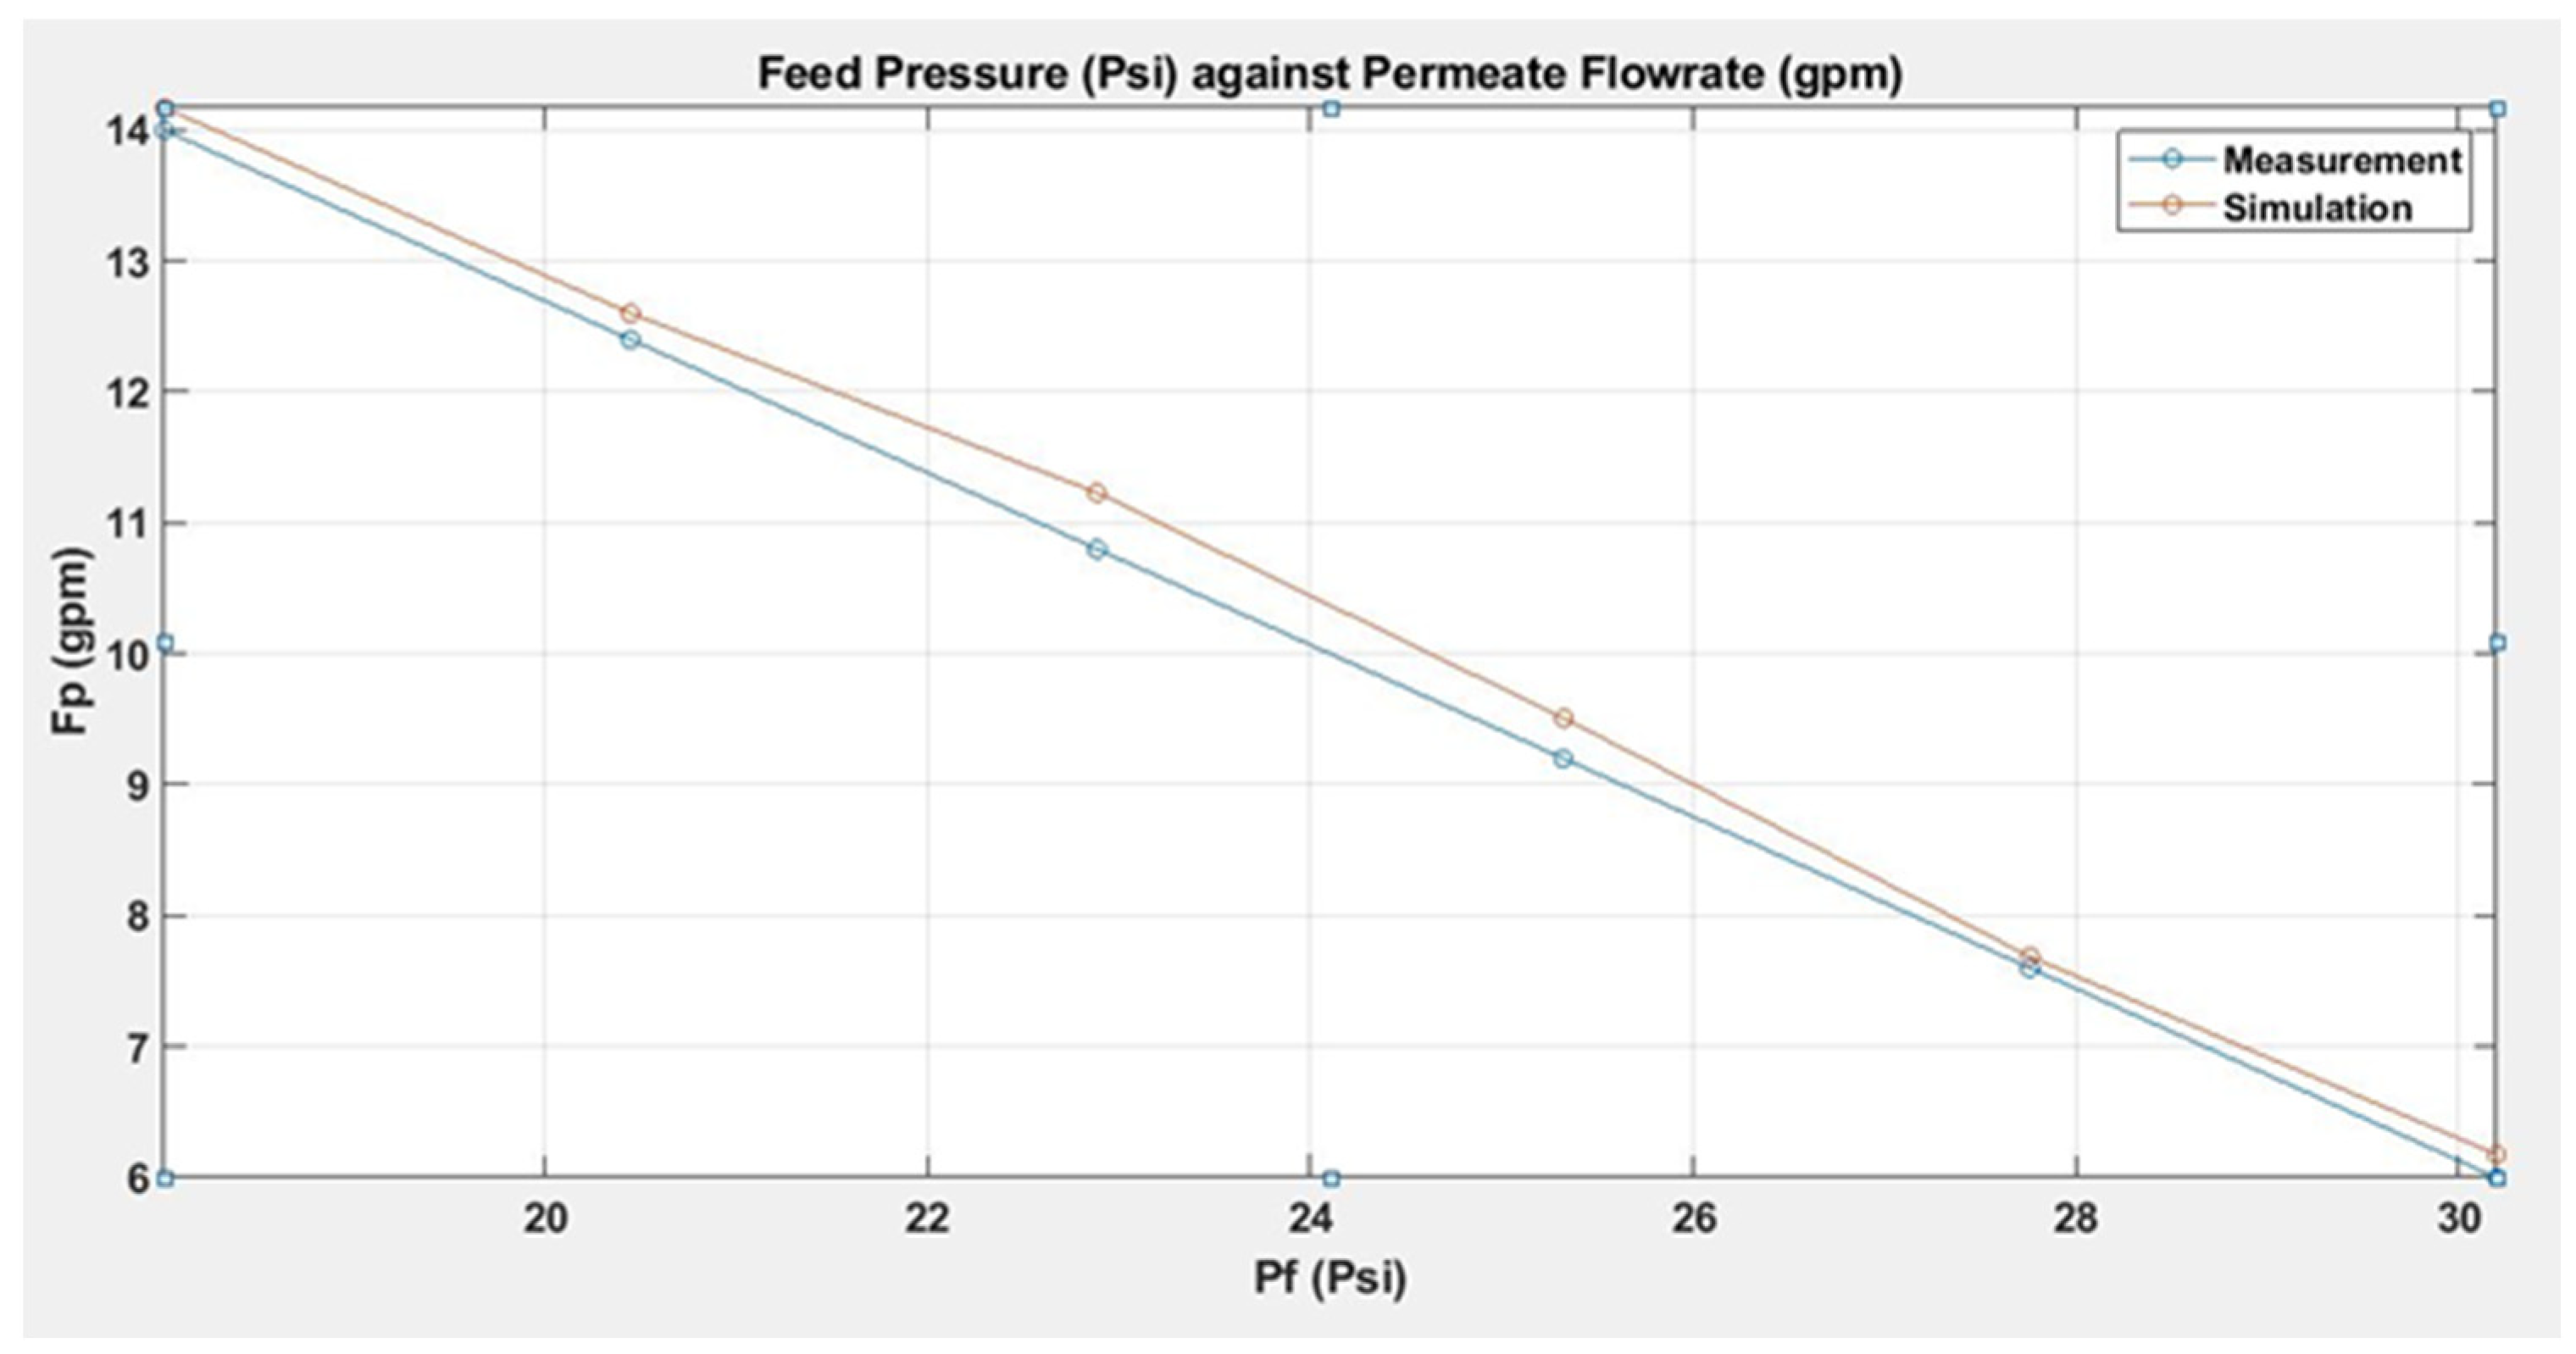
Figure 2) that calculates the pressure on feed stream to RO membrane for an efficient and long-lasting process of filtration are shown in
Figure 8. According to the graph, the volumetric flowrate at the permeate end of membrane (
Fp) drastically decreased with time, while the feed pressure (
Pf) somewhat increased. The continual slow passage of grains and molecules, which frequently clog TFC membrane surface pores, is the primary cause of this operational shift in flowrate over membrane permeation. A small performance degradation is observed as the TFC membrane element continues filtering out the brine particles. This operational parameter tendency at the RO section is consistent with the research performed on the post-treatment operations of water plants [
28].
The feed pressure (Pf) to the RO unit is initially 18.005 Psi; this pressure occurs when the highest flowrate (Fp) at membrane permeation is observed as 13.9998 gpm. In order to sustain the effective treatment operation of the RO unit, this feed pressure continues to rise in opposition to the declining volumetric flowrate through the membrane. As such, due to the extremely slow flowrate of 5.9997 gpm on permeation, the last value in the plot indicates the highest feed pressure of 30.191 Psi.
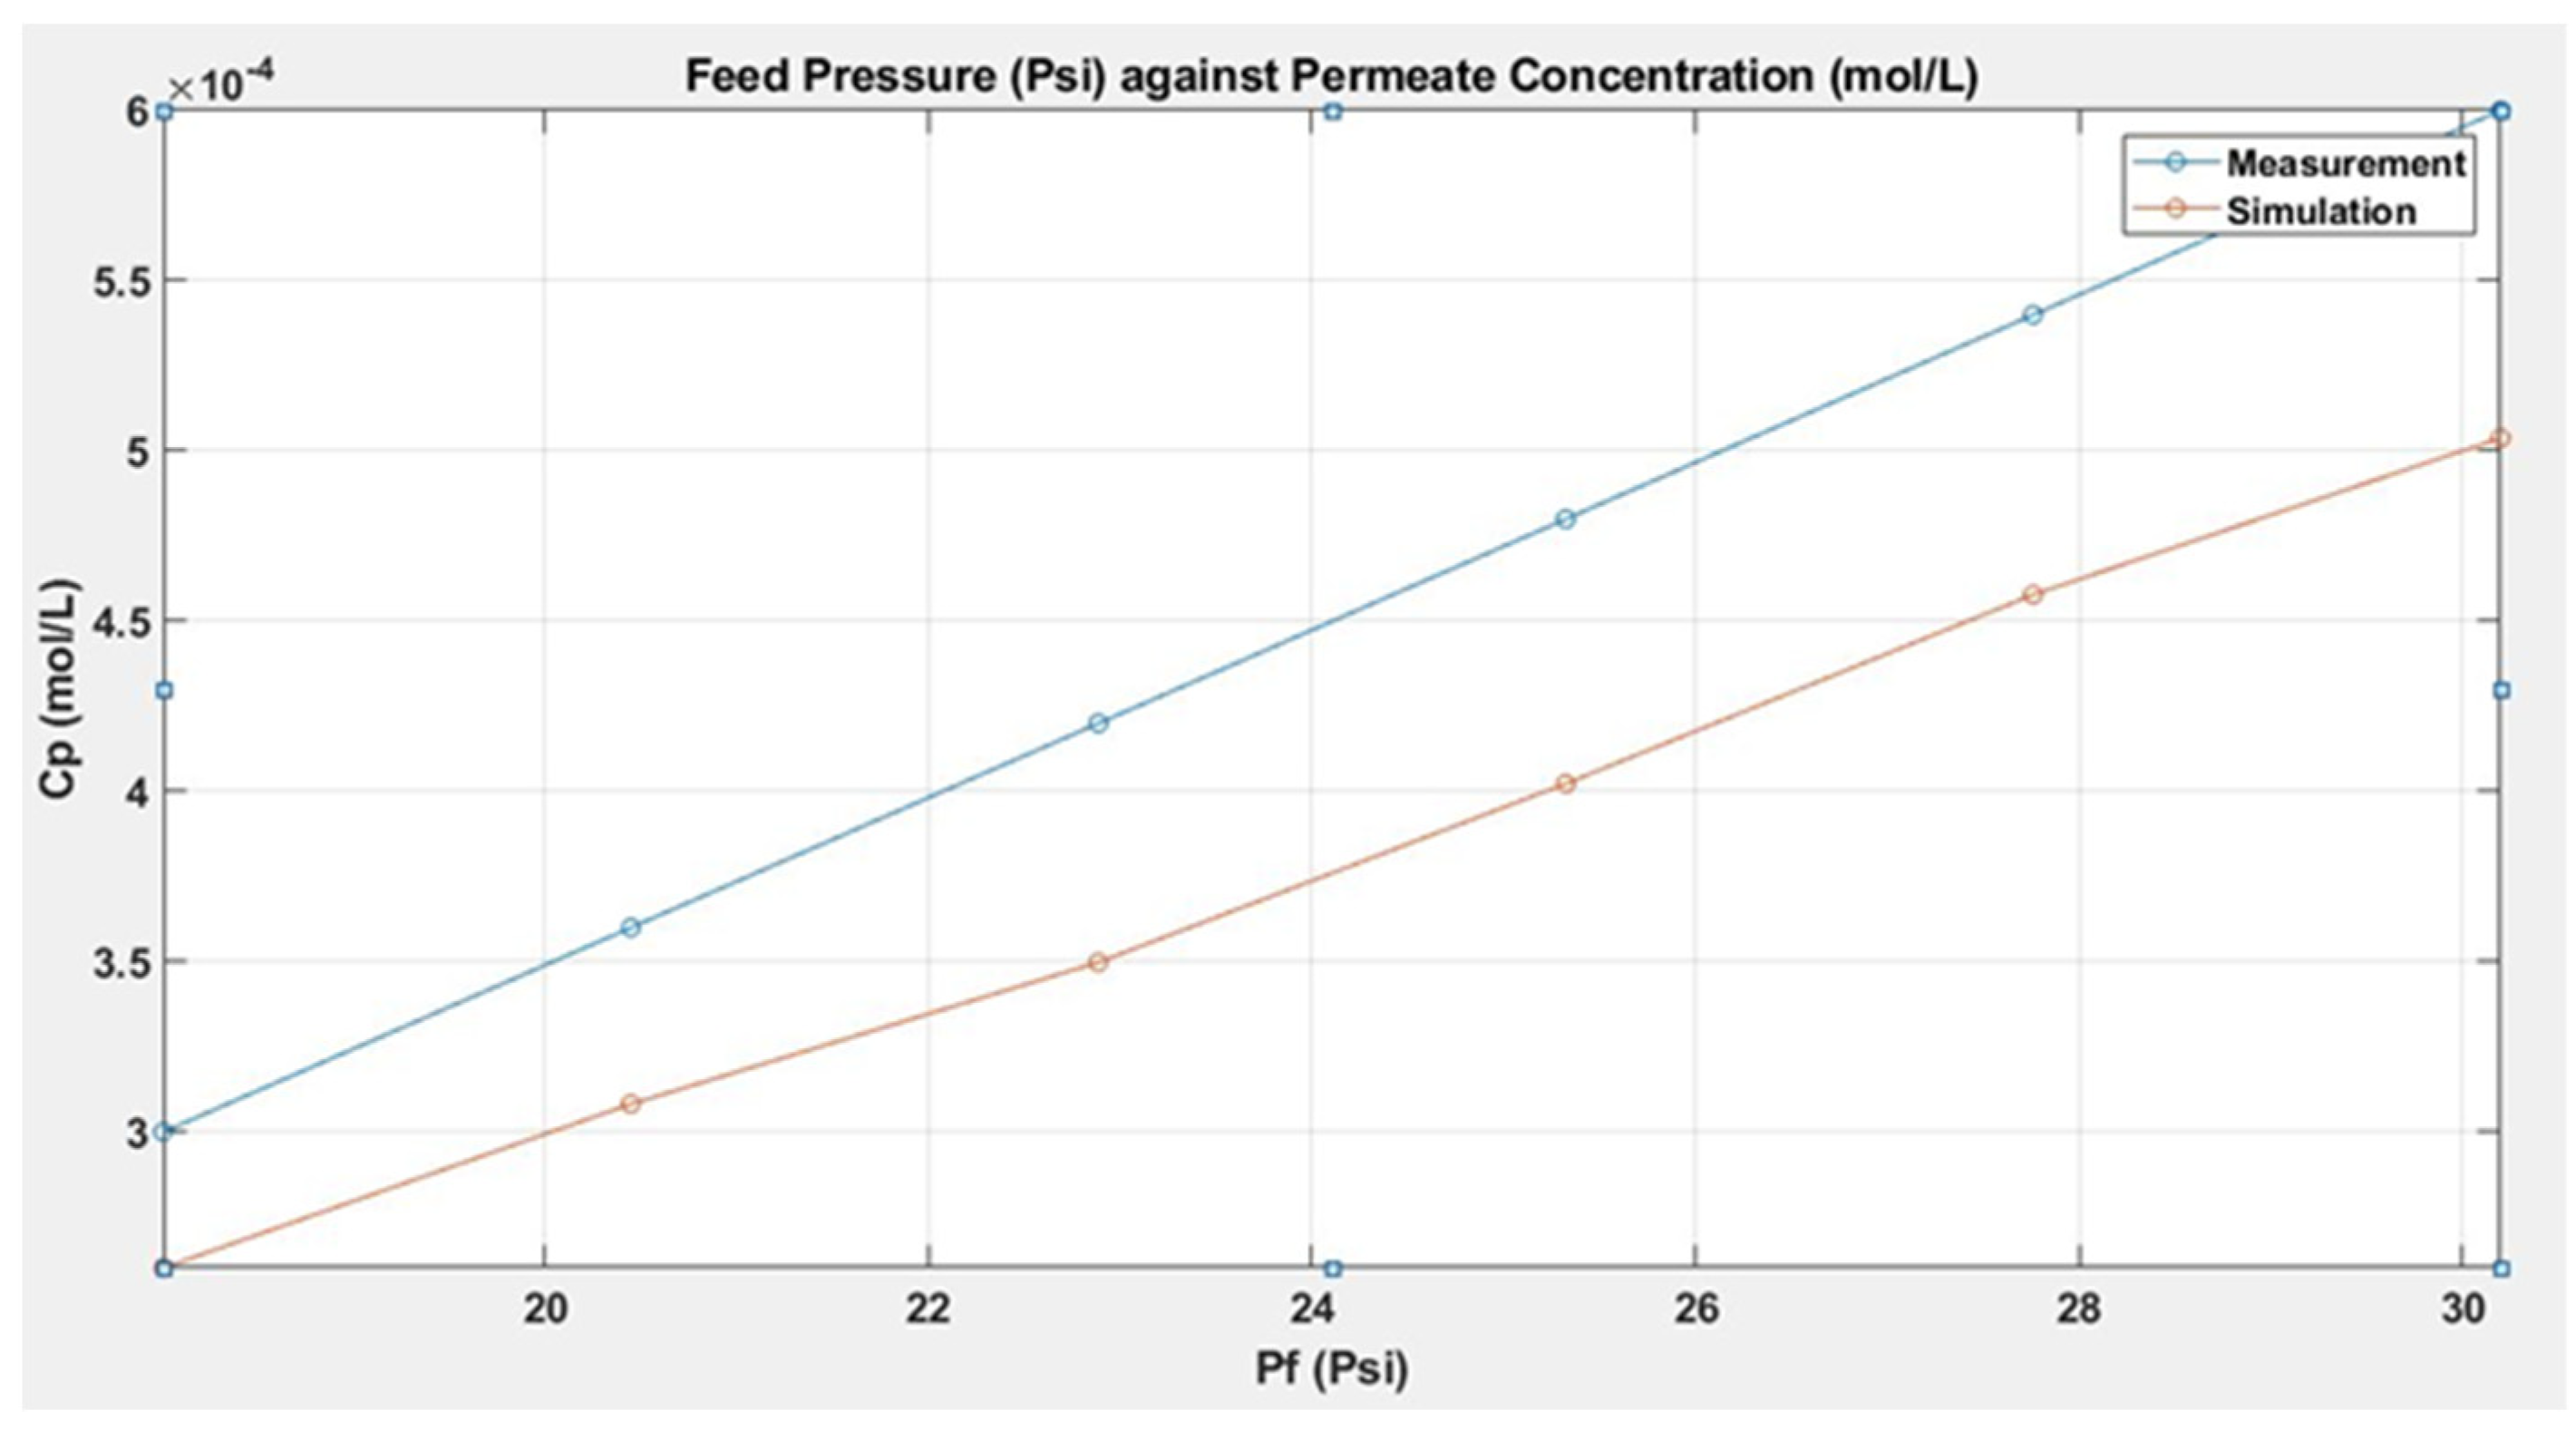
2.6. Simulation Results of TDS Sensor at RO Permeation
The results of the employed TDS sensor at the permeate end of the RO membrane for continuous monitoring of disseminated particles within the stream are shown in
Figure 9. According to the graph, a minor rise in feed pressure (
Pf) over time caused a progressive increase in the volume of solute concentration at permeation (
Cp). The practical reason for this result is that while rejected solutes continue to accumulate on the membrane’s surface, the concentration and pressure in the feed stream gradually increase and the flowrates over the membrane decrease. This process, known as “Concentration Polarization,” has a negative impact on the RO system’s overall operational efficiency [
29].
At the operational start, the pressure on the feed stream (
Pf) was measured as 18.005 Psi, while the concentration at permeation (
Cp) was minimal (3 × 10
−4 mol/L). However, with the rise in concentration polarization, the diffused brine across membrane surface reaches a slight increase in volume (
Cp = 6 × 10
−4 mol/L), and, thus, the pressure on the feed stream also increases (
Pf = 30.1910 Psi), significantly aiding the maintenance of the effective RO treatment operation. The results are consistent with investigations that used a high-pressure pump to control the membrane’s decreasing flowrates with increasing concentrations [
30].
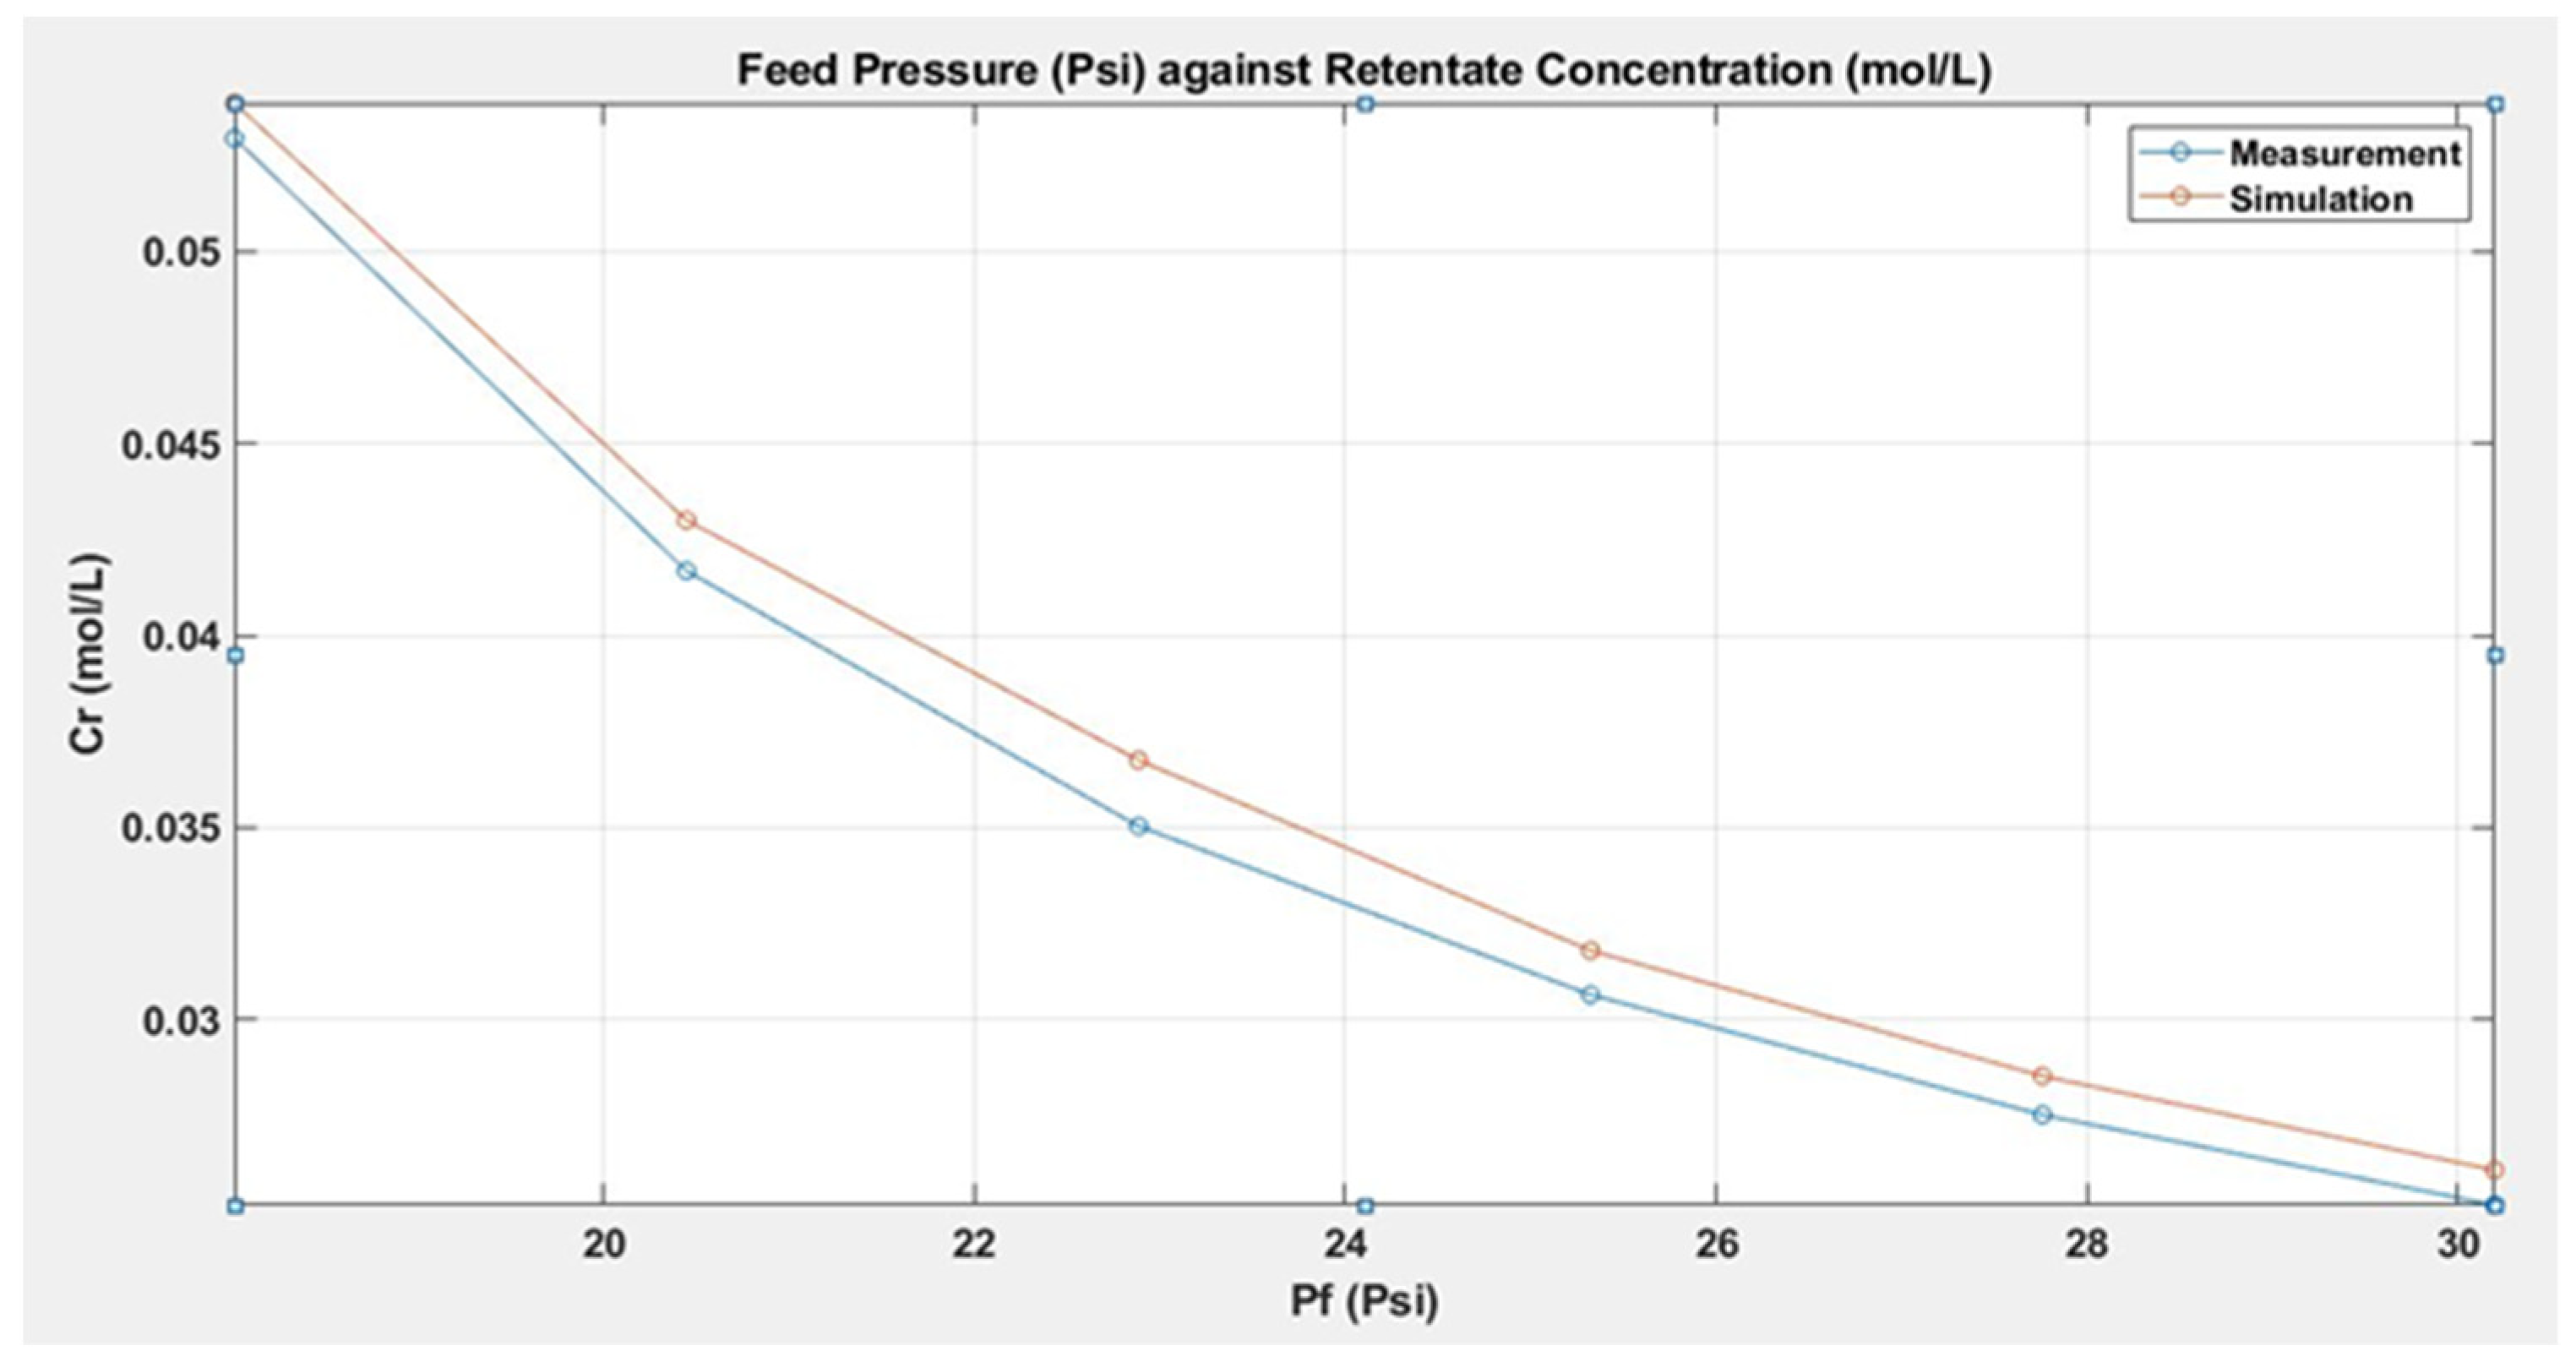
2.7. Simulation Results of TDS Sensor at RO Retention
Figure 10 shows the results of decreasing concentration of dissolved salts at RO retention in opposition to the rising feed pressure.
Figure 10 illustrates how the rise in feed pressure (
Pf) caused a progressive decrease in the level of brine concentration at retentate (
Cr). The brine content was maximum through the retentate cycle (
Cr = 0.05295 mol/L) at the initial feed pressure (
Pf = 18.005 Psi). However, concentration polarization developed as the process continued to treat raw water, which resulted in a gradual decrease in system efficiency. As can be seen, the initial high brine rejection through retention significantly decreased (
Cr = 0.02516 mol/L), creating high pressure in the feed stream (
Pf = 30.1910 Psi). This increased brine diffusion at permeation was the primary cause of slow flowrates through the RO membrane. It is clear from the results, which are consistent with the mole balance concept, that the overall applied pressure to the feed (
Pf) distributed impact on both sides of the impermeable membrane, leading to substantial variations in flowrates and concentrations throughout the treatment process [
31].
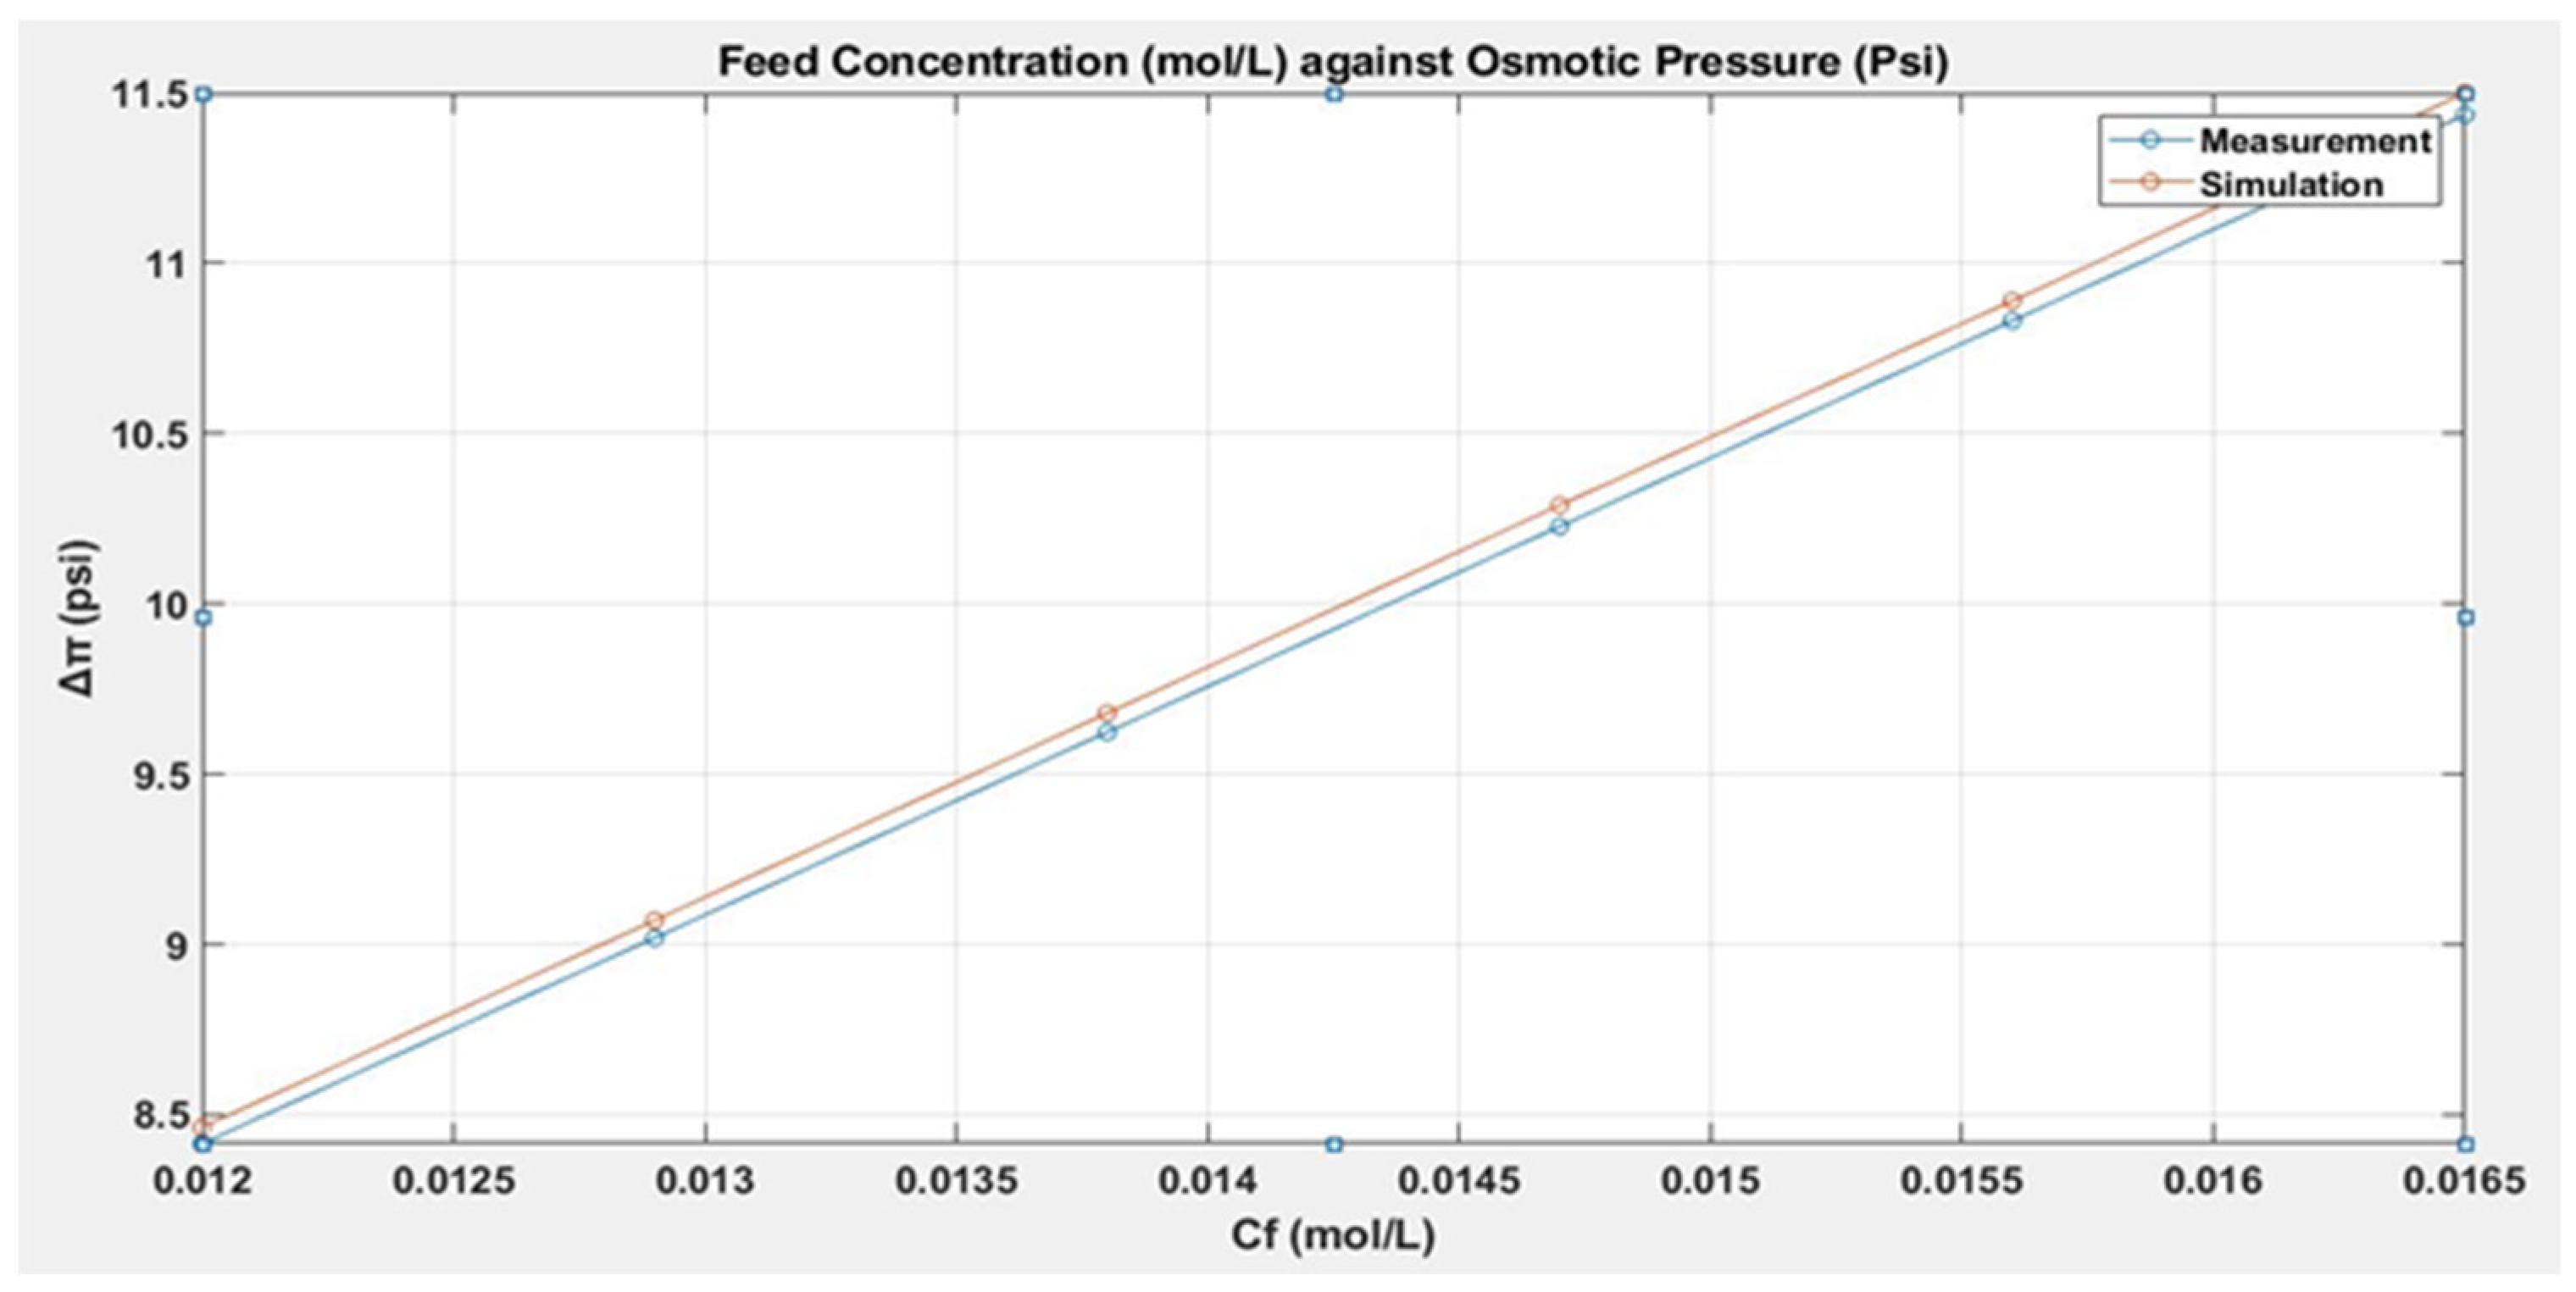
2.8. Simulation Results of Osmotic Pressure at RO Feed stream
The results of the simulation in
Figure 11 reveal the linear relationship among the osmotic pressure (Δ
π) and the concentration of solutes in stream (
Cf) that is fed to the RO unit. As such, Δ
π is the required pressure applied to limit the solvent transport over membrane element and reduce the rejection of dissolved salts. In the study, the required pressure is calculated with the help of Van’t Hoff model:
. The results of this test reveal that both parameters operate proportionally and develop gradually during the testing period. As can be seen from the graph, during the low solute concentration on feed side (
Cf = 0.0120 mol/L), the osmotic pressure is almost half the transmembrane pressure (Δ
π = 8.4151 Psi). Therefore, in order to prevent solvent from passing through the surface of the spiral wound semipermeable membrane, the osmotic pressure rises in tandem with the feed stream concentration. Similarly, an increase in osmotic pressure is observed (Δ
π = 11.4360 Psi) at maximum solute concentration (
Cf = 0.0165 mol/L). Thus, it can be inferred that a higher salt content streaming through the feed allows the osmotic pressure to climb to a level required for effective desalination and, thus, function as a flux inducer across the membrane. The results are consistent with research that shows that osmotic pressure rises as the molar concentration of solute particles increases [
32].
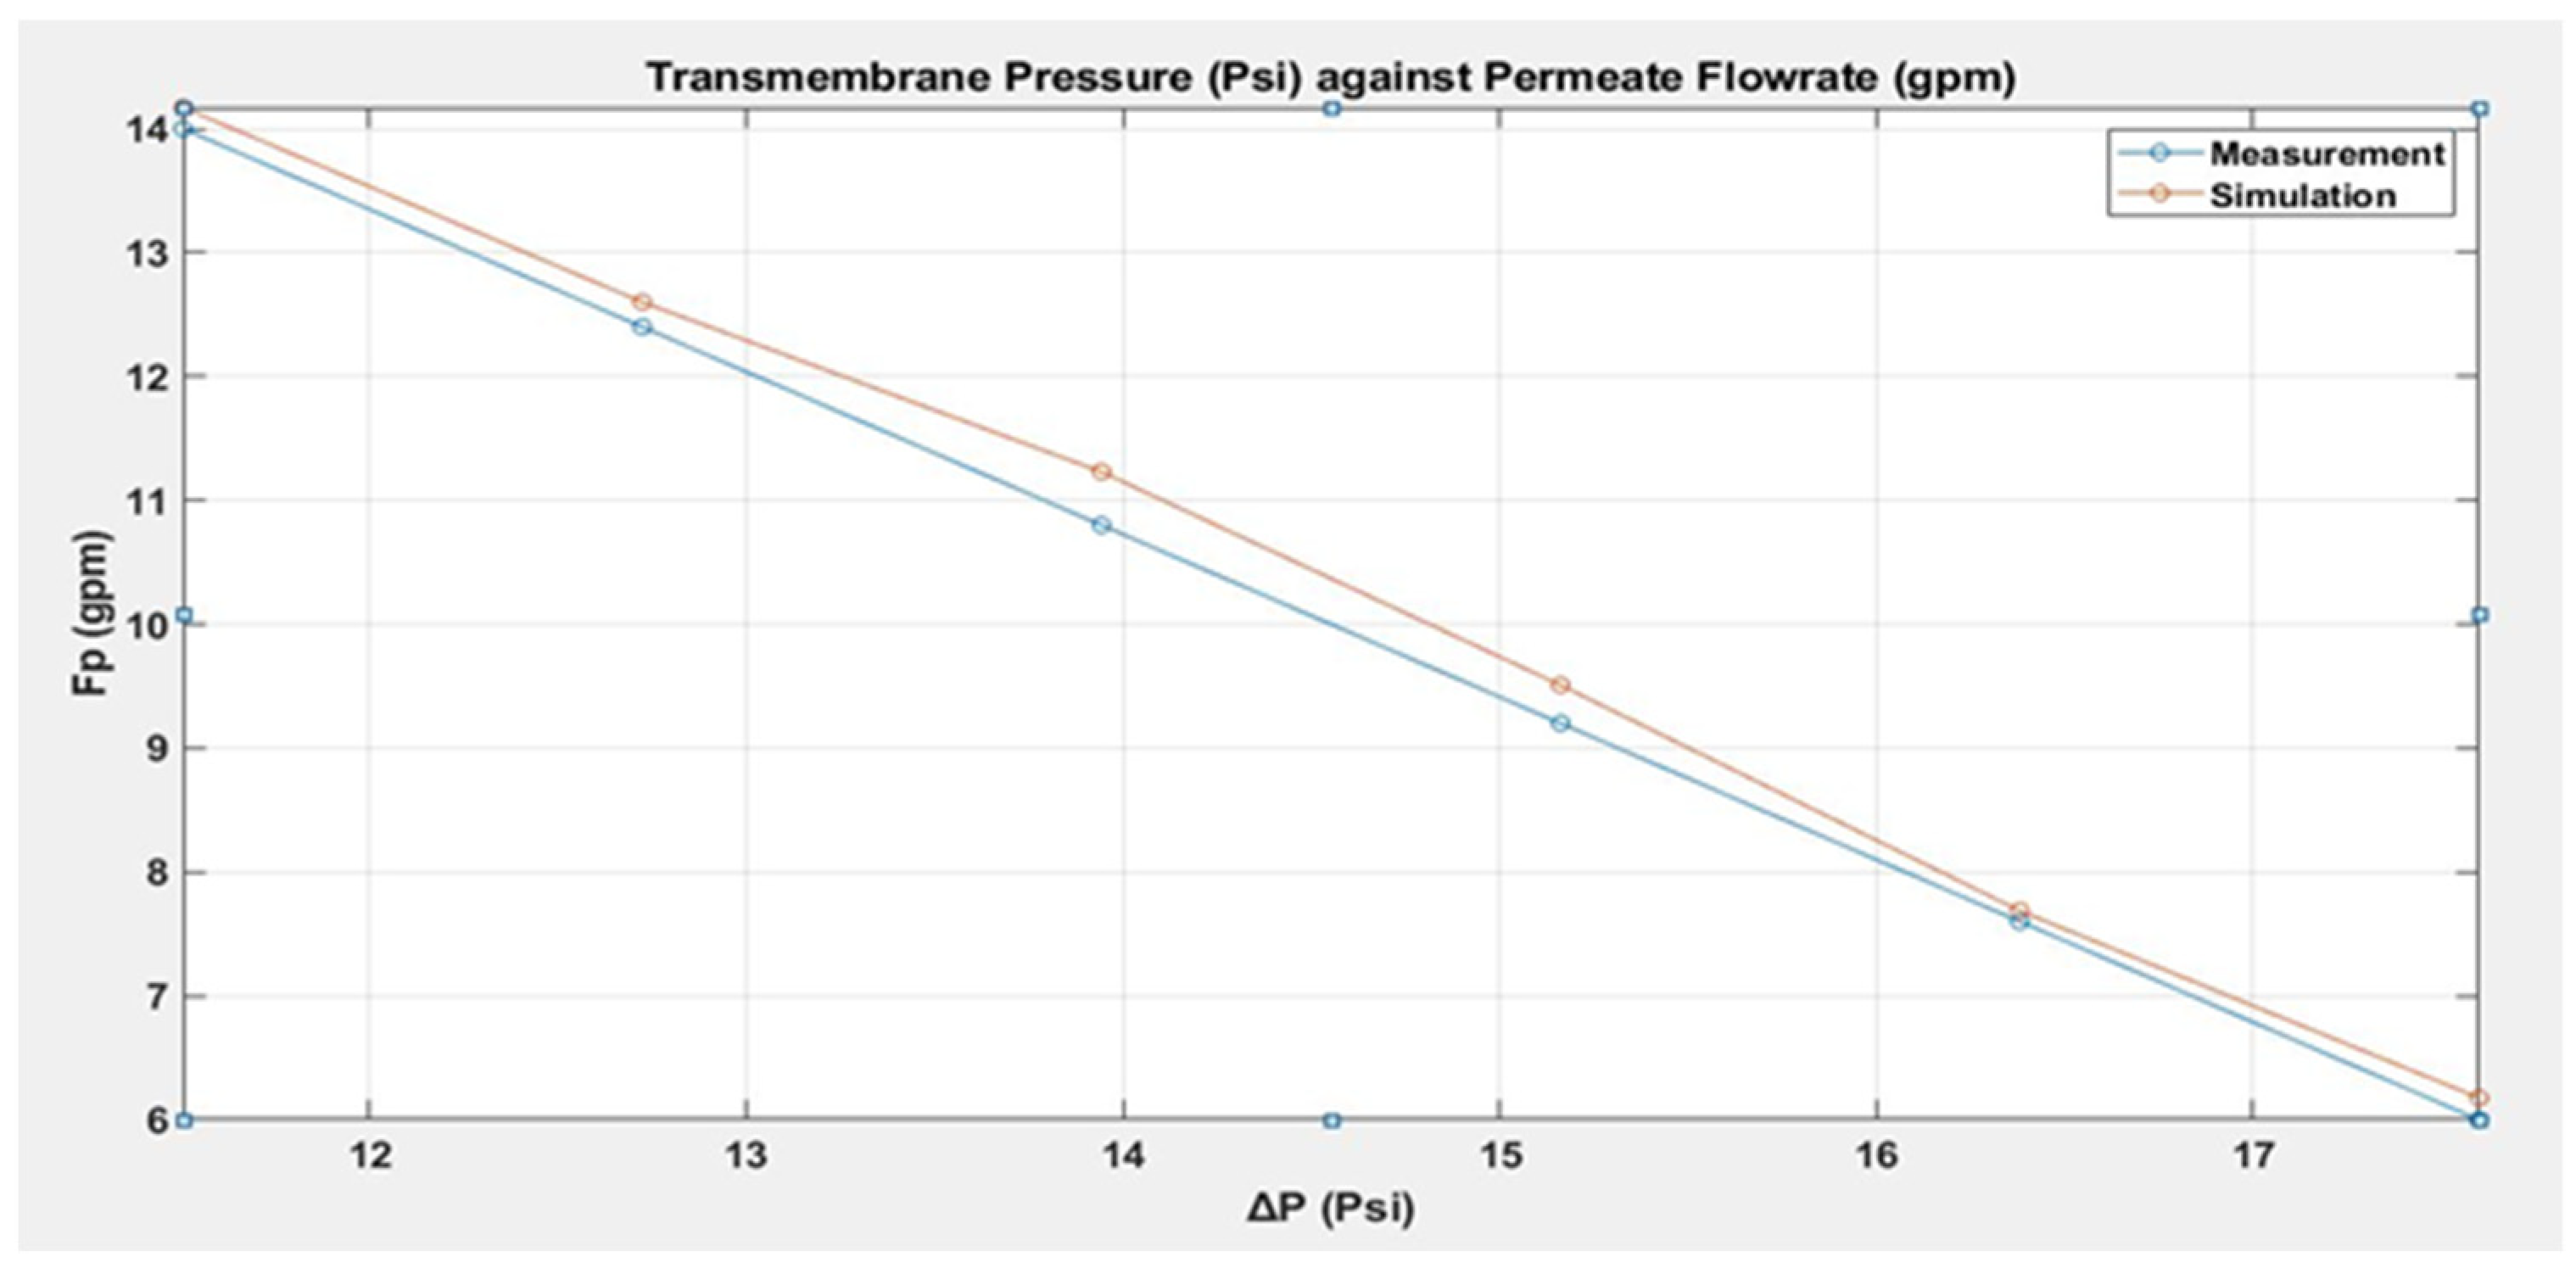
2.9. Simulation Results of Transmembrane Pressure (ΔP)
Figure 12 illustrates the drop-in flowrate at permeation (
Fp) while the transmembrane pressure (Δ
P) rises. Here, Δ
P is the change in pressure required to force the incoming flux through to membrane pores, which can be estimated via measuring the applied pressures on both sides of membrane and plugging them into the following formula:
. The obtained simulation results make it clear that both parameters in the system have an inverse correlation. Thus, the volumetric flowrate through the membrane decreased significantly as a result of a small rise in differential pressure. Here, it is vital to keep in mind that low transmembrane pressure indicates a clean and effective desalination process, whereas greater values signify degradation in membrane filtration. Correspondingly, minimum transmembrane pressure was recorded (Δ
P = 11.5056 Psi) at a much greater flowrate across permeation (
Fp = 13.9998 gpm); however, it increases to 17.6003 Psi with a significant drop in volumetric flowrate of 5.9997 gpm across permeation. These results are consistent with a study that exhibits an overall reduction in membrane permeability with a growth in transmembrane pressure [
33,
34].
3. ICT Implications and Future Work Suggestions
Rising global water scarcity has hit almost every sector in the water industry. Most prominently, the water-reliant process industry faced serious pressures in recent time to sustainably manage efficient and capable water treatment systems utilizing advanced ICTs in their plant facility operations. Through these systems, a company can realize potential cost savings and generate higher revenues through actively working on reducing wastewater and procuring energy consumption.
However, a water treatment plant with inefficient operating procedures related to having older pumping mechanisms and filtering equipment, combined with outdated water management practices, can be extremely costly, especially for a healthcare manufacturing firm as it requires consistent high-quality water for producing medicines and healthcare goods. Thus, ensuring the implementation of the most efficient equipment and technology for sustainable water plant operations is the scope of this study.
Therefore, based on the study simulation model developed as the abstraction and close imitation of a portion of the real pilot system, in which performance-deriving parameters were studied to analyze and understand the dynamic behavior of a water treatment plant in continuous operational environment, the following implications are proposed.
3.1. Deploy Advanced Metering Technology
It can be deduced from obtained results that the pilot plant operates mainly on conventional procedures and does not employ smart metering technology in their facility operations. Therefore, the case study company should consider implementing advanced ICT solutions in the form of “Advanced Metering Infrastructure” (AMI), such as “Automated Meter Reading” (AMR), which would serve as a major optimization in plant infrastructure and operational procedures.
Applications of smart aqueous sensors and meters, coupled with advanced metering and management technology, would befittingly enable automatic data gathering of plant consumptions at critical points, streamlining and improving the daily production efficiency via actively tracking and handling water usage and abnormal consumption patterns. Therefore, based on the accuracy of acquired data, equipment performance will be assessed and decisions can be taken in near-real time, leveraging a two-way communication network between smart sensory equipment and master base station without much human involvement.
3.2. Retrofit VFDs for Centrifugal Pumps
Simulation results reveal that the pilot plant employs large applications of centrifugal pumps at various feeding points to maintain maximum flowrates and system efficiency. It is true that centrifugal pumps are typically sized to operate at a fixed pace of full pressure in order to maintain flowrates and efficient operation. However, in practice, the pilot system demands peak flowrates only for a very short period of cycle, while, most of the time, the pumps operate on reduced efficiencies, coupled with associated flow control valves that determine flowrates and create variable pressures in the system, which, as a result, lead to extra water consumption and energy waste.
For this reason, plant managers should consider retrofitting their oversized on-off mode centrifugal pumps with variable frequency drives (VFDs) as a solution to procure and maintain the varying speed pump operation close to the pump’s maximum efficiency point, which can essentially reduce tight friction head in the system due to high measure of back pressure created using flow control valves, pipe elbows, and other resisting elements.
Therefore, deployment of VFDs not only significantly reduces the plant’s overall water and energy consumption, but the managers can also save on maintenance cost. For instance, a plant operating at controlled pressure would result in a longer pump seal lifecycle, less impeller wear, and a reduction in noisy system vibrations. To realize such potential gains of VFDs, various types of energy losses-procuring VFDs are available on the market. Thus, plant managers should carefully consider selecting the most efficient VFD that is appropriate to the required application.
3.3. Use Data Analytics with Essential Parameters
The present study closely evaluated the functional behavior of essential parameters involved in efficient plants operation. Although, in this study, operational data was transacted using real plant measurements and hands-on experience, computer-based simulation was used as an advanced ICT tool for process analysis and performance evaluation.
However, utilizing big data analytics with essential plant parameters leveraging smart sensors network would enable wider access to evaluate infrastructure performance and more accurate identification of system improvements needed with the current operational procedures. Thus, it is crucial for plant managers to ensure that the right operational parameters are being evaluated for improvement considerations. For instance, essential efficiency parameters are those that determine abnormal consumption patterns, such as leakages in pipe fittings, flowrates, and backwash rates tied to filters outlet; smart VFDs that transduce the right pressure, measurement of water quality, and procurement in reservoirs; and more similar sustainable and innovative controlled facility applications.
3.4. Implement Sanitize/Start/Stop Approach
The pilot manufacturer has a standby backup train plant in place, which enables continuous production operation without a delay or downtime in the case of maintenance or any service adjustment being made on the main water treatment plant. Typically, the backup plant is always kept running on standby mode for immediate need of operation, which requires continuous water recirculation in its pipes distribution network during periods of non-use to ensure that rust-free and high-quality water is being used in producing medicines. Therefore, conventional operating strategies consume excessive and unnecessary amounts of water and energy, prematurely wearing parts and components while operating in standby mode.
However, recent ICT advancements for pharmaceuticals water plants can hinder the use of continuous water recirculation in their distribution network. Likewise, a relatively new technology called S3 process, which was developed and patented by Siemens Water Technologies, provides the sanitize/start/stop approach that consumes considerably less water and energy and creates significantly less wastewater while delivering advanced microbial control.
Implementation of S3 approach will eliminate the need for continuous water recirculation through standby piping network, and allow the system to turn on only for a brief period to receive pre-determined short heat sanitization pulses during no operation. Thus, a typical S3 sanitization cycle of 30–45 min, together with chemical cleaning, provides a superior microbial control within piping network, while significantly decreasing the cost on energy, water, and system consumables.
The system can be configured with two different operating modes, as per the production demand, such as sanitization pulses generated at a pre-determined time of the day or after a certain period of system being dormant. This operational strategy will ensure a freshly sanitized water treatment plant is ready to perform quality operations. Eventually, through implementing the S3 technology, plant managers can drastically save on their annual water and energy capital while being environmentally responsible in meeting quality and production demands.
4. Conclusions
The current work presents a scientific contribution to the advancement of ICT sensing applications in the area of process engineering, utilizing mathematical modeling and simulation approach to validate the key performance parameters for efficient water treatment operations. For this reason, a computer-based simulation model was developed with the help of MATLAB-Simulink software, making use of measured operational data, mathematical modeling, and a plant schematic.
The study’s findings reveal that the performance and lifecycle of the reverse osmosis section are primarily determined through the structured pre-treatment procedures involving operational parameters such as volumetric-flowrate, solute-concentrations, and differential pressure across the membrane module. These key parameters are also found critical in increasing plant production rate and improving equipment efficiency. However, the developed model can be investigated further with more functional parameters and extended treatment methods to improve on equipment accuracy and plant performance.
Eventually, this study proposed fundamental cost-effective ICT improvements for the plant managers through which organization can substantially save on annual water and energy consumptions. As such, the step-by-step development of plant schematic, coupled with simulation modeling, provided a unique opportunity to identify operational inefficiencies and improvement opportunities in the pilot plant, such as a lack of actuating sensors at critical points, resulting in unaccounted daily consumptions, and operator involvement was proposed a replacement with adaptable AMR solution to enable automatic data gathering and handling of stream-flow.
Similarly, operation of large-size centrifugal pumps, coupled with flow-control valves at feeding points, was found to be inefficient and can be optimized with the application of smart VFDs to maintain the pump-speed close to the optimal efficiency point and reduce the friction head in the system created through back pressures of the actuating valves. Moreover, the standby train plant’s need for continuous water circulation and chemical sanitization to produce high-quality medicines was identified as an inefficient strategy by the pilot company, which can be improvised via implementing a sanitize/start/stop (S3) approach. This strategy would allow the backup plant to pre-set turning the system on/off, and receive periodic heat sanitization pulses within the piping network to control the microbial growth and reduce water–energy consumption while improving flux quality.


