Article

A Fuzzy-Logic Based Adaptive Data Rate Scheme for Energy-Efficient LoRaWAN Communication

by
Rachel Kufakunesu
1,*,
Gerhard Hancke
1,2 and
Adnan Abu-Mahfouz
1,3
1
Department of Electrical, Electronic and Computer Engineering, University of Pretoria, Pretoria 0002, South Africa
2
Department of Computer Science, City University of Hong Kong, Hong Kong 518057, China
3
Council for Scientific and Industrial Research, Pretoria 0184, South Africa
*
Author to whom correspondence should be addressed.
J. Sens. Actuator Netw. 2022, 11(4), 65; https://doi.org/10.3390/jsan11040065
Submission received: 14 September 2022 / Revised: 1 October 2022 / Accepted: 8 October 2022 / Published: 11 October 2022
(This article belongs to the Section Big Data, Computing and Artificial Intelligence)

Abstract

:
Long Range Wide Area Network (LoRaWAN) technology is rapidly expanding as a technology with long distance connectivity, low power consumption, low data rates and a large number of end devices (EDs) that connect to the Internet of Things (IoT) network. Due to the heterogeneity of several applications with varying Quality of Service (QoS) requirements, energy is expended as the EDs communicate with applications. The LoRaWAN Adaptive Data Rate (ADR) manages the resource allocation to optimize energy efficiency. The performance of the ADR algorithm gradually deteriorates in dense networks and efforts have been made in various studies to improve the algorithm’s performance. In this paper, we propose a fuzzy-logic based adaptive data rate (FL-ADR) scheme for energy efficient LoRaWAN communication. The scheme is implemented on the network server (NS), which receives sensor data from the EDs via the gateway (GW) node and computes network parameters (such as the spreading factor and transmission power) to optimize the energy consumption of the EDs in the network. The performance of the algorithm is evaluated in ns-3 using a multi-gateway LoRa network with EDs sending data packets at various intervals. Our simulation results are analyzed and compared to the traditional ADR and the ns-3 ADR. The proposed FL-ADR outperforms the traditional ADR algorithm and the ns-3 ADR minimizing the interference rate and energy consumption.

1. Introduction

LoRaWAN is a proprietary trademark synonymous with LoRa and a member of the Low Power Wide Area Networks (LPWANs) technology on the Internet of Things (IoTs). It connects numerous end devices (EDs) with low-cost, low-data-rate, long-range, and long-lasting batteries suitable for various IoT applications with varying QoS in various industries such as smart agriculture, smart metering, smart cities and smart healthcare [1,2,3,4]. Unlike NB-IoT [5] and Sigfox [6], which are proprietary, LoRaWAN operates in the industrial, scientific and medical (ISM) band. LoRa employs a physical (PHY) layer chirp spread spectrum (CSS) modulation technology which provides the highest receiver sensitivity while consuming the least power in comparison with other LPWAN technologies [7]. The CSS enables the demodulation of data packets with low signal-to-noise ratio (SNR) at lower data rates. EDs sense the environment and communicate with the network server (NS) via the gateway (GW). Depending on the distance from the gateway and the propagation conditions, transmission parameters are set, namely, spreading factor (SF), transmission power (TP), bandwidth (BW) and coding rate (CR). These transmission parameters have an impact on energy consumption. LoRaWAN employs the Adaptive Data Rate scheme, an essential element which regulates these transmission parameters, to optimize resource allocation. The key objective of the ADR scheme is network optimization for maximum capacity, ensuring that EDs always transmit with optimal transmission parameters. Since the lifespan of the ED’s battery is limited, charging or replacing batteries may be impossible in some harsh environments; thus, energy efficiency is considered to avoid network lifetime degradation in a LoRaWAN network. Numerous works on ADR either optimize the spreading factor to improve packet success ratio using a channel-adaptive SF recovery algorithm [8], packet reception probability (PRP) under average energy consumption constraint [9] using a distributed genetic algorithm, maximize the throughput of the EDs using the matching theory [10], or optimize the transmission power to maximize utility [11]. Other approaches use optimization of the ADR mechanism’s convergence time [12], which is hampered by a high spreading factor and does not correlate to efficient energy consumption.
In this paper, a fuzzy-logic based adaptive data rate algorithm is proposed to improve energy consumption in a LoRaWAN network. The proposed scheme makes use of the Mamdani fuzzy inference system (FIS) to create an inference system for selecting network parameters to achieve high network efficiency for various IoT scenarios using LoRa networks. The proposed scheme aids in the decision-making process by selecting optimal SF and TP parameters based on channel estimates derived from the signal-to-noise-ratio (SNR) of the four most recently received data packets, which reduces computational costs when compared to traditional ADR, which considers 20 data packets.
To the best of our knowledge, no research has considered improving ADR by optimizing the SF and TP using fuzzy logic. Adapting fuzzy logic to changing ADR requirements will improve energy efficiency. The main challenge is how to implement the FL-ADR algorithm to configure the transmission parameters to provide reliable communication while using as little energy as possible. Our proposed scheme makes use of the LoRaWAN module developed in [13], which is built under the ns-3 simulation module. The ns-3 is an open-source discrete event simulator written in C++ and Python that simulates simple and complex network systems. The LoRaWAN module complies with the class A LoRaWAN 1.0 specifications [14]. This paper makes the following contribution:
  • We improved Semtech’s traditional ADR to obtain S N R m a r g i n allocation by calculating the SNR average of four (4) packets rather than the traditional ADR’s twenty (20) packets, which reduce the computational cost of searching for the S N R m a r g i n in every frame transmitted.
  • We developed a fuzzy-logic based algorithm to calculate the optimal SF and TP values using the obtained S N R m a r g i n for the EDs to select an efficient data rate to be transmitted.
  • We evaluated the performance of the system through extensive simulations. We used six metrics to compare the results obtained with the traditional ADR and the ns-3 ADR scheme, namely, Total Energy Consumption (ET), Confirmed Packet Success Rate (CPSR), Uplink Packet Delivery Ratio (UL-PDR), Interference/Collision Rate I P R , Lost-Because-Busy Rate L P R ) and Energy Efficiency.
The remainder of the paper is organized as follows: Section 2 presents the related work; Section 3 provides a technological overview of the LoRaWAN ADR as well as the fuzzy logic system. Section 4 presents the proposed FL-ADR scheme while Section 5 describes the simulation of the proposed FL-ADR algorithm under ns-3 and Section 6 discusses and analyses the results. Section 7 concludes the paper.

2. Related Work

LoRaWAN networks have been implemented in numerous deployments and are rapidly growing due to the rising demand of smart applications in IoTs. The most ubiquitous challenges that exist regarding these deployments is energy efficiency. The early ADR algorithms [15,16,17,18] sought to solve the challenge of scalability, congestion, throughput and packet delivery ratio without focusing on the schemes’ impact on energy consumption. The authors in [19] propositioned two ADR methods of cumulative complexity: EXPLoRa-SF and EXPLoRa-AT to decrease collisions, enhance data extraction rate, and therefore improve network throughput. They, however, did not consider the effect of the algorithm on energy efficiency.
In Ref. [20], dynamic LoRa (DyLoRa) was proposed, a scheme that uses a symbol error rate model to determine an energy efficient SF and TP allocation. Optimizing convergence time of the ADR mechanism is used in [12], channel allocation conditions in [21], frequency estimation in [22] and link level performance in [11], to formulate the problems that the ADR algorithms attempt to address. In Ref. [23], the authors developed EARN, an enhanced greedy ADR mechanism with code rate modification to exploit adaptive S N R m a r g i n to mitigate the dynamic link changes. A spreading factor assignment strategy was introduced in [24] to evaluate capacity vs. coverage tradeoff in LoRaWAN. They define and compare the performance of nine assignment strategies using vector assignment. They provide evaluation results related to the proposed work.
The adaptation of fuzzy logic in IoT to improve the efficiency of smart applications has gained attention [25,26]. The fuzzy logic approach was used in [27] to predict efficient LoRa communication. They develop a fuzzy logic model to predict a high network efficiency under different environment scenarios. This work considers only spreading factors of 7 and 9. Our proposed work builds on this previous research in [18,27] to adapt fuzzy logic to the ADR scheme by optimizing SF and TP to provide an efficient energy usage that improves LoRaWAN communication. In contrast to the traditional ADR scheme, the ADR+ scheme developed in [18] outperforms the traditional ADR scheme with the use of the 20 measured packets’ average SNR instead of the traditional maximum SNR value. This resulted in improved energy efficiency. We propose a modification of the number of measured packets, the use of the packets’ average SNR, and the development of a fuzzy logic-based algorithm to optimise the spreading factor and transmission power. This results in a reduction in energy consumption, hence prolonging the battery lifetime of the EDs. The key research papers discussed in this section are summarized in Table 1. The table highlights the shared characteristics in the cited papers.

3. Technological Overview

Out of the OSI layer protocol, LoRaWAN utilizes three layers of the protocol stack, namely, PHY layer, MAC layer and Application layer. The PHY layer is represented by LoRa, a patented technology advanced by Semtech [28]. LoRa works in different frequency bandwidths depending on the regional parameters as prescribed in [29]. The characteristics of LoRa, for instance, topology, data transmission, error correction, modulation and data range, are described in [30]. The MAC layer is represented by LoRaWAN, an open-source protocol managed by the LoRa Alliance. It is the interface between LoRa and the gateway by providing channel access, ADR control and security services. LoRaWAN is derived from pure ALOHA medium access, meaning that EDs do not check for channel availability prior to transmitting data packets, opening up to the possibility of packet collision. The LoRaWAN standard defines three device classes that support bidirectional communication, trading off performance for power consumption.
Dependent on the application framework, LoRaWAN EDs could be modelled into three distinctive classes: Class A EDs are required to avail one or two receive windows after every UL transmission to permit the NS to distribute a prospective data packet to the ED. When an ED receives a DL transmitted in the initial window, it is exempted from unlocking the second window; otherwise, it should unlock the second window. Class B EDs are an extension of Class A behaviour with the addition of slotted receive windows for DL transmissions. Synchronization of the receive window is done by means of a beacon packet transmission using the GWs. Class C EDs are also an extension of Class A behaviour by maintaining the receive window open at all times except during UL transmission. This provides Class C EDs with low latency DL transmission, which entails greater energy utilization. This study only considers Class A EDs because ns-3 currently only implements Class A devices and Class A behaviour results in the least energy utilization.

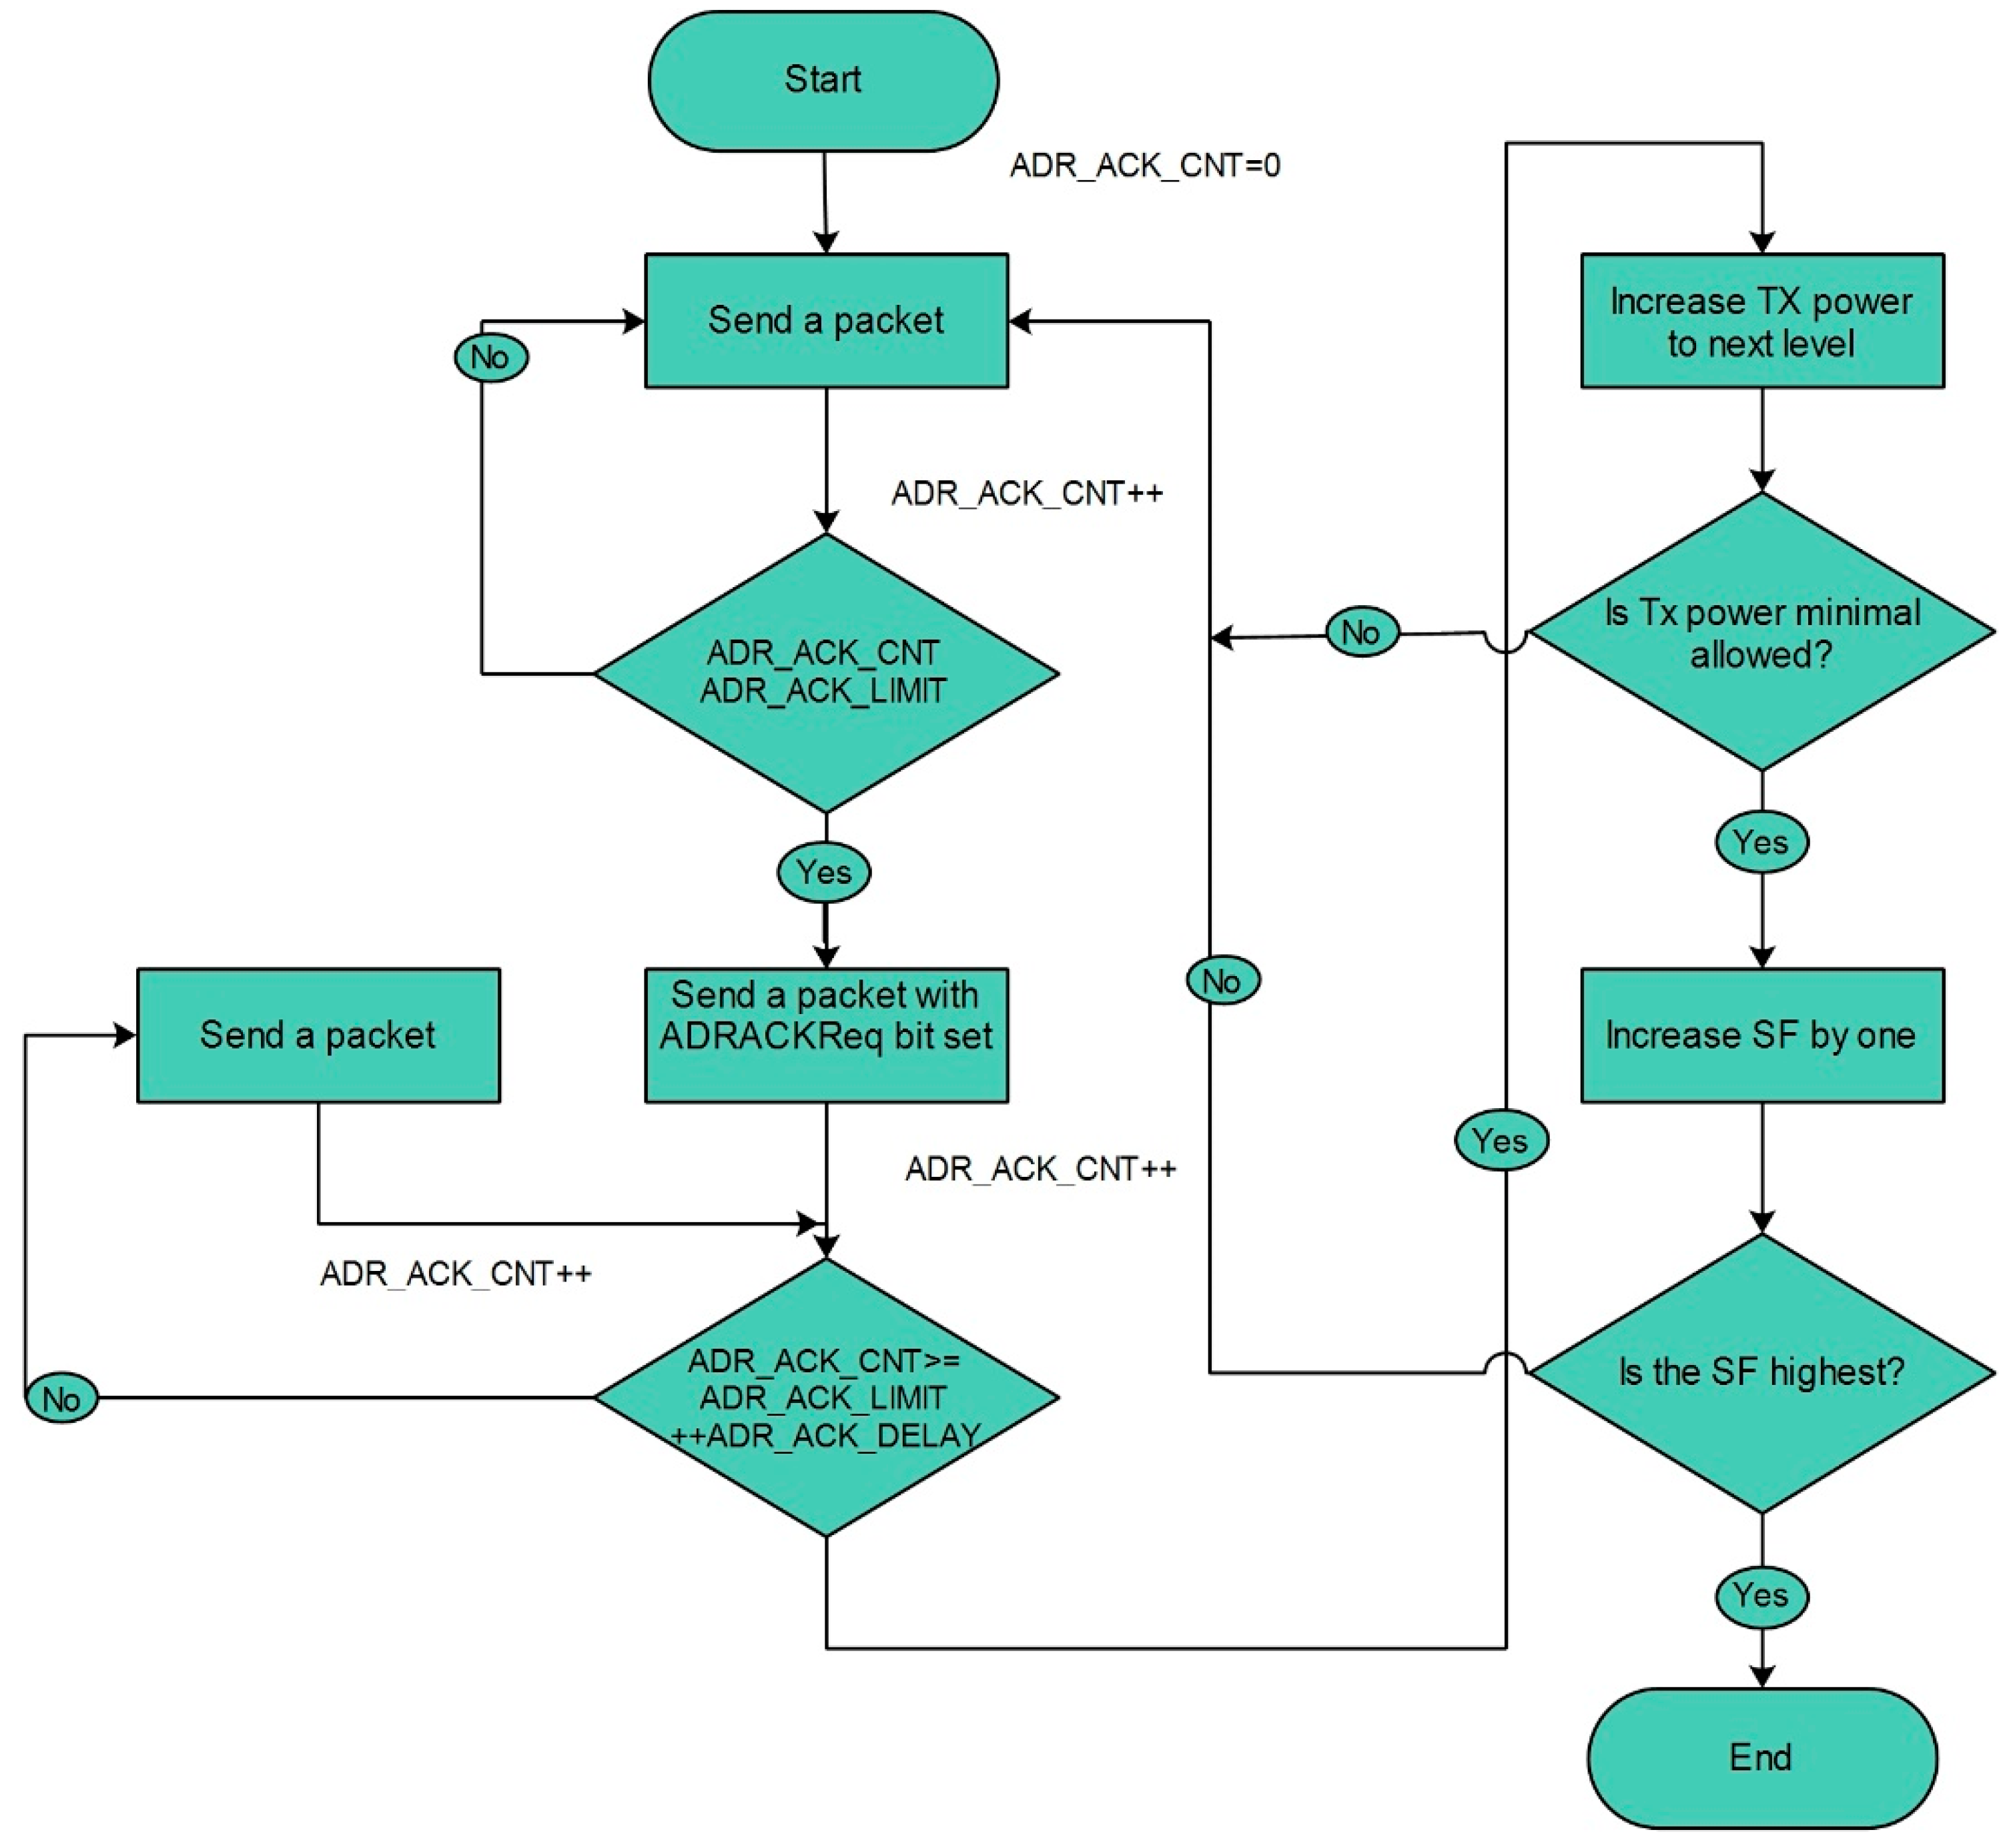
3.1. LoRaWAN Adaptive Data Rate

The standard LoRaWAN ADR (which we will call Semtech-ADR to distinguish it from other ADR schemes used in this work) algorithm dynamically modifies the transmission parameters in order to extend the battery life and maximize throughput. The data rates and transmission power for every ED in the LoRaWAN network are adjusted to achieve this. The ADR algorithm is applicable on the ED side and the NS side. Data rate selection is determined the transmission parameters and past performance of each ED. Battery lifetime is extended, and the global network capacity is increased by optimizing data rates, time on air (ToA), and energy depletion, thereby enhancing the lifecycle of the end devices. Following the LoRaWAN Regional Parameters and Specifications [29,30], EDs are required to accommodate specified data rates, further complicating the power constraint problem since SNR figures must range across specific thresholds and power levels. Given that the EDs should respond to the network’s channel conditions, it is necessary that they have the capability to adjust the data rates and TP appropriately. A review of the LoRaWAN ADR framework is provided in [31].
To obtain optimal data rates, EDs must follow specific procedures [30]. Firstly, the end node selects the ADR bit in a UL message header requesting that the NS manage data rate adaptation. Subsequently, the NS sends LinkADRReq MAC instruction to the ED, which specifies the modification of its SF and TP, which results in a change in data rate. The ED uses the LinkADRAns MAC command settings to confirm the required settings to the NS. If the ED is unable to receive a DL message within the ADR_ACK_LIMIT while the current data rate is greater than the nominal data rate, all subsequent uplinks will be transmitted with the ADRACKReq bit set. If the ED is unable to receive a DL message within the ADR_ACK_DELAY from the NS, in the subsequent uplinks, the ED attempts to re-establish communication by changing to the next lower data rate which delivers an extended communication range. As a result, the ED reduces the data rate by a step each instance that the ADR_ACK_DELAY is attained. When the ED receives a DL message from the NS, it uses its internal counter ADR_ACK_CNT which is reset. Figure 1 details the ADR system flow effected at the ED.
On the network server side, the NS monitors the uplink quality and commands the EDs to adjust the SF and TP. The UL quality of each packet transmitted by the ED is recorded in the network server’s history and compared to the minimum required SNR threshold. If the SNR of recent packets is found to be better, the NS commands the EDs to reduce SF and TP and vice versa. The main difference between the Semtech-ADR model and the ns-3-ADR implementation is that ns-3 does not use the 10 dB deviceMargin in its implementation. Another differentiating factor is that TP is adjusted in steps of 2 instead of 3 as implemented in the Semtech-ADR. The LoRaWAN network does not operate in stable network conditions due to varying weather conditions, radio interference, moving obstacles, and so on. These factors result in a constant change in received signal strength indicator. It is imperative that there is no overestimation of the link. We therefore cannot have a crisp value for the target S N R m a r g i n , necessitating the use of fuzzy logic to optimize transmission parameter resource management. The S N R m a r g i n is used to estimate how much we can adjust the data rate by optimizing SF and TP, which will result in minimized energy consumption.

3.2. Fuzzy Logic System

We can define fuzzy logic systems (FLS) as universal approximators of nonlinear systems that perform the nonlinear mapping of an input data set to a scalar output data [33,34]. We use FLS for decision-making based on “uncertain, imprecise environments” [35]. Fuzzy Logic Control based systems do not process assumptions on the basis of the probability distribution framework. Because they can estimate any real continuous function to a compact set, FLS is specifically applicable to dynamic systems and can approximate these dynamic systems to any level of precision. A FLS consists of four core elements: the fuzzifier, the rules, the inference engine, and the defuzzifier [36]. The fuzzification state transforms the crisp values of the system inputs into fuzzy values. This stage consists of computing the fuzzy values of the linguistic variables given their respective system inputs. The appropriate fuzzy rules are activated by utilizing the fuzzy input values in the inference step, which then produce the commensurate fuzzy output values. In the final stage, the fuzzy output values are converted into crisp values at the defuzzification stage.
The fuzzy controller derives its output from the fuzzification of both inputs and outputs with the use of associated membership functions. Based on the value of the crisp input, the fuzzy controller will convert it to a range of inputs (members) of the associated membership functions. A membership function is a curve that expresses how every element in the input range maps to a degree of membership ranging from 0 and 1. The general types of membership functions are triangular, trapezoidal and Gaussian. The fuzzy inference process uses three methods that are proposed in literature, namely Mamdani, Sugeno and Tsukamoto. The fuzzy logic algorithm is a problem-solving algorithm that uses the basic IF-THEN rule structure.

4. The Proposed Algorithm

We propose the use of fuzzy logic for our ADR algorithm to predict the values of SF and TP on the NS side of the network. The algorithm generates new transmission parameters (SF and TP) according to channel approximations derived from the SNR of the four most recently received data packets (ReceivedPacketList). This reduces computational costs compared to the traditional ADR, which uses 20 data packets to estimate the link quality. For the implementation of the proposed FL-ADR Algorithm, we applied average S N R m a r g i n as the input variable consisting of three membership functions with linguistic variables LOW, IDEAL and HIGH. Triangular membership functions were used in this algorithm. The pattern is determined by the “historyRange” from the ReceivedPacketList. Furthermore, we used two output variables TP-New and SF-New, both consisting of three membership functions with linguistic variables LOW, MEDIUM and HIGH. The S N R m a r g i n is implemented to modify appropriate SF and TP parameters. The single input multiple output Mamdani fuzzy control system [37] is employed to control the output for optimum adjustment of the SF and TP using Fuzzylite libraries [38]. We designed our membership functions using some of the standards used in [39] using the triangle membership function.

4.1. The System Model

To achieve energy efficiency in the network, LoRaWAN must satisfy the SNR, data rate and power requirements. In our network, we optimize SF and TP at the ED in order to minimize energy utilization. We consider a LoRa network that uses modulation with a fixed BW of 125 kHz and a fixed payload. The simulation tool mimics the SX1301 digital baseband chip used for GW capabilities and SX1272 for the ED transceiver [40,41]. The EDs and GWs are static, randomly distributed and their number does not change in the network. Ten simulations were run with different seeds of random number generator in order to get the statistical confidence of the performance metrics. The network has enabled confirmed traffic. GWs are placed in a hexagonal grid layout where a GW is placed at the center of each hexagon. We assume that a single GW has the default three receivers working in parallel. When a data packet is transmitted through a specific LoRa channel and receive paths listening at that channel are unavailable, the data packet is lost. The path loss model between the EDs and the GWs is based on the Log Distance Propagation Model [42]. The effects of signal propagation on signal strength are estimated by a link measurement model at the GW and takes into consideration factors like TP and antenna gains both at the transmitter and receiver. The received signal power at the GW is given by (1):
P r x = P t x G a L p
where P t x is the transmit power at the i t h ED,
G a is the antenna gain,
L p is the path loss.
We express the power in dB as shown in (2):
P r x dB = P t x dB + G a   ( dB )   L p dB .
The path loss propagation is given by (3):
  L p = 10 l o g 10 d i α f c 2 10 2.8 ,
where d i   is the distance between the i t h ED and the gateway,
α is the pathloss exponent (3.76), and
f c is the carrier frequency (868.1 MHz).
We assume a simple energy consumption model comprising of four states, namely, transmit, idle, receive and sleep. The energy model links each of the aforementioned states with a different voltage and current utilization as shown in Table 1. We monitor the energy usage of each node throughout the simulation period in order to determine the energy consumption of the network. The model calculates the device energy consumption and estimates the ED’s battery life. The total energy consumption for each ED is given by (4):
E E D = E t x + E r x + E i + E s ,
where E t x is the energy consumed when the ED is transmitting a packet,
E r x is the energy consumed when the ED is receiving an incoming packet,
E i is the energy consumed when listening for incoming packets,
E s is the energy consumed when the ED is sleep mode.
In our model, we optimize the SF and TP by minimizing the SNR requirements of the link. The LoRaWAN specification stipulates the required SNR thresholds that enable signals to be demodulated at the GW according to the current data rate the ED is implementing. LoRa can demodulate signals that are −7.5 dB to −20 dB below the noise floor [30]. We set the range of S N R m a r g i n from −25 to 25 [43]. Fuzzy logic is introduced on the NS side to determine how SF and TP can be optimally allocated. The FL-ADR algorithm determines the average SNR over four most recent transmissions, determines the minimum required SNR using the current parameters and then calculates the margin. Using this margin, we implement the fuzzy logic to optimize SF and TP. Furthermore, we set the fuzzy rules and use the Mamdani FLS to complete the operation. S N R m a r g i n is calculated as follows:
S N R m a r g i n = S N R a v g S N R r e q u i r e d D m a r g i n
where S N R a v g is the average SNR of the packets in the ReceivedPacketList,
S N R r e q u i r e d is the minimum SNR threshold,
D m a r g i n is the device margin.
When the S N R m a r g i n is high, the data rate can be increased, which implies reducing the SF and TP values. When the S N R m a r g i n value is low, it implies that the current data rate the ED is using is high and must be reduced by increasing the SF and TP. On the NS side, our proposed FL-ADR algorithm allocates the lowest possible SF above the GW sensitivity and the corresponding TP to the ED. The solution for the optimal transmission parameters for the EDs is obtained using the following procedure:
  • the linguistic variable and terms are defined;
  • the membership functions are constructed;
  • the fuzzy values are created from the crisp input data;
  • the rule base evaluates the rules;
  • each rule’s outcomes are aggregated, and the non-fuzzy values are generated from the output data.

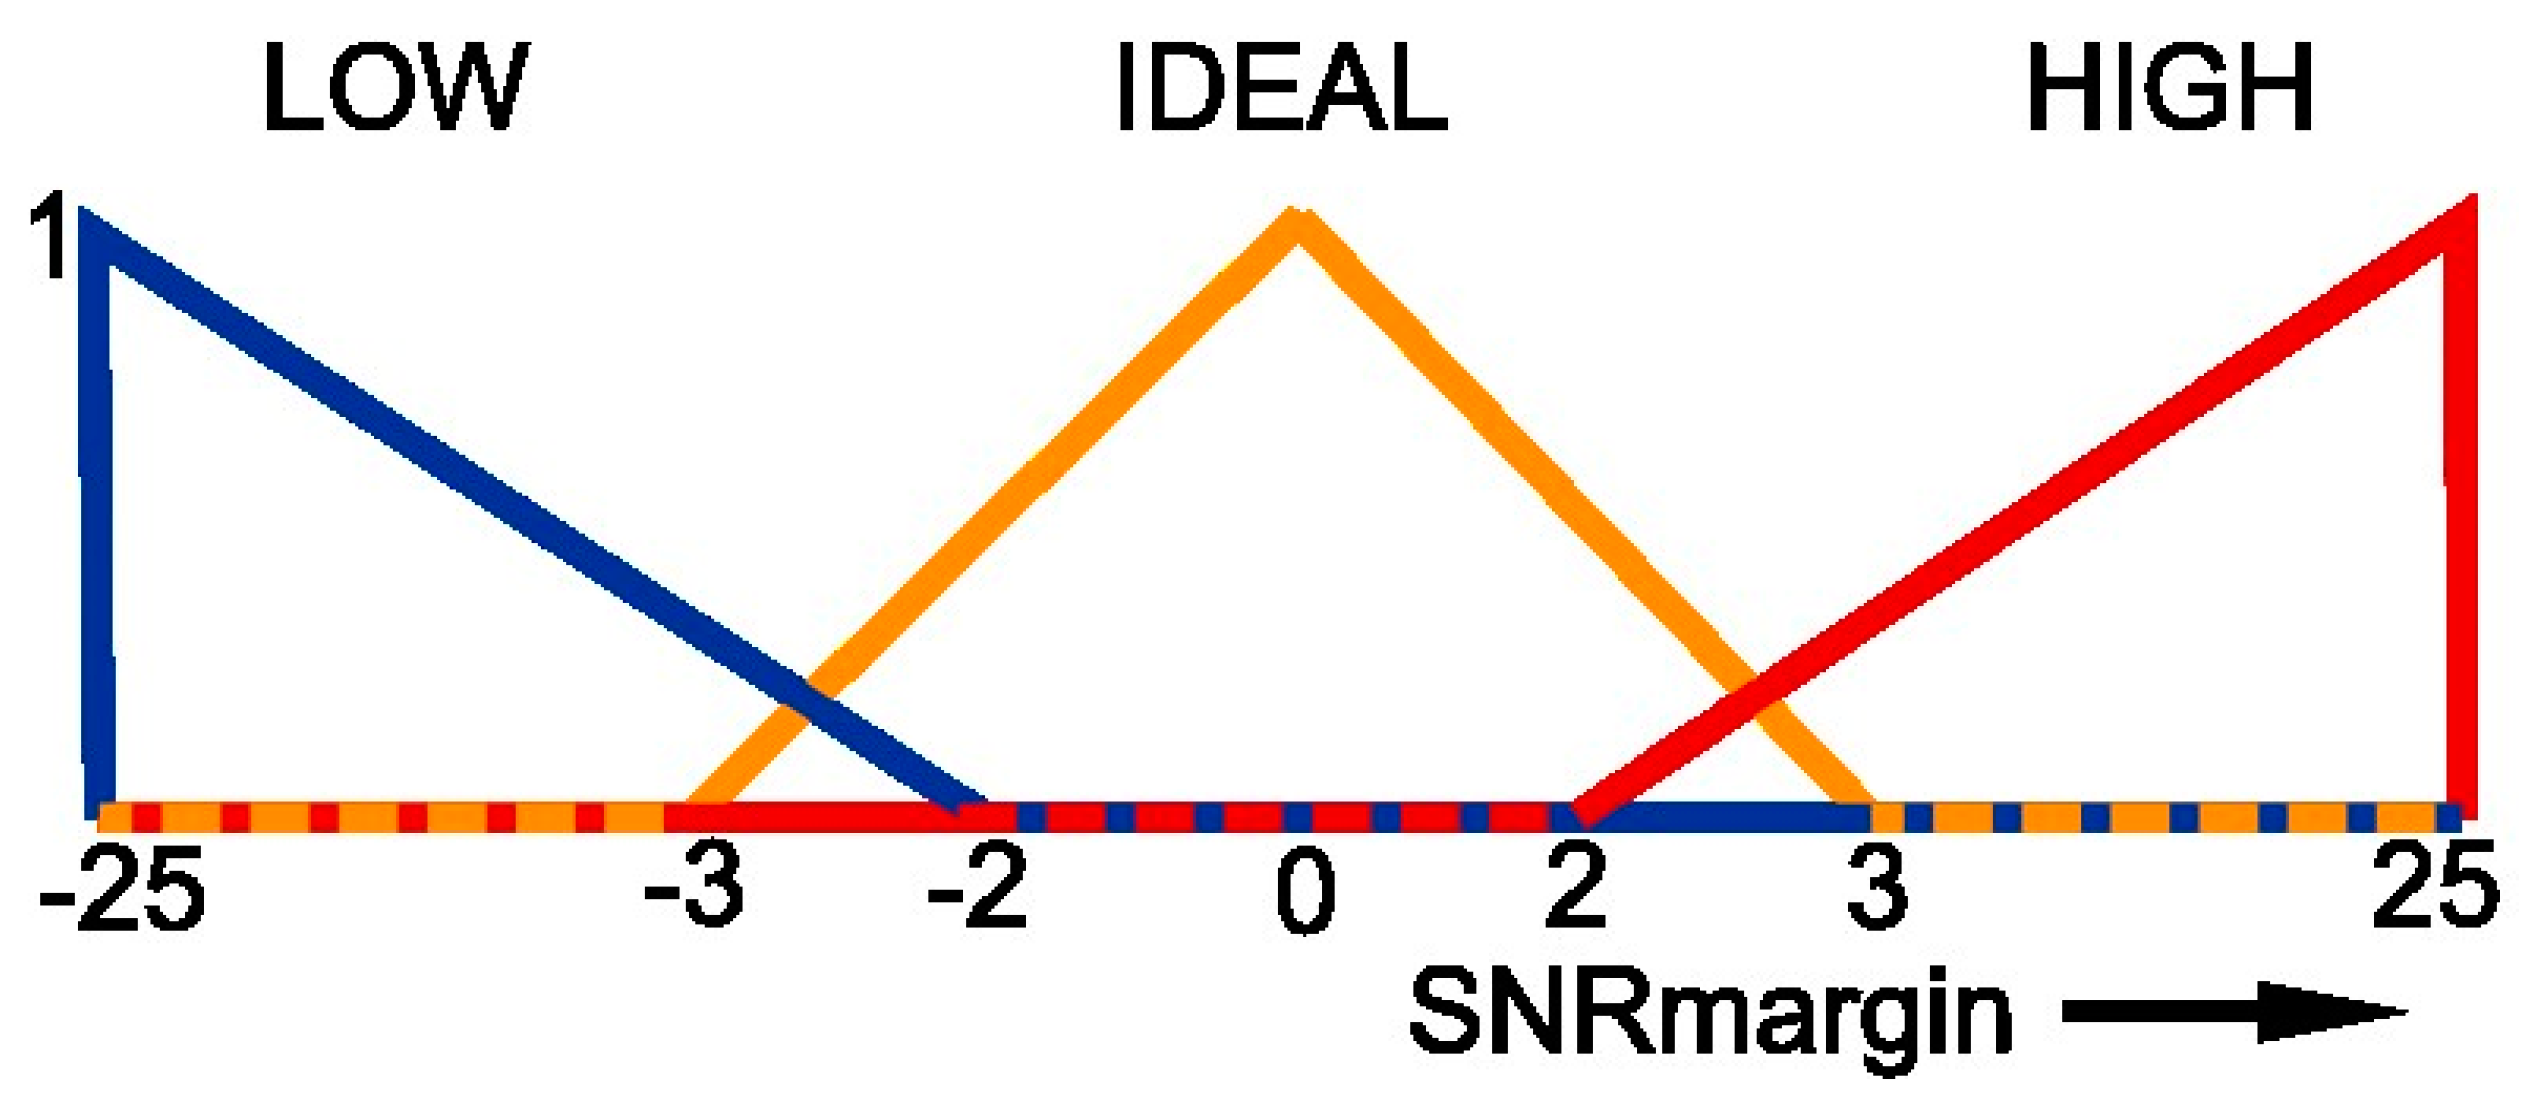
4.2. The Input Variable— S N R m a r g i n

The linguistic variable S N R m a r g i n is decomposed into a set of linguistic terms:
S N R m a r g i n = { LOW ,   IDEAL ,   HIGH } .
The crisp input values are mapped to fuzzy linguistic terms by the membership functions and are defined by (6)–(8) below. Figure 2 shows the membership function of the input variable S N R m a r g i n .
The following are the three triangular membership functions used to represent the range of input variable S N R m a r g i n :
μ L O W   x = 1 , x 25 2     x 23 , 25 < x 2   0 , o t h e r w i s e
μ I D E A L   x = x   +   3 3 , 3 x 0 3     x 3 ,   0 x 3
μ H I G H x = 1 ,     x 25 x     2 23 ,   2 x < 25 0 ,   o t h e r w i s e

4.3. The Fuzzy Rules

In order to regulate the output variable, an FLS constructs a rule base. The fuzzy rules are simple IF-THEN rules with a condition and a conclusion. The rules are set using the knowledge of the LoRaWAN specifications in terms of SNR range, spreading factors and transmission power. The following are the three rules defined in our Fuzzy-Logic based ADR algorithm:
  • “if S N R m a r g i n is HIGH then TPnew is MEDIUM and SFnew is MEDIUM;”
  • “if S N R m a r g i n is IDEAL then TPnew is LOW and SFnew is LOW;”
  • “if S N R m a r g i n is LOW then TPnew is MEDIUM and SFnew is MEDIUM.”

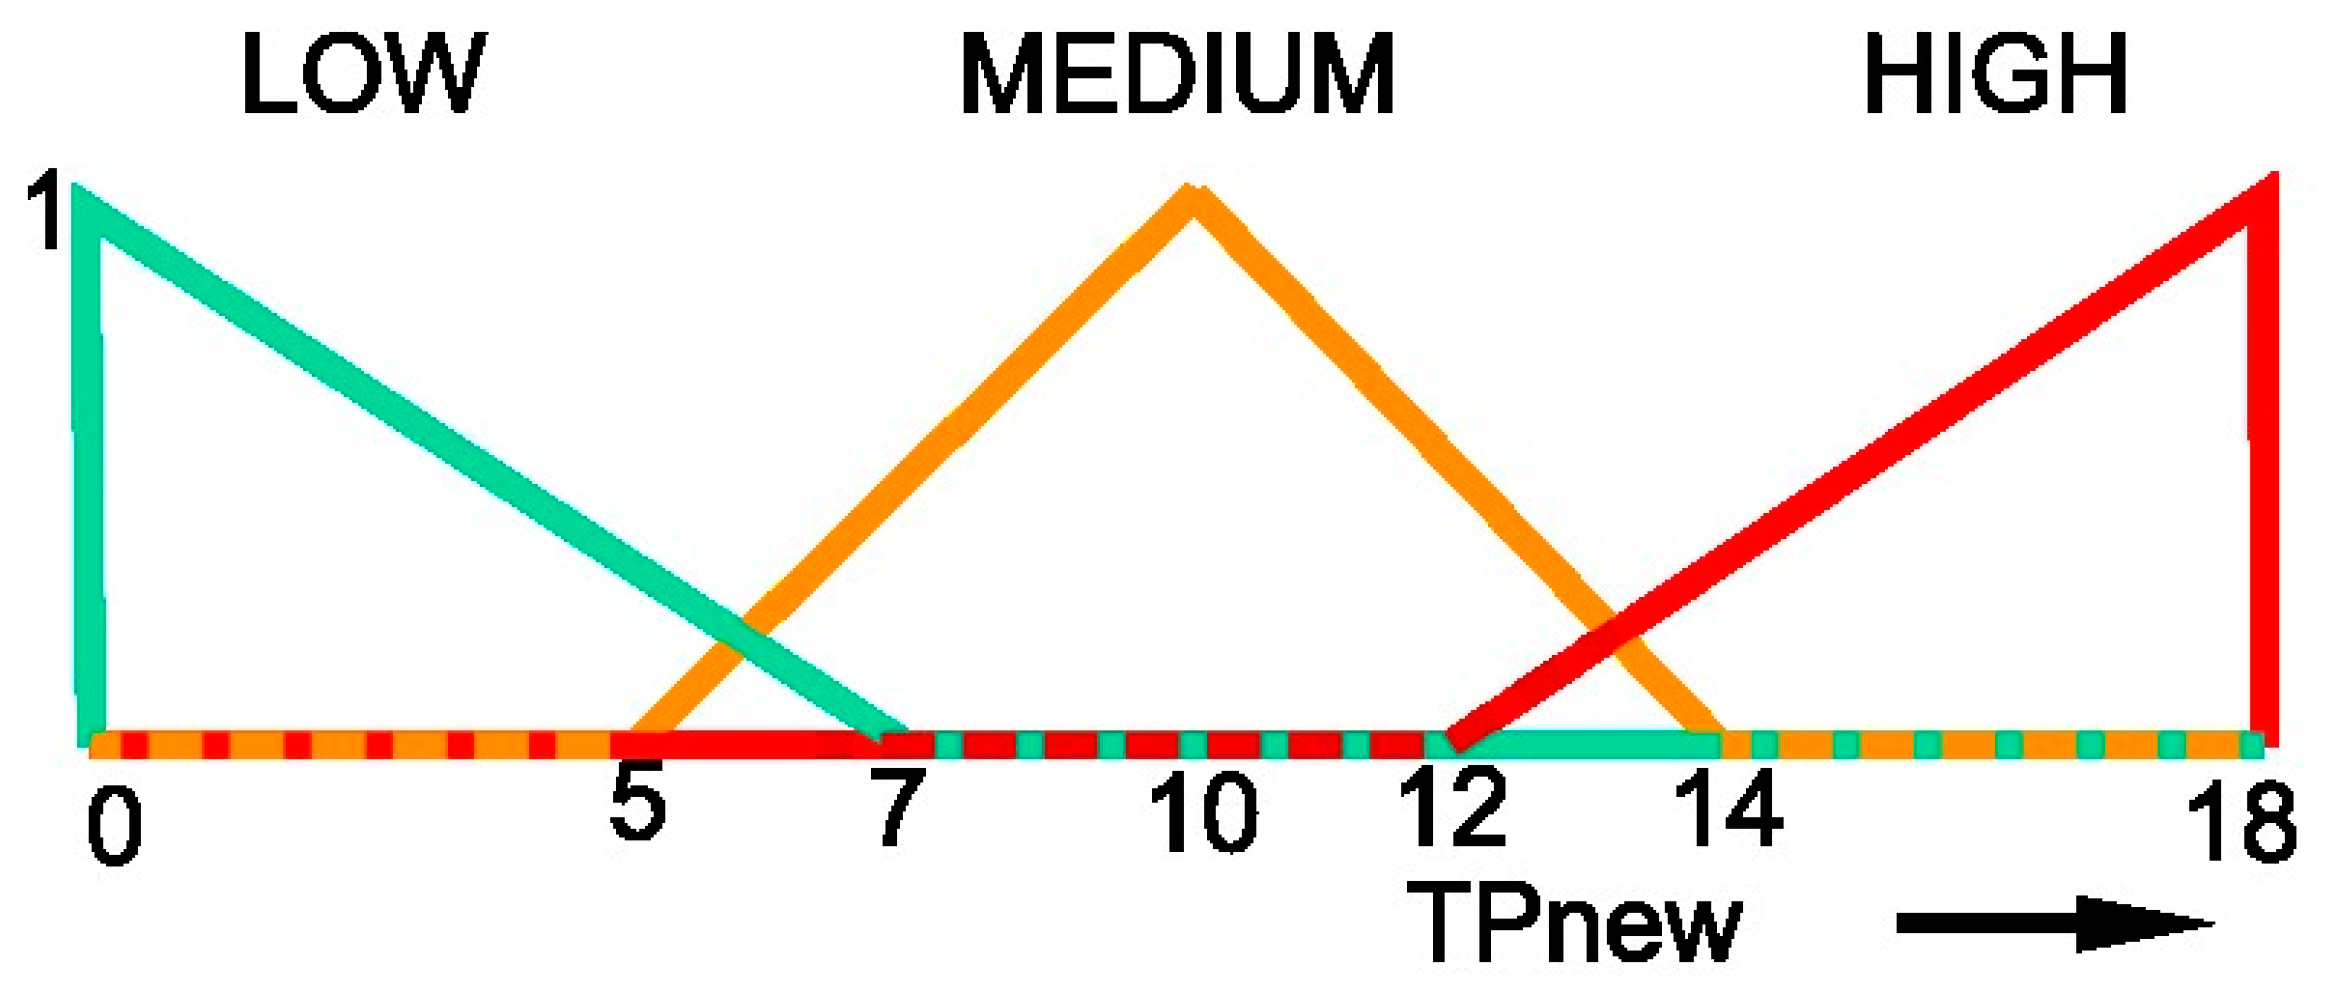
4.4. The Output Variable—TPnew

The linguistic variable for transmission power is decomposed into a set of linguistic terms:
TPnew = { LOW ,   MEDIUM ,   HIGH } .
The membership functions are defined by (9)–(11) below. Figure 3 shows the membership functions for transmission power.
The following are the three Triangle membership functions used to represent the range of output variable TPnew:
μ L O W   x = 1 , x 0 7     x 7 , 0 < x 7 0 , o t h e r w i s e
μ M E D I U M   x = x     5 5 , 5 x 10 15     x 5 , 10 < x 15
µ H I G H   x = 1 , x 20 x     13 7 , 13 x 20 0 , o t h e r w i s e

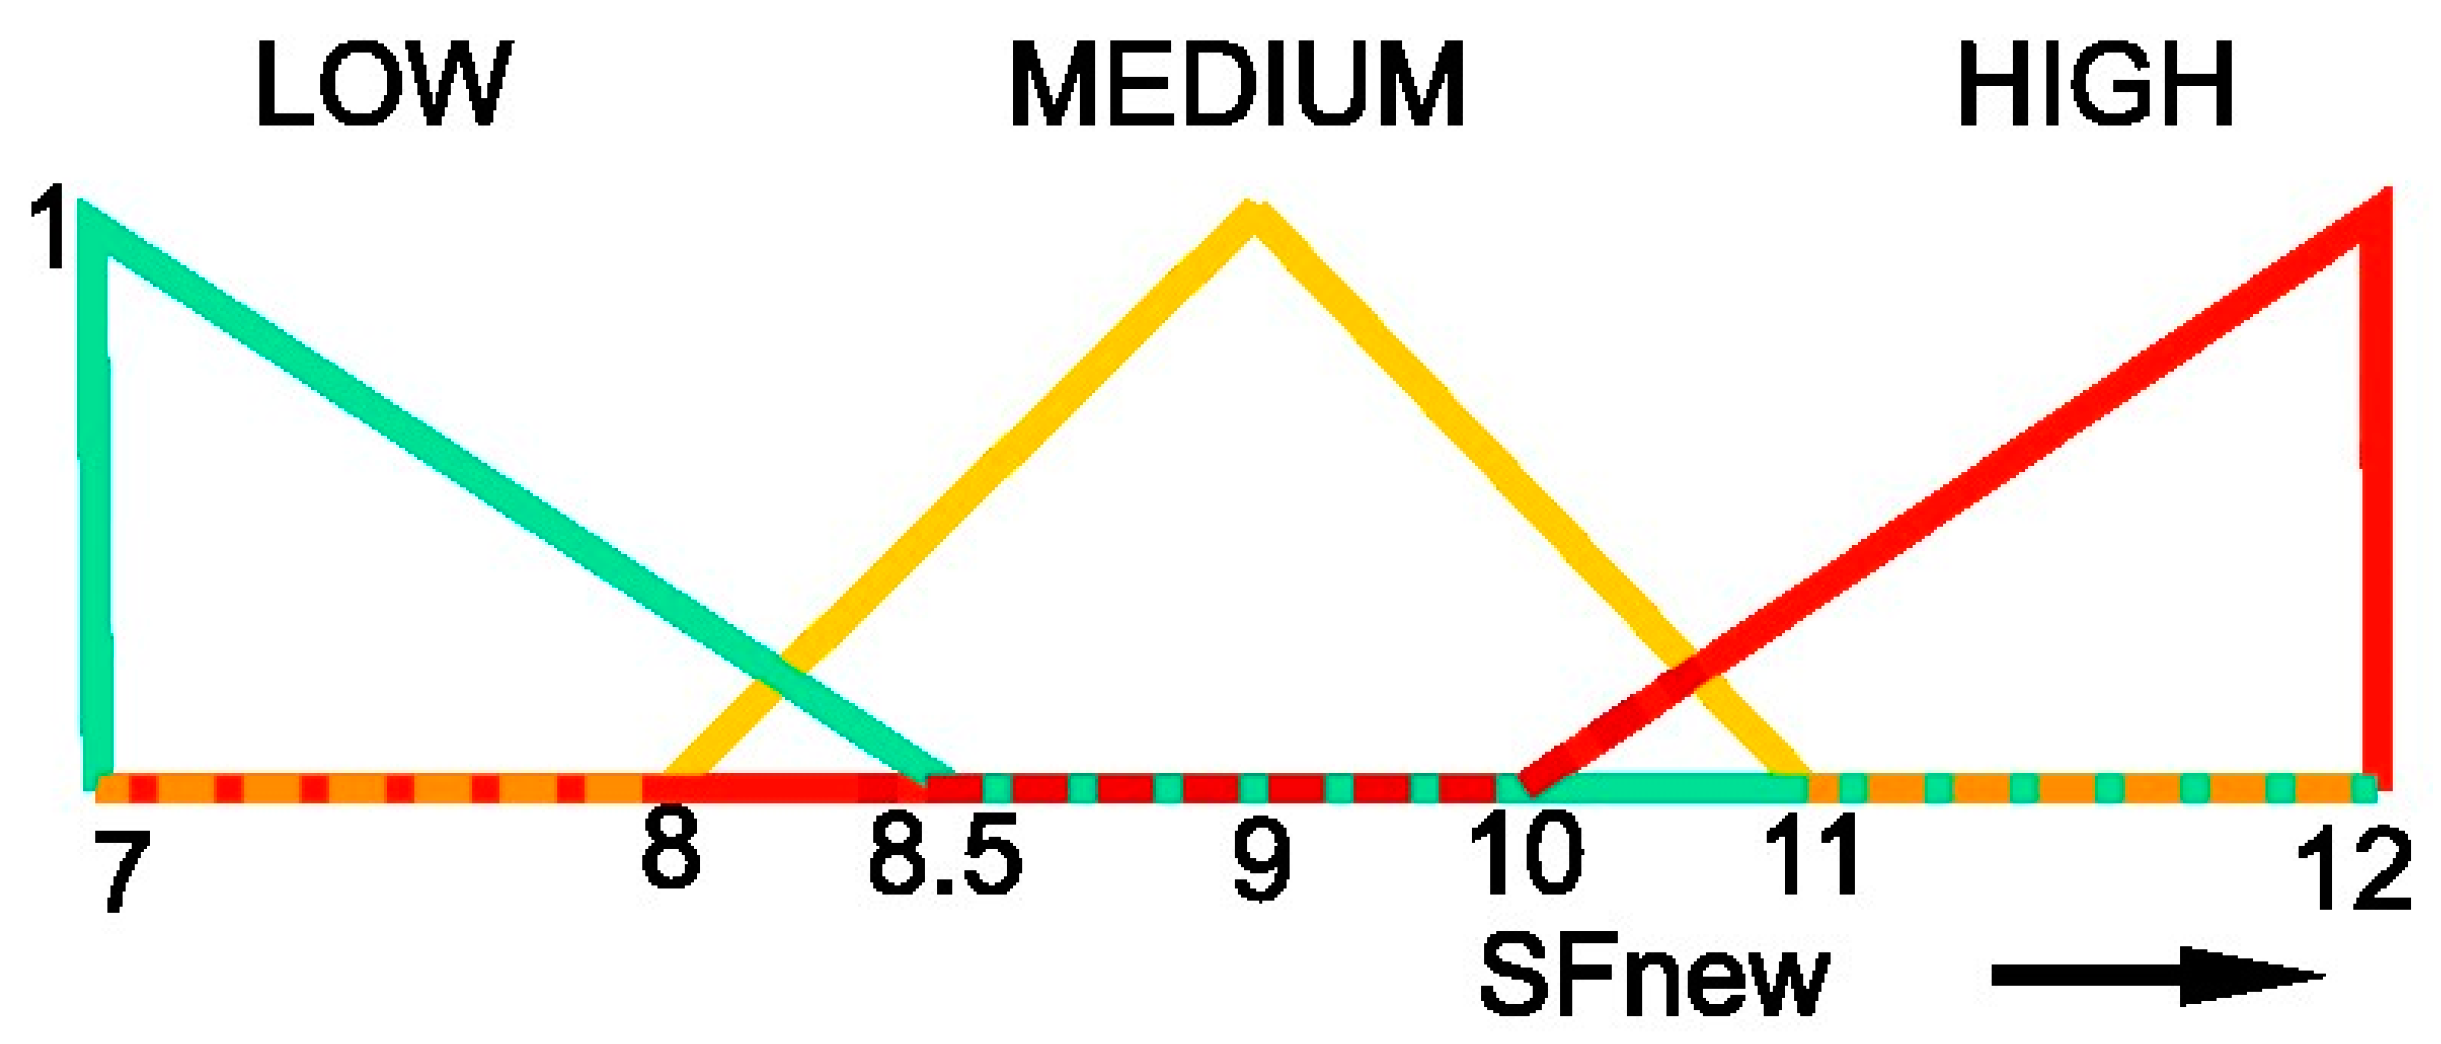
4.5. The Output Variable—SFnew

The linguistic variable for spreading factor is decomposed into a set of linguistic terms:
SFnew = { LOW ,   MEDIUM ,   HIGH } .
The membership functions for spreading factor estimation are defined by (12)–(14) below and shown in Figure 4.
The following are the three Triangle membership functions used to represent the range of output variable SF-New:
µ L O W   x = 1 , x 7 9     x 2 , 7 < x 7 0 , o t h e r w i s e
μ M E D I U M   x = x     8 1.5 , 8 x 9.5 11     x 1.5 , 9.5 < x 11
µ H I G H   x = 1 , x 12 x     10 2 , 10 x < 12 0 , o t h e r w i s e
Below is the Algorithm 1 for the proposed FL-ADR scheme
Algorithm 1: The proposed fuzzy- logic based ADR algorithm
Input:SF = [7,12], TP = [2,14], SNR
Output: SF and TP parameters for each ED
begin
Initialization: FLEngine ← Fuzzylite
1: SNRavg ← average SNR of last 4 frames
2: SNRreq ← demodulation floor (current data rate)
3: D m a r g i n  ← device margin
4: S N R m a r g i n = (SNRavg − SNRreq − D m a r g i n )
5: // FLEngine processes the following:
6: Define input and output variables-> S N R m a r g i n , SFnew, TPnew
7: Set input and output variable range
8: Define the membership functions
9: Set FLS type-> Mamdani
10: Add Rule code ← FLS fuzzy rules
     -> “if S N R m a r g i n is HIGH then TPnew is MEDIUM and SFnew is MEDIUM”
     ->“if S N R m a r g i n is IDEAL then TPnew is LOW and SFnew is LOW”
     ->“if S N R m a r g i n is LOW then TPnew is MEDIUM and SFnew is MEDIUM”
11: Aggregation->Maximum
12: Defuzzification->Centroid
13: TPnew, SFnew ← FLS [SF, TP]
14: Transmit SFnew and TPnew to ED
15: end

5. The Simulation of the LoRaWAN Network under ns-3

A number of open-source LoRaWAN simulation tools have been implemented in ns-3 [44]. The authors in [45] conducted a comprehensive review of the four ns-3 LoRaWAN implementations available, namely ns-3 LoRaWAN [46], lora-ns-3 [47], AWGN LoRaWAN [48] and CSMA LoRaWAN [49]. We resolved to simulate the LoRaWAN network using the ns-3 LoRaWAN module developed by Magrin [46] available at [50]. This model has excellent documentation and has available developers’ support. It is a widely used ns-3 LoRaWAN simulator.
For our simulations, we used up to seven GW nodes, one NS node and between 100 and 300 ED nodes in a 10 km × 10 km network, sending data packets at different time intervals. Table 2 and Table 3 show the parameters used in the LoRaWAN simulation. We coded our algorithms inside the ADR component code of the ns-3 LoRaWAN module. We analyzed the system performance of different ADR models, namely, the standard ADR model, which we term Semtech-ADR, the ADR model implemented in the ns-3 LoRaWAN module, which we term ns-3-ADR and our proposed fuzzy logic-based ADR known as FL-ADR. We performed two different evaluations and analyses. In the first evaluation, we used 100 EDs and changed the Application Data Packet Rate to transmit 1 packet per 300 s, 600 s, 900 s, 1200 s and 1500 s. In the second evaluation, we kept the application data rate constant at 1 packet per 600 s and varied the number of EDs to 100, 150, 200, 250 and 300 and analyzed the performance. The simulation was configured to simulate for 3.3 h.

The Parameters of the Simulation

Table 2 and Table 3 show some of the important parameters that we used while evaluating the performance of the typical LoRaWAN network. Table 2 below shows the energy model parameters used by ED nodes of ns-3 LoRaWAN simulation.
Table 2. Energy model parameters.
ParameterValue
Initial Energy of EDs1000 J
Supply Voltage3.3 V
Stand by Current0.0014 A
Tx Current0.028 A
Sleep Current0.0000015 A
Rx Current0.0112 A
Table 3. Network parameters.
ParameterValue
Number of ED100, 150, 200, 250, 300.
Topographical Area of EDs10,000 m × 10,000 m
Number of GWs7
Number of NS1
Number of ED100, 150, 200, 250, 300.
MTypeCONFIRMED_DATA_UP
Data Rate controlEnabled
ADREnabled
End Device MobilityDisabled
Channel Loss ModelLogDistancePropagationLossModel
Channel Propagation Delay ModelConstantSpeedPropagationDelayModel
Simulation Time3.3 h
App. Data Packet Rate1 packet per 300 s, 600 s, 900 s, 1200 s, 1500 s.

6. Results and Discussion

This section includes a performance analysis of our proposed scheme as well as the numerical output of our simulations. Using two additional schemes as benchmarks, we evaluated the performance of our proposed algorithm. Table 4 shows some characteristics of the three ADR schemes being compared. In this analysis, we used six metrics (Total Energy Consumption (ET), Confirmed Packet Success Rate (CPSR), Uplink Packet Delivery Ratio (UL-PDR), Interference/Collision Rate I P R , Lost-Because-Busy Rate L P R ) and Energy Efficiency in the evaluation of the LoRaWAN network performance. The charts below show the comparison in performance between Semtech-ADR, ns-3-ADR and our proposed FL-ADR scheme, indicating network performance using these metrics. We use the six metrics we are considering for performance analysis.

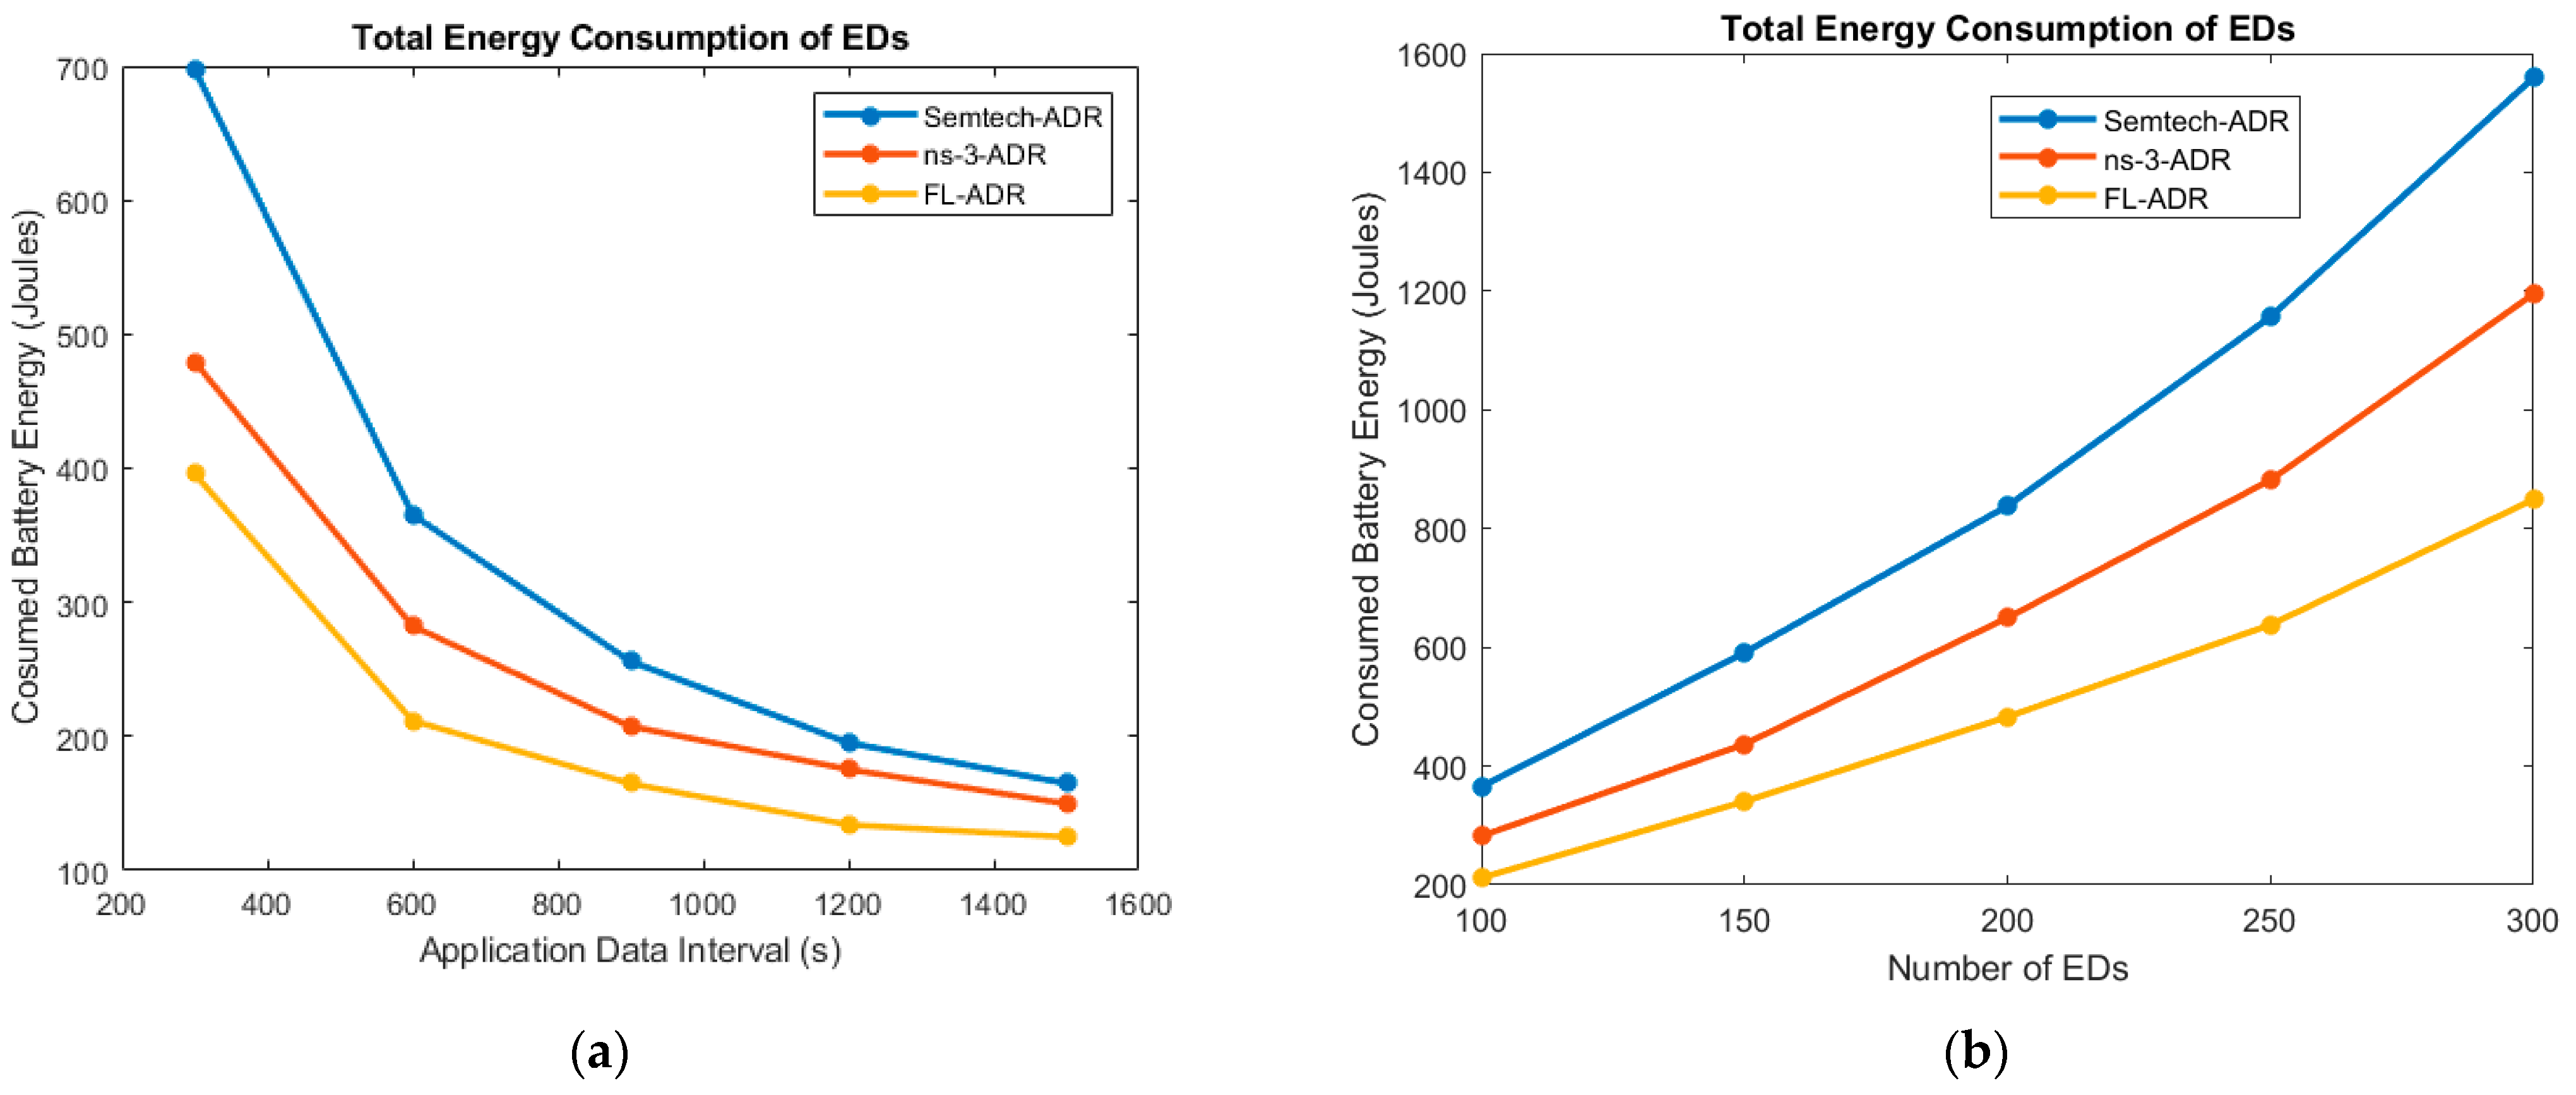
6.1. Performance in Terms of Total Energy Consumption

Figure 5a,b show the performance of the three different LoRaWAN ADR implementations in terms of total energy consumption. The total energy consumption (ET) comprises the energy utilized by all the EDs. Figure 5a considers application data intervals. The FL-ADR showed superior performance with respect to the total energy consumed. This is attributed to the ideal SNR margin obtained from the FIS, ensuring effective assignment of SF values at minimal transmission power. As the data packet interval increases, less energy is expended because the probability of packet collision and retransmission is reduced. According to the simulation results, the global network performance shows that, every time the interval is increased by 300 s, the overall network energy consumption reduces at every step by approximately 46%, 22%, 18% and 6%, respectively, across the three algorithms. This aligns with the fact that a low duty cycle is ideal for LoRaWAN as per specifications. Figure 5b provides a comparison of energy consumption against different numbers of node density at a constant application data interval of 600 s. As more nodes are added onto the network, it is expected that the total energy consumption will increase. The simulation results show that the proposed FL-ADR algorithm conserves over 43% of the battery energy compared to Semtech-ADR and 14% saving compared to ns-3-ADR, respectively.

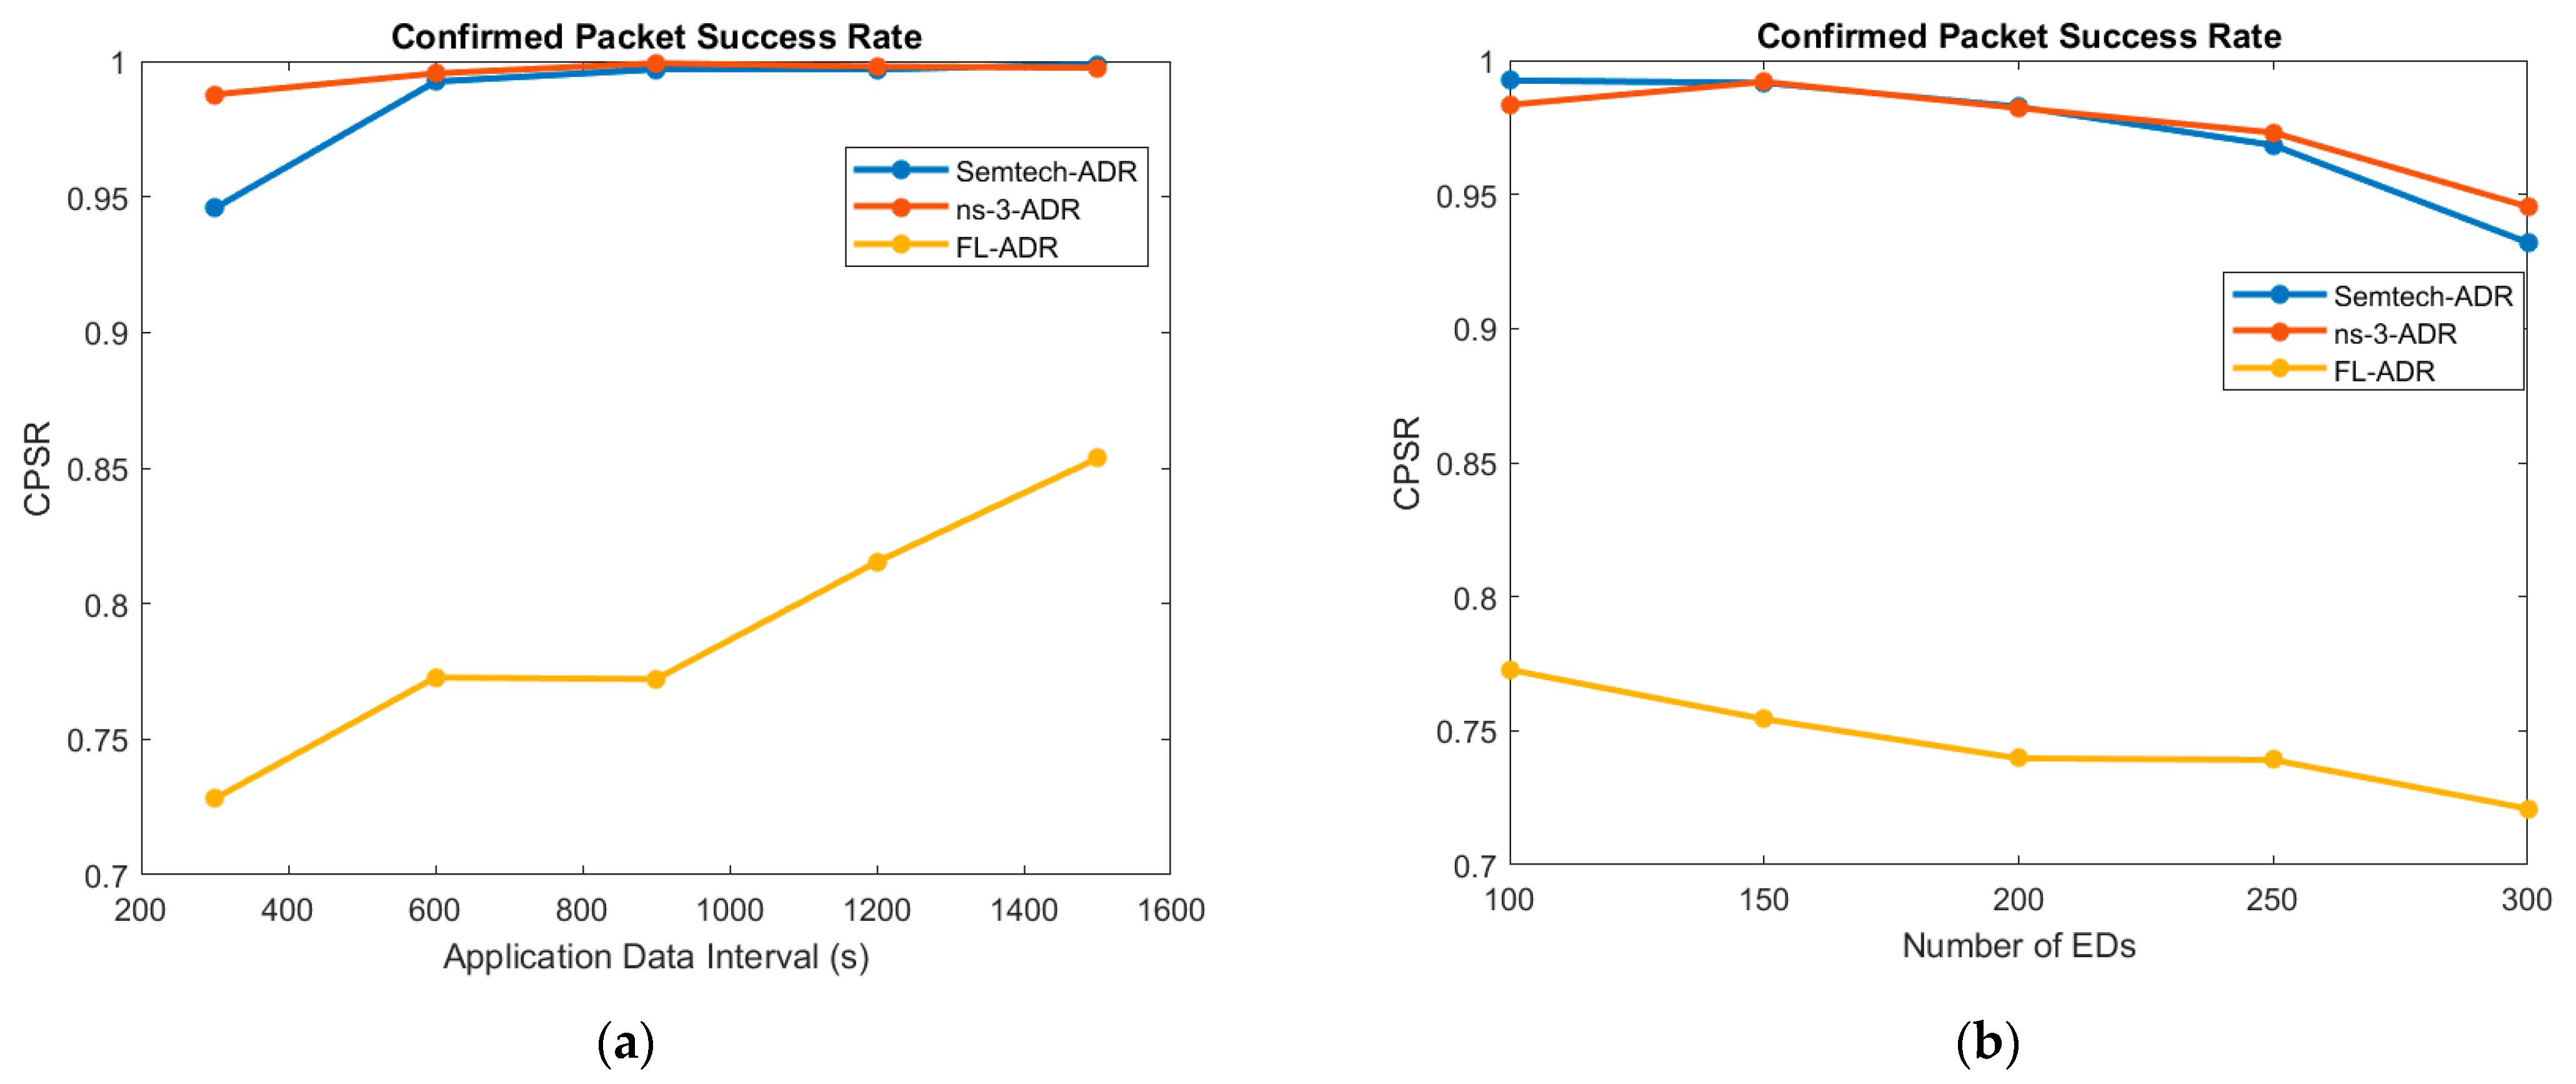
6.2. Performance in Terms of Confirmed Packet Success Rate

Figure 6a,b show the performance of the three ADR implementations of LoRaWAN in terms of confirmed packet success rate. This is the probability that the transmitted uplink packets and their corresponding downlink packets are appropriately received by the network server and the ED, respectively, in at least one of the transmission attempts available. Our proposed algorithm FL-ADR is outperformed by the other Semtech-ADR and ns-3-ADR algorithms. The effect of the gateway density makes the CPSR close to one for the better performing algorithms while FL-ADR ranges between 0.7 and 0.8 [51]. The results show that CPSR tends to increase as the application data interval increases. This is because longer intervals between transmissions reduce congestion and therefore reduce the probability of interference or packet collision. As the node density increases, the CPSR decreases as a result of an increase in the probability of interference or collision. An increase in network size results in more attempts to transmit packets and a drop in the ratio of successfully received packets. For example, when the node density is 150, the value of FL-ADR CPSR is 0.754, while that of ns-3-ADR is 0.991. The CPSR decreases when the node density increases to 300 nodes to 0.721 for FL-ADR and 0.945 for ns-3-ADR, respectively.

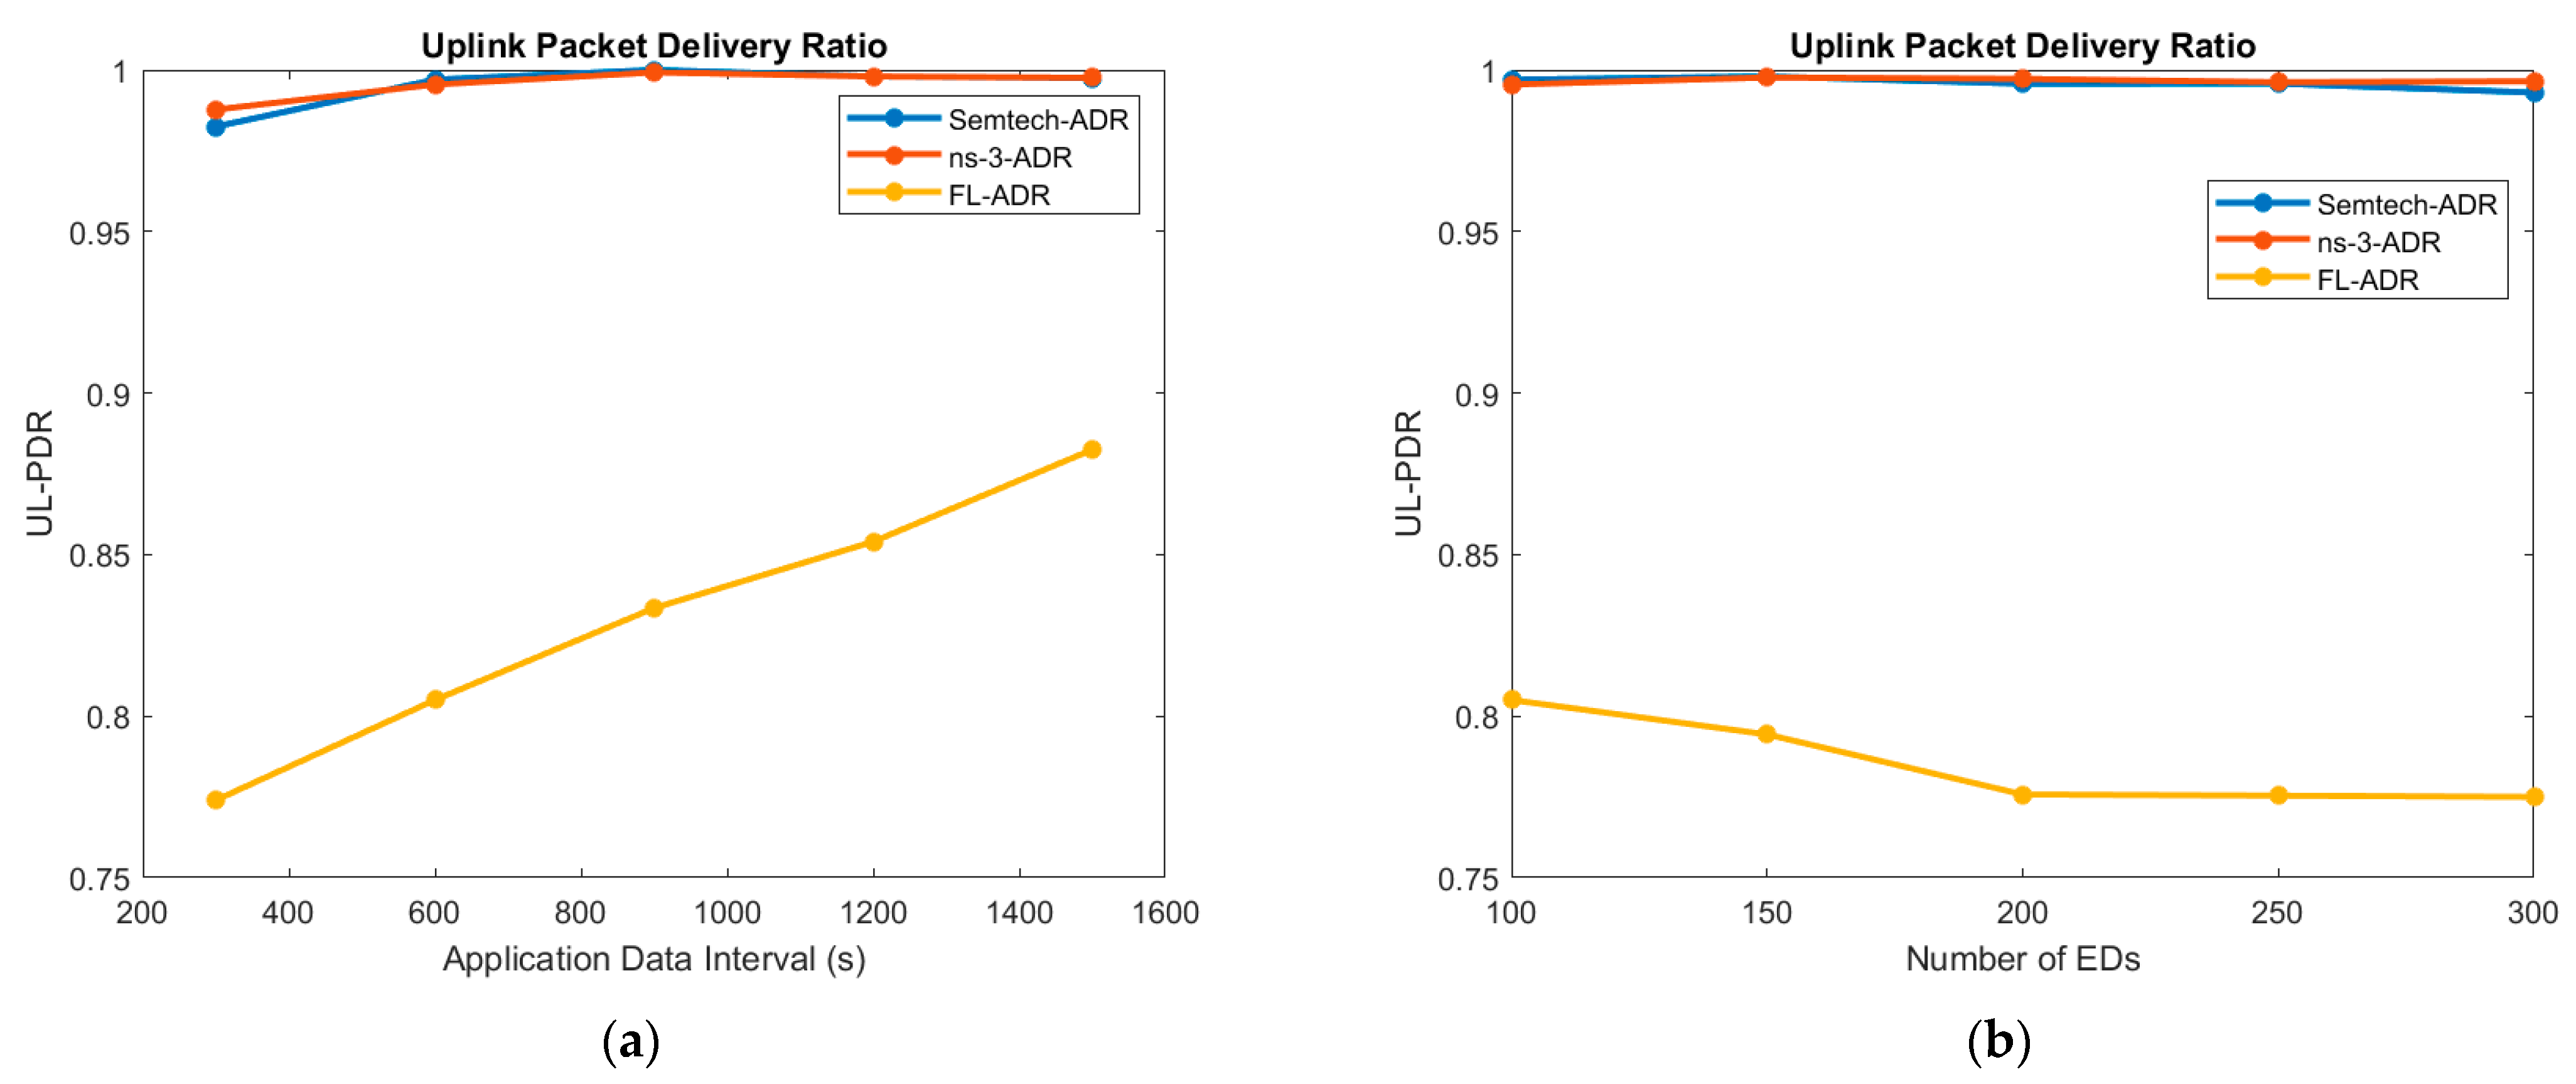
6.3. Performance in Terms of Uplink Packet Delivery Ratio

The probability that an uplink packet U L s is correctly received (whether or not the ACK is requested) is defined as Uplink Packet Delivery Ratio (UL-PDR). We measure the ratio of uplink packets successfully delivered to the GW over those generated at the EDs. In Figure 7, the FL-ADR shows poorer performance in terms of UL-PDR compared to the other two algorithms. More differences in performance are apparent in the two unique metrics considered below even though there is a difference when comparing the UL-PDR and CPSR performance, especially between Semtech-ADR and ns-3-ADR.

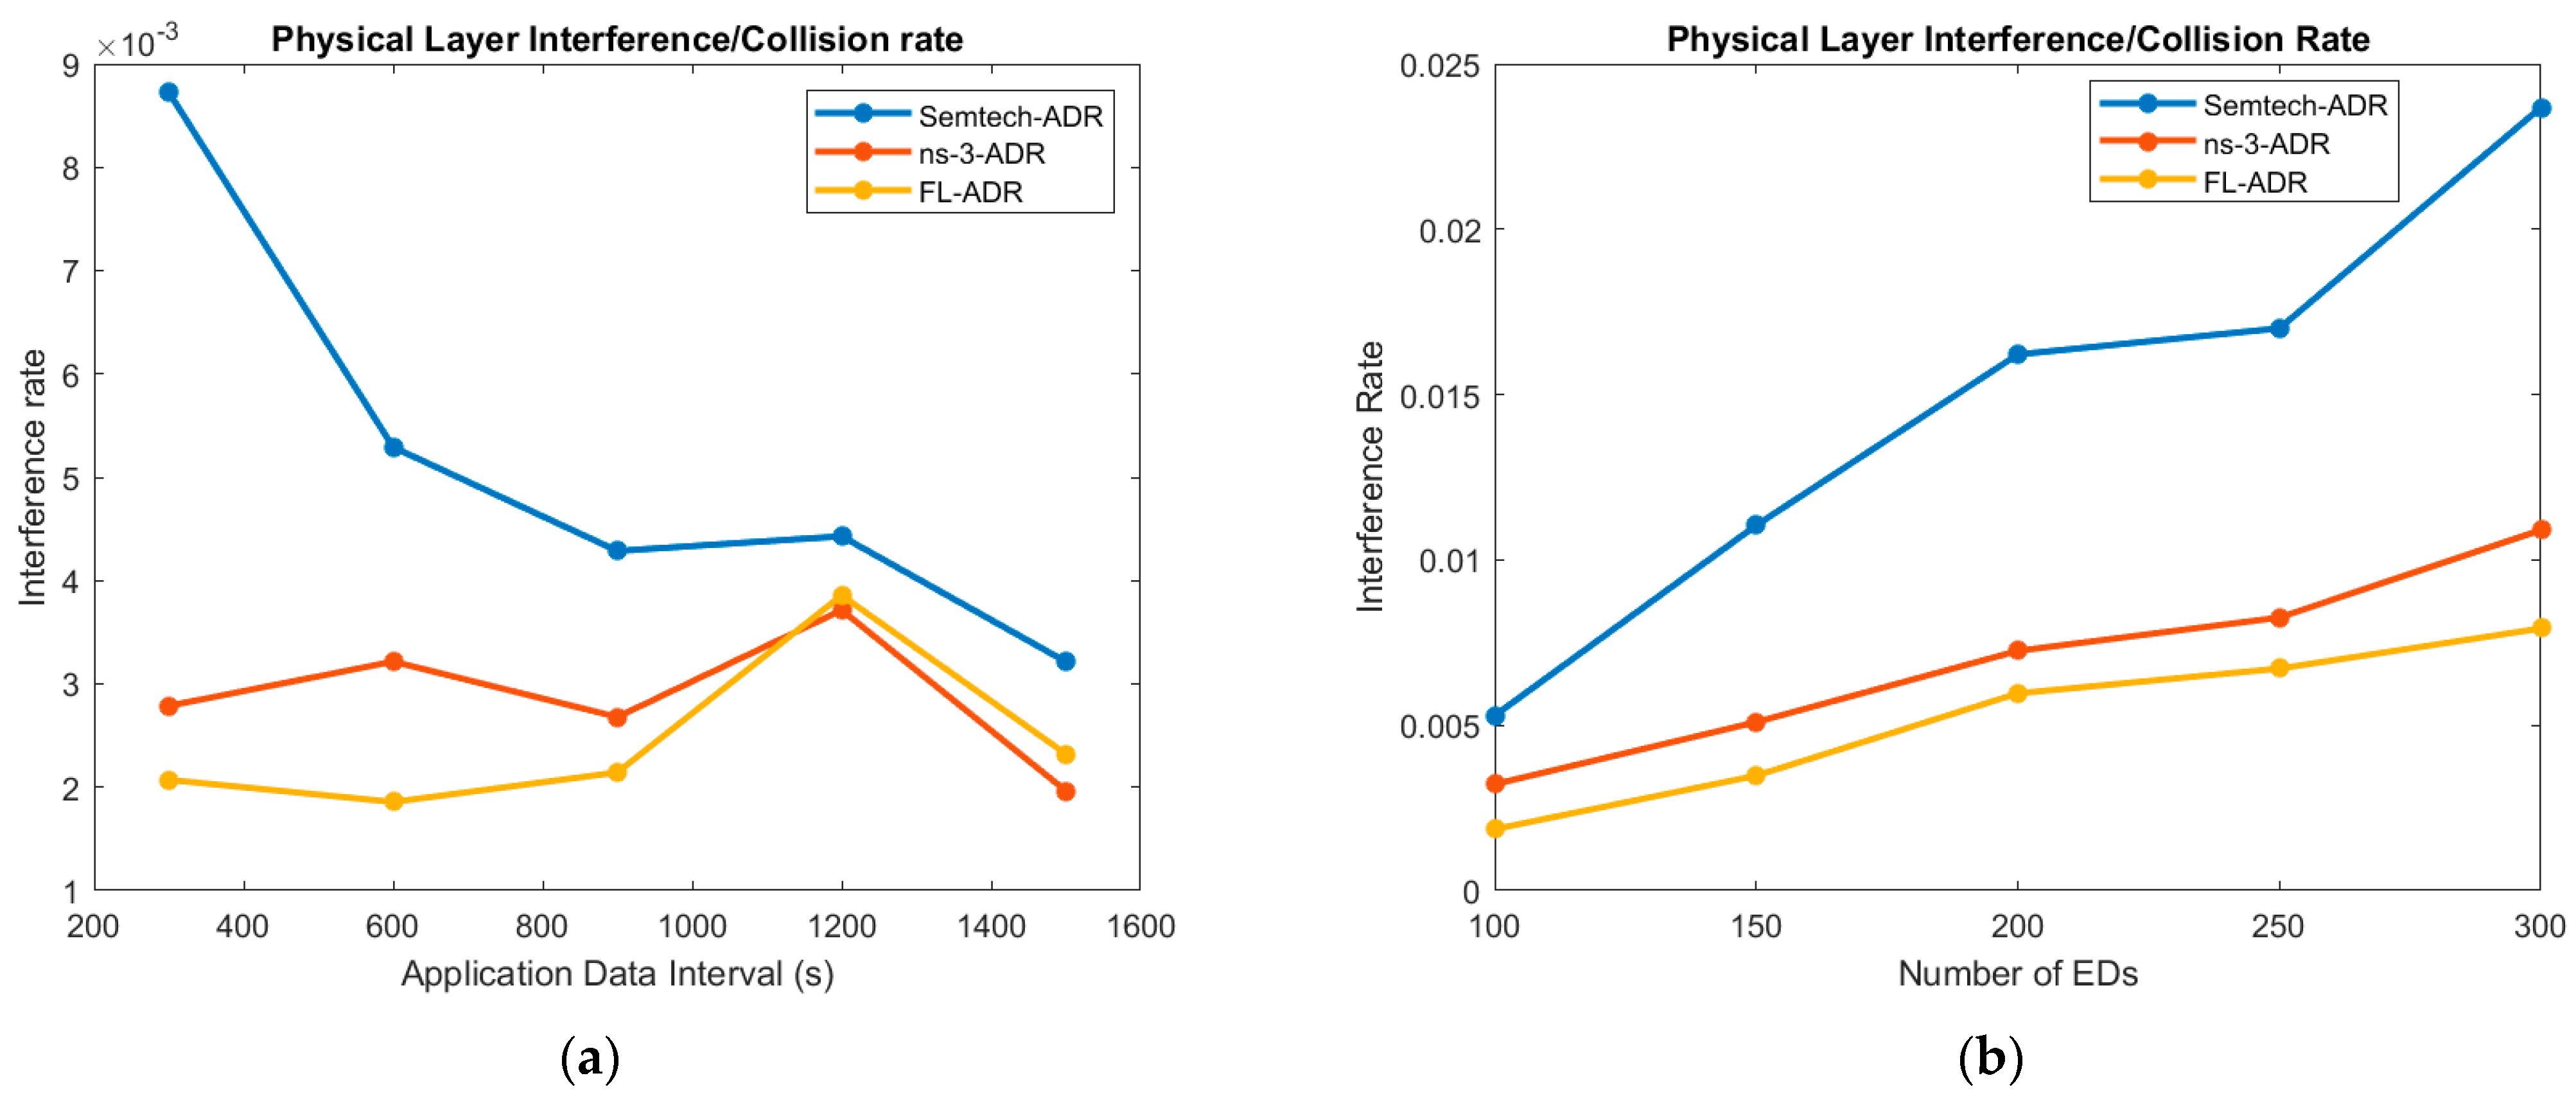
6.4. Performance in Terms of Interference/Collision Rate

Figure 8a,b shows the performance of the three different ADR schemes considering the interference/collision rate. It is the rate of packet loss when the packet is correctly locked-on by the GW, but due to interference from overlapping packets, the GW fails to receive the packet. The performance of FL-ADR performs slightly better than the ns-3-ADR, while the Semtech-ADR is marginally underperforming. The slight increase in interference rate at a 1200 s interval is peculiar. Interference is minimal in this network attributed to the effect of multiple gateways. As the node density increases, the network becomes more prone to interference/collisions. Typically, as the application data interval increases, the probability of interference/collision decreases.

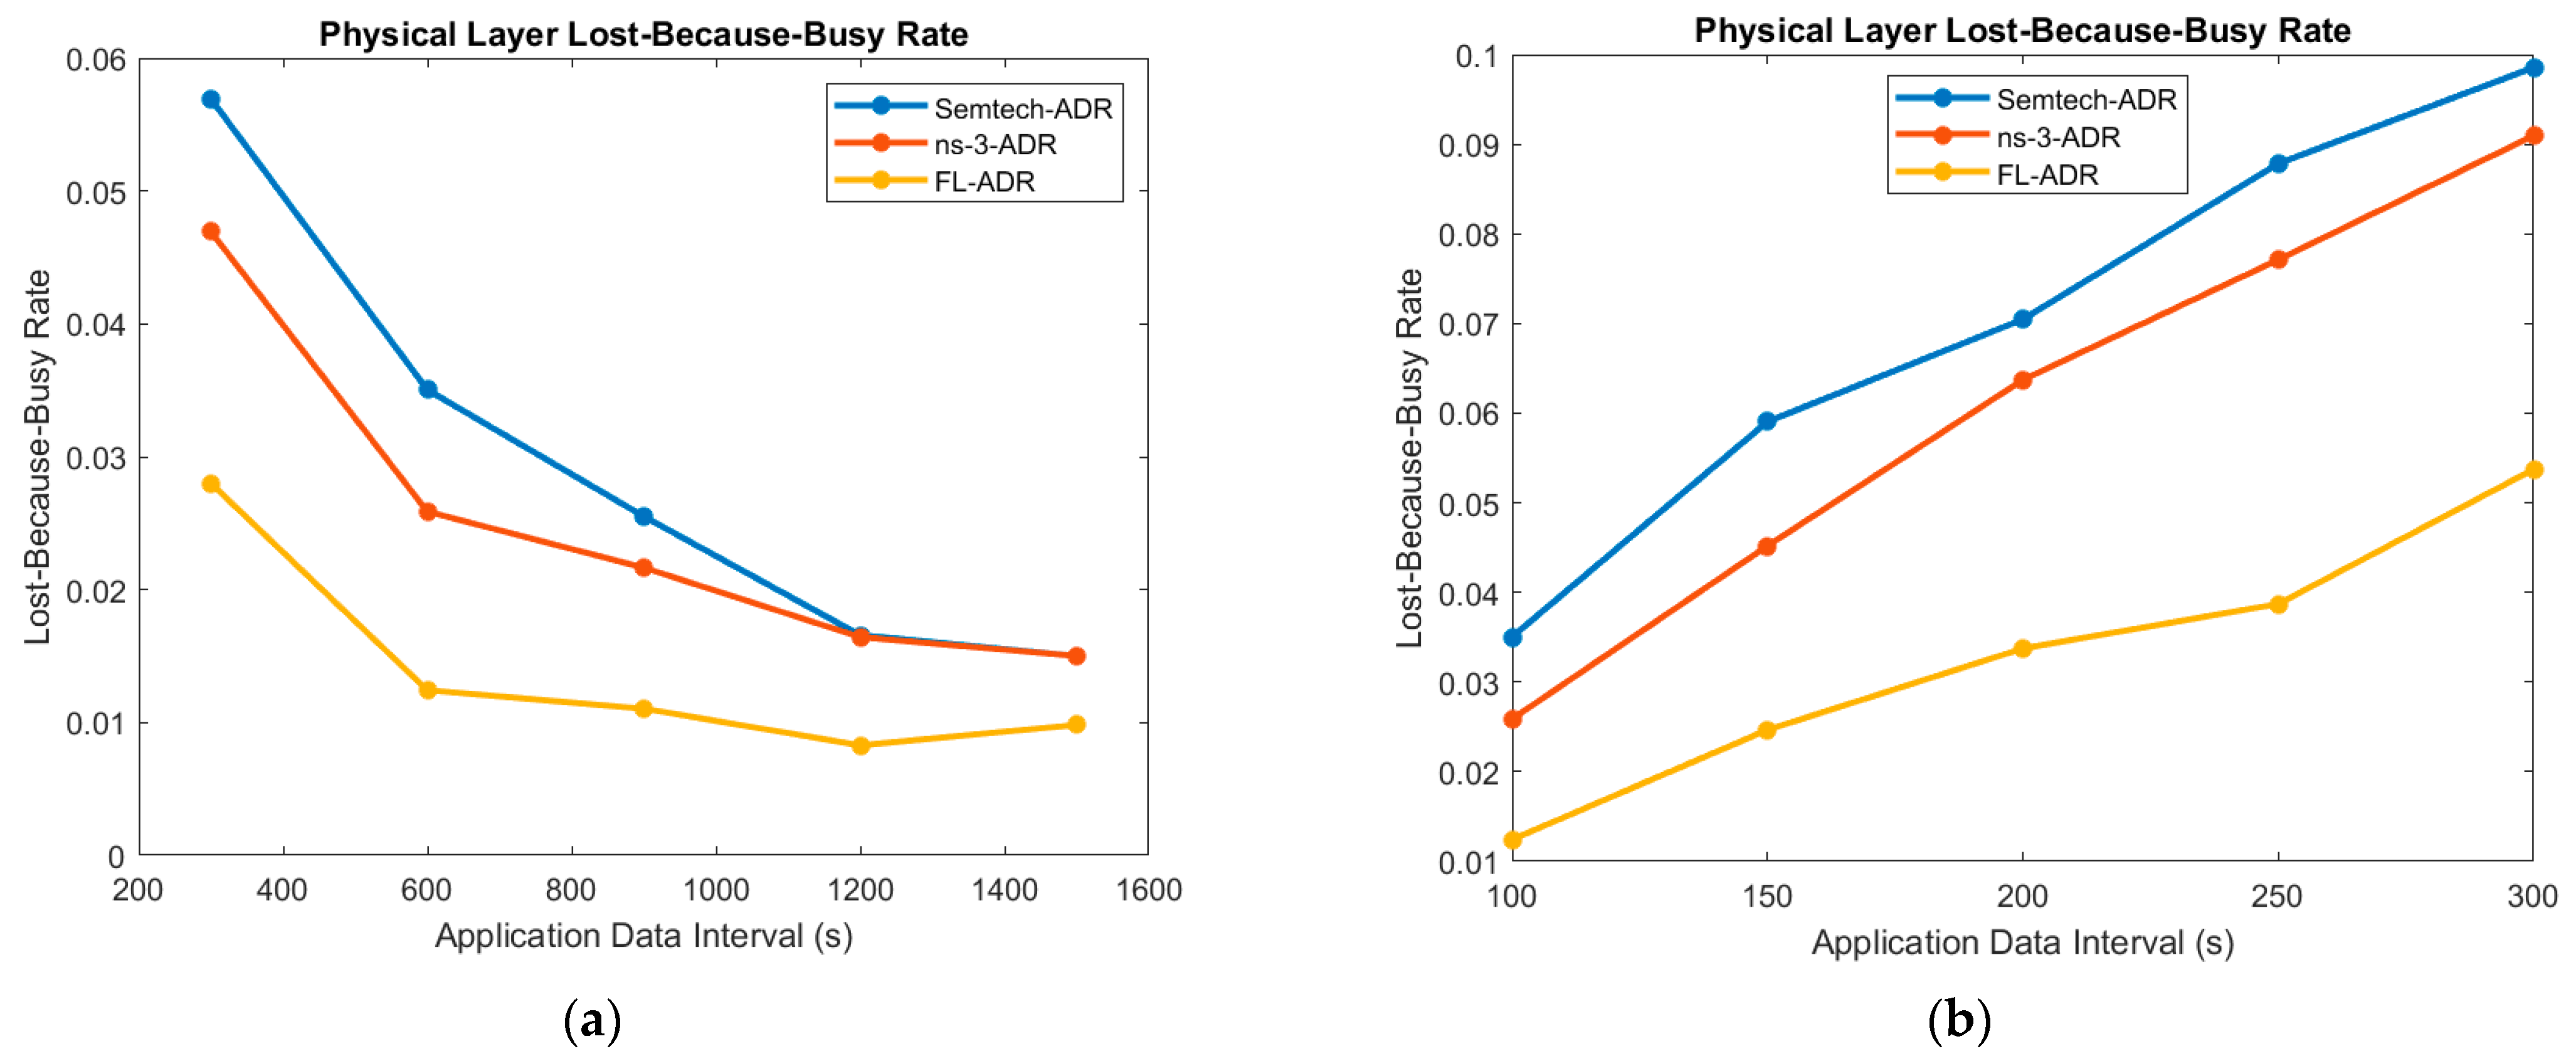
6.5. Performance in Terms of Lost-Because-Busy Rate

Figure 9a,b show the three different ADR performances in terms of Lost-Because-Busy rate. This occurs when packets are lost due to GW transmission, the disruption of packet reception due to the broadcast of a downlink packet from the GW. Typically, the ratio decreases as the application data interval increases because there is less traffic to the GWs to receive UL and transmit DL messages. Where ED density is increasing, this ratio tends to increase because the GWs are flooded with transmissions. This metric provides more detail in the behavior of the algorithms where FL-ADR performs marginally better than its two counterparts as shown in Figure 9. The LoRa standard recommends the first DL receive window (RX1) to be unlocked on a similar channel used in the uplink, while the second window (RX2) is unlocked in the reserved downlink channel. While the GW is transmitting a DL message, no UL messages are transmitted. Therefore, as the node density increases, the number of UL and DL packets increase causing delays.

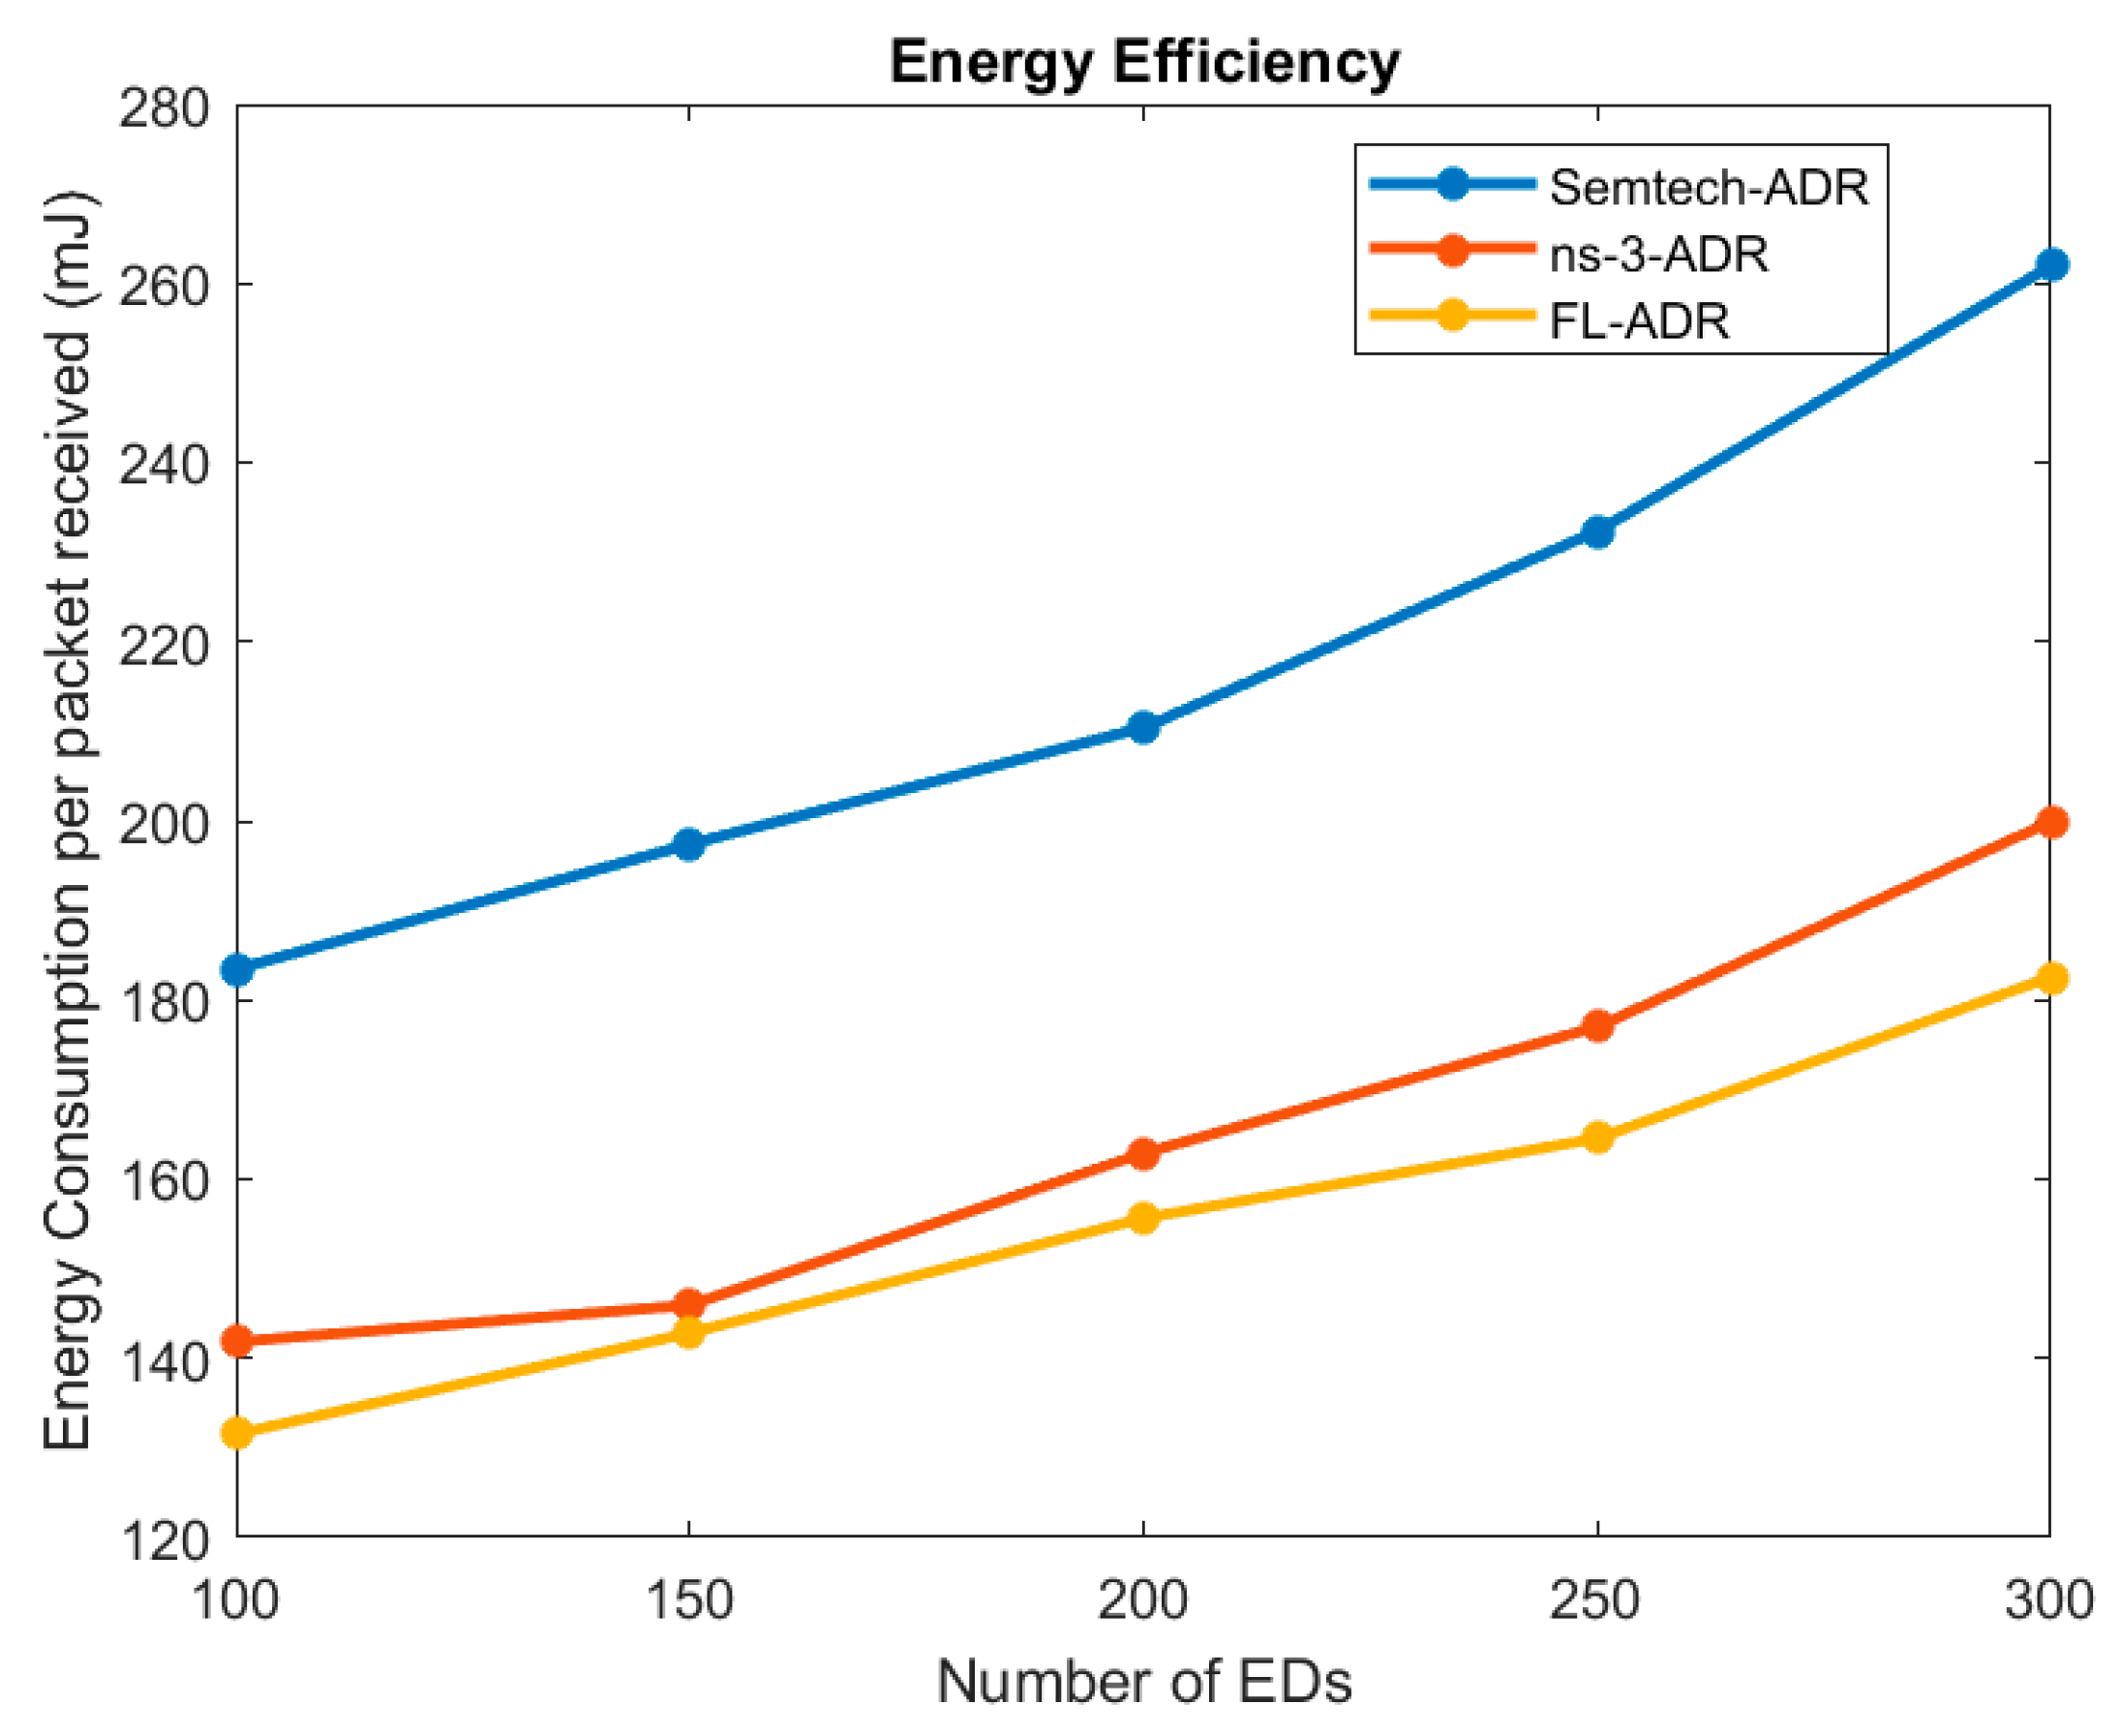
6.6. Energy Efficiency in Terms of Correctly Received Packets

The ratio of the total number of packets received at the gateway to the total amount of energy used by the network to send those packets is known as energy efficiency. Figure 10 below shows the energy consumed per packet calculated for the three algorithms under consideration. For these results, the application data interval was 600 s, implying that 20 packets were sent per ED during the simulation period. Packets sent a range from 2000 to 6000 depending on the number of EDs. The FL-ADR is more energy efficient compared to the Semtech-ADR and the ns-3-ADR, showing that the proposed ADR is efficiently adjusting SF and TP despite a trade-off with CPSR and UL_PDR.
From the results presented in the above sections, we observe that the two unique metrics I p R and L p R were able to showcase the intricate differences in performance better than CPSR and UL-PDR, which did not provide that much differentiation between the models, particularly under ideal network conditions. Where multiple gateways are implemented, CPSR and UL-PDR may have a value almost equal to one (100%) such that it is difficult to distinguish the performance of the models only by using CPSR and UL-PDR. In terms of energy consumption, FL-ADR provided the best performance, saving up to 14% of energy per ED node in this 3.3 h simulation scenario compared to the ns-3-ADR and 43% compared to Semtech-ADR. Although the FL-ADR is more energy efficient, this is achieved with a drop in performance in terms of CPSR and UL-PDR. This algorithm could be used in applications where energy consumption is of utmost priority in the QoS requirements.

7. Conclusions

In this work, we proposed a fuzzy-logic based adaptive data rate scheme for energy-efficient LoRaWAN communication (FL-ADR) and evaluated its performance through extensive simulations. The proposed fuzzy logic-based model provided a reduction in energy consumption compared to Semtech-ADR and ns-3-ADR schemes achieving a better performance albeit with a decrease of CPSR and UL-PDR for this multi-gateway network. Using the two unique metrics for analysis, I P R and L P R , we were able to obtain more details on the CPSR and UL-PDR performance. The metrics I P R and L P R provide more insight on network performance on the physical layer. Future work involves investigating how to improve the CSPR and UL-PDR without compromising the energy efficiency that is accomplished by the proposed algorithm. It would be interesting to find the impact of combining the Fuzzy Logic System with other techniques such as deep learning on the network performance.

Author Contributions

Conceptualization, R.K. and A.A.-M.; Methodology, R.K.; Writing-original draft preparation, R.K.; writing-review and editing, G.H. and A.A.-M. All authors have read and agreed to the published version of the manuscript.

Funding

This research received no external funding.

Acknowledgments

This work is based on the research supported in part by our industry partner TelkomSA. The grant holder acknowledges that opinions, findings and conclusions or recommendations expressed in any publication generated by this research are that of the authors, and that our industry partners accept no liability in this regard.

Conflicts of Interest

The authors declare no conflict of interest. The funders had no role in the design of the study; in the collection, analyses, or interpretation of data; in the writing of the manuscript; or in the decision to publish the results.

References

  1. Arshad, J.; Aziz, M.; Al-Huqail, A.A.; Zaman, M.H.U.; Husnain, M.; Rehman, A.U.; Shafiq, M. Implementation of a LoRaWAN based smart agriculture decision support system for optimum crop yield. Sustainability 2022, 14, 827. [Google Scholar] [CrossRef]
  2. Slaný, V.; Lučanský, A.; Koudelka, P.; Mareček, J.; Krčálová, E.; Martínek, R. An integrated IoT architecture for smart metering using next generation sensor for water management based on LoRaWAN technology: A pilot study. Sensors 2020, 20, 4712. [Google Scholar] [CrossRef] [PubMed]
  3. Alshehri, F.; Muhammad, G. A comprehensive survey of the Internet of Things (IoT) and AI-based smart healthcare. IEEE Access 2020, 9, 3660–3678. [Google Scholar] [CrossRef]
  4. Basford, P.J.; Bulot, F.M.J.; Apetroaie-Cristea, M.; Cox, S.J.; Ossont, S.J. LoRaWAN for smart city IoT deployments: A long term evaluation. Sensors 2020, 20, 648. [Google Scholar] [CrossRef] [Green Version]
  5. Gbadamosi, S.A.; Hancke, G.P.; Abu-Mahfouz, A.M. Building upon NB-IoT networks: A roadmap towards 5G new radio networks. IEEE Access 2020, 8, 188641–188672. [Google Scholar] [CrossRef]
  6. Lavric, A.; Petrariu, A.I.; Popa, V. SigFox communication protocol: The new era of IoT? In Proceedings of the 2019 International Conference on Sensing and Instrumentation in IoT Era (ISSI), Lisbon, Portugal, 29–30 August 2019; IEEE: Piscataway, NJ, USA, 2019; pp. 1–4. [Google Scholar]
  7. Mekki, K.; Bajic, E.; Chaxel, F.; Meyer, F. Overview of cellular LPWAN technologies for IoT deployment: Sigfox, LoRaWAN, and NB-IoT. In Proceedings of the 2018 IEEE International Conference on Pervasive Computing and Communications Workshops (Percom Workshops), Athens, Greece, 19–23 March 2018; IEEE: Piscataway, NJ, USA, 2018; pp. 197–202. [Google Scholar]
  8. Farhad, A.; Kim, D.-H.; Pyun, J.-Y. Resource Allocation to Massive Internet of Things in LoRaWANs. Sensors 2020, 20, 2645. [Google Scholar] [CrossRef]
  9. Narieda, S.; Fujii, T.; Umebayashi, K. Energy Constrained Optimization for Spreading Factor Allocation in LoRaWAN. Sensors 2020, 20, 4417. [Google Scholar] [CrossRef]
  10. Amichi, L.; Kaneko, M.; El Rachkidy, N.; Guitton, A. Spreading factor allocation strategy for LoRa networks under imperfect orthogonality. In Proceedings of the ICC 2019–2019 IEEE International Conference on Communications (ICC), Shanghai, China, 20–24 May 2019; IEEE: Piscataway, NJ, USA, 2019; pp. 1–7. [Google Scholar]
  11. Al-Gumaei, Y.A.; Aslam, N.; Chen, X.; Raza, M.; Ansari, R.I. Optimising Power Allocation in LoRaWAN IoT Applications. IEEE Internet Things J. 2021, 9, 3429–3442. [Google Scholar] [CrossRef]
  12. Anwar, K.; Rahman, T.; Zeb, A.; Saeed, Y.; Khan, M.A.; Khan, I.; Ahmad, S.; Abdelgawad, A.E.; Abdollahian, M. Improving the convergence period of adaptive data rate in a long range wide area network for the internet of things devices. Energies 2021, 14, 5614. [Google Scholar] [CrossRef]
  13. Magrin, D. Network Level Performances of a LoRa System. Master’s Thesis, Università degli Studi di Padova, Padua, Italy, 2016. [Google Scholar]
  14. Bouras, C.; Gkamas, A.; Katsampiris Salgado, S.A.; Kokkinos, V. Comparison of LoRa simulation environments. In Proceedings of the International Conference on Broadband and Wireless Computing, Communication and Applications, Antwerp, Belgium, 7–9 November 2019; Springer: Cham, Switzerland, 2019; pp. 374–385. [Google Scholar]
  15. Subramanian, A.; Sayed, A. Joint rate and power control algorithms for wireless networks. IEEE Trans. Signal Process. 2005, 53, 4204–4214. [Google Scholar] [CrossRef]
  16. Kim, S.; Yoo, Y. Contention-aware adaptive data rate for throughput optimization in LoRaWAN. Sensors 2018, 18, 1716. [Google Scholar] [CrossRef] [PubMed] [Green Version]
  17. Kim, D.-Y.; Kim, S.; Hassan, H.; Park, J.H. Adaptive data rate control in low power wide area networks for long range IoT services. J. Comput. Sci. 2017, 22, 171–178. [Google Scholar] [CrossRef]
  18. Slabicki, M.; Premsankar, G.; Di Francesco, M. Adaptive configuration of LoRa networks for dense IoT deployments. In Proceedings of the NOMS 2018—2018 IEEE/IFIP Network Operations and Management Symposium, Taipei, Taiwan, 23–27 April 2018; IEEE: Piscataway, NJ, USA, 2018; pp. 1–9. [Google Scholar]
  19. Cuomo, F.; Campo, M.; Caponi, A.; Bianchi, G.; Rossini, G.; Pisani, P. EXPLoRa: Extending the performance of LoRa by suitable spreading factor allocations. In Proceedings of the 2017 IEEE 13th International Conference on Wireless and Mobile Computing, Networking and Communications (WiMob), Rome, Italy, 9–11 October 2017; IEEE: Piscataway, NJ, USA, 2017; pp. 1–8. [Google Scholar]
  20. Li, Y.; Yang, J.; Wang, J. DyLoRa: Towards energy efficient dynamic LoRa transmission control. In Proceedings of the IEEE INFOCOM 2020-IEEE Conference on Computer Communications, Toronto, ON, Canada, 6–9 July 2020; IEEE: Piscataway, NJ, USA, 2020; pp. 2312–2320. [Google Scholar]
  21. Liu, X.; Qin, Z.; Gao, Y.; McCann, J.A. Resource allocation in wireless powered IoT networks. IEEE Internet Things J. 2019, 6, 4935–4945. [Google Scholar] [CrossRef] [Green Version]
  22. Gao, W.; Zhao, Z.; Min, G. AdapLoRa: Resource adaptation for maximizing network lifetime in LoRa networks. In Proceedings of the 2020 IEEE 28th International Conference on Network Protocols (ICNP), Madrid, Spain, 13–16 October 2020; IEEE: Piscataway, NJ, USA, 2020; pp. 1–11. [Google Scholar]
  23. Park, J.; Park, K.; Bae, H.; Kim, C.-K. EARN: Enhanced ADR with coding rate adaptation in LoRaWAN. IEEE Internet Things J. 2020, 7, 11873–11883. [Google Scholar] [CrossRef]
  24. Medeiros, A.; Silva, J.; De Sousa Junior, V.A.; Bezerra, N. Spreading Factor Assignment Strategy for Coverage and Capacity Flexible Tradeoff. J. Commun. Inf. Syst. 2022, 37, 47–51. [Google Scholar]
  25. Meana-Llorián, D.; García, C.G.; G-bustelo BC, P.; Lovelle JM, C.; Garcia-Fernandez, N. IoFClime: The fuzzy logic and the Internet of Things to control indoor temperature regarding the outdoor ambient conditions. Future Gener. Comput. Syst. 2017, 76, 275–284. [Google Scholar] [CrossRef] [Green Version]
  26. Hosseinzadeh, S.; Larijani, H.; Curtis, K.; Wixted, A. An adaptive neuro-fuzzy propagation model for LoRaWAN. Appl. Syst. Innov. 2019, 2, 10. [Google Scholar] [CrossRef] [Green Version]
  27. Gupta, S.; Snigdh, I.; Sahana, S.K. A Fuzzy Logic Approach for Predicting Efficient LoRa Communication. Int. J. Fuzzy Syst. 2022, 24, 2591–2599. [Google Scholar] [CrossRef]
  28. Semtech. Modulation Basics Application Note AN1200. 22. Semtech Corporation-Wireless Sensing and Timing Products Division; Semtech: Camarillo, CA, USA, 2015. [Google Scholar]
  29. Alliance, L. LoRaWAN 1.1 Regional Parameters. 2017. Available online: https://lora-alliance.org/resource_hub/rp2-1-0-3-lorawan-regional-parameters/ (accessed on 7 July 2021).
  30. Alliance, L.; LoRaWAN 1.0. 3 Specification. Available online: https://lora-alliance.org/resource-hub/lorawanr-specification-v103 (accessed on 1 August 2021).
  31. Kufakunesu, R.; Hancke, G.P.; Abu-Mahfouz, A.M. A Survey on Adaptive Data Rate Optimization in LoRaWAN: Recent Solutions and Major Challenges. Sensors 2020, 20, 5044. [Google Scholar] [CrossRef]
  32. Haxhibeqiri, J.; De Poorter, E.; Moerman, I.; Hoebeke, J. A survey of lorawan for iot: From technology to application. Sensors 2018, 18, 3995. [Google Scholar] [CrossRef] [PubMed] [Green Version]
  33. Castro, J.L. Fuzzy logic controllers are universal approximators. IEEE Trans. Syst. Man Cybern. 1995, 25, 629–635. [Google Scholar] [CrossRef]
  34. Kosko, B. Fuzzy systems as universal approximators. IEEE Trans. Comput. 1994, 43, 1329–1333. [Google Scholar] [CrossRef]
  35. Timothy, J. Fuzzy Logic with Engineering Applications; Wiley: Hoboken, NJ, USA, 2016. [Google Scholar]
  36. Zadeh, L.A.; Klir, G.J.; Yuan, B. Fuzzy Sets, Fuzzy Logic, and Fuzzy Systems: Selected Papers; World Scientific: Singapore, 1996. [Google Scholar]
  37. Mamdani, E.H.; Assilian, S. An experiment in linguistic synthesis with a fuzzy logic controller. Int. J. Man-Mach. Stud. 1975, 7, 1–13. [Google Scholar] [CrossRef]
  38. Rada-Vilela, J.F. A fuzzy logic control library in C++. In Proceedings of the Open Source Developers Conference, Auckland, New Zealand, 21–23 October 2013. [Google Scholar]
  39. Sobhy, S.M.; Khedr, W.M. Developing of fuzzy logic controller for air condition system. Int. J. Comput. Appl. 2015, 126, 1–8. [Google Scholar]
  40. Semtech. SX1301 Data Sheet_v2.4. Available online: https://www.semtech.com/products/wireless-rf/lora-core/sx1301 (accessed on 12 November 2021).
  41. Semtech. SX1272 Data Sheet_v4. Available online: https://www.semtech.com/products/wireless-rf/lora-core/sx1272 (accessed on 12 November 2021).
  42. Gaussian Waves. Log Distance Model. Available online: https://www.gaussianwaves.com/2013/09/log-distance-path-loss-orlog-normal-shadowing-model/ (accessed on 7 August 2021).
  43. Sandoval, R.M.; Garcia-Sanchez, A.-J.; Garcia-Haro, J. Optimizing and Updating LoRa Communication Parameters: A Machine Learning Approach. IEEE Trans. Netw. Serv. Manag. 2019, 16, 884–895. [Google Scholar] [CrossRef]
  44. A Discrete-Event Network Simulator for Internet Systems. Available online: https://www.nsnam.org/ (accessed on 30 May 2021).
  45. da Silva, J.C.; Flor DD, L.; de Sousa Junior, V.A.; Bezerra, N.S.; de Medeiros, A.A. A Survey of LoRaWAN Simulation Tools in ns-3. J. Commun. Inf. Syst. 2021, 36, 17–30. [Google Scholar] [CrossRef]
  46. Magrin, D.; Centenaro, M.; Vangelista, L. Performance evaluation of LoRa networks in a smart city scenario. In Proceedings of the 2017 IEEE International Conference on communications (ICC), Paris, France, 21–25 May 2017; IEEE: Piscataway, NJ, USA, 2017; pp. 1–7. [Google Scholar]
  47. Reynders, B.; Wang, Q.; Pollin, S. A LoRaWAN module for ns-3: Implementation and evaluation. In Proceedings of the 10th Workshop on ns-3, Surathkal, India, 13–14 June 2018; pp. 61–68. [Google Scholar]
  48. Van den Abeele, F.; Haxhibeqiri, J.; Moerman, I.; Hoebeke, J. Scalability analysis of large-scale LoRaWAN networks in ns-3. IEEE Internet Things J. 2017, 4, 2186–2198. [Google Scholar] [CrossRef] [Green Version]
  49. To, T.-H.; Duda, A. Simulation of lora in ns-3: Improving lora performance with csma. In Proceedings of the 2018 IEEE International Conference on Communications (ICC), Kansas City, MO, USA, 20–24 May 2018; IEEE: Piscataway, NJ, USA, 2018; pp. 1–7. [Google Scholar]
  50. Magrin, D.; Capuzzo, M. LoRaWAN ns-3 Module. Available online: https://github.com/signetlabdei/lorawan (accessed on 30 May 2021).
  51. Citoni, B.; Ansari, S.; Abbasi, Q.H.; Imran, M.A.; Hussain, S. Impact of Inter-Gateway Distance on LoRaWAN Performance. Electronics 2021, 10, 2197. [Google Scholar] [CrossRef]
Figure 1. Adaptive data rate flow ED side [32].
Jsan 11 00065 g001
Figure 2. S N R m a r g i n membership function.
Jsan 11 00065 g002
Figure 3. TPnew membership function.
Jsan 11 00065 g003
Figure 4. SFnew membership function.
Jsan 11 00065 g004
Figure 5. The total energy consumption: (a) data interval vs. total consumed energy; (b) no. EDs vs. total consumed energy.
Jsan 11 00065 g005
Figure 6. Successful reception rate: (a) data interval vs. avg. reception rate/load; (b) no. EDs vs. reception rate/load.
Jsan 11 00065 g006
Figure 7. Undersensitivity rate: (a) data interval vs. uplink packet delivery ratio; (b) no. EDs vs uplink packet delivery ratio.
Jsan 11 00065 g007
Figure 8. Interference/collision rate: (a) data interval vs. interference/collision rate; (b) no. EDs vs. interference/collision rate.
Jsan 11 00065 g008
Figure 9. Lost-Because-Busy Rate: (a) data interval vs. avg. lost-because-busy rate; (b) no. EDs vs. lost-because-busy rate.
Jsan 11 00065 g009
Figure 10. Energy Efficiency in terms of correctly received packets.
Jsan 11 00065 g010
Table 1. Summary of related work.
RefsSchemeObjectiveMetrics
[15]State-space modelCongestionInterference
[16]Gradient ProjectionThroughputChannel contention
[17]Logistic RegressionCongestionTransmission delay, received signal strength
[18]ADR+Link level performance, energy efficiencyPDR
[19]EXPLORAThroughputChannel contention, coverage, data extraction rate
[20]DyLoRaEnergy EfficiencySymbol error rate, PDR
[21]Efficient Channel Allocation Algorithm (ECAA)ThroughputChannel contention
[22]AdapLoRaFrequency estimation, energy efficiencyNetwork lifetime, residual network energy
[23]BE-LoRaLink level performance, energy efficiencyPDR, packet success rate
[23]EARNCode rate modification, energy efficiencyCollision probability
Proposed FL-ADREnergy efficiencyPDR, CPSR, collision rate
Table 4. Features of the three ADR algorithms under consideration.
Semtech-ADRns-3-ADRFL-ADR
20 packets4 packets4 packets
Maximum SNRMinimum SNRAverage SNR
S N R m a r g i n (Equation (5)) S N R m a r g i n   calculation   excludes   D m a r g i n S N R m a r g i n (Equation (5))
S N R m a r g i n /3 S N R m a r g i n /3No steps required
Uses 3 dB steps to adjust TP Uses 2 dB steps to adjust TPUses fuzzy logic
Publisher’s Note: MDPI stays neutral with regard to jurisdictional claims in published maps and institutional affiliations.

