Communication

Discovery of Dihydrophaseic Acid Glucosides from the Florets of Carthamus tinctorius

1
School of Pharmacy, Sungkyunkwan University, Suwon 16419, Korea
2
Laboratory of Nuclear Magnetic Resonance, National Center for Inter-University Research Facilities (NCIRF), Seoul National University, Gwanak-gu, Seoul 08826, Korea
3
School of Chemical Engineering, Sungkyunkwan University, Suwon 16419, Korea
*
Authors to whom correspondence should be addressed.
These authors contributed equally to this study.
Plants 2020, 9(7), 858; https://doi.org/10.3390/plants9070858
Submission received: 1 June 2020 / Revised: 3 July 2020 / Accepted: 3 July 2020 / Published: 7 July 2020
(This article belongs to the Special Issue 2019 Feature Papers by Plants’ Editorial Board Members)

Abstract

:
Carthamus tinctorius L. (Compositae; safflower or Hong Hua) has been used in Korean traditional medicine for maintaining the homeostasis of body circulation. Phytochemical investigation was performed on the florets of C. tinctorius by liquid chromatography–mass spectrometry (LC/MS), which afforded two dihydrophaseic acid glucosides (1 and 2). Isolated compounds were structurally confirmed using a combination of spectroscopic methods including 1D and 2D nuclear magnetic resonance and high-resolution electrospray ionization mass spectroscopy. Their absolute configurations were established by quantum chemical electronic circular dichroism calculations and enzymatic hydrolysis. The anti-adipogenesis activity of the isolated compounds was evaluated using 3T3-L1 preadipocytes. Treatment with the dihydrophaseic acid glucoside (1) during adipocyte differentiation prevented the accumulation of lipid droplets and reduced the expression of adipogenic genes, Fabp4 and Adipsin. However, compound 2 did not affect adipogenesis. Our study yielded a dihydrophaseic acid glucoside derived from C. tinctorius, which has potential advantages for treating obesity.

Graphical Abstract

1. Introduction

Safflower, Carthamus tinctorius L., commonly known as Honghua, is a highly branched and thistle-like annual plant that is dispersed over regions of Korea, Japan, China, and Russia. This plant has been used in Chinese traditional medicine for various purposes, such as promoting blood circulation and menstruation, and alleviating pain [1]. C. tinctorius is also used as a nutraceutical in Korea owing to its effect in maintaining the homeostasis of body circulation [2]. In practice, the pistil of C. tinctorius, well-known as saffron, is widely used as a spice and an edible dying agent in various European dishes, including paella, risotto, and pasta. In fact, saffron has bFeen the world’s most expensive spice by weight for a long time, and its historical use has been proven to be used in the seventh century BC in an Assyrian botanical treatise [3]. Carthamin, one of the main components of C. tinctorius, has been used as a yellow, orange, and pink dying agent for clothes and fabrics. In earlier studies, phytochemical investigation of C. tinctorius revealed the presence of major compounds, such as quinochalcones—including carthamin, safflower yellow, and safflomin—flavonoids, alkaloids, and polyacetylenes [4]; moreover, some studies show that the polyacetylenes from C. tinctorius inhibit NO release, thus showing its potential use as a medicine for inflammatory diseases [5].
Plant hormones are natural products or organic substances with low-molecular-weight that can regulate essentially many physiological and developmental processes at micromolar (or even lower) concentrations during the life cycle of a plant [6]. Structurally diverse plant hormones have been reported; these include auxins, cytokinins, abscisic acids, gibberellins, ethylene, polyamines, jasmonates, salicylic acids, brassinosteroids, and dihydrophaseic acids [6]. Among these plant hormones, dihydrophaseic acids are apocarotenoid sesquiterpenoids, which are phaseic acids in which the keto group has been reduced to the corresponding alcohol, resulting in two hydroxy groups being positioned at the opposite sides of the six-membered ring. Previously, a dihydrophaseic acid has been reported from the flowers of C. tinctorius, and was identified as 4′-O-dihydrophaseic acid-β-D-glucopyranoside methyl ester [7]. Previous studies have shown that various plant hormones from biosynthetic pathways have been demonstrated to exhibit biological activities, including antimycobacterial [8], cytotoxic [9], and phytotoxic [10] effects.
As a part of an ongoing effort to discover natural products that are structurally unique and/or biologically significant compounds from natural sources [11,12,13,14,15], phytochemical investigations on the methanol (MeOH) extract of the florets of C. tinctorius was undertaken. Chemical isolation and purification using liquid chromatography/mass spectroscopy (LC/MS) resulted in identification of two dihydrophaseic acid glucosides (1 and 2) (Figure 1). Their structures were determined by a combination of 1D and 2D nuclear magnetic resonance (NMR) spectroscopy and high-resolution (HR)-electrospray ionization-mass spectroscopy (ESI-MS) data. Furthermore, the absolute configurations of 1 and 2 were assigned by quantum chemical electronic circular dichroism (ECD) calculations and enzymatic hydrolysis. In addition, we evaluated the inhibitory effects of the isolates on the differentiation of 3T3-L1 adipocytes. In the present study, isolation and structural identification of 1 and 2 is demonstrated, as well as the significant inhibitory effects of compound 1 on lipid accumulation and adipogenic gene expression.

2. Results and Discussion

2.1. Isolation of Compounds

The dried florets of C. tinctorius were extracted using 80% aqueous MeOH under reflux to obtain the crude methanol extract, which was then subjected to solvent-partitioning with four solvents (hexane, dichloromethane, ethyl acetate, and n-butanol). Of the four solvent soluble fractions, EtOAc-soluble fraction was established with various column chromatography and high-performance liquid chromatography (HPLC) monitored with LC/MS analysis combined with our in-house UV library. The LC/MS-guided phytochemical analysis resulted in the isolation of two dihydrophaseic acid glucosides (1 and 2) (Figure 1).

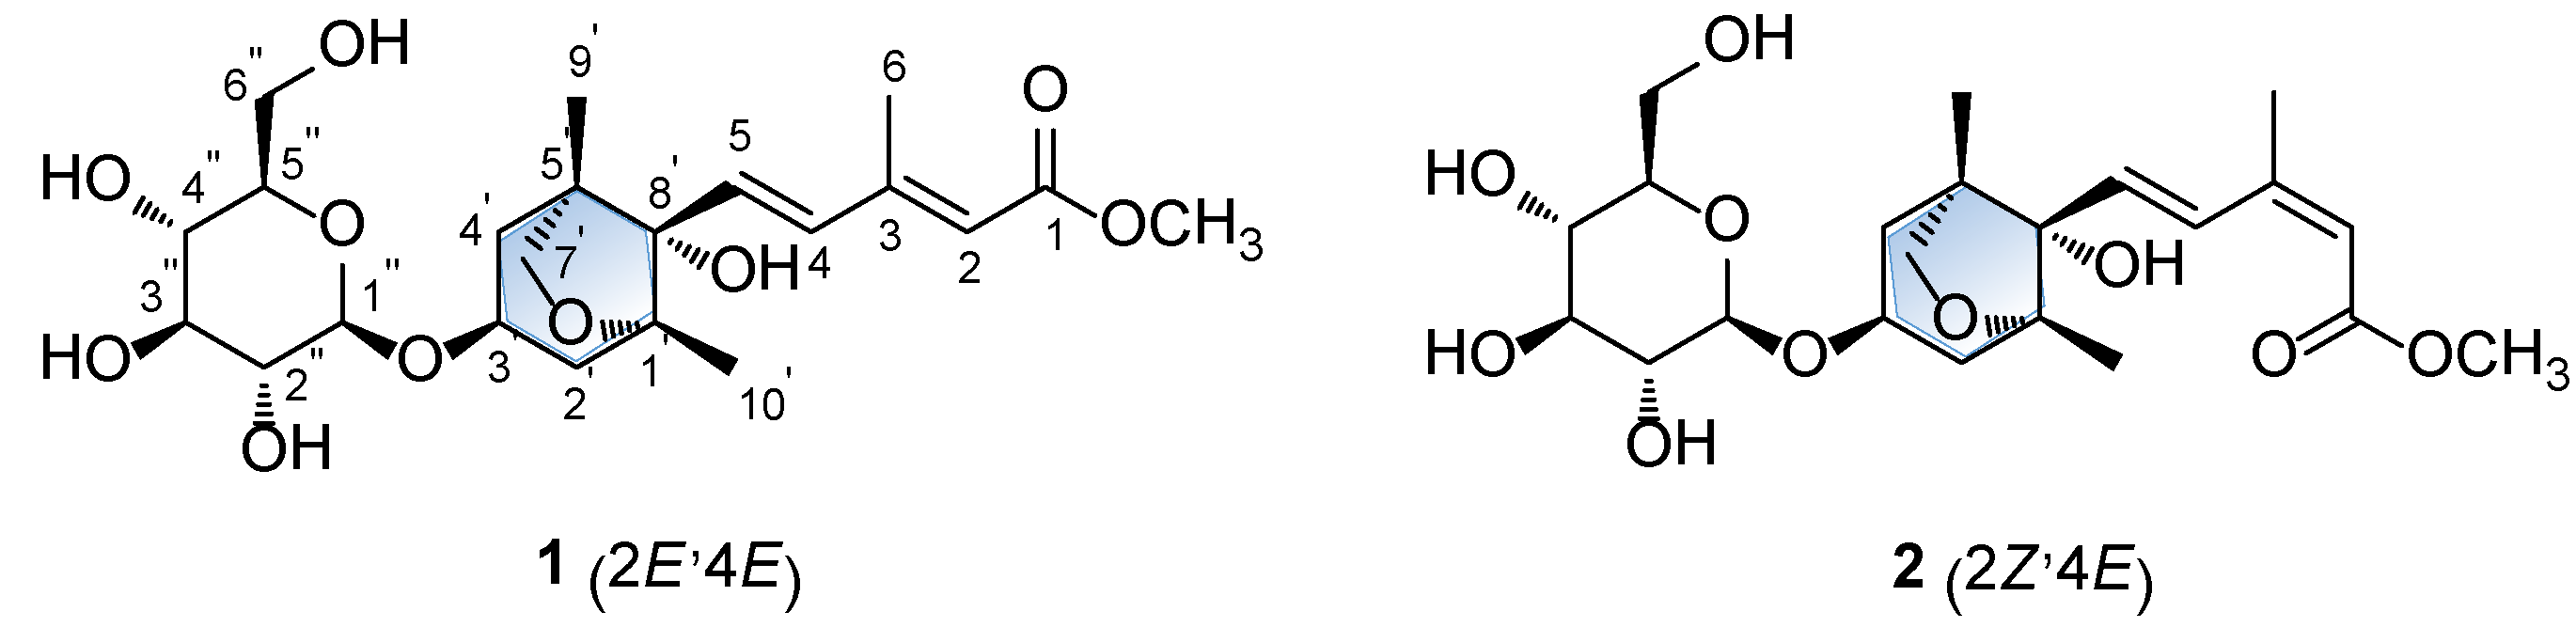
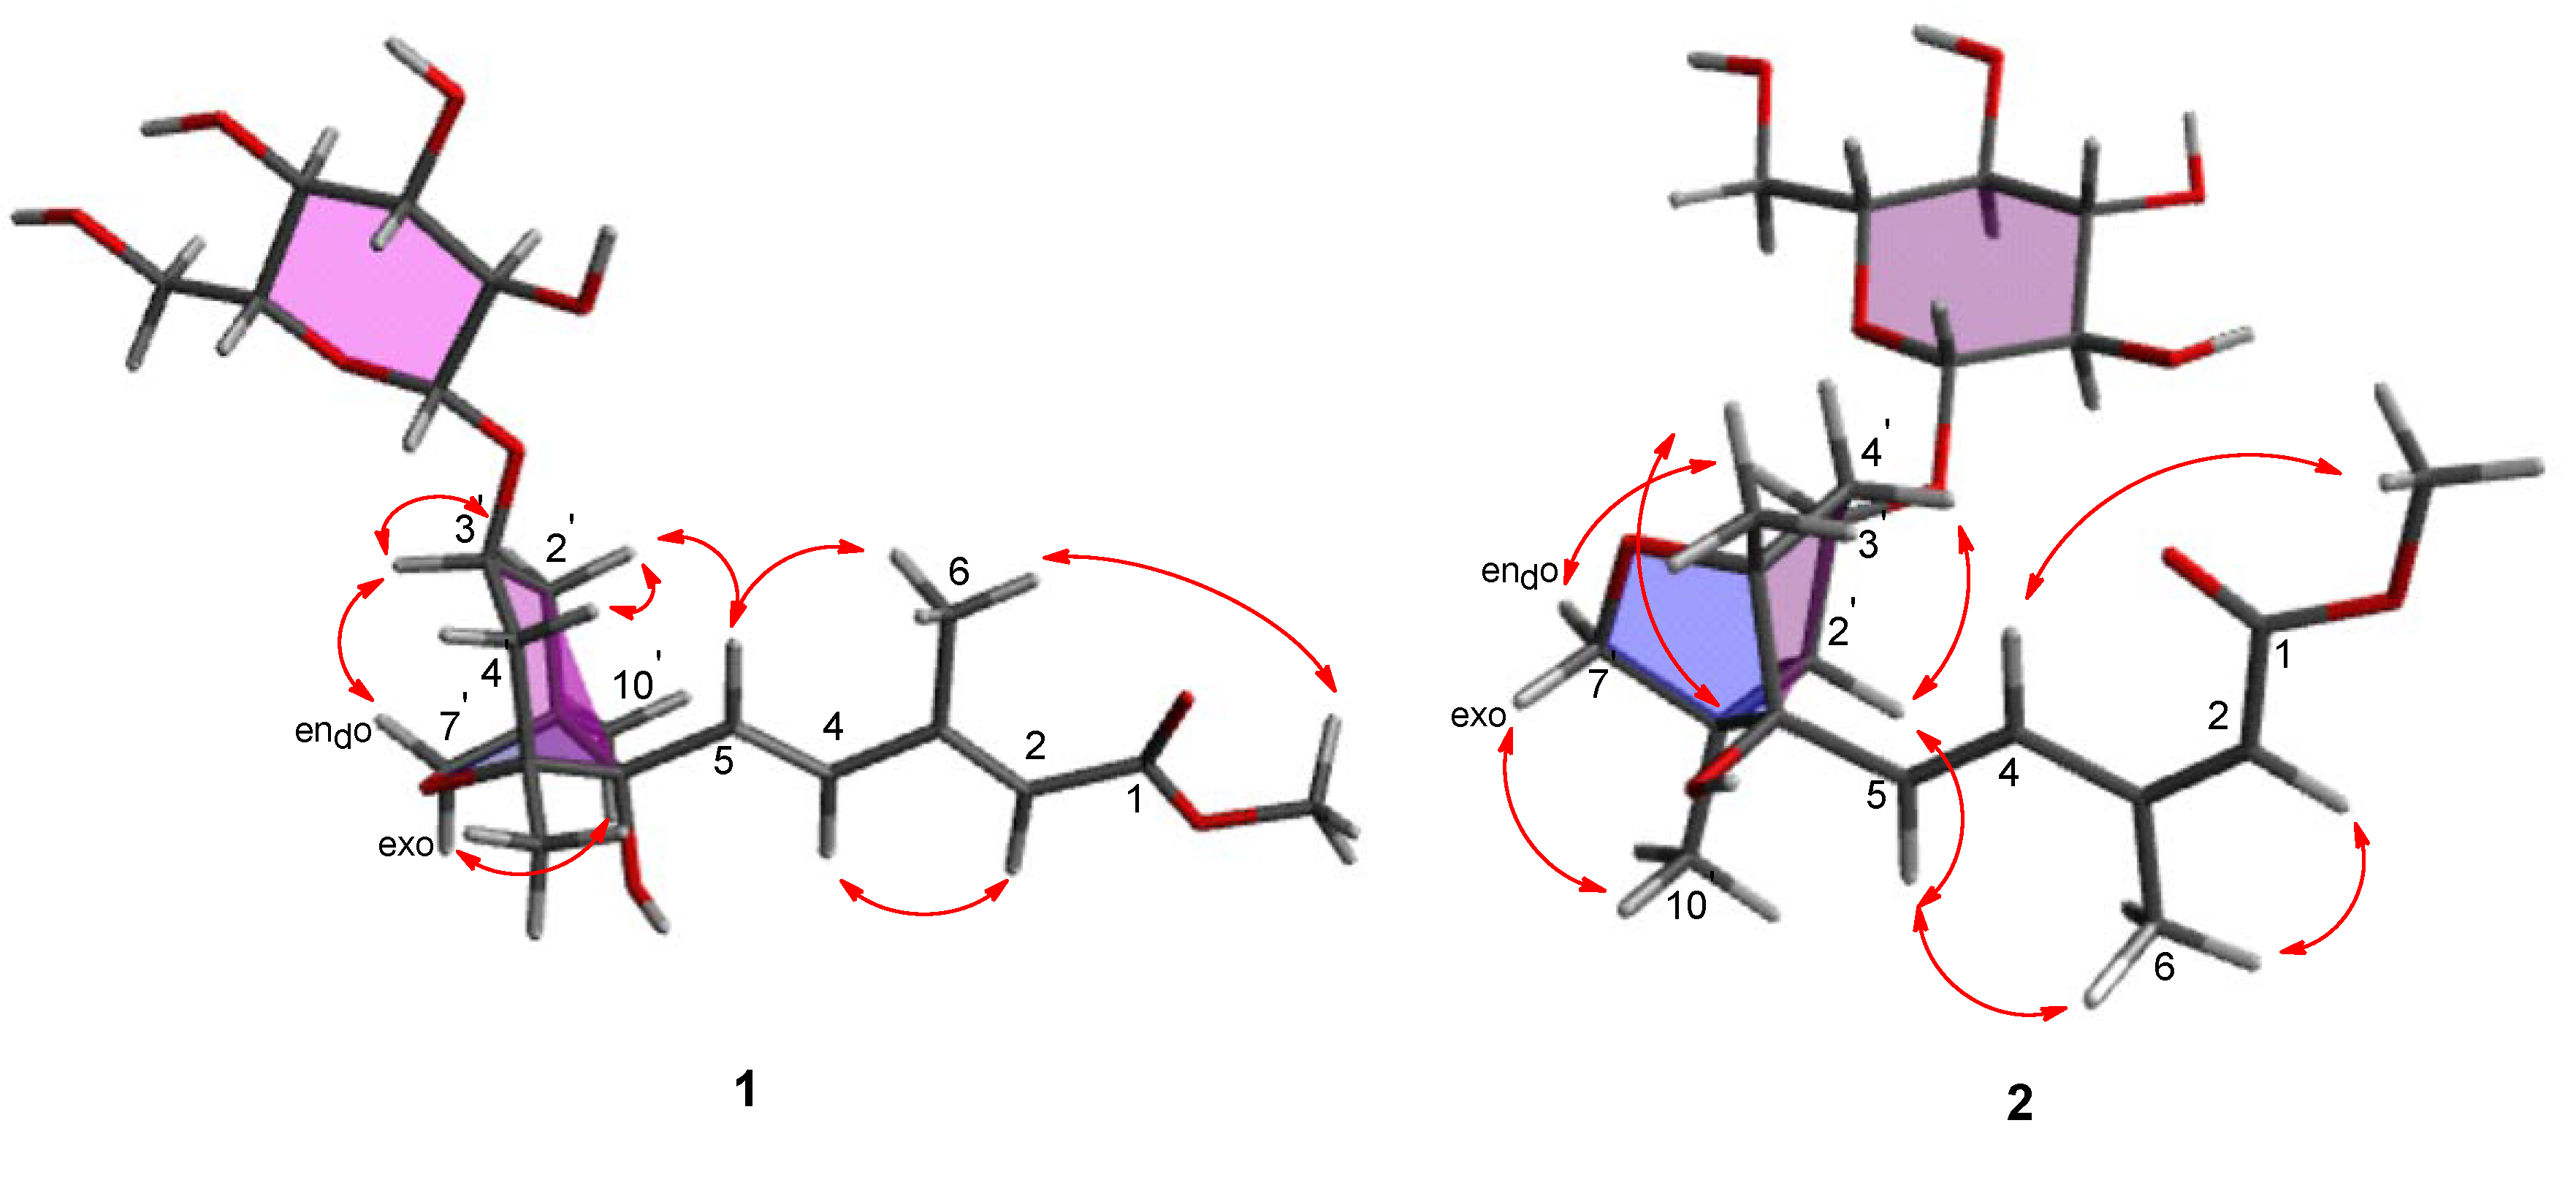
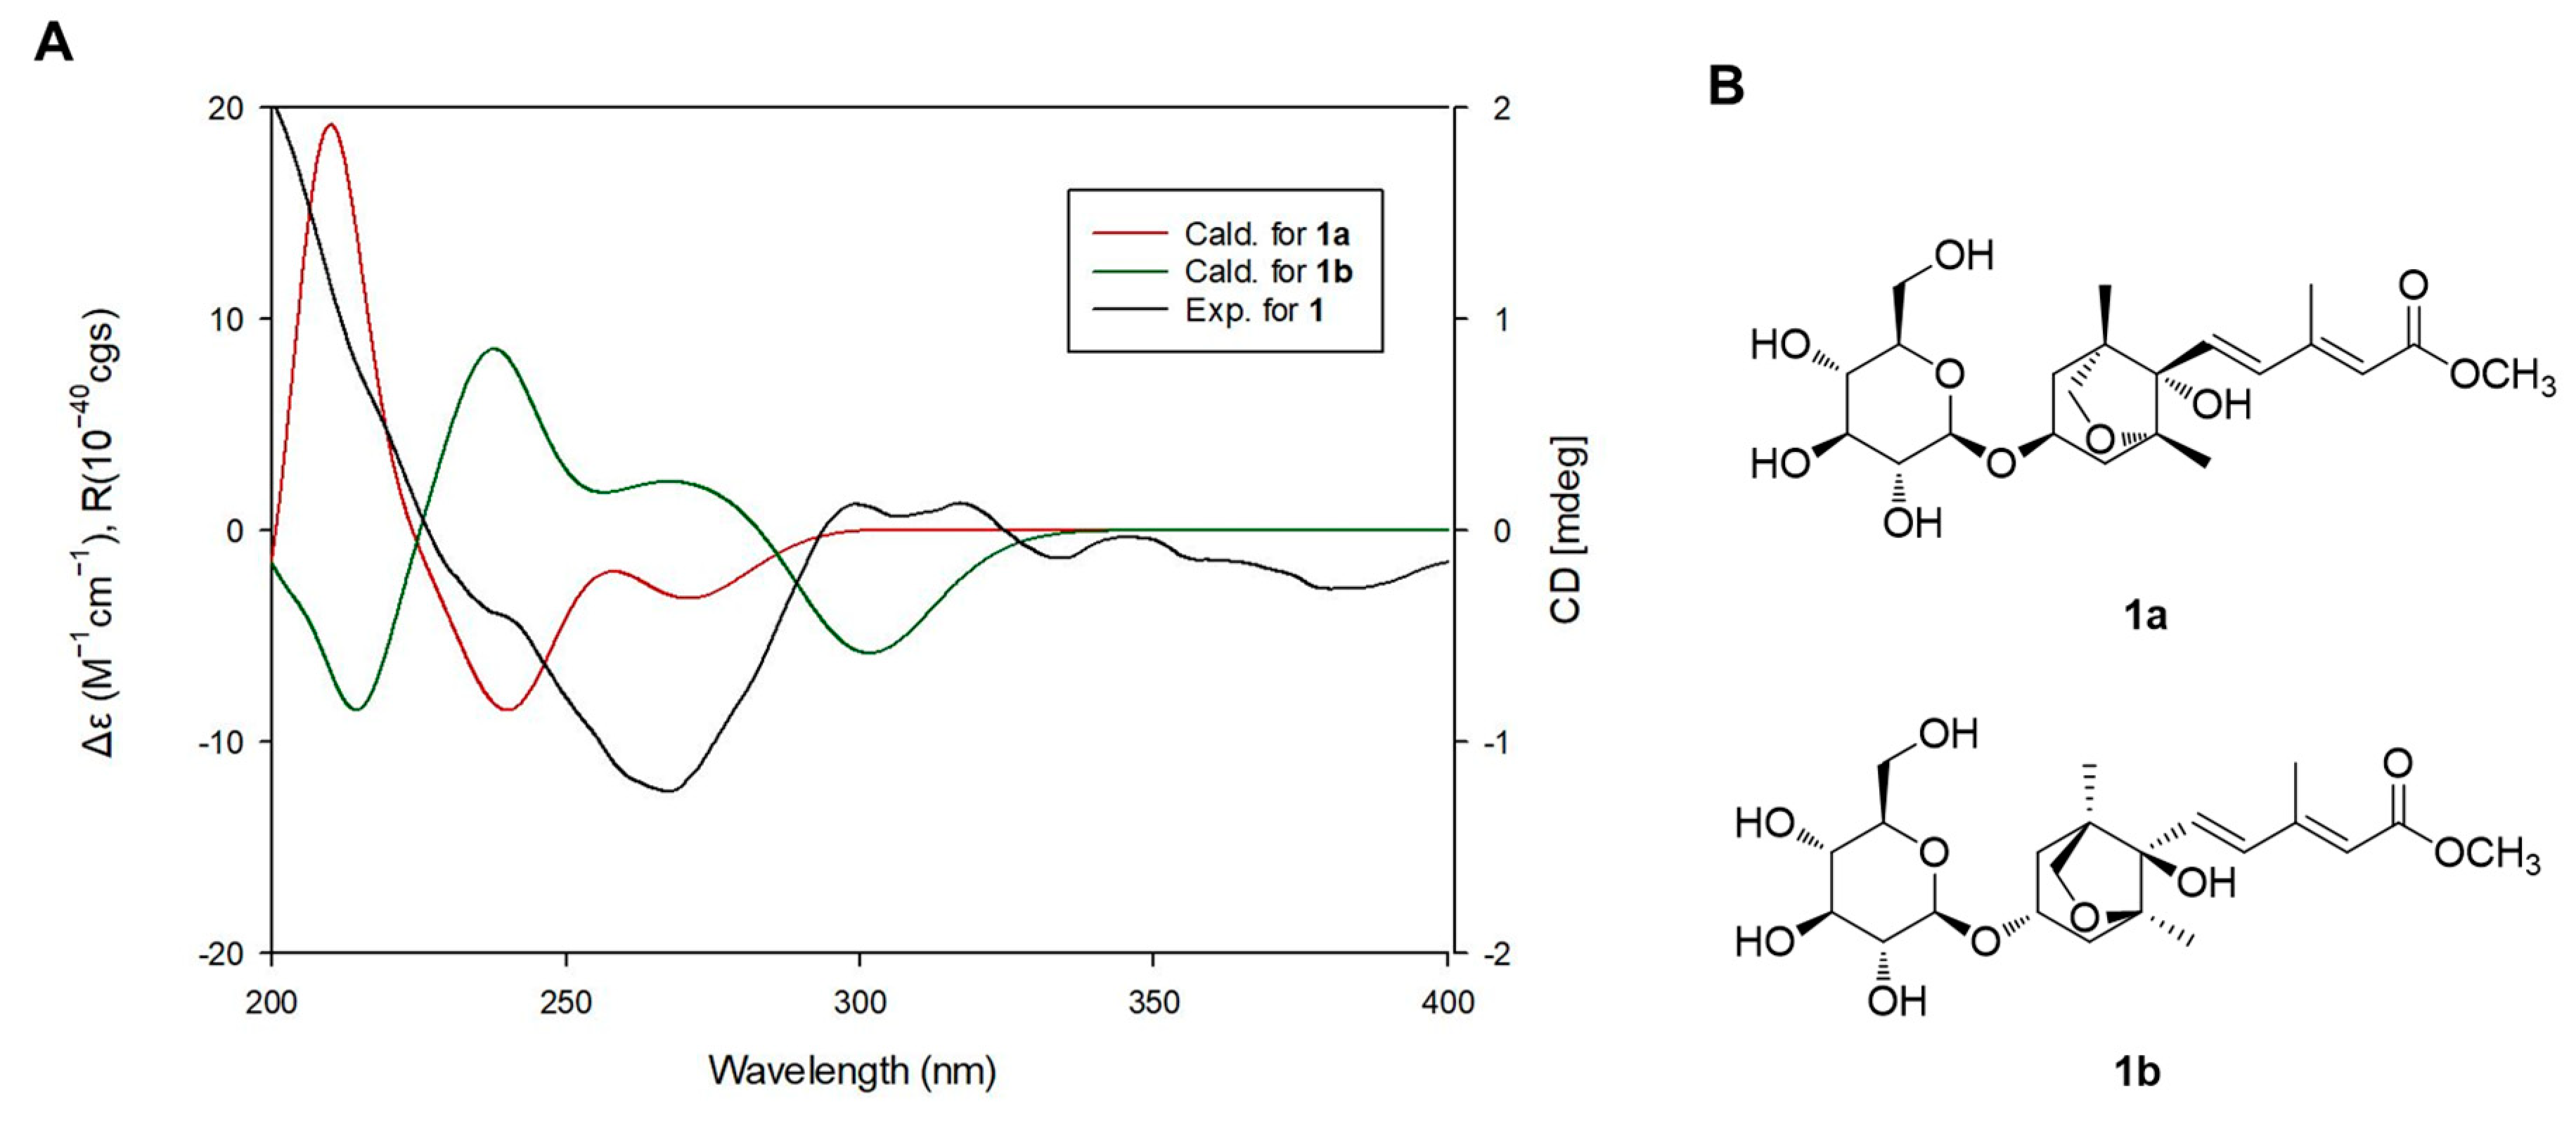
2.2. Elucidation of Compound Structures

Compound 1 was obtained as a white amorphous powder, and the molecular formula of 1 was established as C22H34O10 from the molecular ion peak [M + H]+ at m/z 459.2220 (calculated for C22H35O10 459.2230) in positive-ion HR-ESIMS (Figure S1). The 1H (Figure S2) and 13C NMR data of 1 are presented in Table 1, and the 13C NMR signals were determined based on heteronuclear multiple bond correlation (HMBC) and heteronuclear single quantum coherence (HSQC). Interpretation of the 1H and 13C NMR data of 1 showed close similarities with those of (2Z,4E)-dihydrophaseic acid methyl ester-3-O-β-D-glucopyranoside (2), which was isolated in this study, and identified by comparing their NMR assignment with reported values [16,17] as well as by LC/MS analysis. However, differences in resonance were observed for the olefinic signals of H-4 (δH 6.66/δC 137.3 in 1; δH 8.01/δC 131.5 in 2) and H-6 (δH 2.34/δC 13.9 in 1; δH 2.09/δC 20.8 in 2) in the 3-methyl-penta-2,4-dienoic acid methyl ester group [7], which suggested that compound 1 may be a geometric isomer of 2. Accordingly, the NMR data (Table 1) of compounds 1 and 2 were compared to verify their stereochemical difference. First, the complete planar structure of 1 was confirmed by 2D NMR [1H-1H COSY (Figure S3), HSQC (Figure S4), and HMBC (Figure S5)]. The connectivity of the bicycle moiety with the 3-methyl-penta-2,4-dienoic acid methyl ester was established on the HMBC cross-peaks from H-4 to C-8’ (Figure 2). The HMBC correlation of the anomeric proton at δH 4.37 (H-1’’) and C-3’ suggested evidence for the presence of a glucose group at C-3 (Figure 2). The complete gross structure of 1 was further elucidated based on the additional correlations in the 1H-1H COSY and HMBC spectra (Figure 2). Thus, compound 1 was determined to share the same planar structure with 2.
The relative configuration of 1 was identified by rotating frame Overhauser effect spectroscopy (ROESY) (Figure S6) (Figure 3). The ROESY correlations between H-2’ax and H-4’ax/H-5 proved that these protons are positioned on the same side (β axial) in the system of cyclohexane ring. Further, the correlation of the oxymethine proton H-3’ with H-2’eq/H-7’endo and H-7’exo with H-10’ was observed in the ROESY spectrum (Figure 3), which indicated that the oxymethine H-3’ proton are in the same side (α face) as an oxymethylene H-7’ in the cyclohexane ring. Thus, the relative configuration of 1 was unambiguously assigned as 1’R*,3’S*,5’R*,8’S*. In contrast, the geometry of the 3-methyl-penta-2,4-dienoic acid methyl ester group was determined by the analysis of the vicinal 1H coupling constant and the ROESY correlations (Figure 3). The olefin Δ4/5 in compound 1 was determined as a trans-conformation based on the vicinal 1H coupling constant (J4,5 = 15.5 Hz) [18]. The geometry of olefin Δ2/3 was assigned by comparing the results of ROESY analysis for compounds 1 and 2. The ROESY spectrum of 1 did not have a correlation between H-2 and H-6, whereas the that of 2 displayed a correlation between H-2 and H-6. In addition, the ROESY correlations of H-5/H-6, H-2/H-4, and H-6/OCH3 were observed in compound 1, whereas the ROESY correlations of H-5/H-6 and H-4/OCH3 were observed in compound 2 (Figure 3). These results provided strong evidence that compound 1 had 2E and 4E olefinic double bonds.
LC/MS-UV-based method was performed to confirm the absolute configuration of the sugar unit [16] and enzymatic hydrolysis of 1 with hesperidinase resulted in the production of a glucopyranose. The absolute sugar configuration was confirmed as D- form by comparing the retention time of its thiocarbamoyl-thiazolidine derivative with the time of the standard sample (D-glucopyranose) from LC/MS analysis. The coupling constant (J = 8.0 Hz) of anomeric proton signal was typical of the β-form of glucopyranose [16], which indicated that the sugar unit is a β-D-glucopyranose. Finally, to verify the absolute configuration of 1, two possible isomers, 1a (2E,4E,1’R,3’S,5’R,8’S) and 1b (2E,4E,1’S,3’R,5’S,8’R), were used for ECD calculations utilizing time-dependent-density-functional theory (TD-DFT) at the B3LYP/def2-TZVPP//B3LYP/def-SV(P) level for all atoms. The results showed that the ECD curve of 1a (red line) was consistent with the experimental ECD spectrum of 1 (Figure 4). Thus, the absolute configuration of 1 was determined as 2E,4E,1’R,3’S,5’R,8’S, and the structure of 1 was elucidated as (2E,4E)-dihydrophaseic acid methyl ester-3-O-β-D-glucopyranoside. To the best of our knowledge, recently, free acid and glucoside ester of compound 1 were reported from Annona glabra fruit [19].

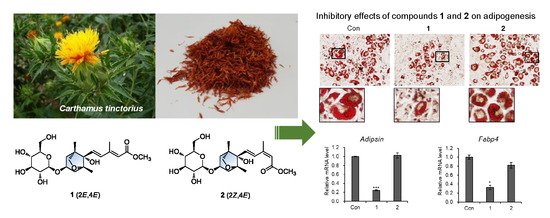
2.3. Inhibitory Effects of Compounds 1 and 2 on Adipogenesis in 3T3-L1 Preadipocytes

The isolated compounds 1 and 2 were evaluated for their antiadipogenic properties [20,21,22], we independently treated 3T3-L1 cells with compounds 1 and 2 (20 μM, each) during adipogenesis (Figure 5A). Lipid droplets were visualized with Oil Red O staining, and the results showed that only compound 1 effectively inhibited de novo adipogenesis and lipid accumulation in adipocytes, whereas compound 2 did not alter the number of adipocytes or the size of lipid droplets (Figure 5B). Likely, the transcription levels of mature adipocyte marker genes (Adipsin and Fabp4) were significantly decreased upon exposure to compound 1, but were not affected by compound 2 (Figure 5C). These data indicated that adipogenesis of preadipocytes is prevented only by the compound 1.

3. Materials and Methods

3.1. Plant Material

The florets of C. tinctorius were collected in Pocheon, Gyeonggi-do, Korea and purchased from Dongyang Pharm in September 2018. Detailed information is provided in the Supplementary Materials.

3.2. Extraction and Isolation

The florets of C. tinctorius (1.8 kg) were extracted using 80% aqueous MeOH (each 20 L × 2 days) at room temperature and filtered, and then combined and concentrated under vacuum pressure using a rotary evaporator, which gave a MeOH extract (530.0 g). The MeOH extract was divided in half, suspended in distilled water (700 mL, each), and then solvent partitioned with hexane, dichloromethane, ethyl acetate, and n-butanol. Four layers were solvent-partitioned, and hexane-soluble (37.6 g), CH2Cl2-soluble (3.3 g), EtOAc-soluble (10.4 g), and BuOH-soluble fractions (57.3 g) were obtained. After solvent-partition, the residue was solvent partitioned again with acetone, affording an acetone-soluble fraction (68.7 g). The EtOAc-soluble layer (10.4 g) was applied to silica gel column chromatography (300 g, eluted with CH2Cl2/MeOH (50:1→1:1, v:v) gradient solvent system, and washed with 90% MeOH) to yield seven fractions (E1‒E7). Fraction E5 (3.2 g) was separated by MPLC Yamazen UNIVERSAL Premium ODS-SM column with MeOH/H2O (30-100% MeOH) to yield five subfractions (E51‒E55). Subfraction E52 (638.7 mg) was subjected to Sephadex LH-20 with 100% MeOH to yield three subfractions (E521‒E523). Subfraction E521 (267.2 mg) was separated by preparative reversed-phase HPLC with a gradient solvent system of MeOH/H2O (50‒100% MeOH) to yield five subfractions (E5211‒E5215). Subfraction E5212 (87 mg) was subjected to silica gel column chromatography [3.0 g, eluted with CH2Cl2/MeOH (50:1→1:1) gradient solvent system, and washed with 90% MeOH] to yield five subfractions (E52121‒E52125). Subfraction E52124 (34.4 mg) was purified by semipreparative HPLC (35% MeOH) to yield compounds 2 (tR 39.0 min, 2.6 mg) and 1 (tR 39.5 min, 0.9 mg).

(2E,4E)-Dihydrophaseic Acid Methyl Ester-3-O-β-D-Glucopyranoside (1)

White, amorphous powder; [ α ] D 25 − 10.0 (c = 0.03, MeOH); UV (MeOH) λmax nm (log ε): 197 (1.17), 215 (0.64), 271 (3.45); IR (KBr) νmax cm-1: 3302, 2915, 1698, 1615, 1452, 1040; 1H (850 MHz) and 13C (212.5 MHz) NMR data, see Table 1; ESIMS (positive-ion mode) m/z 481 [M+Na]+; HR-ESIMS (positive-ion mode) m/z 459.2220 [M + H]+ (calculated for C22H35O10 459.2230).

3.3. Computational Analysis

To acquire the optimal conformation of 1a/1b, computational DFT calculations were performed [23,24,25,26,27]. Detailed information is provided in the section of computational analysis in Supplementary Materials.

3.4. Enzymatic Hydrolysis and Absolute Configuration Determination of the Sugar Moiety

The absolute configuration of the sugar moiety was determined using an LC/MS-UV-based method [16]. Detailed information is provided in the section of enzymatic hydrolysis in Supplementary Materials.

3.5. Cell Culture and Differentiation

3T3-L1 preadipocytes, purchased from the American Type Culture Collection (ATCC® CL-173™), were grown in Dulbecco′s Modified Eagle′s Medium (DMEM) supplemented with 10% bovine calf serum and 1% penicillin/streptomycin (P/S). Detailed information is provided in the section of cell culture and differentiation in Supplementary Materials.

3.6. Oil Red O Staining

Oil Red O staining was conducted to visualize lipid droplets accumulated in adipocytes. Detailed information is provided in the section of Oil Red O staining in Supplementary Materials.

3.7. Reverse Transcription and Quantitative Real-Time PCR

To detect RNA expression, total RNA was extracted from adipocytes utilizing Easy-Blue reagent (Intron Biotechnology). The detailed information is provided in the section of reverse transcription and quantitative real-time PCR in Supplementary Materials. The sequences of the qPCR primers were as followed:
  • β-actin forward, 5′-ACGGCCAGGTCATCACTATTG-3′
  • β-actin reverse, 5′-TGGATGCCACAGGATTCCA-3′
  • Adipsin forward, 5′-CATGCTCGGCCCTACATG-3′
  • Adipsin reverse, 5′-CACAGAGTCGTCATCCGTCAC-3′
  • Fabp4 forward, 5′-AAGGTGAAGAGCATCATAACCCT-3′
  • Fabp4 reverse, 5′-TCACGCCTTTCATAACACATTCC-3′

3.8. Statistical Analysis

The significance of the results was evaluated using two-tailed Student’s t-test in MS Excel. Significance was judged based on the p-value. Data represent the mean ± SEM for n = 3. * p < 0.05, ** p < 0.01, *** p < 0.001.

4. Conclusions

To conclude, this study elaborated on the phytochemical analysis of the MeOH extracts of the florets of C. tinctorius and the isolation of two dihydrophaseic acid glucosides (1 and 2). Compound 1 was configured as (2E,4E)-dihydrophaseic acid methyl ester-3-O-β-D-glucopyranoside, and the absolute configurations of 1 were elucidated by quantum chemical ECD calculations and enzymatic hydrolysis. Compound 1 was identified to be a geometric isomer of 2. The antiadipogenic effects of the isolated compounds (1 and 2) were evaluated by lipid droplet staining and by determining the expression of adipogenic genes. Among the two, only compound 1 could effectively inhibit adipocyte generation. This result therefore provides a potential therapeutic strategy to prevent adipogenesis in obesity.

Supplementary Materials

The following are available online at https://www.mdpi.com/2223-7747/9/7/858/s1, General experimental procedures, 1D and 2D NMR, and HR-ESIMS of compound 1 are available online free of charge. Figure S1: The HRESIMS data of 1, Figure S2: The 1H NMR spectrum of 1 (CD3OD, 850 MHz), Figure S3: The 1H-1H COSY spectrum of 1, Figure S4: The HSQC spectrum of 1, Figure S5: The HMBC spectrum of 1, Figure S6: The ROESY spectrum of 1.

Author Contributions

Conceptualization, C.P. and K.H.K.; formal analysis, S.C.B., B.S.L., S.A.Y., J.S.Y., J.L. and Y.-J.K.; investigation, S.C.B., B.S.L. and S.A.Y.; writing—original draft preparation, S.A.Y., J.L. and K.H.K.; writing—review and editing, B.S.L., C.P. and K.H.K.; supervision, C.P. and K.H.K.; project administration, K.H.K.; and funding acquisition, K.H.K. All authors have read and agreed to the published version of the manuscript.

Funding

This work was supported by a National Research Foundation of Korea (NRF) grant funded by the Korean government (MSIT) (2018R1A2B2006879 and 2019R1A5A2027340).

Conflicts of Interest

The authors declare no conflict of interest.

References

  1. Delshad, E.; Yousefi, M.; Sasannezhad, P.; Rakhshandeh, H.; Ayati, Z. Medical uses of Carthamus tinctorius L. (Safflower): A comprehensive review from traditional medicine to modern medicine. Electron. Physician 2018, 10, 6672–6681. [Google Scholar] [CrossRef] [PubMed] [Green Version]
  2. Hong, H.; Kim, H.; Lee, T.; Kim, D.; Kim, H.; Choo, Y.; Park, Y.; Lee, Y.; Kim, C. Inhibitory effect of a Korean traditional medicine, Honghwain-Jahage (water extracts of Carthamus tinctorius L. seed and Hominis placenta) on interleukin-1-mediated bone resorption. J. Ethnopharmacol. 2002, 79, 143–148. [Google Scholar] [CrossRef]
  3. Russo, E.; Dreher, M.C.; Mathre, M.L. Women and Cannabis: Medicine, Science, and Sociology, 1st ed.; Haworth Press: New York, NY, USA, 2003; p. 6. [Google Scholar]
  4. Zhou, X.; Tang, L.; Xu, Y.; Zhou, G.; Wang, Z. Towards a better understanding of medicinal uses of Carthamus tinctorius L. in traditional Chinese medicine: A phytochemical and pharmacological review. J. Ethnopharmacol. 2014, 151, 27–43. [Google Scholar] [CrossRef] [PubMed]
  5. He, J.; Shen, Y.; Jiang, J.; Yang, Y.; Feng, Z.; Zhang, P.; Yuan, S.; Hou, Q. New polyacetylene glucosides from the florets of Carthamus tinctorius and their weak anti-inflammatory activities. Carbohydr. Res. 2011, 346, 1903–1908. [Google Scholar] [CrossRef] [PubMed]
  6. Chiwocha, S.D.; Abrams, S.R.; Ambrose, S.J.; Cutlerm, A.J.; Loewen, M.; Ross, A.R.; Kermodem, A.R. A method for profiling classes of plant hormones and their metabolites using liquid chromatography-electrospray ionization tandem mass spectrometry: An analysis of hormone regulation of thermodormancy of lettuce (Lactuca sativa L.) seeds. Plant J. 2003, 35, 405–417. [Google Scholar] [CrossRef]
  7. Jiang, J.S.; Xia, P.F.; Feng, Z.M.; Zhang, P.C. Chemical constituents from flowers of Carthamus tinctorius. Zhongguo Zhong Yao Za Zhi 2008, 33, 2911–2913. [Google Scholar]
  8. Clark, T.N.; Ellsworth, K.; Li, H.; Johnson, J.A.; Gray, C.A. Isolation of the plant hormone (+)-abscisic acid as an antimycobacterial constituent of the medicinal plant endophyte Nigrospora sp. Nat. Prod. Commun. 2013, 8, 1673–1674. [Google Scholar] [CrossRef] [Green Version]
  9. Kim, K.H.; Choi, S.U.; Lee, K.R. Diterpene Glycosides from the Seeds of Pharbitis nil. J. Nat. Prod. 2009, 72, 1121–1127. [Google Scholar] [CrossRef]
  10. Masi, M.; Meyer, S.; Cimmino, A.; Andolfi, A.; Evidente, A. Pyrenophoric acid, a phytotoxic sesquiterpenoid penta-2,4-dienoic acid produced by a potential mycoherbicide, Pyrenophora semeniperda. J. Nat. Prod. 2014, 77, 925–930. [Google Scholar] [CrossRef]
  11. So, H.M.; Eom, H.J.; Lee, D.; Kim, S.; Kang, K.S.; Lee, I.K.; Baek, K.-H.; Park, J.Y.; Kim, K.H. Bioactivity evaluations of betulin identified from the bark of Betula platyphylla var. japonica for cancer therapy. Arch. Pharm. Res. 2018, 41, 815–822. [Google Scholar]
  12. Yu, J.S.; Roh, H.-S.; Baek, K.-H.; Lee, S.; Kim, S.; So, H.M.; Moon, E.; Pang, C.; Jang, T.S.; Kim, K.H. Bioactivity-guided isolation of ginsenosides from Korean Red Ginseng with cytotoxic activity against human lung adenocarcinoma cells. J. Ginseng Res. 2018, 42, 562–570. [Google Scholar] [CrossRef] [PubMed]
  13. Baek, S.C.; Choi, E.; Eom, H.J.; Jo, M.S.; Kim, S.; So, H.M.; Kim, S.H.; Kang, K.S.; Kim, K.H. LC/MS-based analysis of bioactive compounds from the bark of Betula platyphylla var. japonica and their effects on regulation of adipocyte and osteoblast differentiation. Nat. Prod. Sci. 2018, 24, 235–240. [Google Scholar]
  14. Yu, J.S.; Lee, D.; Lee, S.R.; Lee, J.W.; Choi, C.-I.; Jang, T.S.; Kang, K.S.; Kim, K.H. Chemical characterization of cytotoxic indole acetic acid derivative from Mulberry fruit (Morus alba L.) against human cervical cancer. Bioorg. Chem. 2018, 76, 28–36. [Google Scholar] [CrossRef] [PubMed]
  15. Trinh, T.A.; Park, E.J.; Lee, D.; Song, J.H.; Lee, H.L.; Kim, K.H.; Kim, Y.; Jung, K.; Kang, K.S.; Yoo, J.E. Estrogenic activity of sanguiin H-6 through activation of estrogen receptor α coactivator-binding site. Nat. Prod. Sci. 2019, 25, 28–33. [Google Scholar] [CrossRef]
  16. Jo, M.S.; Yu, J.S.; Lee, J.C.; Lee, S.; Cho, Y.C.; Park, H.J.; Kim, K.H. Lobatamunsolides A–C, Norlignans from the Roots of Pueraria lobata and their Nitric Oxide Inhibitory Activities in Macrophages. Biomolecules 2019, 9, 755. [Google Scholar] [CrossRef] [Green Version]
  17. He, J.; Chen, Z.; Yang, Y.; Jiang, J.; Feng, Z.; Zhang, P. Chemical constituents from aqueous extract of Carthamus tinctorius. Chin. Pharm. J. 2014, 49, 455–458. [Google Scholar]
  18. Pavia, D.L.; Lampman, G.M.; Kriz, G.S.; Vyvyan, J.R. Introduction to Spectroscopy, 4th ed.; Cengage Learning: Stamford, CT, USA, 2008; pp. 237–297. [Google Scholar]
  19. Nguyen, T.T.H.; Nguyen, X.N.; Yen, D.T.H.; Hang, D.T.T.; Tai, B.H.; Quang, T.H.; Hoang, L.T.A.; Kiem, P.V.; Minh, C.V.; Kim, E.J.; et al. Chemical constituents of the Annona glabra fruit and their cytotoxic activity. Pharm. Biol. 2015, 53, 1602–1607. [Google Scholar]
  20. Lee, S.R.; Yi, S.A.; Nam, K.H.; Ryoo, R.; Lee, J.; Kim, K.H. Pantheric acids A-C from a poisonous mushroom, Amanita pantherina promote lipid accumulation in adipocytes. J. Nat. Prod. 2019, 82, 3489–3493. [Google Scholar] [CrossRef]
  21. Baek, S.C.; Nam, K.H.; Yi, S.A.; Jo, M.S.; Lee, K.H.; Lee, Y.H.; Lee, J.; Kim, K.H. Anti-adipogenic effect of β-carboline alkaloids from garlic (Allium sativum). Foods 2019, 8, 673. [Google Scholar] [CrossRef] [Green Version]
  22. Lee, S.; Choi, E.; Yang, S.-M.; Ryoo, R.; Moon, E.; Kim, S.-H.; Kim, K.H. Bioactive compounds from sclerotia extract of Poria cocos that control adipocyte and osteoblast differentiation. Bioorg. Chem. 2018, 81, 27–34. [Google Scholar] [CrossRef]
  23. Lee, S.R.; Park, H.B.; Kim, K.H. Highly sensitive, simple, and cost/time-effective method to determine the absolute configuration of a secondary alcohol using competing enantioselective acylation coupled with LC/MS. Anal. Chem. 2018, 90, 13212–13216. [Google Scholar] [CrossRef] [PubMed]
  24. So, H.M.; Yu, J.S.; Khan, Z.; Subedi, L.; Ko, Y.-J.; Lee, I.K.; Park, W.S.; Chung, S.J.; Ahn, M.-J.; Kim, S.Y.; et al. Chemical constituents of the root bark of Ulmus davidiana var. japonica and their potential biological activities. Bioorg. Chem. 2019, 91, 103145. [Google Scholar] [PubMed]
  25. Rischera, M.; Lee, S.R.; Eom, H.J.; Park, H.B.; Vollmers, J.; Kaster, A.-K.; Shin, Y.-H.; Oh, D.-C.; Kim, K.H.; Beemelmanns, C. Spirocyclic cladosporicin A and cladosporiumins I and J from a Hydractinia-associated Cladosporium sphaerospermum SW67. Org. Chem. Front. 2019, 6, 1084–1093. [Google Scholar] [CrossRef]
  26. Lee, S.R.; Seok, S.; Ryoo, R.; Choi, S.U.; Kim, K.H. Macrocyclic Trichothecene Mycotoxins from a Deadly Poisonous Mushroom Podostroma cornu-damae. J. Nat. Prod. 2019, 82, 122–128. [Google Scholar] [CrossRef] [PubMed]
  27. Lv, M.-M.; Tan, M.-H.; Lu, L.-W.; Zhang, R.-H.; Guo, Z.-Y.; Liu, C.-X.; Yang, J.; Zou, K.; Proksch, P. Chinoketides A and B, two new antimicrobial polyketides from the endophytes of Distylium chinense with the “Black-Box” co-culture method. Nat. Prod. Sci. 2018, 24, 159–163. [Google Scholar] [CrossRef]
Figure 1. Structures of compound 1 and its geometric isomer 2.
Plants 09 00858 g001
Figure 2. 1H-1H COSY ( Plants 09 00858 i001) and key heteronuclear multiple bond correlation (HMBC) ( Plants 09 00858 i002) correlations for compound 1.
Plants 09 00858 g002
Figure 3. Key rotating frame Overhauser effect spectroscopy (ROESY) (arrows) correlations of compounds 1 and 2.
Plants 09 00858 g003
Figure 4. (A) Experimental and calculated electronic circular dichroism (ECD) spectra of compound 1 and (B) the structures of 1a and 1b.
Plants 09 00858 g004
Figure 5. Inhibitory effects of compounds 1 and 2 on adipogenesis. (A) Schematic representation of the differentiation 3T3-L1 cells into adipocytes. Compounds 1 and 2 were used to treat the cells during the entire process of differentiation. (B) Oil Red O staining of 3T3-L1 adipocytes treated with compounds 1 and 2 (20 μM) during adipogenesis. (C) mRNA levels of the Adipsin and Fabp4 in 3T3-L1 adipocytes treated with compounds 1 and 2 (20 μM) during adipogenesis. Data represent the means ± SEM for n = 3. * p < 0.05, *** p < 0.001.
Plants 09 00858 g005
Table 1. 1H and 13C NMR data of compounds 1 and 2 in CD3OD (δ in ppm, 850 MHz for 1H and 212.5 MHz for 13C) a.
Position12
δHδCδHδC
1 168.8 167.9
25.89 s120.05.78 s117.3
3 153.2 151.9
46.66 d (15.5)137.38.01 d (15.5)131.5
56.58 d (15.5)134.26.55 d (15.5)135.4
62.34 s13.92.09 s20.8
1’ 49.4 49.2
2’ax: 1.80 dd (14.0, 10.0);
eq: 2.00 ddd (14.0, 7.0, 1.5)
42.5ax: 1.81 dd (13.5, 11.0);
eq: 2.19 dd (13.5, 5.5)
42.3
3’4.26 tt (10.0, 7.0)73.64.28 tt (11.0, 5.5)73.6
4’ax: 1.80 dd (14.0, 10.0);
eq: 2.20 ddd (14.0, 7.0, 1.5)
42.5ax: 1.81 m;
eq: 1.99 dd (13.5, 5.5)
42.3
5’ 87.6 87.2
7’endo: 3.77 d (7.5);
exo: 3.80 d (7.5)
76.9endo: 3.76 d (7.5);
exo: 3.81 d (7.5)
76.7
8’ 83.1 83.1
9’1.13 s19.41.17 s19.2
10’0.91 s16.00.94 s15.9
1’’4.37 d (8.0)102.14.36 d (8.0)102.5
2’’3.14 dd (9.0, 8.0)74.93.14 dd (9.0, 8.0)74.9
3’’3.28 m77.83.28 m77.8
4’’3.28 m71.33.28 m71.3
5’’3.35 m77.93.35 m77.9
6’’3.86 dd (12.0, 2.0);
3.66 dd (12.0, 5.5)
62.63.86 dd (12.0, 2.0);
3.66 dd (12.0, 5.5)
62.3
OCH33.70 s51.23.70 s50.8
aJ-values are expressed in parentheses and reported in Hz; 13C NMR assignments are based on HSQC, HMBC, and 1H-1H COSY experiments; ax: axial and eq: equatorial.

