A Leaf Selfie: Using a Smartphone to Quantify Leaf Vulnerability to Hydraulic Dysfunction

 , ,
, , 
Abstract
:1. Introduction
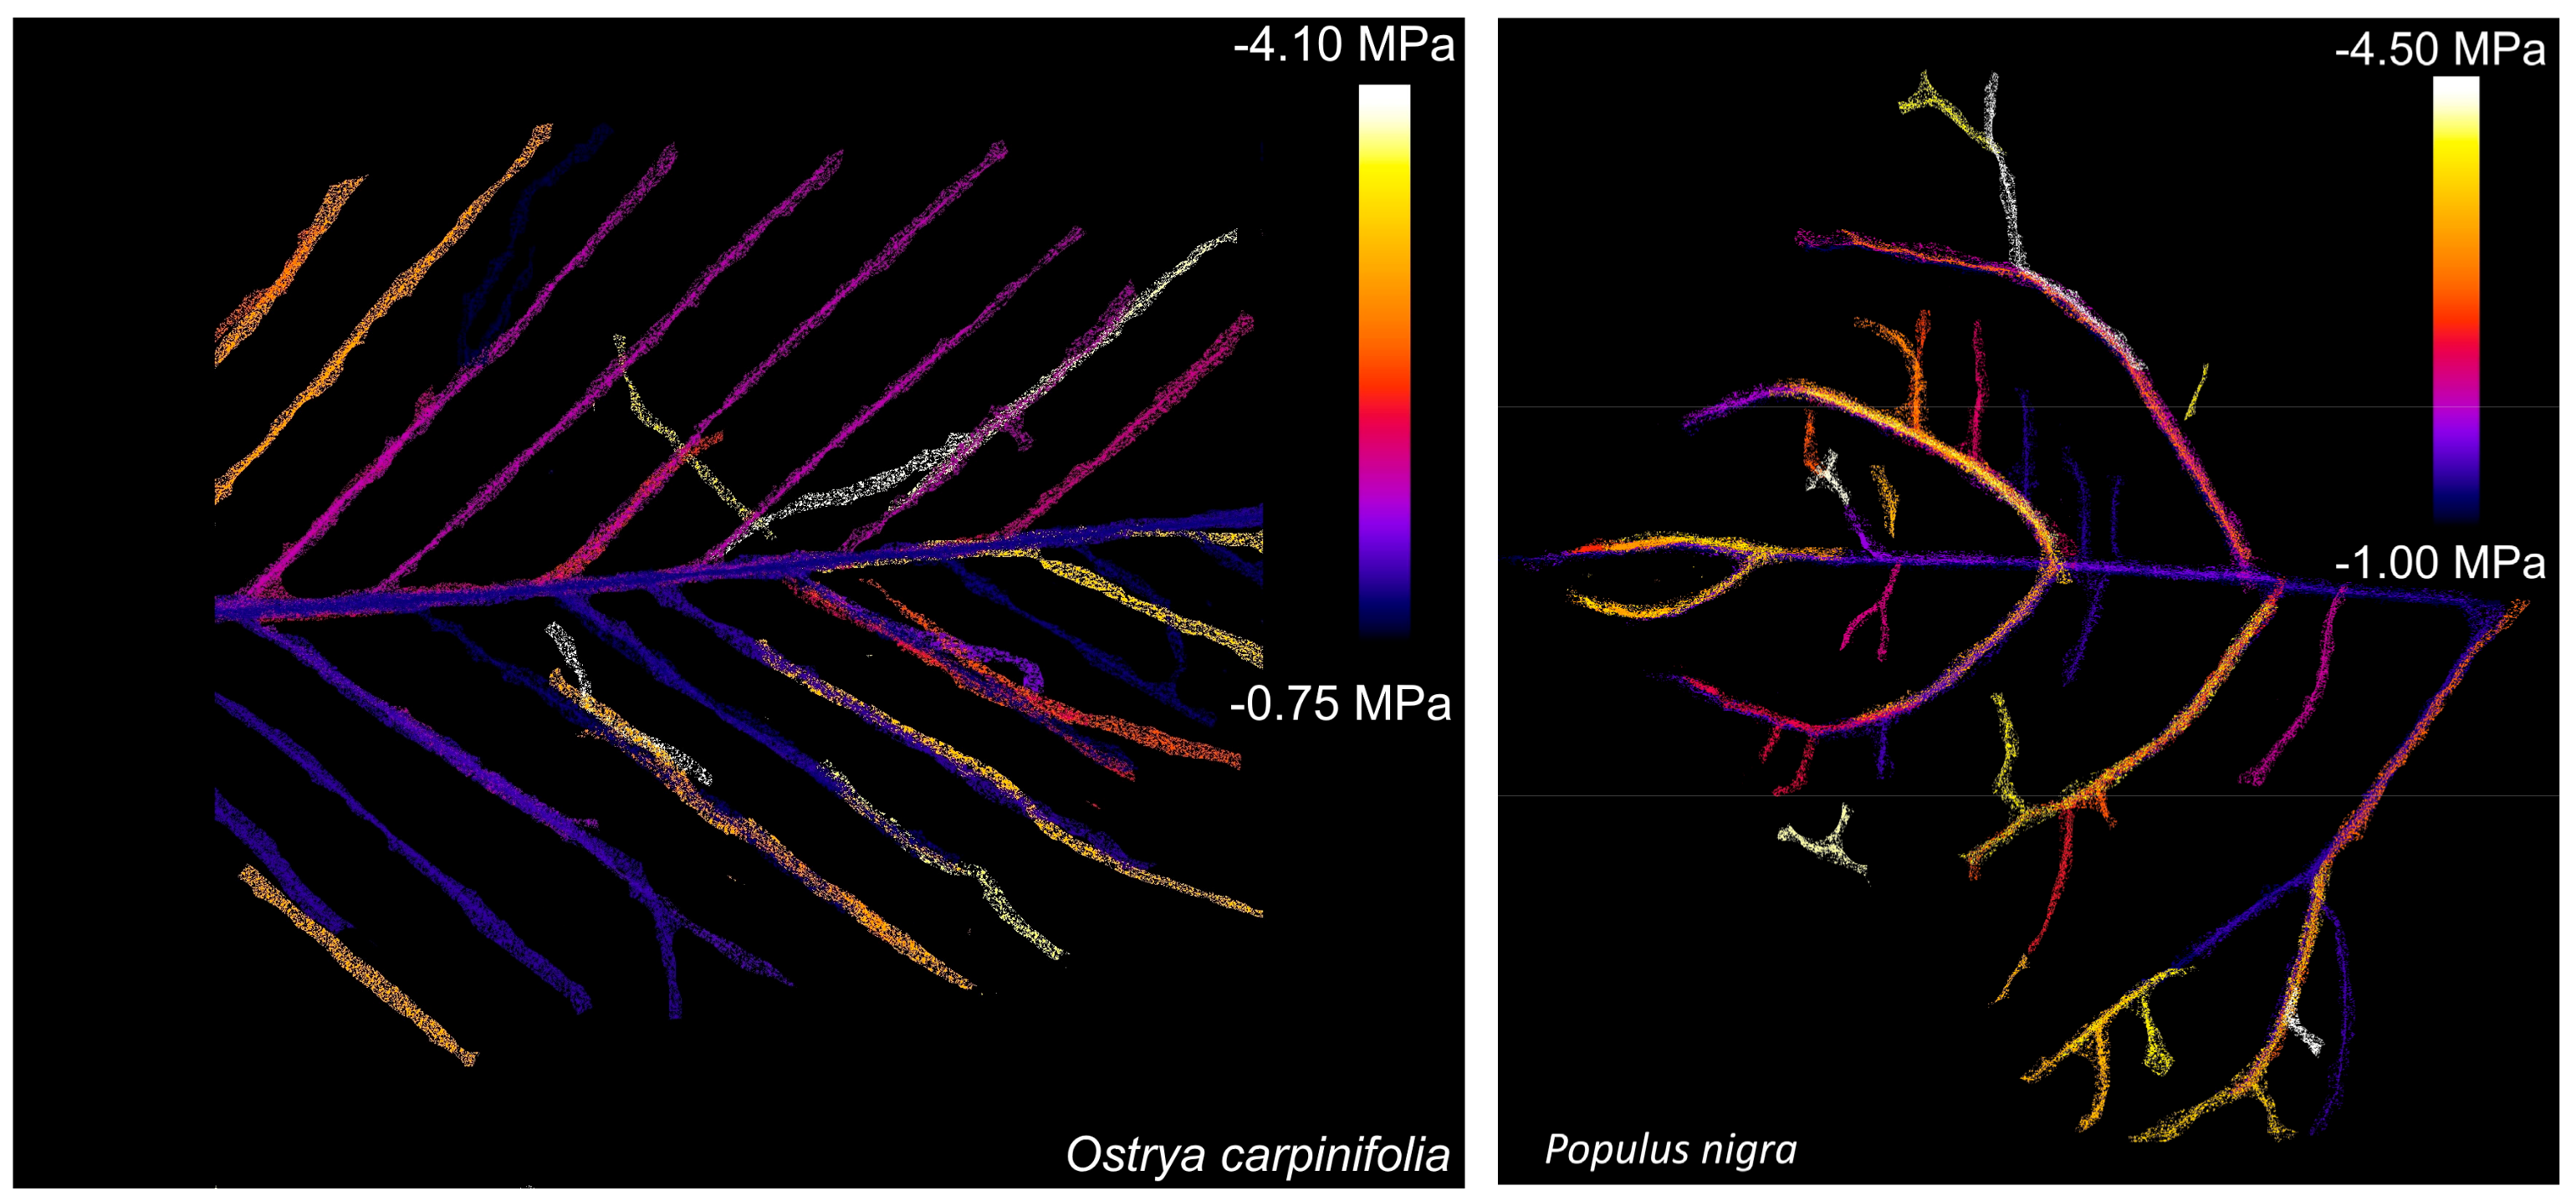
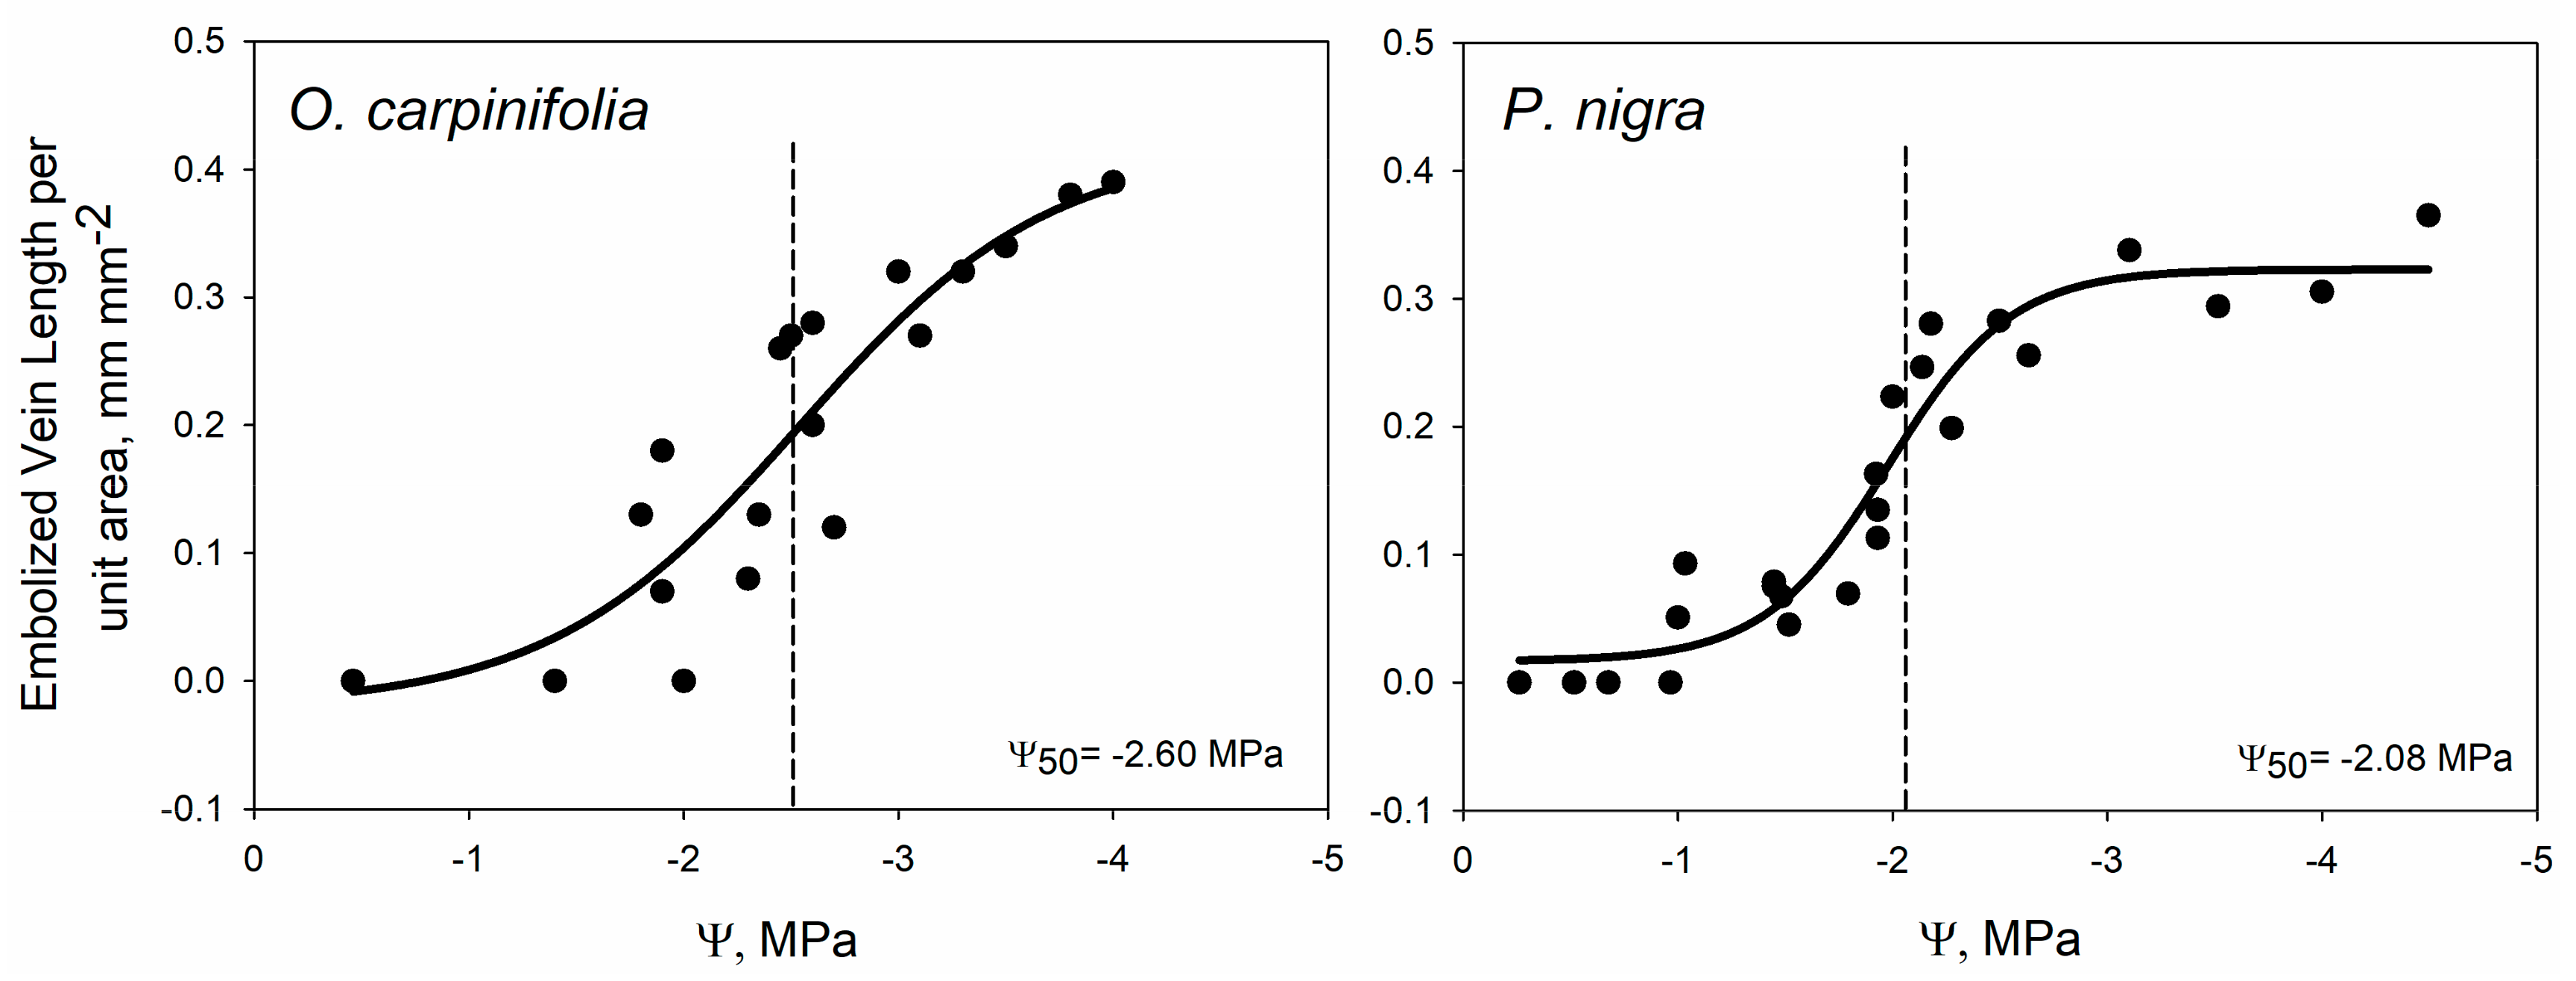
2. Results
3. Discussion
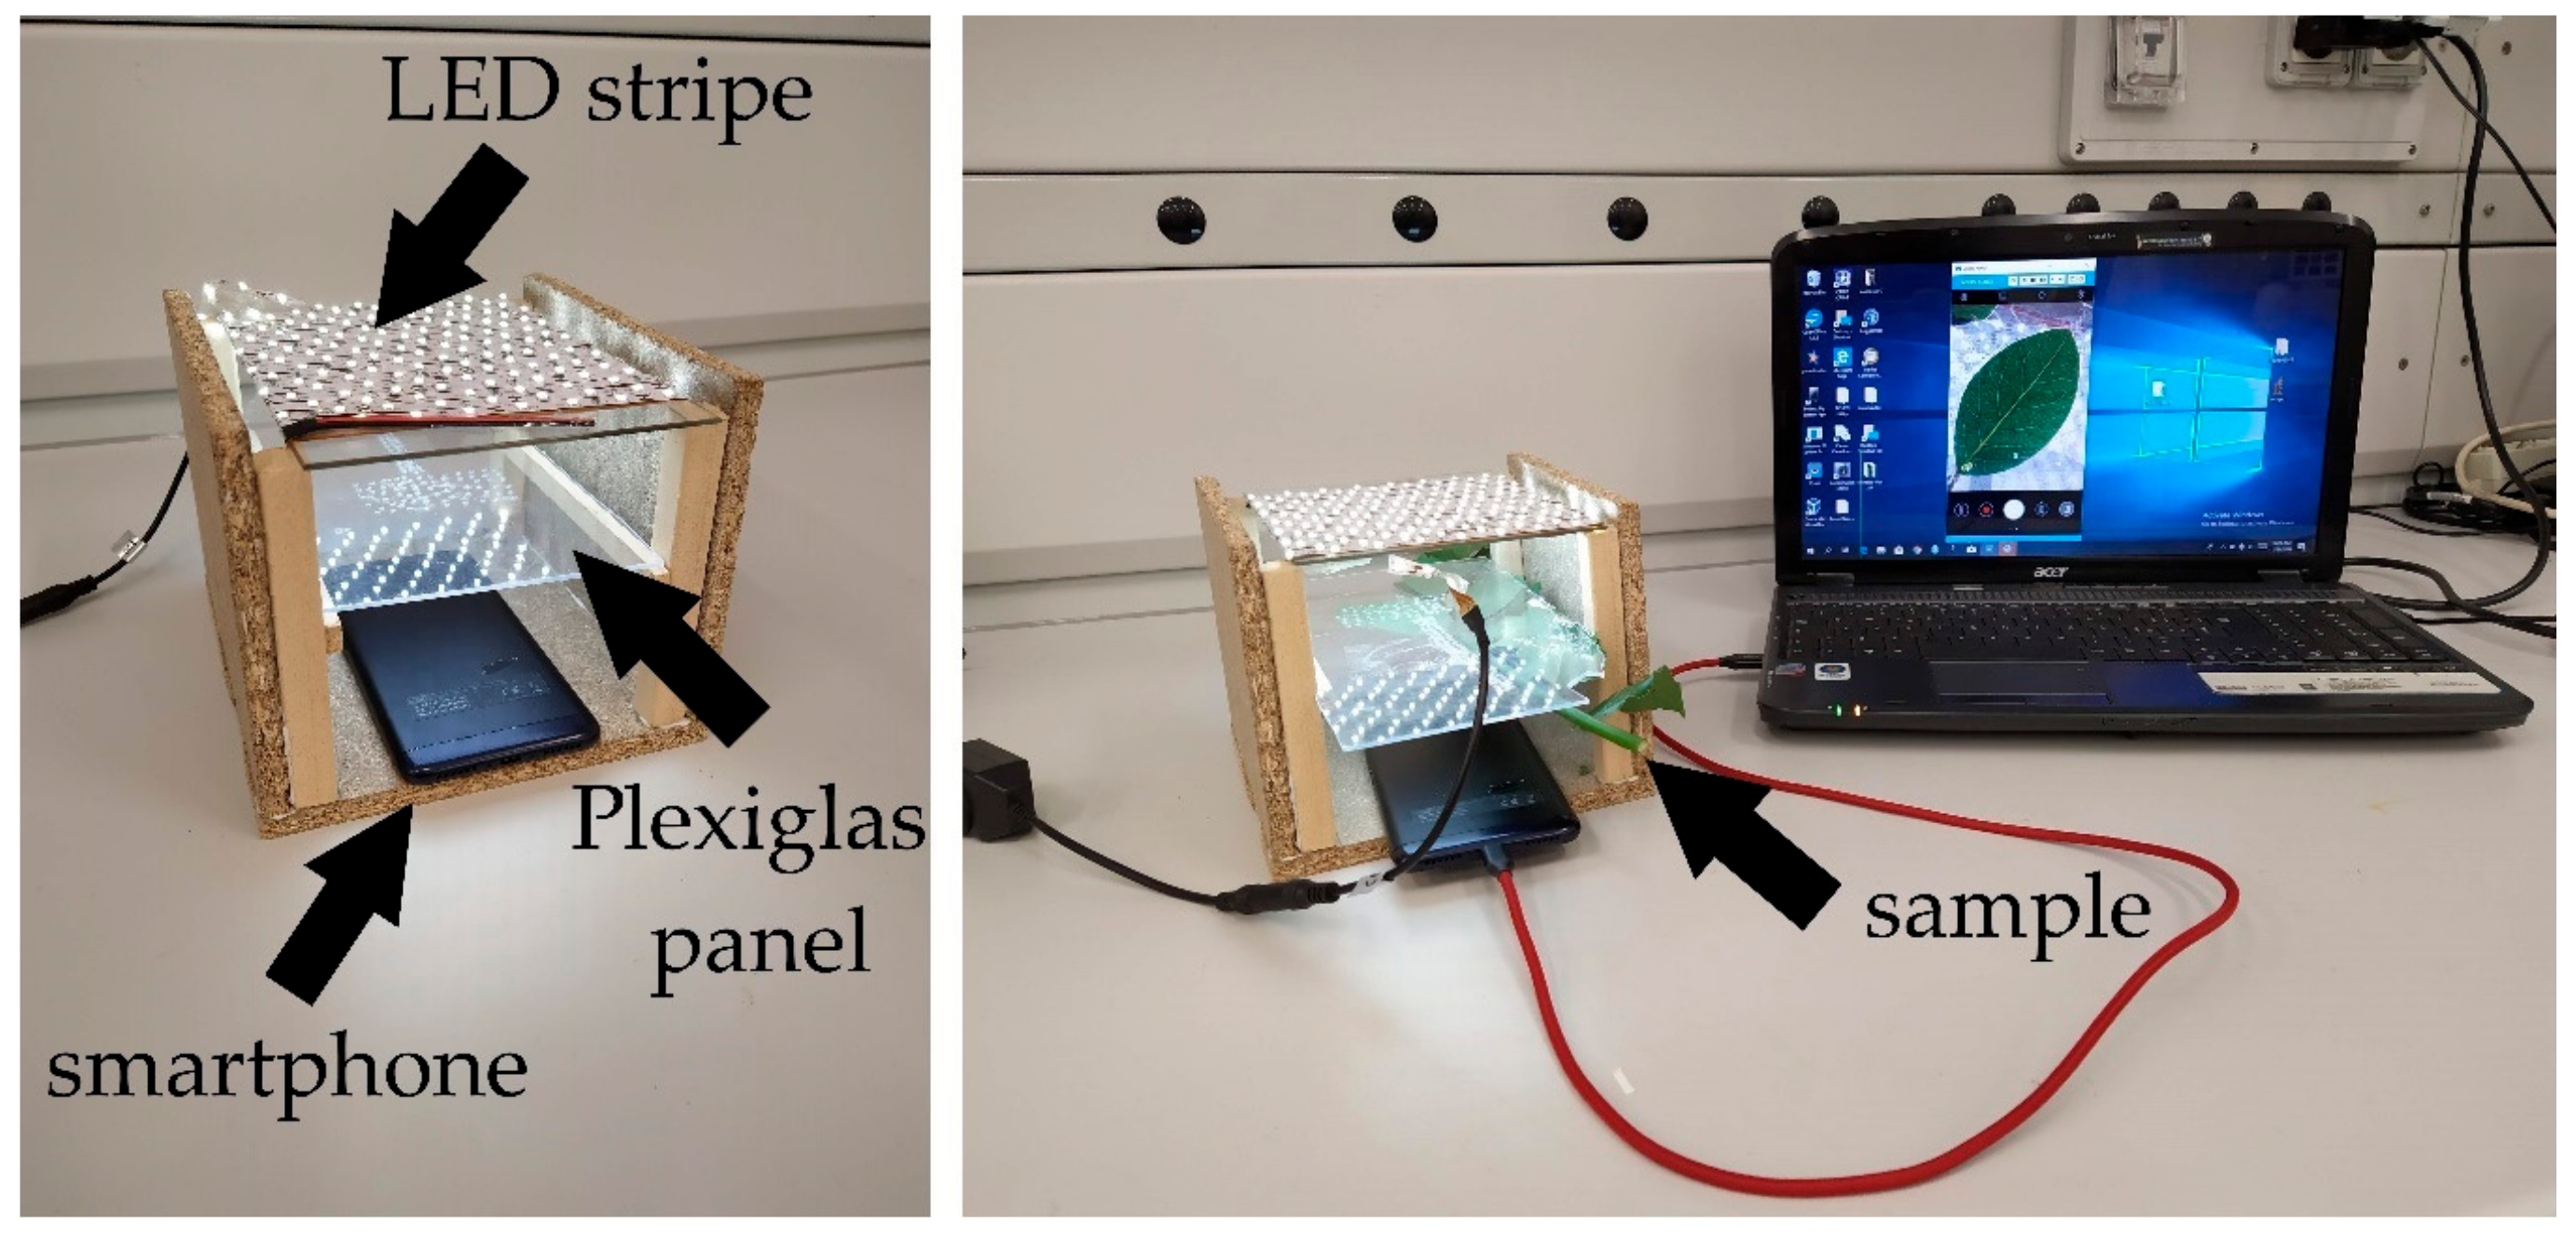
4. Materials and Methods
4.1. Plant Material and Sample Preparation
4.2. Image Capture and Analysis
4.3. Measurements of Leaf Vein Length Per Unit Area
5. Conclusions
Author Contributions
Funding
Acknowledgments
Conflicts of Interest
References
- Westboy, M.; Wright, I.J. Land-plant ecology on the basis of functional traits. Trends Ecol. Evol. 2006, 21, 261–268. [Google Scholar] [CrossRef] [PubMed]
- De la Riva, E.G.; Violle, C.; Pérez-Ramos, I.M.; Marañón, T.; Navarro-Fernández, C.M.; Olmo, M.; Villar, R. A multidimensional functional trait approach reveals the imprint of environmental stress in Mediterranean woody communities. Ecosystems 2018, 21, 248–262. [Google Scholar] [CrossRef] [Green Version]
- Swenson, N.G.; Weiser, M.D. Plant geography upon the basis of functional traits: An example from eastern North American trees. Ecology 2010, 91, 2234–2241. [Google Scholar] [CrossRef] [PubMed]
- Pollock, L.J.; Morris, W.K.; Vesk, P.A. The role of functional traits in species distribution revealed through a hierarchical model. Ecography 2012, 35, 716–725. [Google Scholar] [CrossRef]
- Comas, L.H.; Becker, S.R.; Cruz, V.M.V.; Byrne, P.F.; Dierig, D.A. Root traits contributing to plant productivity under drought. Front. Plant Sci. 2013, 4, 442. [Google Scholar] [CrossRef] [Green Version]
- Violle, C.; Navas, M.L.; Vile, D.; Kazakou, E.; Fortunel, C.; Hummel, I.; Garnier, E. Let the concept of trait be functional! Oikos 2007, 116, 882–892. [Google Scholar] [CrossRef]
- Weiher, E.; van der Werf, A.; Thompson, K.; Roderick, M.; Garnier, E.; Eriksson, O. Challenging Theophrastus: A common core list of plant traits for functional ecology. J. Veg. Sci. 1999, 10, 609–620. [Google Scholar] [CrossRef]
- Wright, I.J.; Reich, P.B.; Cornelissen, J.H.C.; Falster, D.S.; Garnier, E.; Hikosaka, K.; Lamont, B.B.; Lee, W.; Oleksyn, J.; Osada, N.; et al. Assessing the generality of global leaf trait relationships. New Phytol. 2005, 166, 485–496. [Google Scholar] [CrossRef]
- Milla, R.; Reich, P.B. The scaling of leaf area and mass: The cost of light interception increases with leaf size. Proc. R. Soc. B 2007, 274, 2109–2114. [Google Scholar] [CrossRef] [Green Version]
- Wright, I.J.; Westboy, M.; Reich, P.B. Convergence towards higher leaf mass per area in dry and nutrient-poor habitats has different consequences for leaf life span. J. Ecol. 2002, 90, 534–543. [Google Scholar] [CrossRef] [Green Version]
- Nardini, A.; Pedà, G.; La Rocca, N. Trade-offs between leaf hydraulic capacity and drought vulnerability: Morpho-anatomical bases, carbon costs and ecological consequences. New Phytol. 2012, 196, 788–798. [Google Scholar] [CrossRef] [PubMed]
- Salleo, S.; Nardini, A. Sclerophylly: Evolutionary advantage or mere epiphenomenon? Plant Biosyst. 2000, 134, 247–259. [Google Scholar] [CrossRef]
- Poorter, H.; Niinemets, U.; Poorter, L.; Wright, I.J.; Villar, R. Causes and consequences of variation in leaf mass per area (LMA): A meta-analysis. New Phytol. 2009, 182, 565–588. [Google Scholar] [CrossRef]
- Sterck, F.; Markesteijn, L.; Schieving, F.; Poorter, L. Functional traits determine trade-offs and niches in a tropical forest community. Proc. Natl. Acad. Sci. USA 2011, 108, 20627–20632. [Google Scholar] [CrossRef] [Green Version]
- Kearney, M.; Poorter, W. Mechanistic niche modelling: Combining physiological and spatial data to predict species ranges. Ecol. Lett. 2009, 12, 334–350. [Google Scholar] [CrossRef] [PubMed]
- Brodribb, T.J. Progressing from ‘functional’ to mechanistic traits. New Phytol. 2017, 215, 9–11. [Google Scholar] [CrossRef] [PubMed] [Green Version]
- Looman, J. Distribution of plant species and vegetation types in relation to climate. Vegetatio 1983, 54, 17–25. [Google Scholar] [CrossRef]
- Stephenson, N.L. Actual evapotranspiration and deficit: Biologically meaningful correlates of vegetation distribution across spatial scales. J. Biogeogr. 1998, 25, 855–870. [Google Scholar] [CrossRef]
- Baltzer, J.L.; Davies, S.J.; Bunyavejchewin, S.; Noor, N.S.M. The role of desiccation tolerance in determining tree species distributions along the Malay–Thai Peninsula. Funct. Ecol. 2008, 22, 221–231. [Google Scholar] [CrossRef]
- Kursar, T.A.; Engelbrecht, B.M.J.; Burke, A.; Tyree, M.T.; EI Omari, B.; Giraldo, J.P. Tolerance to low leaf water status of tropical tree seedlings is related to drought performance and distribution. Funct. Ecol. 2009, 23, 93–102. [Google Scholar] [CrossRef]
- Giorgi, F.; Lionello, P. Climate change projections for the Mediterranean region. Glob. Planet. Chang. 2008, 63, 90–104. [Google Scholar] [CrossRef]
- Nardini, A.; Luglio, J. Leaf hydraulic capacity and drought vulnerability: Possible trade-offs and correlations with climate across three major biomes. Funct. Ecol. 2014, 28, 810–818. [Google Scholar] [CrossRef]
- Powell, T.L.; Wheeler, J.K.; de Oliveira, A.A.R.; da Costa, A.C.L.; Saleska, S.R.; Meir, P.; Moorcroft, P.R. Differences in xylem and leaf hydraulic traits explain differences in drought tolerance among mature Amazon rainforest trees. Glob. Chang. Biol. 2017, 23, 4280–4293. [Google Scholar] [CrossRef] [PubMed] [Green Version]
- Cheung, Y.N.S.; Tyree, M.T.; Dainty, J. Water relations parameters on single leaves obtained in a pressure bomb and some ecological interpretations. Can. J. Bot. 1975, 53, 1342–1346. [Google Scholar] [CrossRef]
- Kramer, P.J. Water relations of plants cells and tissues. Annu. Rev. Plant Physiol. 1955, 6, 253–272. [Google Scholar] [CrossRef]
- Bartlett, M.K.; Scoffoni, C.; Sack, L. The determinants of leaf turgor loss point and prediction of drought tolerance of species and biomes: A global meta-analysis. Ecol. Lett. 2012, 15, 393–405. [Google Scholar] [CrossRef]
- Maréchaux, I.; Bartlett, M.K.; Sack, L.; Baraloto, C.; Engel, J.; Joetzjer, E.; Chave, J. Drought tolerance as predicted by leaf water potential at turgor loss point varies strongly across species within an Amazonian forest. Funct. Ecol. 2015, 29, 1268–1277. [Google Scholar] [CrossRef]
- Bartlett, M.K.; Scoffoni, C.; Ardy, R.; Zhang, Y.; Sun, S.; Cao, K.; Sack, L. Rapid determination of comparative drought tolerance traits: Using an osmometer to predict turgor loss point. Methods Ecol. Evol. 2012, 3, 880–888. [Google Scholar] [CrossRef]
- Petruzzellis, F.; Savi, T.; Bacaro, G.; Nardini, A. A simplified framework for fast and reliable measurement of leaf turgor loss point. Plant Physiol. Biochem. 2019, 139, 395–399. [Google Scholar] [CrossRef] [Green Version]
- Bartlett, M.K.; Zhang, Y.; Kreidler, N.; Sun, S.; Ardy, R.; Cao, K.; Sack, L. Global analysis of plasticity in turgor loss point, a key drought tolerance trait. Ecol. Lett. 2014, 17, 1580–1590. [Google Scholar] [CrossRef]
- Petruzzellis, F.; Palandrani, C.; Savi, T.; Alberti, R.; Nardini, A.; Bacaro, G. Sampling intraspecific variability in leaf functional traits: Practical suggestions to maximize collected information. Ecol. Evol. 2017, 7, 11236–11245. [Google Scholar] [CrossRef] [PubMed] [Green Version]
- Tordoni, E.; Petruzzellis, F.; Nardini, A.; Savi, T.; Bacaro, G. Make it simpler: Alien species decrease functional diversity of coastal plant communities. J. Veg. Sci. 2019, 30, 498–509. [Google Scholar] [CrossRef]
- Choat, B.; Jansen, S.; Brodribb, T.J.; Cochard, H.; Delzon, S.; Bhaskar, R.; Bucci, S.J.; Feild, T.S.; Gleason, S.M.; Hacke, U.G.; et al. Global convergence in the vulnerability of forests to drought. Nature 2012, 491, 752–755. [Google Scholar] [CrossRef] [PubMed] [Green Version]
- Venturas, M.D.; Sperry, J.S.; Hacke, U.G. Plant xylem hydraulics: What we understand, current research, and future challenges. J. Integr. Plant Biol. 2017, 59, 356–389. [Google Scholar] [CrossRef] [PubMed] [Green Version]
- Domec, J.C.; Scholz, F.G.; Bucci, S.J.; Meinzer, F.C.; Goldstein, G.; Villalobos-Vega, R. Diurnal and seasonal variation in root xylem embolism in neotropical savanna woody species: Impact on stomatal control of plant water status. Plant Cell Environ. 2006, 29, 26–35. [Google Scholar] [CrossRef]
- Lens, F.; Tixier, A.; Cochard, H.; Sperry, J.S.; Jansen, S.; Herbette, S. Embolism resistance as a key mechanism to understand adaptive plant strategies. Curr. Opin. Plant Biol. 2013, 16, 287–292. [Google Scholar] [CrossRef] [Green Version]
- Blackman, C.J.; Brodribb, T.J.; Jordan, G.J. Leaf hydraulic vulnerability is related to conduit dimensions and drought resistance across a diverse range of woody angiosperms. New Phytol. 2010, 188, 1113–1123. [Google Scholar] [CrossRef]
- Maherali, H.; Pockman, W.T.; Jackson, R.B. Adaptive variation in the vulnerability of woody plants to xylem cavitation. Ecology 2004, 85, 2184–2199. [Google Scholar] [CrossRef]
- Gleason, S.M.; Westoby, M.; Jansen, S.; Choat, B.; Hacke, U.G.; Pratt, R.B.; Bhaskar, R.; Brodribb, T.J.; Bucci, S.J.; Cao, K.F.; et al. Weak tradeoff between xylem safety and xylem-specific hydraulic efficiency across the world’s woody plant species. New Phtyol. 2016, 209, 123–136. [Google Scholar] [CrossRef] [Green Version]
- Blackman, C.J.; Brodribb, T.J.; Jordan, G.J. Leaf hydraulic vulnerability influences species’ bioclimatic limits in a diverse group of woody angiosperms. Oecologia 2012, 168, 1–10. [Google Scholar] [CrossRef]
- Trueba, S.; Pouteau, R.; Lens, F.; Feild, T.S.; Isnard, S.; Olson, M.E.; Delzon, S. Vulnerability to xylem embolism as a major correlate of the environmental distribution of rain forest species on a tropical island. Plant Cell Environ. 2017, 40, 277–289. [Google Scholar] [CrossRef] [PubMed]
- Cochard, H.; Badel, E.; Herbette, S.; Delzon, S.; Choat, B.; Jansen, S. Methods for measuring plant vulnerability to cavitation: A critical review. J. Exp. Bot. 2013, 64, 4779–4791. [Google Scholar] [CrossRef] [PubMed] [Green Version]
- Casolo, V.; Tomasella, M.; De Col, V.; Braidot, E.; Savi, T.; Nardini, A. Water relations of an invasive halophyte (Spartina patens): Osmoregulation and ionic effects on xylem hydraulics. Funct. Plant Biol. 2015, 42, 264–273. [Google Scholar] [CrossRef]
- McDowell, N.G.; Brodribb, T.J.; Nardini, A. Hydraulics in the 21st century. New Phytol. 2019, 224, 537–542. [Google Scholar] [CrossRef] [PubMed] [Green Version]
- Nardini, A.; Savi, T.; Losso, A.; Petit, G.; Pacilé, S.; Tromba, G.; Mayr, S.; Trifilò, P.; Lo Gullo, M.A.; Salleo, S. X-ray microtomography observations of xylem embolism in stems of Laurus nobilis are consistent with hydraulic measurements of percentage loss of conductance. New Phytol. 2017, 213, 1068–1075. [Google Scholar] [CrossRef] [PubMed] [Green Version]
- Nolf, M.; Lopez, R.; Peters, J.M.R.; Flavel, R.J.; Koloadin, L.S.; Young, I.M.; Choat, B. Visualization of xylem embolism by X-ray microtomography: A direct test against hydraulic measurements. New Phytol. 2017, 214, 890–898. [Google Scholar] [CrossRef] [PubMed] [Green Version]
- Savi, T.; Miotto, A.; Petruzzellis, F.; Losso, A.; Pacilé, S.; Tromba, G.; Mayr, S.; Nardini, A. Drought-induced embolism in stems of sunflower: A comparison of in vivo micro-CT observations and destructive hydraulic measurements. Plant Physiol. Biochem. 2017, 120, 24–29. [Google Scholar] [CrossRef]
- Brodribb, T.J.; Skelton, R.P.; McAdam, S.A.M.; Bienaimé, D.; Lucani, C.J.; Marmottant, P. Visual quantification of embolism reveals leaf vulnerability to hydraulic failure. New Phytol. 2016, 209, 1403–1409. [Google Scholar] [CrossRef]
- Hochberg, U.; Ponomarenko, A.; Zhang, Y.J.; Rockwell, F.E.; Holbrook, N.M. Visualizing embolism propagation in gas-injected leaves. Plant Physiol. 2019, 180, 874–881. [Google Scholar] [CrossRef] [Green Version]
- Skelton, R.P.; Dawson, T.E.; Thompson, S.E.; Shen, Y.; Weitz, A.P.; Ackerly, D. Low vulnerability to xylem embolism in leaves and stems of North American oaks. Plant Physiol. 2018, 177, 1066–1077. [Google Scholar] [CrossRef]
- Salleo, S.; Lo Gullo, M.A.; Raimondo, F.; Nardini, A. Vulnerability to cavitation of leaf minor veins: Any impact on leaf gas exchange? Plant Cell Environ. 2001, 24, 851–859. [Google Scholar] [CrossRef]
- Trifilò, P.; Nardini, A.; Lo Gullo, M.A.; Salleo, S. Vein cavitation and stomatal behaviour of sunflower (Helianthus annuus) leaves under water limitation. Physiol. Plant 2003, 119, 409–417. [Google Scholar] [CrossRef] [Green Version]
- Nardini, A.; Salleo, S. Effects of the experimental blockage of the major veins on hydraulics and gas exchange of Prunus laurocerasus L. leaves. J. Exp. Bot. 2003, 54, 1213–1219. [Google Scholar] [CrossRef] [PubMed] [Green Version]
- Salleo, S.; Raimondo, F.; Trifilò, P.; Nardini, A. Axial-to-radial water permeability of leaf major veins: A possible determinant of the impact of vein embolism on leaf hydraulics? Plant Cell Environ. 2003, 26, 1749–1758. [Google Scholar] [CrossRef]
- Lo Gullo, M.A.; Nardini, A.; Trifilò, P.; Salleo, S. Changes in leaf hydraulics and stomatal conductance following drought stress and irrigation in Ceratonia siliqua (Carob tree). Physiol. Plant. 2003, 117, 186–194. [Google Scholar] [CrossRef]
- Nardini, A.; Battistuzzo, M.; Savi, T. Shoot desiccation and hydraulic failure in temperate woody angiosperms during an extreme summer drought. New Phytol. 2013, 200, 322–329. [Google Scholar] [CrossRef]
- Cochard, H.; Damour, G.; Bodet, C.; Tharwat, I.; Poirier, M.; Améglio, T. Evaluation of a new centrifuge technique for rapid generation of xylem vulnerability curves. Physiol. Plant. 2005, 124, 410–418. [Google Scholar] [CrossRef]
- Kiorapostolou, N.; Da Sois, L.; Petruzzellis, F.; Savi, T.; Trifilò, P.; Nardini, A.; Petit, G. Vulnerability to xylem embolism correlates to wood parenchyma fraction in Angiosperms but not in Gymnosperms. Tree Physiol. 2019, 39, 1675–1684. [Google Scholar] [CrossRef]
- Tomasella, M.; Casolo, V.; Aichner, N.; Petruzzellis, F.; Savi, T.; Trifilò, P.; Nardini, A. Non-structural carbohydrate and hydraulic dynamics during drought and recovery in Fraxinus ornus and Ostrya carpinifolia saplings. Plant Physiol. Biochem. 2019, 145, 1–9. [Google Scholar] [CrossRef]
- Johnson, D.M.; Wortemann, R.; McCulloh, K.A.; Jordan-Meille, L.; Ward, E.; Warren, J.M.; Palmroth, S.; Domec, J.C. A test of the hydraulic vulnerability segmentation hypothesis in angiosperm and conifer tree species. Tree Physiol. 2016, 36, 983–993. [Google Scholar] [CrossRef] [Green Version]
- Tsuda, M.; Tyree, M.T. Whole-plant hydraulic resistance and vulnerability segmentation in Acer saccharinum. Tree Physiol. 1997, 17, 351–357. [Google Scholar] [CrossRef] [Green Version]
- Skelton, R.P.; Brodribb, T.J.; Choat, B. Casting light on xylem vulnerability in an herbaceous species reveals a lack of segmentation. New Phytol. 2017, 214, 561–569. [Google Scholar] [CrossRef] [PubMed] [Green Version]
- Klepsch, M.; Zhang, Y.; Kotowska, M.M.; Lamarque, L.J.; Nolf, M.; Schuldt, B.; Torres-Ruiz, J.M.; Qin, D.W.; Choat, B.; Delzon, S.; et al. Is xylem of angiosperm leaves less resistant to embolism than branches? Insights from microCT, hydraulics, and anatomy. J. Exp. Bot. 2018, 69, 5611–5623. [Google Scholar] [CrossRef]
- Hochberg, U.; Windt, C.W.; Ponomarenko, A.; Zhang, Y.J.; Gersony, J.; Rockwell, F.E.; Holbrook, N.M. Stomatal closure, basal leaf embolism, and shedding protect the hydraulic integrity of grape stems. Plant Physiol. 2017, 174, 764–775. [Google Scholar] [CrossRef] [PubMed] [Green Version]
- Losso, A.; Bär, A.; Dämon, B.; Dullin, C.; Ganthaler, A.; Petruzzellis, F.; Savi, T.; Tromba, G.; Nardini, A.; Mayr, S.; et al. Insights from in vivo micro-CT analysis: Testing the hydraulic vulnerability segmentation in Acer pseudoplatanus and Fagus sylvatica seedlings. New Phytol. 2019, 221, 1831–1842. [Google Scholar] [CrossRef] [PubMed] [Green Version]
- Skelton, R.P.; Anderegg, L.D.L.; Papper, P.; Reich, E.; Dawson, T.E.; Kling, M.; Thompson, S.E.; Diaz, J.; Ackerly, D.D. No local adaptation in leaf or stem xylem vulnerability to embolism, but consistent vulnerability segmentation in a North American oak. New Phytol. 2019, 223, 1296–1306. [Google Scholar] [CrossRef] [PubMed] [Green Version]
- Trifilò, P.; Raimondo, F.; Lo Gullo, M.A.; Barbera, P.M.; Salleo, S.; Nardini, A. Relax and refill: Xylem rehydration prior to hydraulic measurements favours embolism repair in stems and generates artificially low PLC values. Plant Cell Environ. 2014, 37, 2491–2499. [Google Scholar] [CrossRef] [PubMed]
- Brodribb, T.J.; Field, T.S.; Sack, L. Viewing leaf structure and evolution from a hydraulic perspective. Funct. Plant Biol. 2010, 37, 488–498. [Google Scholar] [CrossRef]
- Bühler, J.; Rishmawi, L.; Pflugfelder, D.; Huber, G.; Scharr, H.; Hülskamp, M.; Koornneef, M.; Schurr, U.; Jahnke, S. phenoVein-A tool for leaf vein segmentation and analysis. Plant Physiol. 2015, 169, 2359–2370. [Google Scholar] [CrossRef] [Green Version]


© 2020 by the authors. Licensee MDPI, Basel, Switzerland. This article is an open access article distributed under the terms and conditions of the Creative Commons Attribution (CC BY) license (http://creativecommons.org/licenses/by/4.0/).
Share and Cite
Petruzzellis, F.; Tomasella, M.; Miotto, A.; Natale, S.; Trifilò, P.; Nardini, A. A Leaf Selfie: Using a Smartphone to Quantify Leaf Vulnerability to Hydraulic Dysfunction. Plants 2020, 9, 234. https://doi.org/10.3390/plants9020234
Petruzzellis F, Tomasella M, Miotto A, Natale S, Trifilò P, Nardini A. A Leaf Selfie: Using a Smartphone to Quantify Leaf Vulnerability to Hydraulic Dysfunction. Plants. 2020; 9(2):234. https://doi.org/10.3390/plants9020234
Chicago/Turabian StylePetruzzellis, Francesco, Martina Tomasella, Andrea Miotto, Sara Natale, Patrizia Trifilò, and Andrea Nardini. 2020. "A Leaf Selfie: Using a Smartphone to Quantify Leaf Vulnerability to Hydraulic Dysfunction" Plants 9, no. 2: 234. https://doi.org/10.3390/plants9020234