Transcriptomic Analysis Identifies New Non-Target Site Glyphosate-Resistance Genes in Conyza bonariensis

 , ,
, ,
Abstract
:1. Introduction
2. Results
2.1. Illumina Sequencing and De Novo Assembly
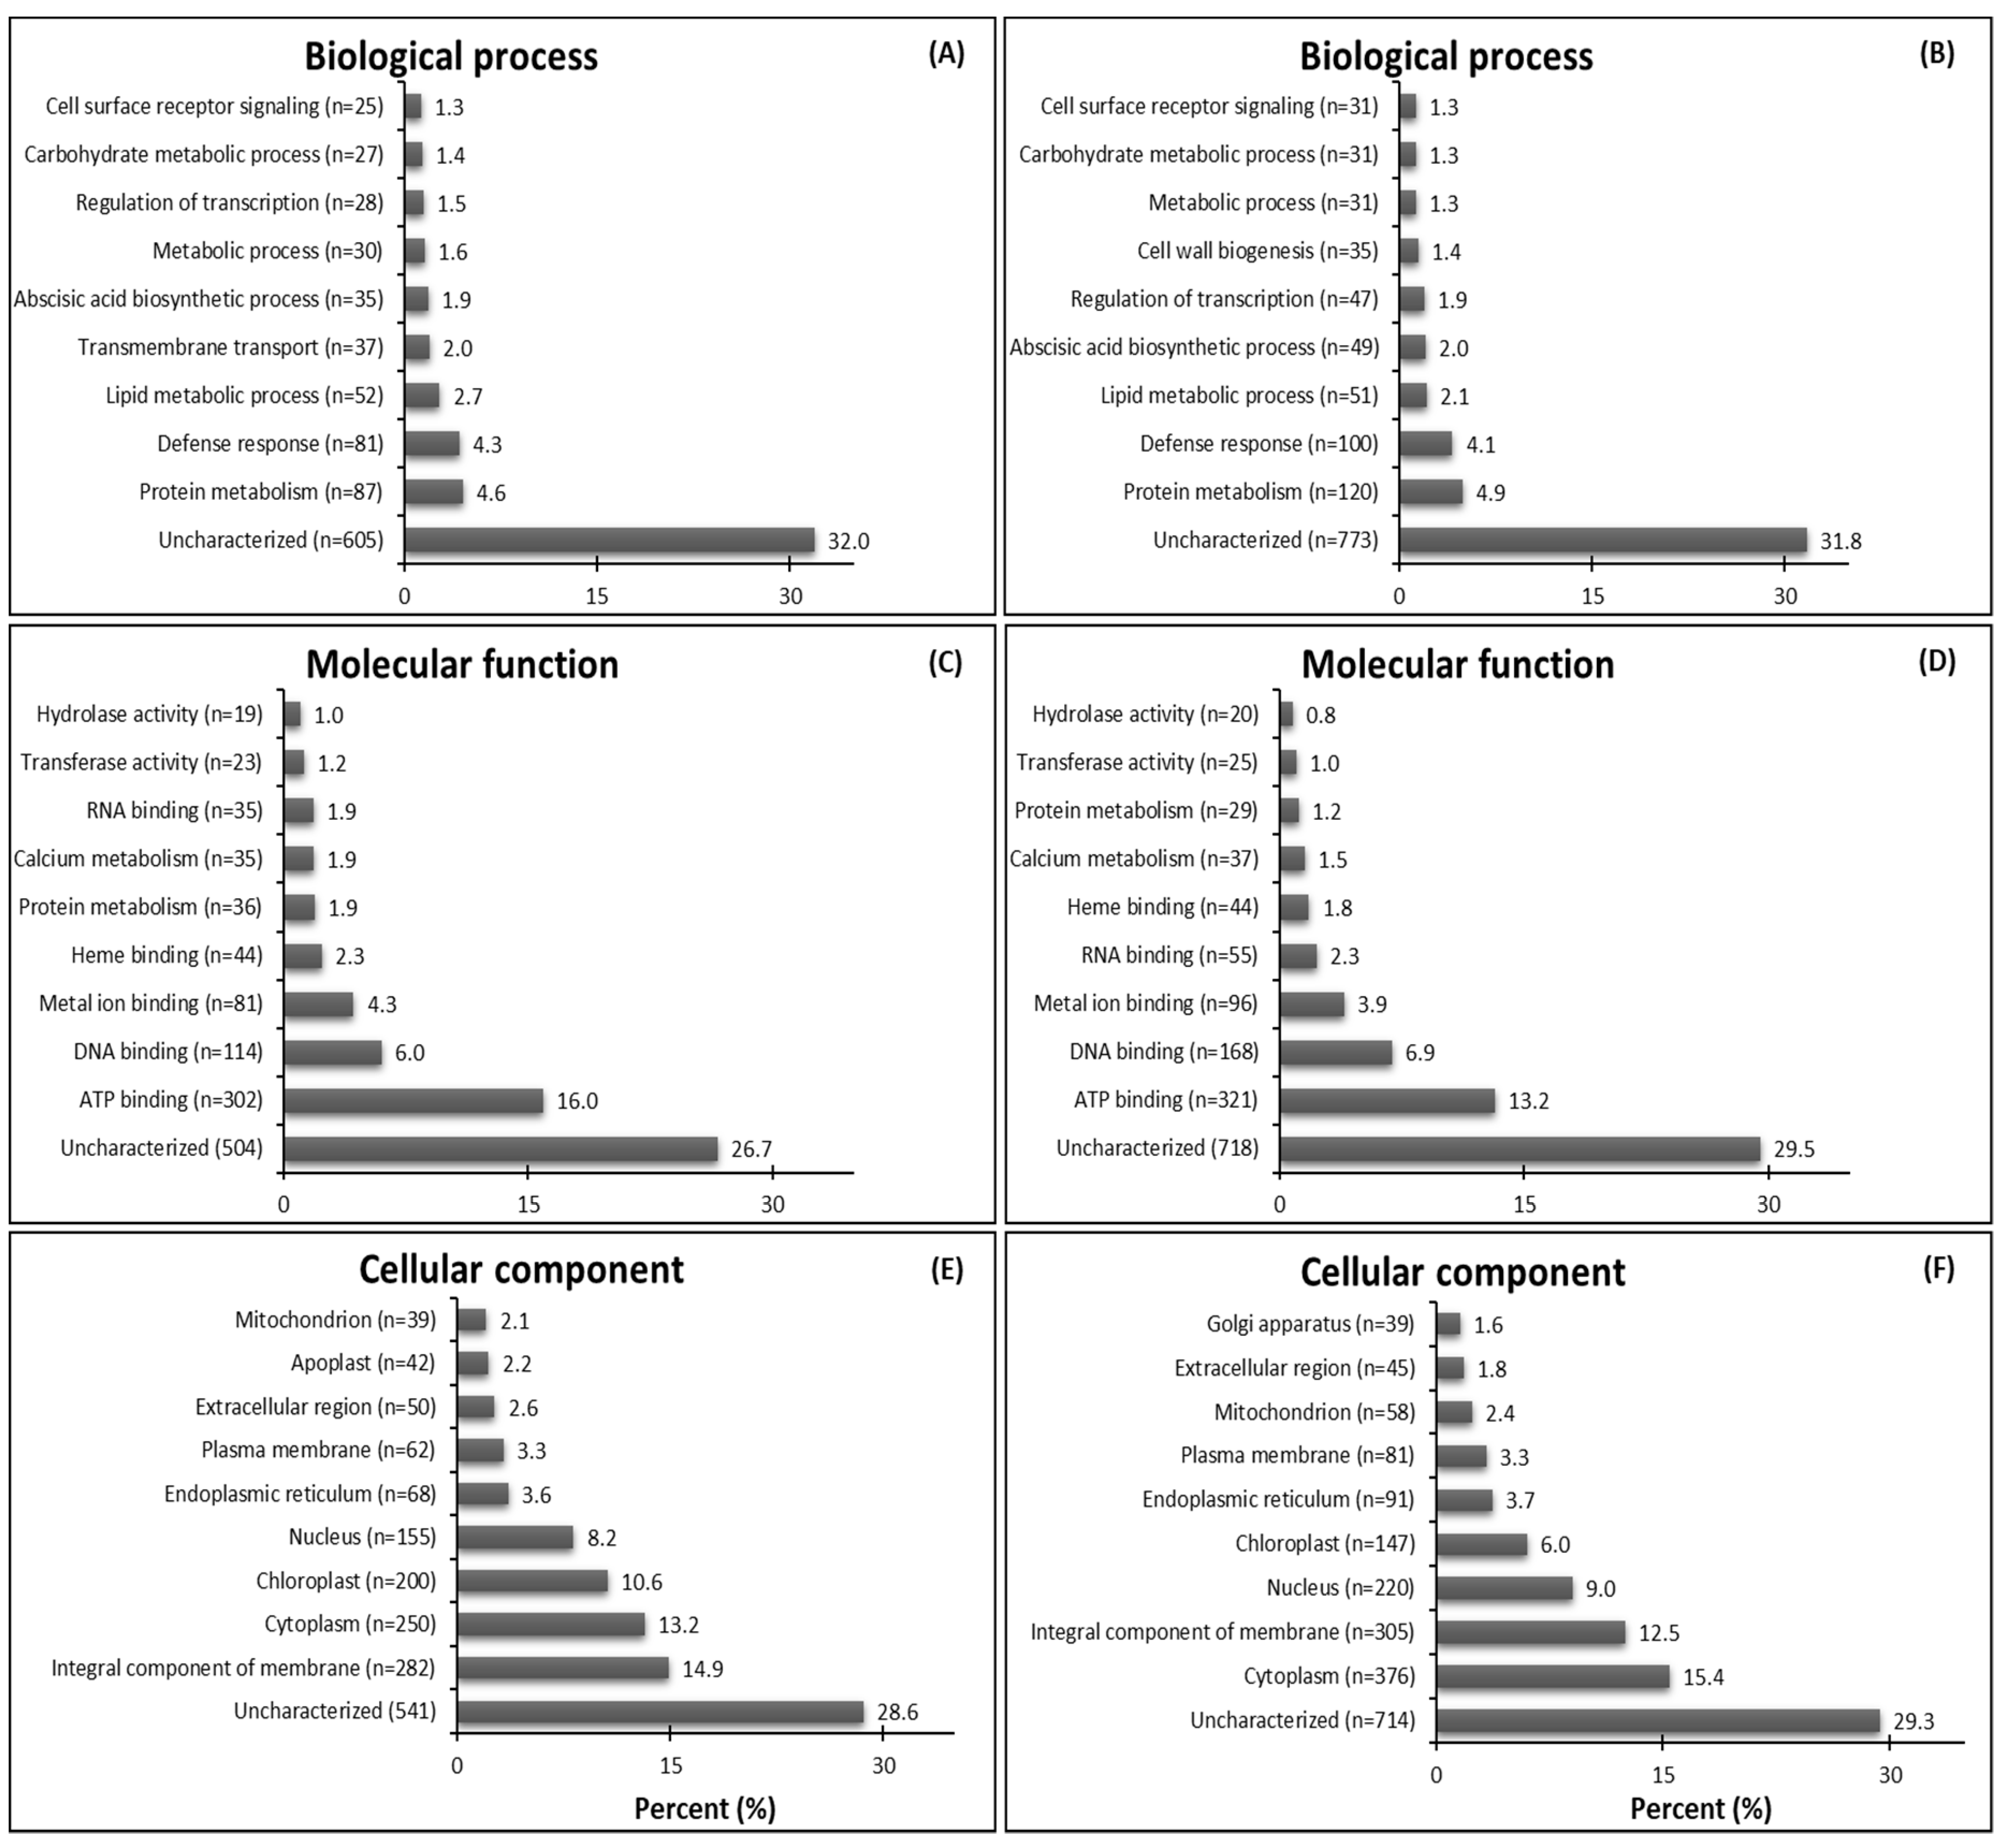
2.2. Functional Annotation of Assembled Contigs
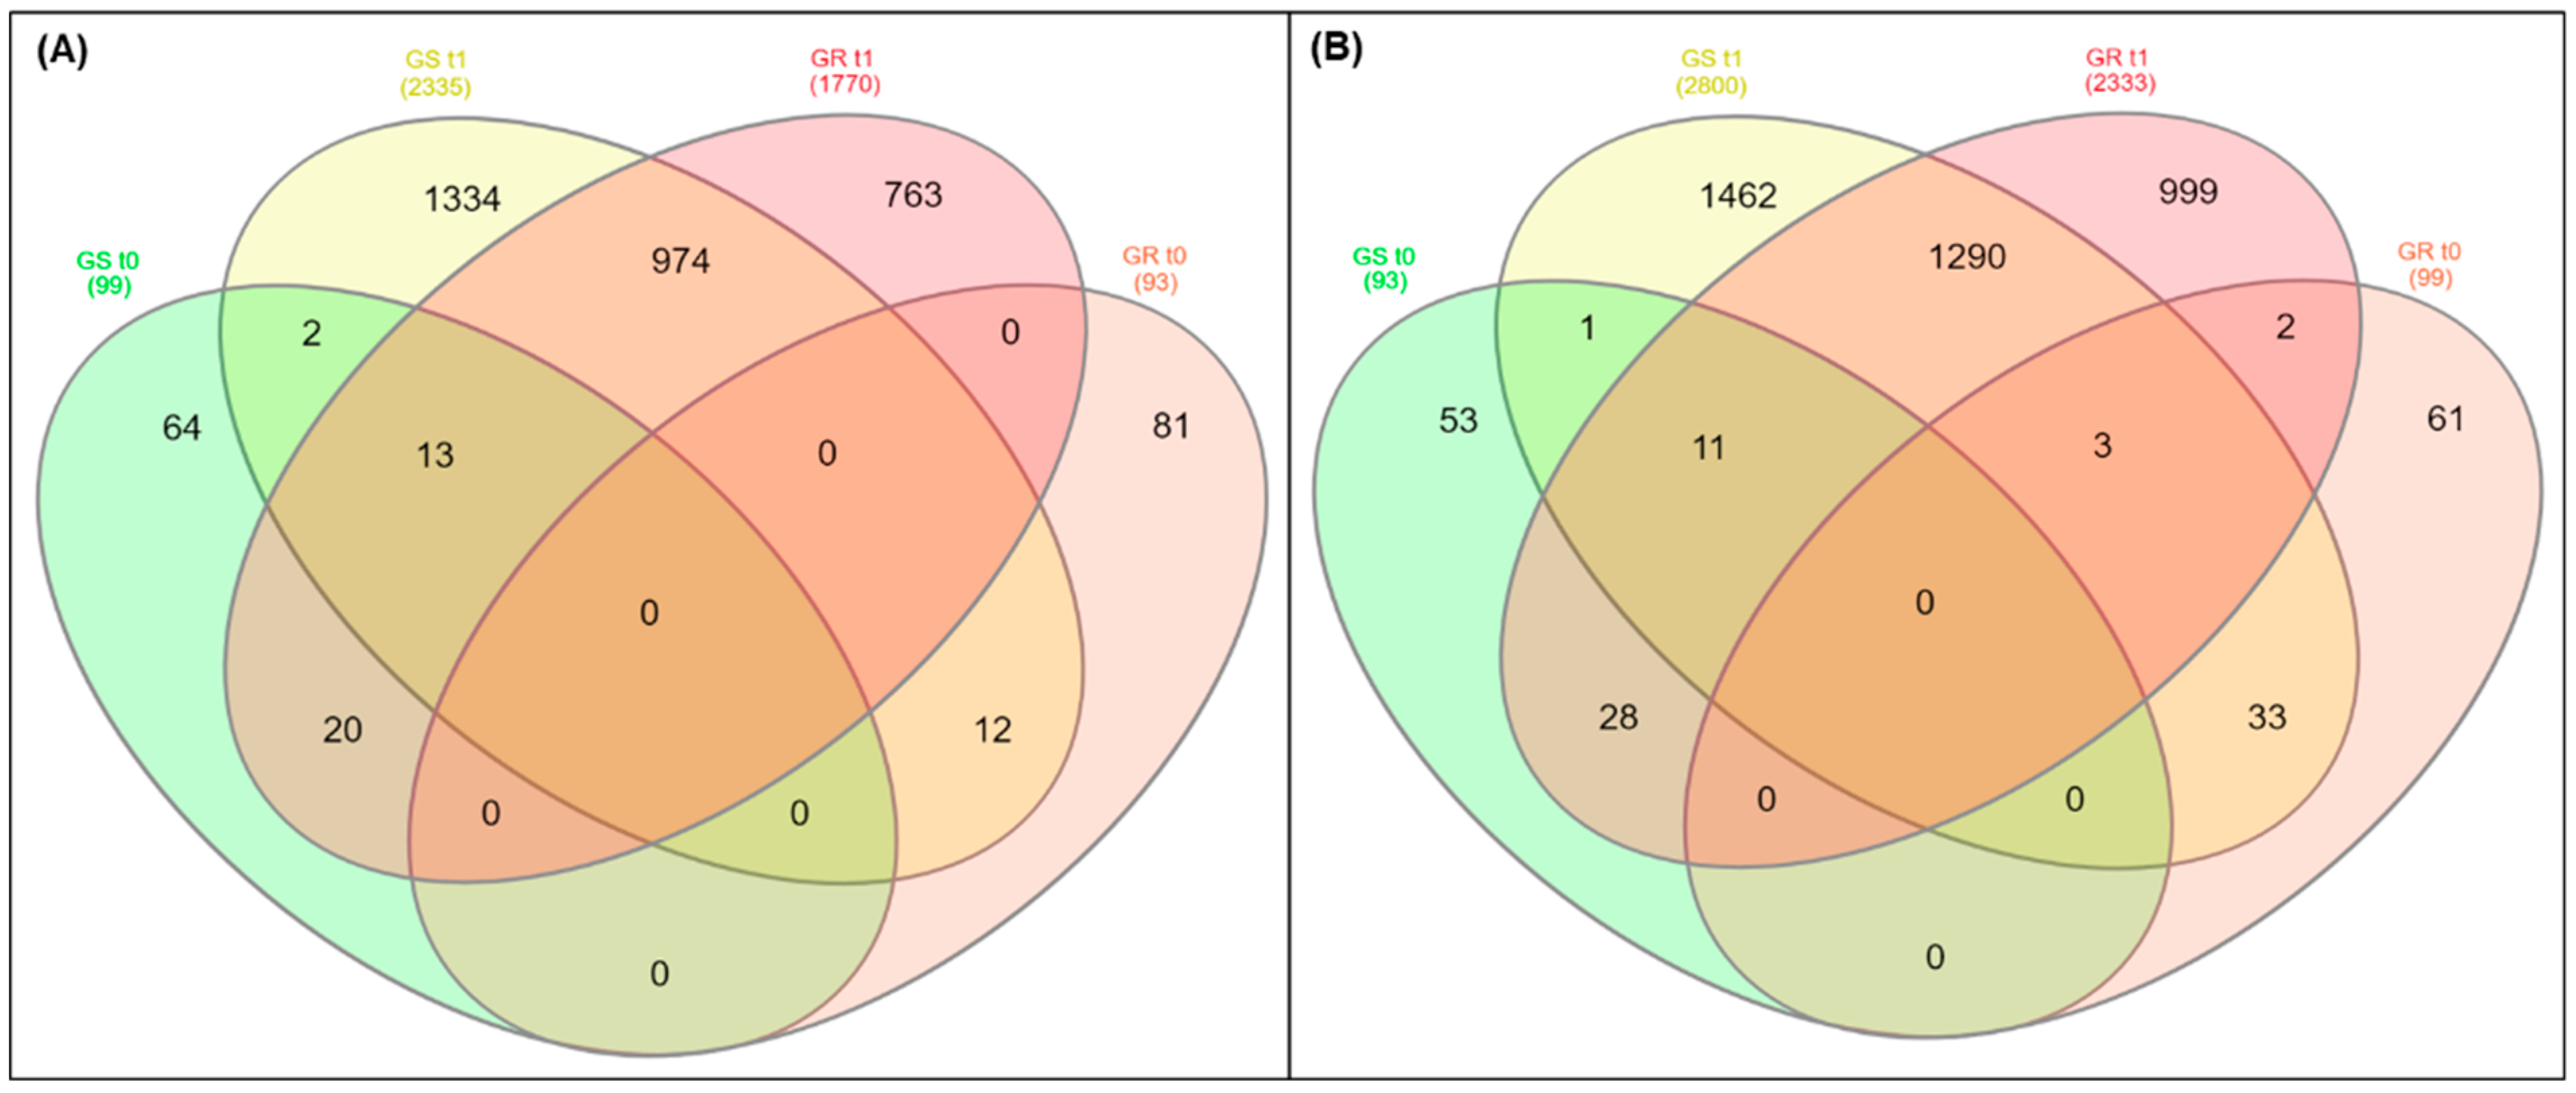
2.3. Differentially Expressed Genes
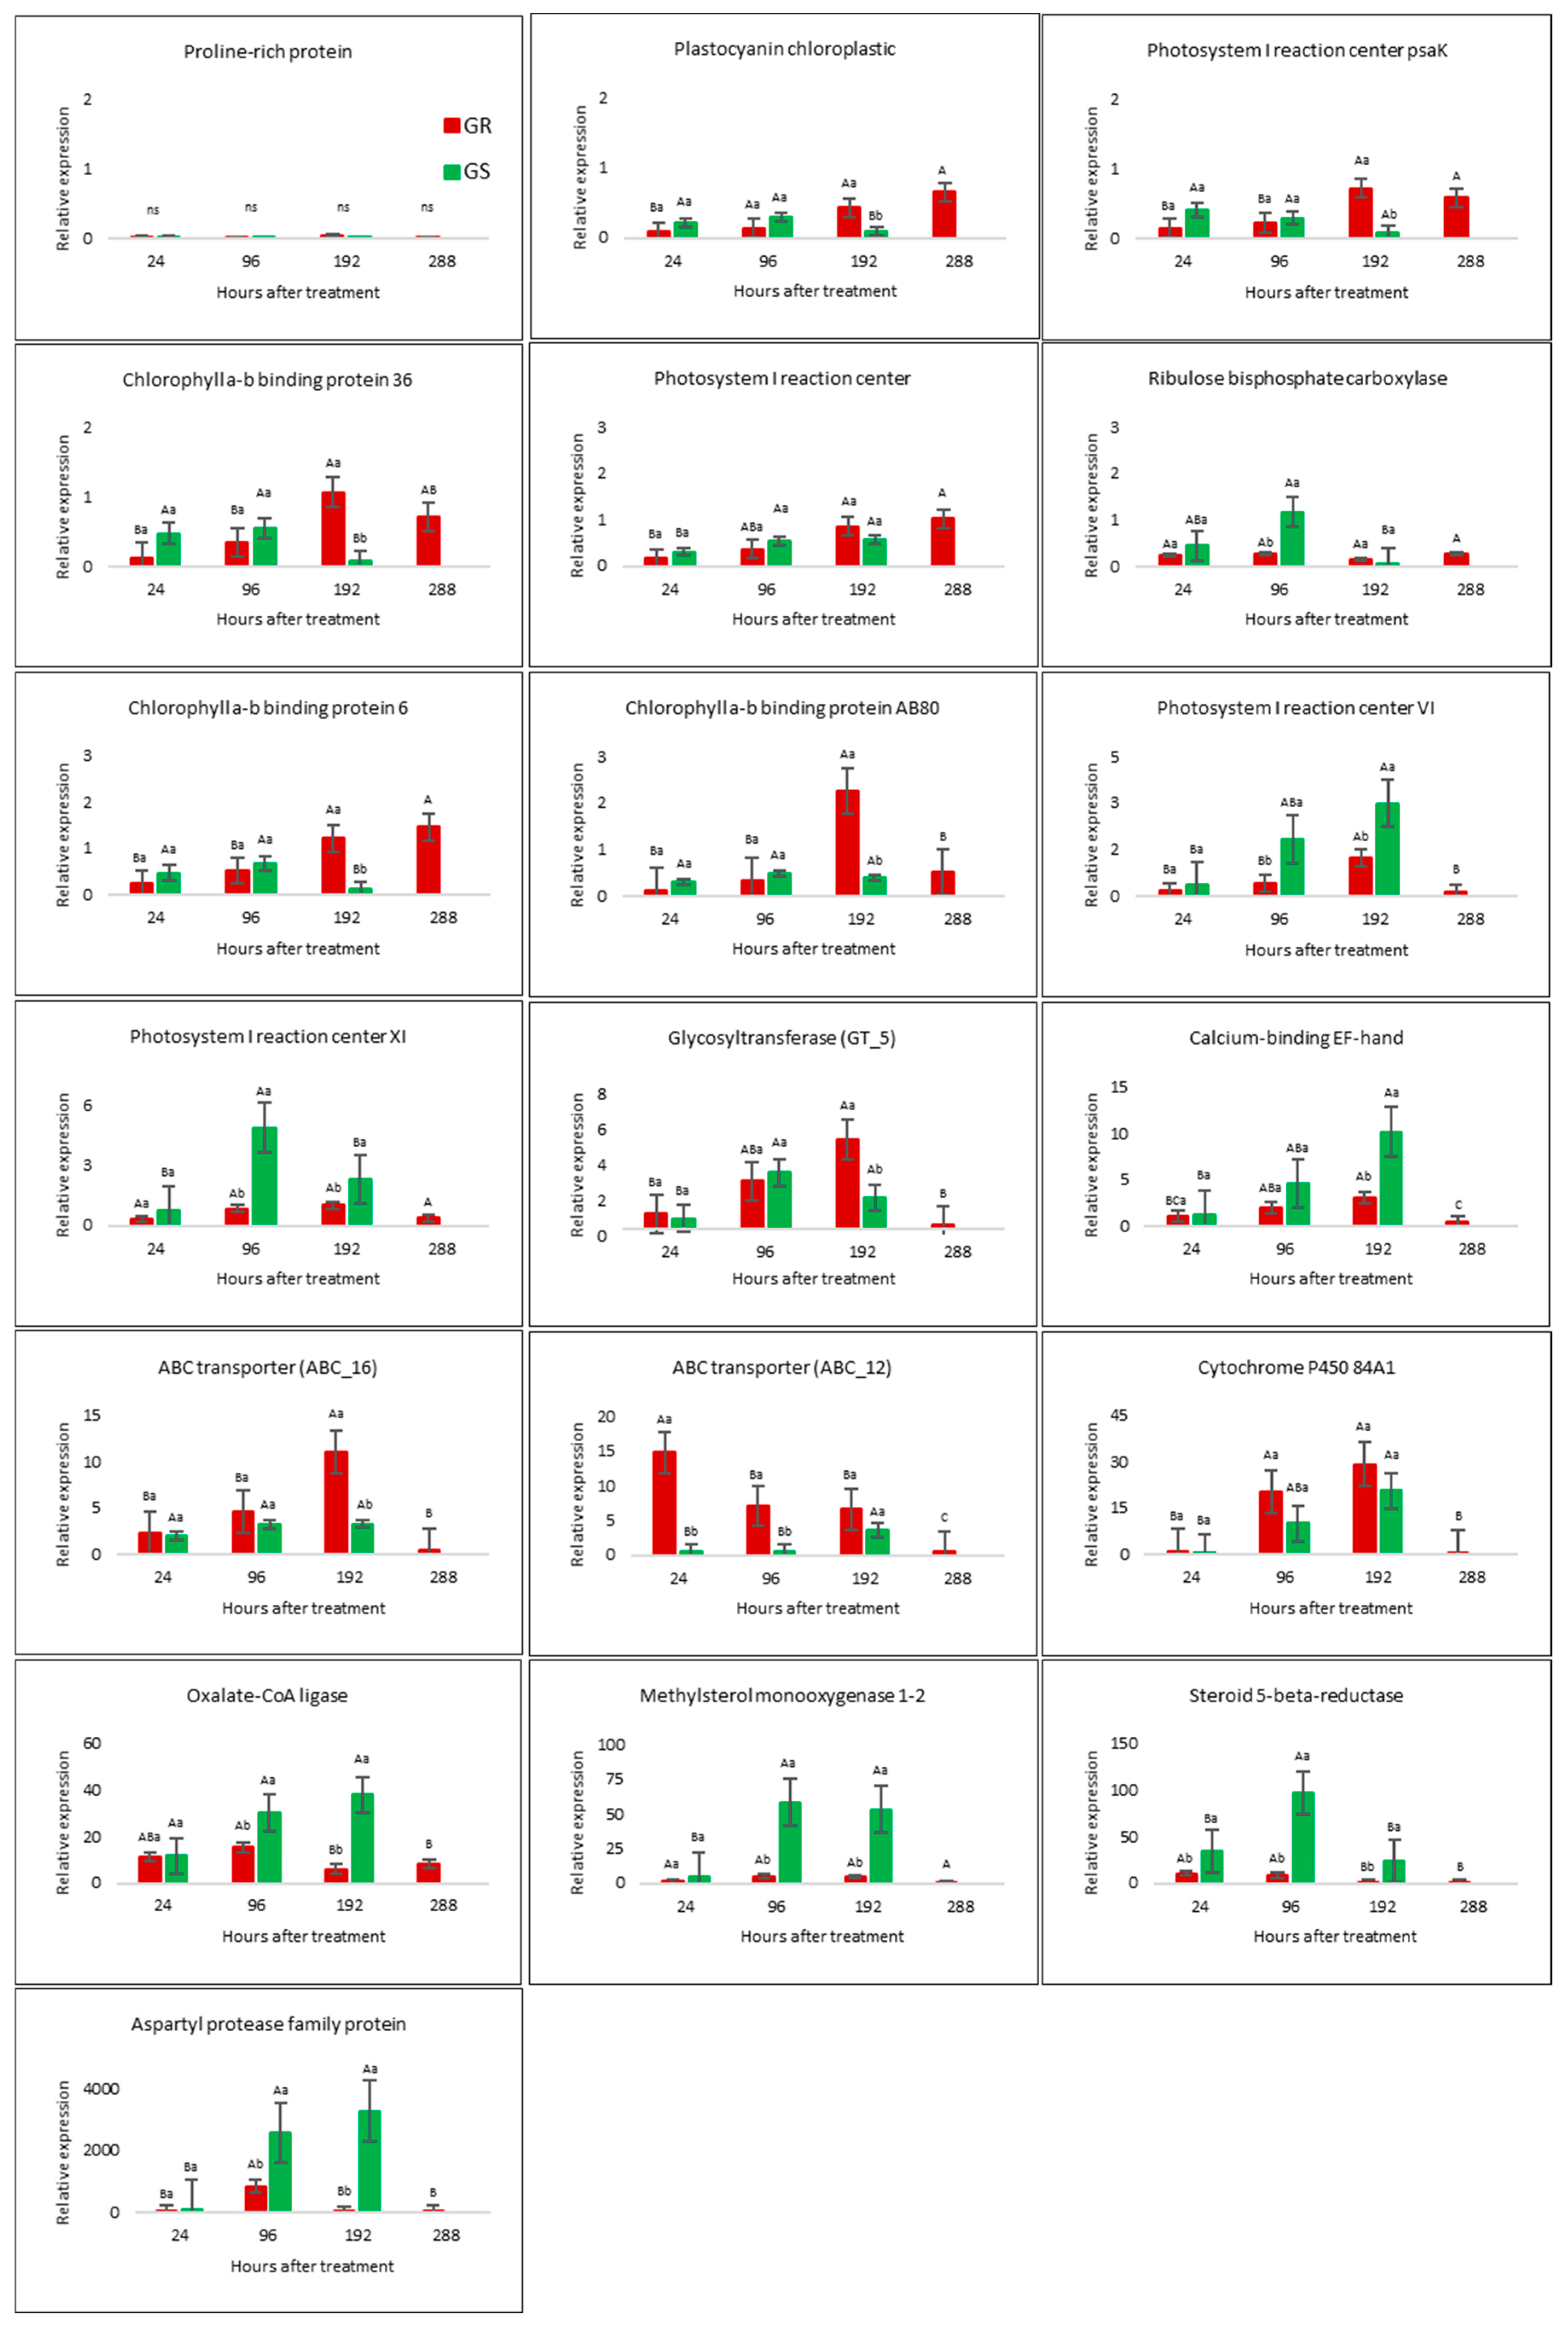
2.4. RNA-Seq Validation by qRT-PCR Analysis
2.5. EPSPS Sequence Analysis
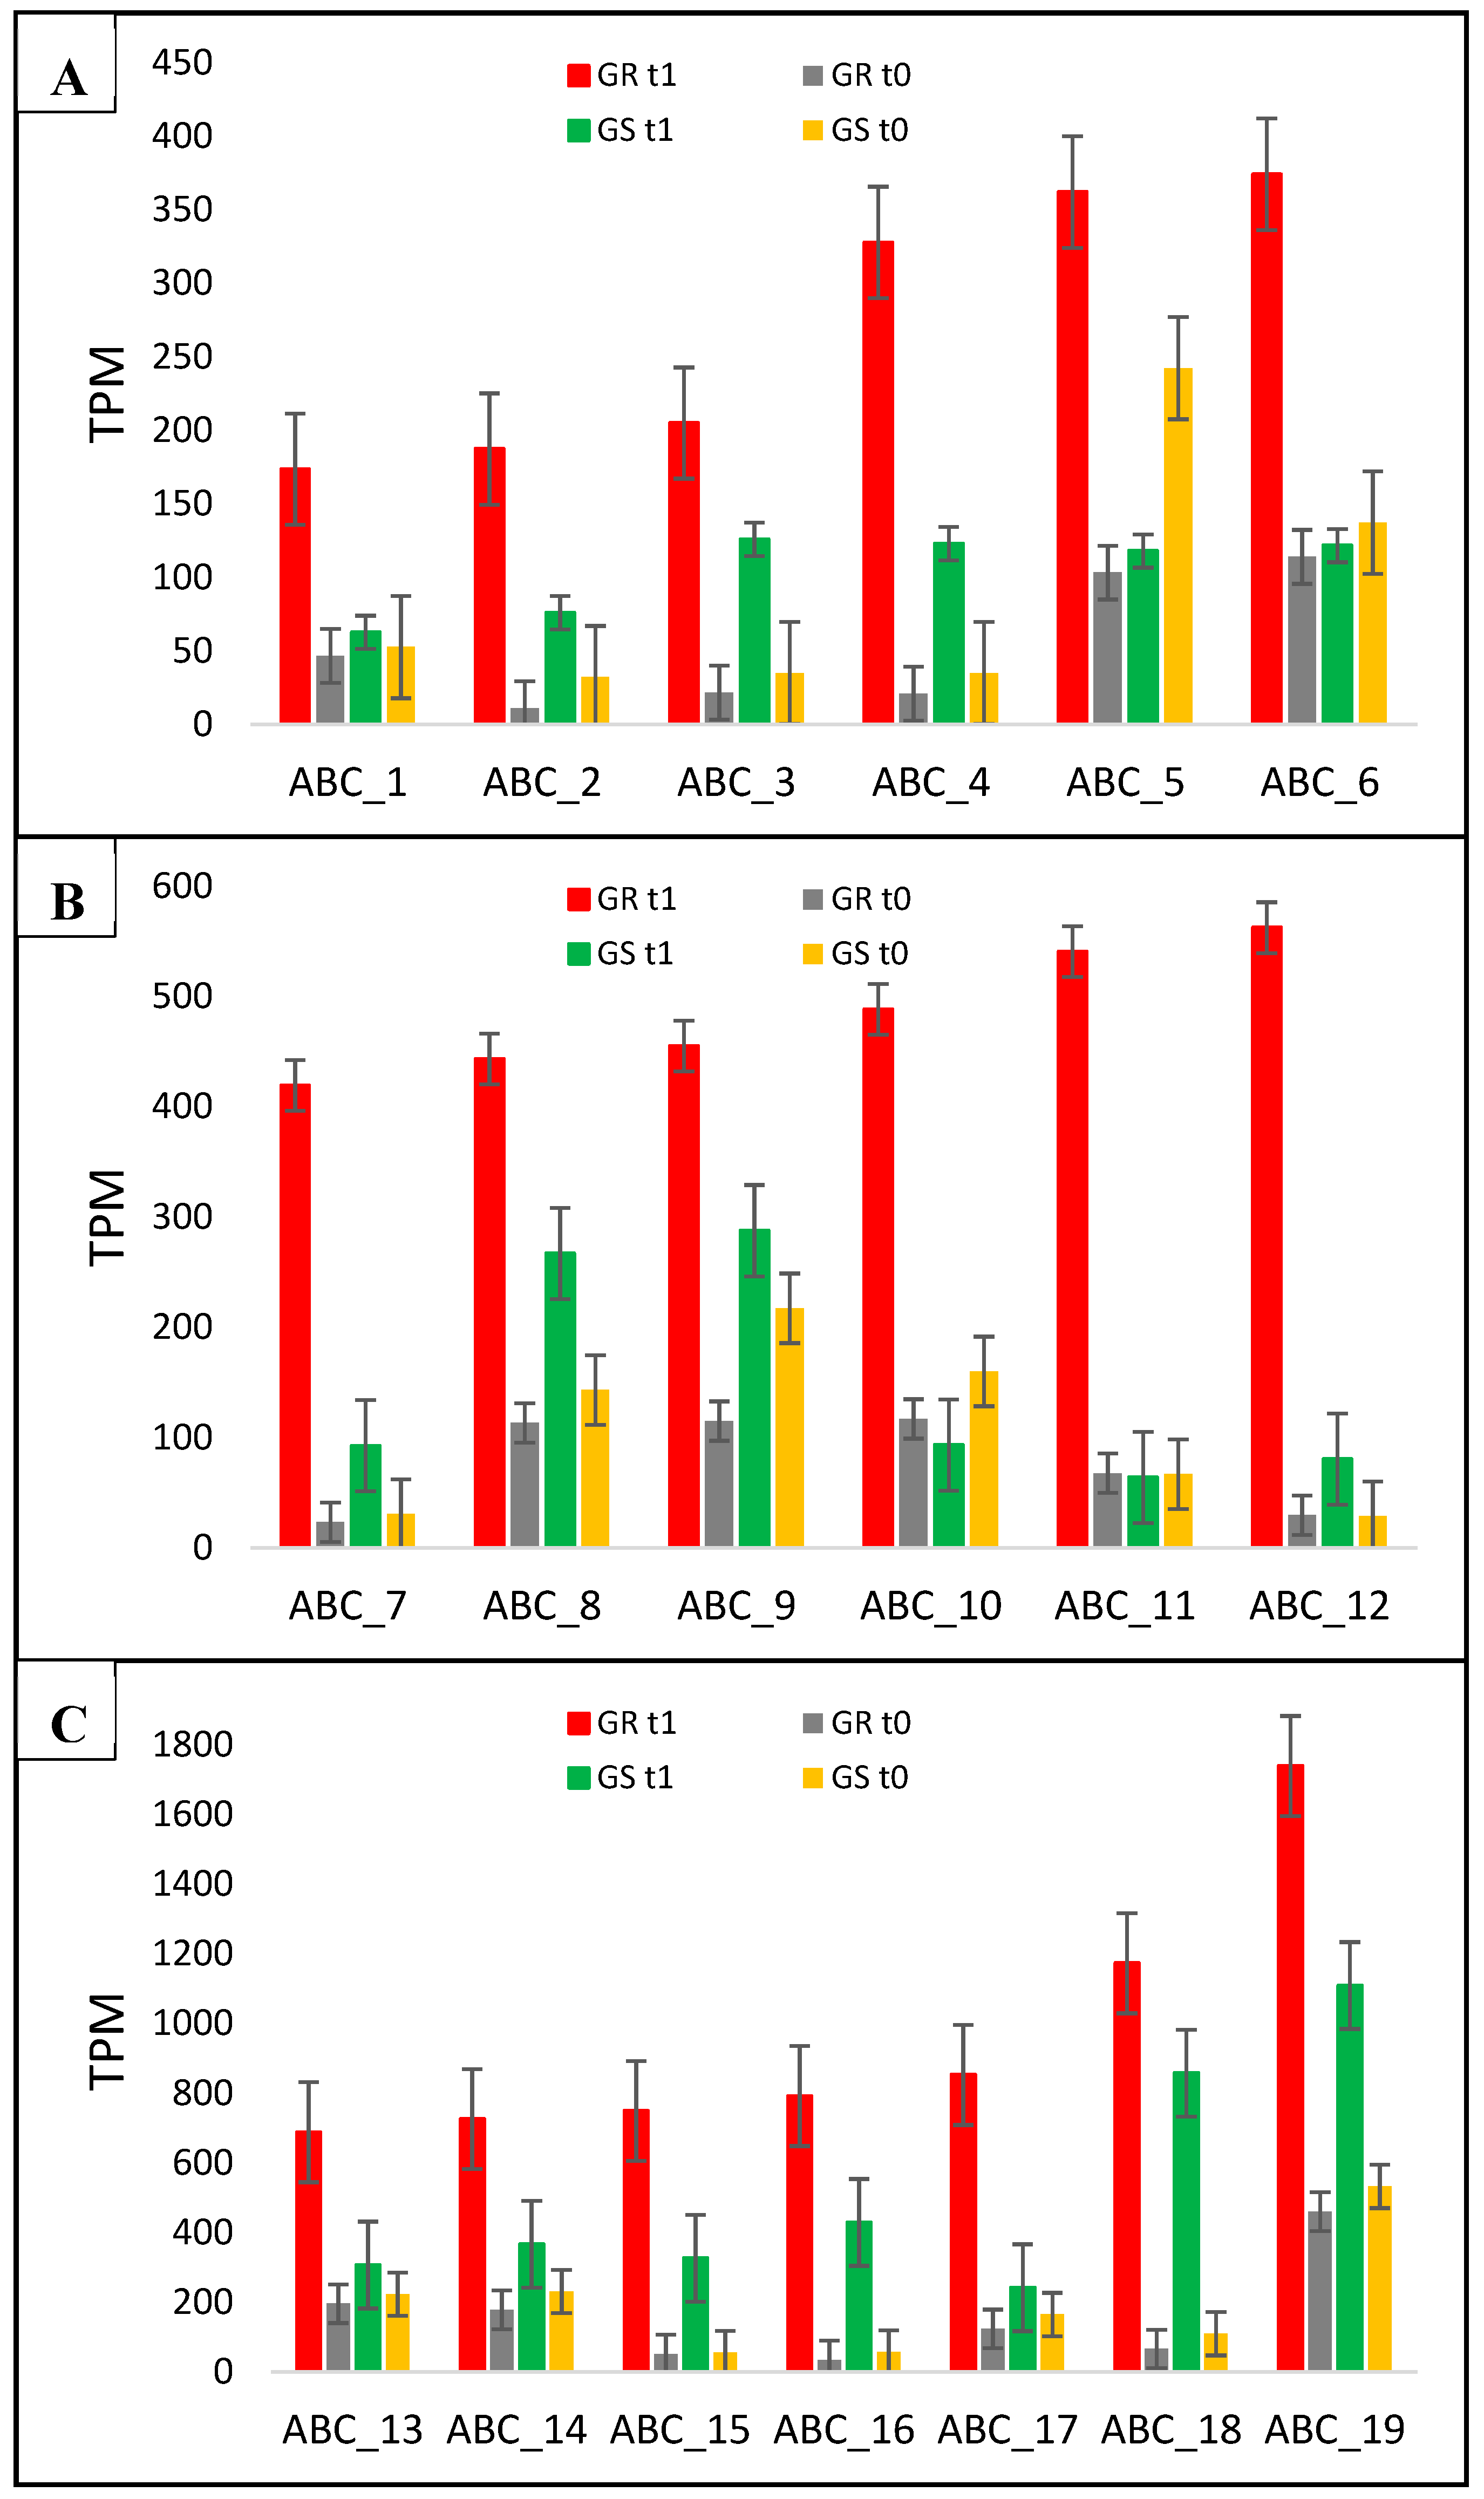
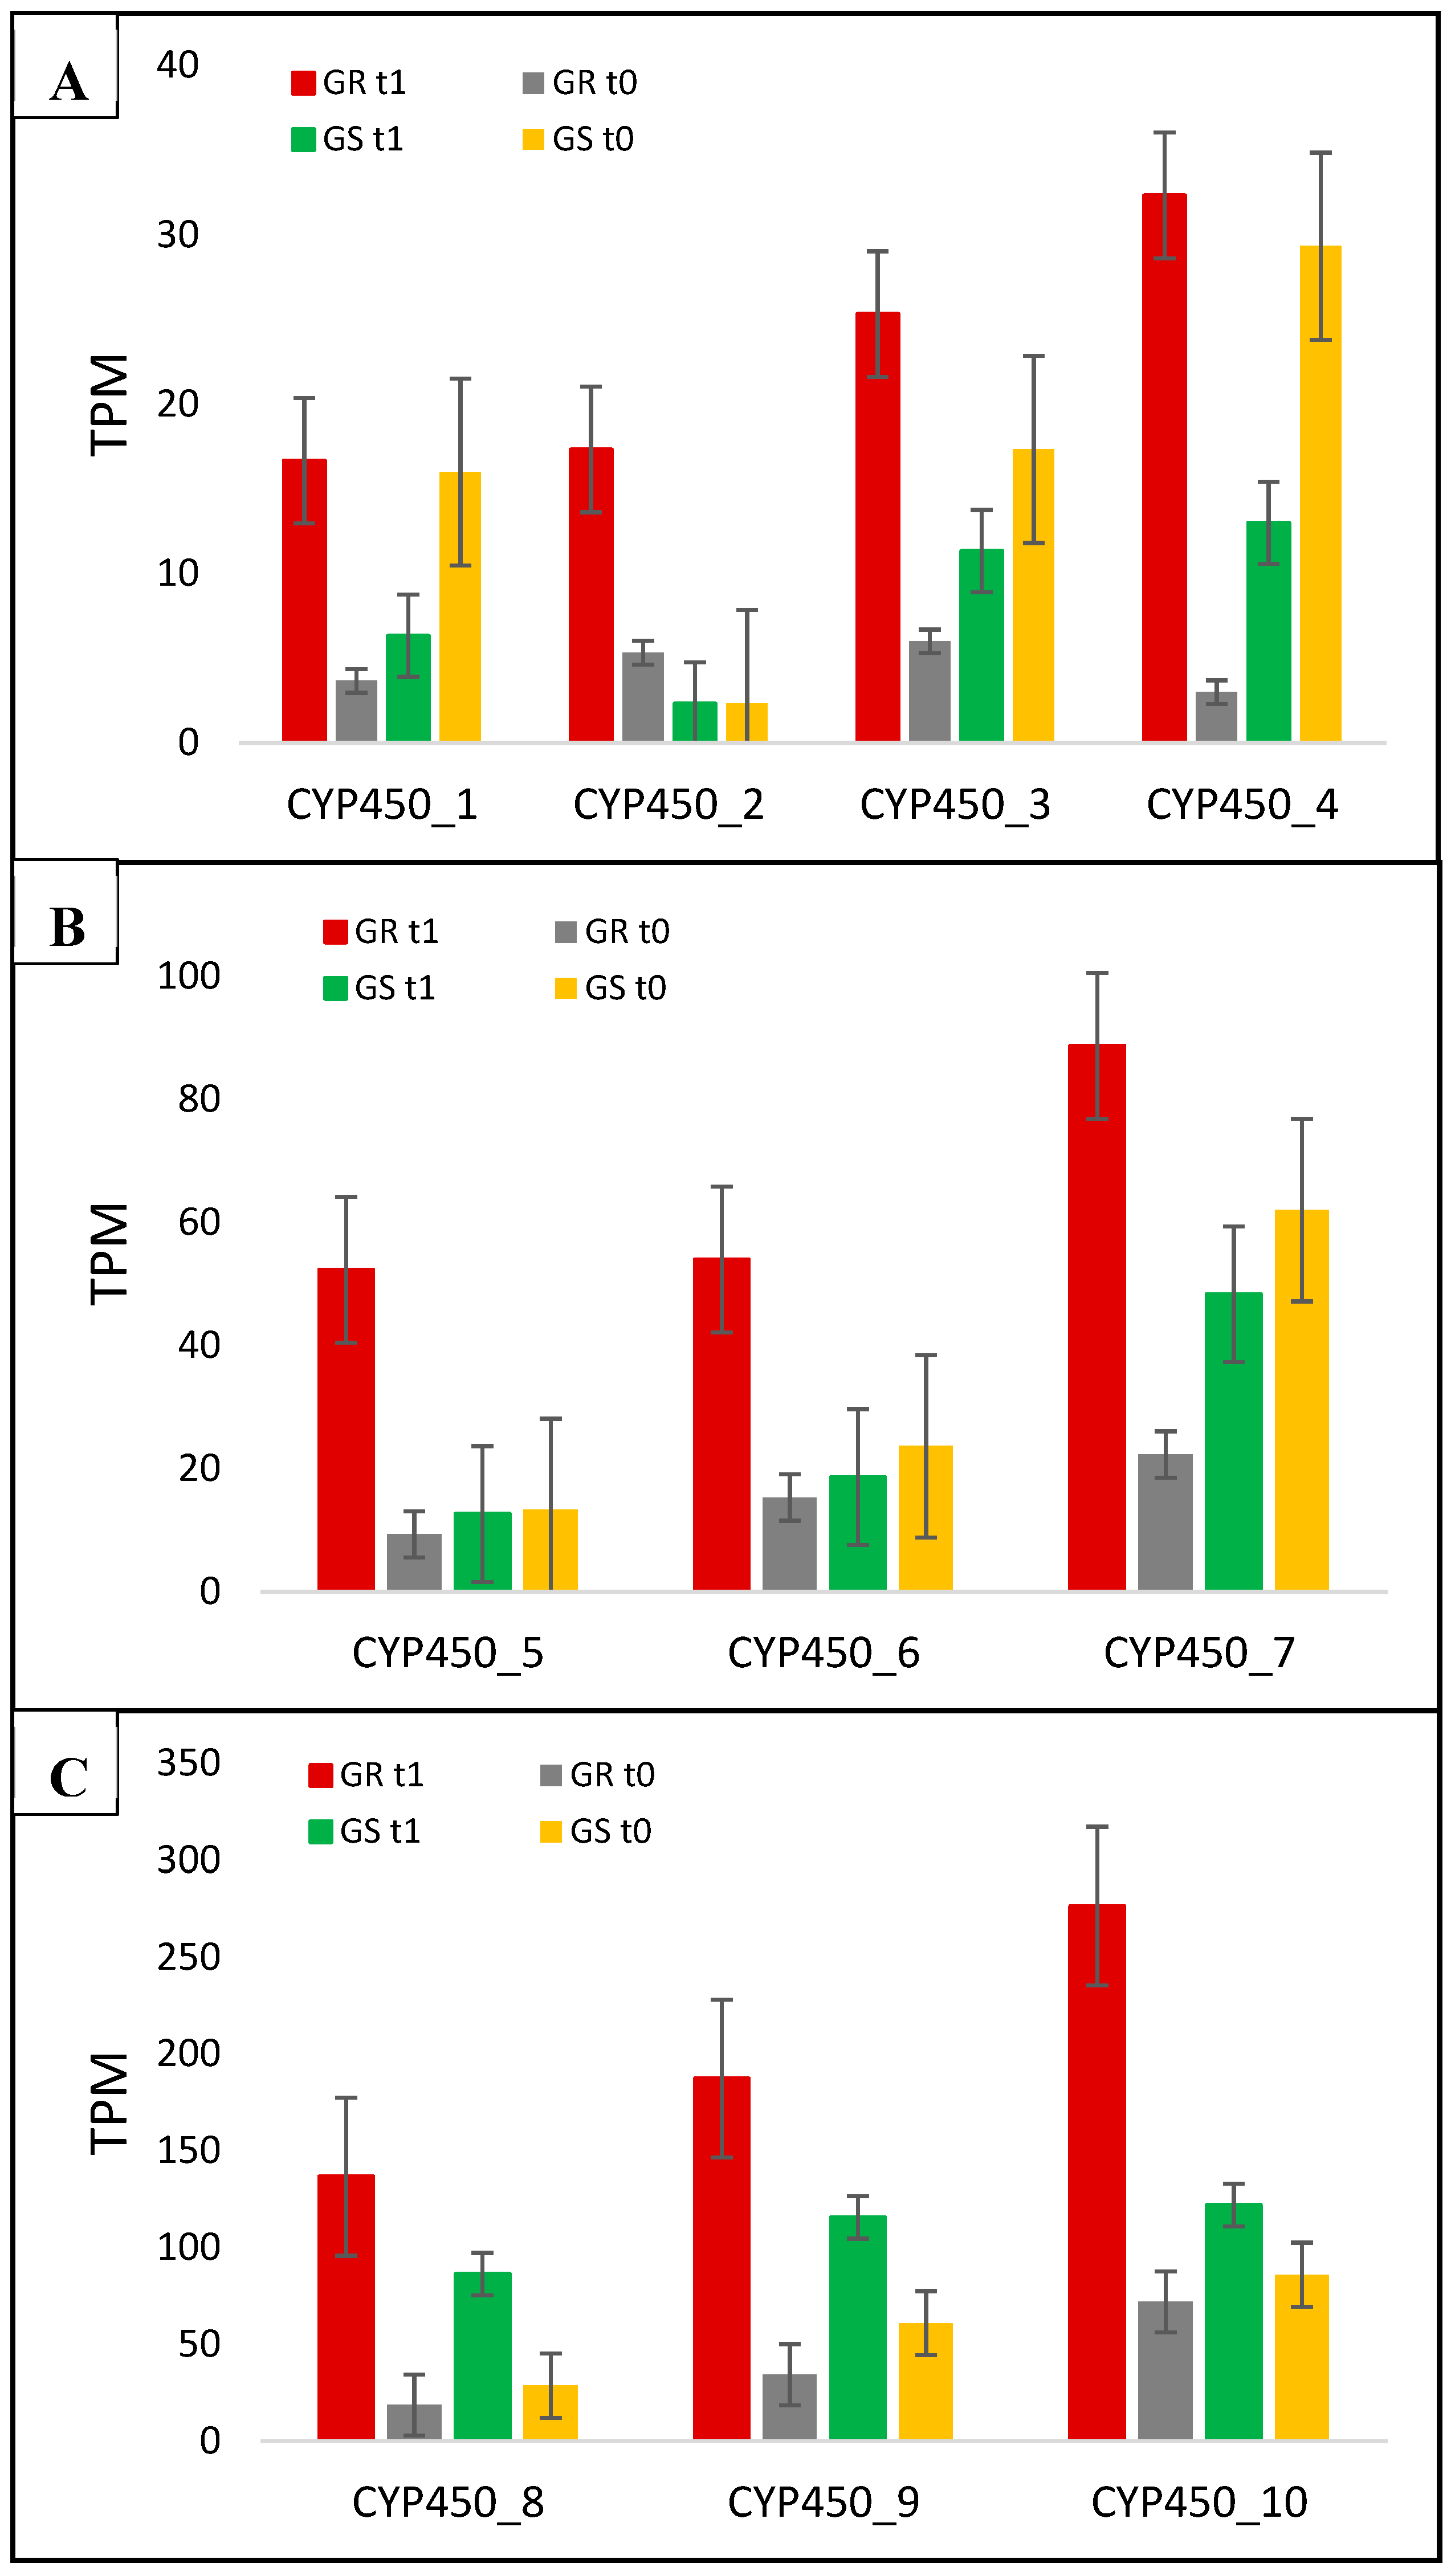
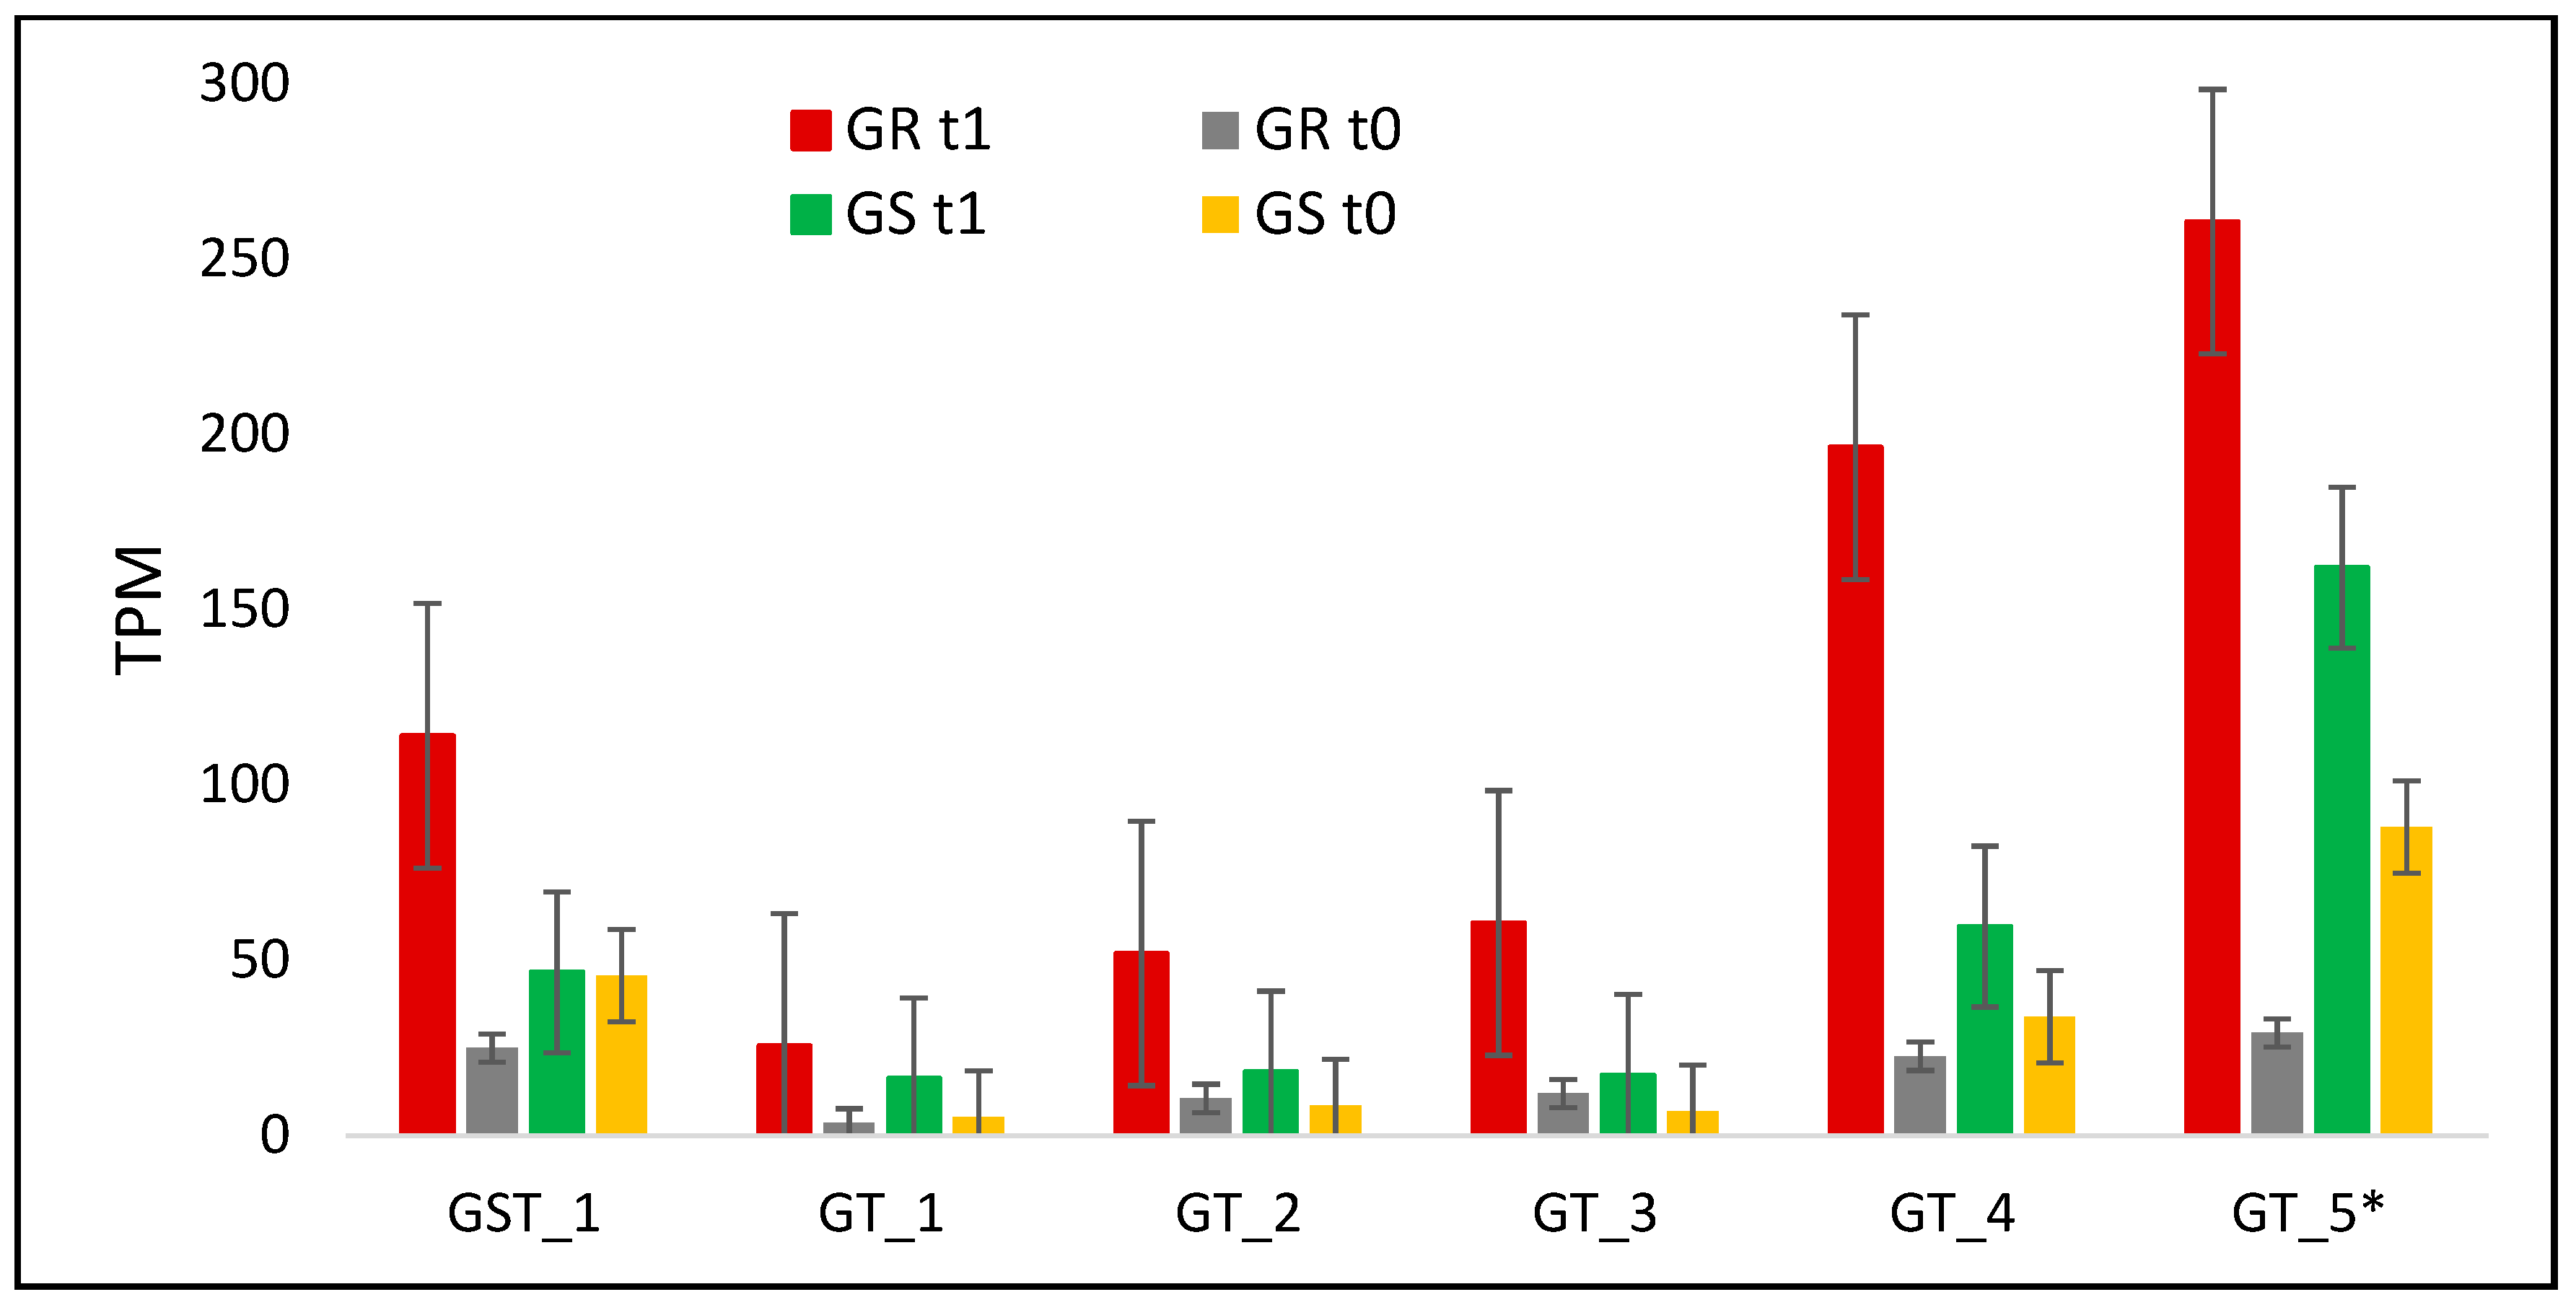
2.6. Candidate NTSR Genes Related to Putative Functions of Glyphosate Transport and Metabolism
3. Discussion
3.1. The C. Bonariensis Transcriptome
3.2. Candidate Genes Involved in Glyphosate Resistance in C. Bonariensis
4. Materials and Methods
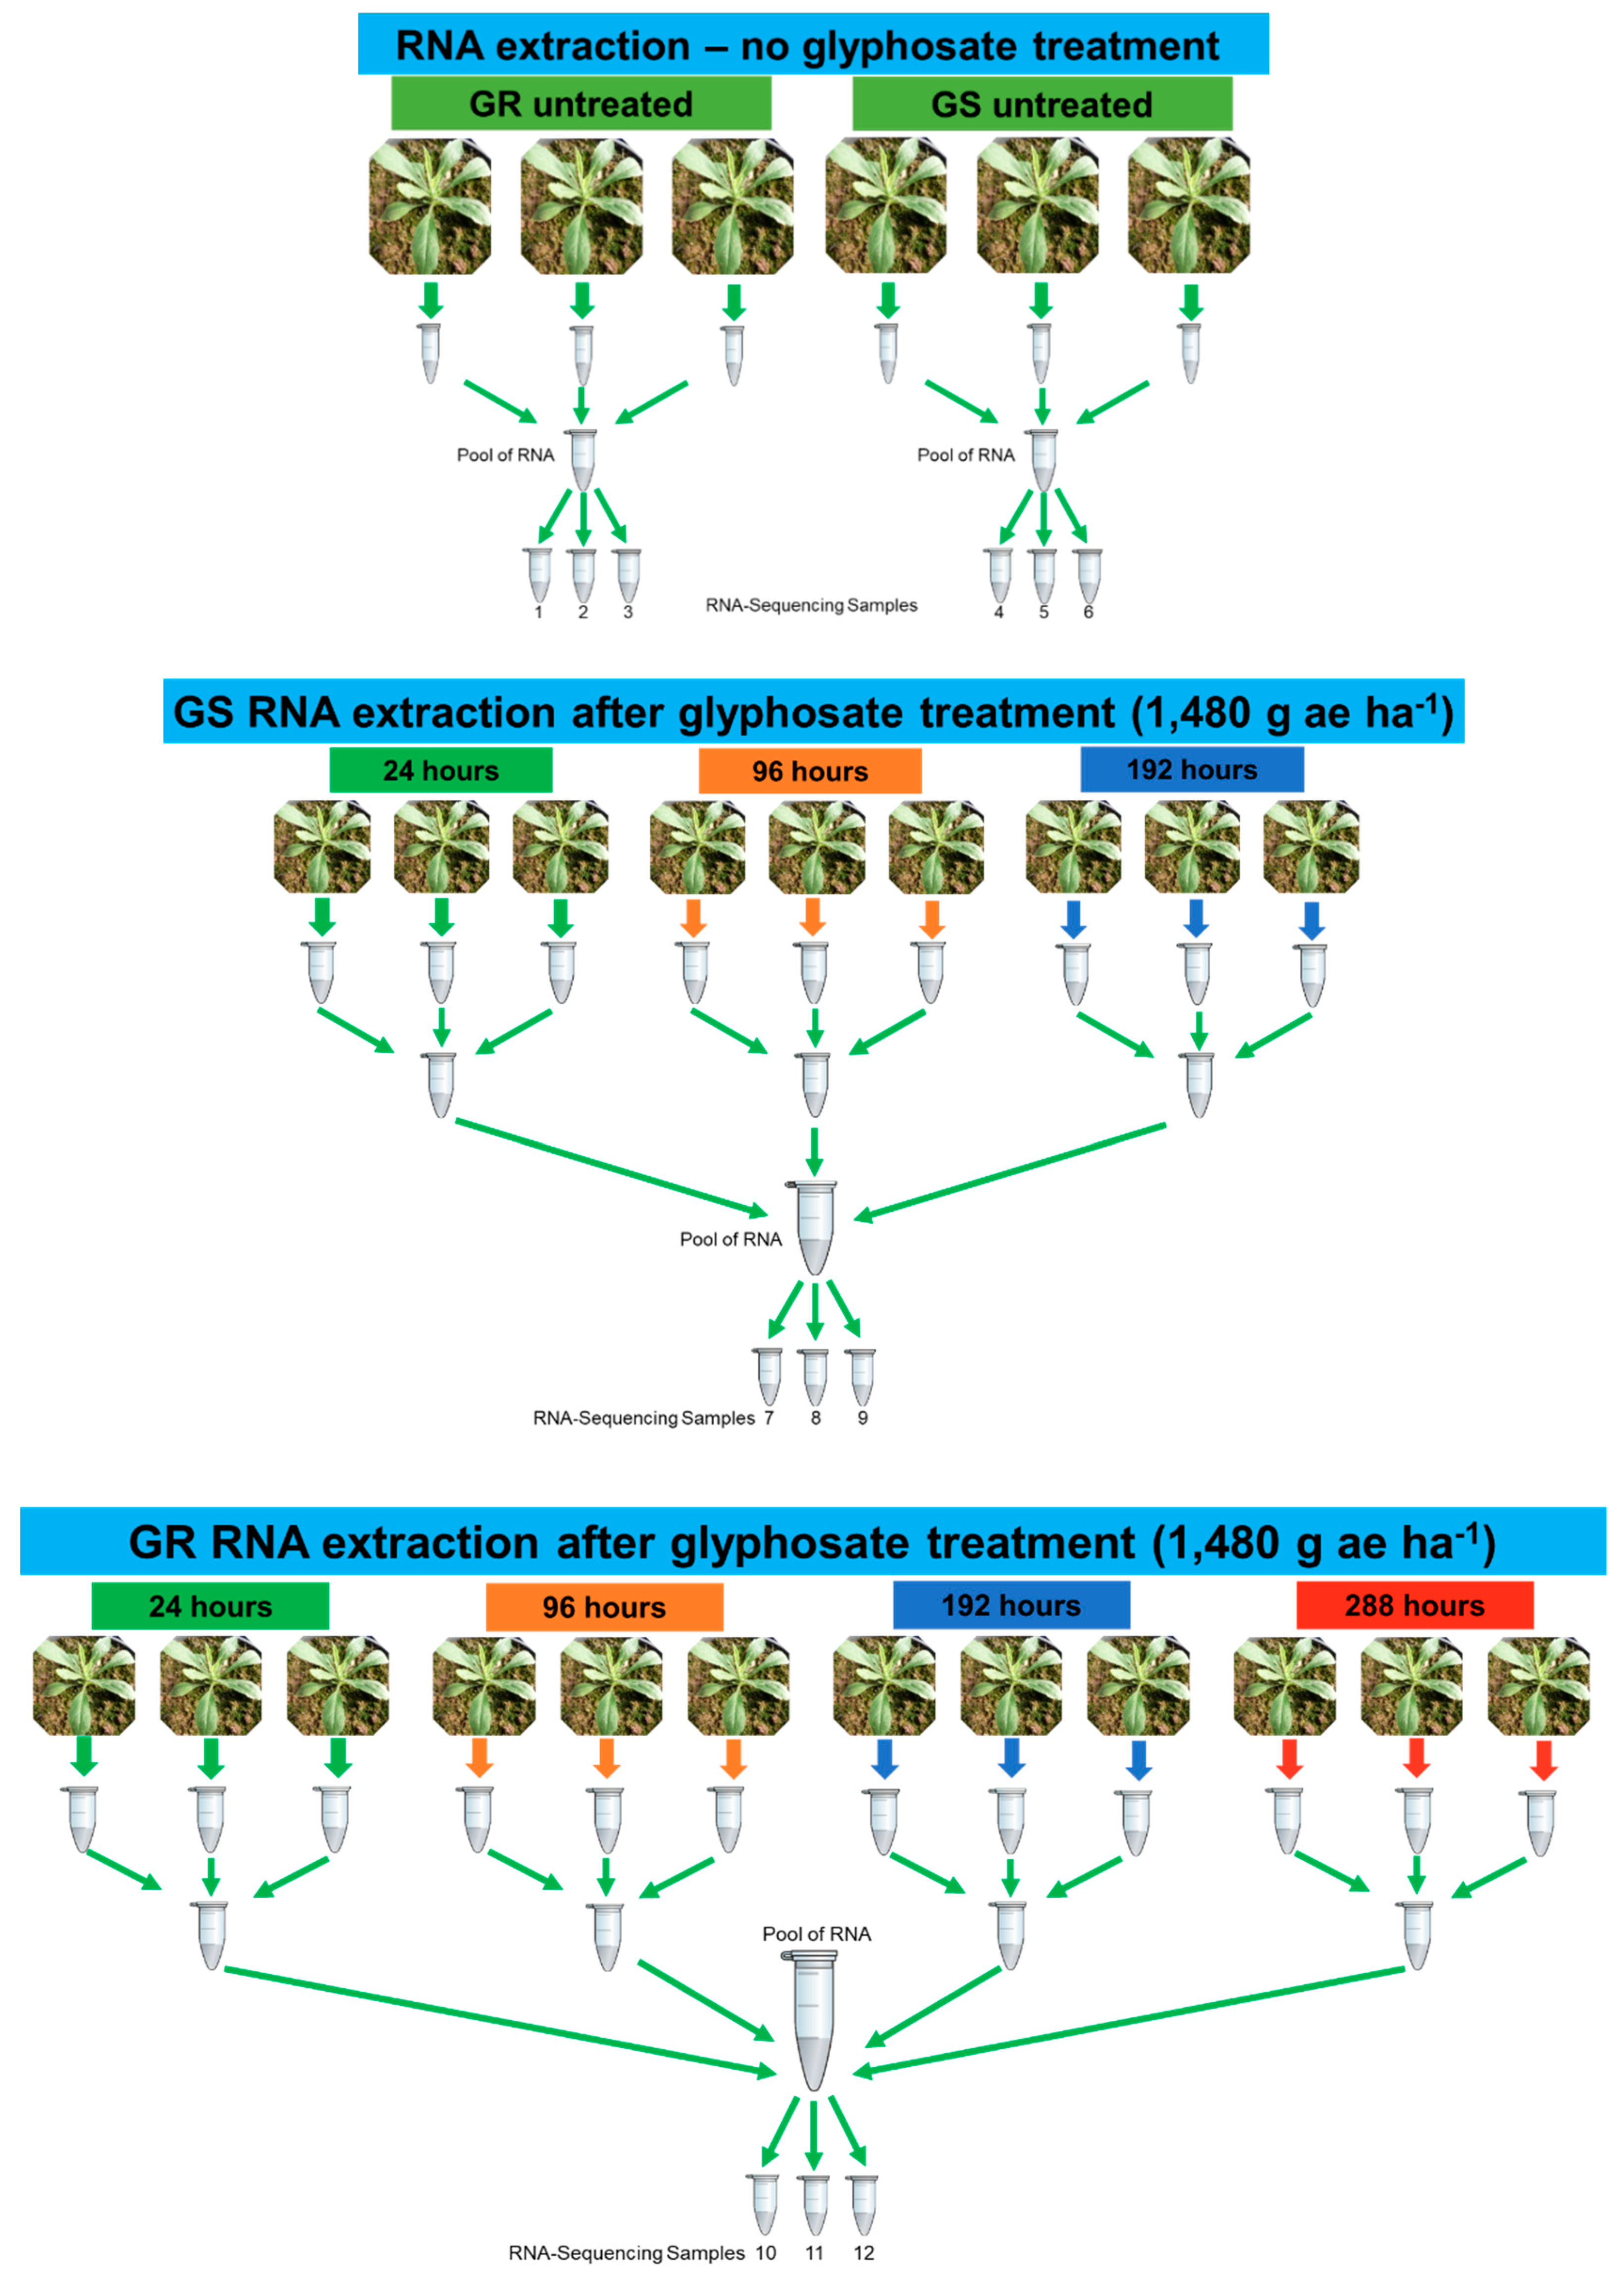
4.1. Plant Accessions, Experimental Treatments, and RNA Isolation
4.2. cDNA Library Construction and Illumina Sequencing
4.3. De Novo Assembly and Functional Annotation
4.4. Differential Expression Analysis
4.5. Quantitative Reverse Transcriptase Polymerase Chain Reaction (qRT-PCR) Analysis to Validate RNA-Seq Results
4.6. EPSPS Transcript Sequence Analysis
4.7. Selection of Similar Contig to Transport and Metabolic Glyphosate-Resistance Coding Gene
5. Conclusions
Supplementary Materials
Author Contributions
Funding
Acknowledgments
Conflicts of Interest
Data Availability
References
- Jeschke, P. Progress of modern agricultural chemistry and future prospects. Pest Manag. Sci. 2016, 72, 433–455. [Google Scholar] [CrossRef] [PubMed]
- Van Wychen, L. WSSA Calculates Billions in Potential Economic Losses from Uncontrolled Weeds. Weed Sci. Soc. Am. 2016. Available online: http://wssa.net/wp-content/uploads/WSSA-Crop-Losses-Release.pdf (accessed on 10 December 2018).
- Trezzi, M.M.; Vidal, R.A.; Patel, F.; Miotto, E.; Debastiani, F.; Balbinot, A.A.; Mosquen, R. Impact of Conyza bonariensis density and establishment period on soyabean grain yield, yield components and economic threshold. Weed Res. 2015, 55, 34–41. [Google Scholar] [CrossRef]
- Bajwa, A.A.; Sadia, S.; Ali, H.H.; Jabran, K.; Peerzada, A.M.; Chauhan, B.S. Biology and management of two important Conyza weeds: A global review. Environ. Sci. Pollut. Res. 2016, 23, 24694–24710. [Google Scholar] [CrossRef] [PubMed]
- Shrestha, A.; Steinhauer, K.M.; Moretti, M.L.; Hanson, B.D.; Jasieniuk, M.; Hembree, K.J.; Wright, S.D. Distribution of glyphosate-resistant and glyphosate-susceptible hairy fleabane (Conyza bonariensis) in central California and their phenological development. J. Pest Sci. 2014, 87, 201–209. [Google Scholar] [CrossRef]
- Amaro-Blanco, I.; Fernández-Moreno, P.T.; Osuna-Ruiz, M.D.; Bastida, F.; De Prado, R. Mechanisms of glyphosate resistance and response to alternative herbicide-based management in populations of the three Conyza species introduced in southern Spain. Pest Manag. Sci. 2018, 74, 1925–1937. [Google Scholar] [CrossRef] [PubMed]
- Trezzi, M.M.; Vidal, R.A.; Xavier, E.; Rosin, D.; Balbinot, A.A., Jr.; Prates, M. Resistência ao glyphosate em biótipos de buva (Conyza spp.) das regiões oeste e sudoeste do Paraná. Planta Daninha 2011, 29, 1113–1120. [Google Scholar] [CrossRef]
- Vargas, L.; Bianchi, M.; Rizzardi, M.; Agostinetto, D.; Dal Magro, T. Conyza bonariensis biotypes resistant to glyphosate in southern Brazil. Planta Daninha 2007, 25, 573–578. [Google Scholar] [CrossRef]
- Heap, I. The International Survey of Herbicide Resistant Weeds. Available online: www.weedscience.org (accessed on 10 January 2019).
- Kleinman, Z.; Ben-Ami, G.; Rubin, B. From sensitivity to resistance—Factors affecting the response of Conyza spp. to glyphosate. Pest Manag. Sci. 2016, 72, 1681–1688. [Google Scholar] [CrossRef]
- Kleinman, Z.; Rubin, B. Non-target-site glyphosate resistance in Conyza bonariensis is based on modified subcellular distribution of the herbicide. Pest Manag. Sci. 2017, 73, 246–253. [Google Scholar] [CrossRef]
- Matzrafi, M.; Lazar, T.W.; Sibony, M.; Rubin, B. Conyza species: Distribution and evolution of multiple target-site herbicide resistances. Planta 2015, 242, 259–267. [Google Scholar] [CrossRef] [PubMed]
- Duke, S.O. The history and current status of glyphosate. Pest Manag. Sci. 2018, 74, 1027–1034. [Google Scholar] [CrossRef] [PubMed]
- Powles, S.B.; Yu, Q. Evolution in Action: Plants resistant to herbicides. Annu. Rev. Plant Biol. 2010, 61, 317–347. [Google Scholar] [CrossRef] [PubMed]
- Baucom, R.S.; Holt, J.S. Weeds of agricultural importance: Bridging the gap between evolutionary ecology and crop and weed science. New Phytol. 2009, 184, 741–743. [Google Scholar] [CrossRef] [PubMed]
- Hereward, J.P.; Werth, J.A.; Thornby, D.F.; Keenan, M.; Chauhan, B.S.; Walter, G.H. Gene expression in response to glyphosate treatment in fleabane (Conyza bonariensis)—Glyphosate death response and candidate resistance genes. Pest Manag. Sci. 2018, 74, 2346–2355. [Google Scholar] [CrossRef] [PubMed]
- Maroli, A.S.; Gaines, T.A.; Foley, M.E.; Duke, S.O.; Doğramacı, M.; Anderson, J.V.; Horvath, D.P.; Chao, W.S.; Tharayil, N. Omics in weed science: A perspective from genomics, transcriptomics, and metabolomics approaches. Weed Sci. 2018, 66, 681–695. [Google Scholar] [CrossRef]
- Délye, C.; Duhoux, A.; Pernin, F.; Riggins, C.W.; Tranel, P.J. Molecular mechanisms of herbicide resistance. Weed Sci. 2015, 63, 91–115. [Google Scholar] [CrossRef]
- Sammons, R.D.; Gaines, T.A. Glyphosate resistance: State of knowledge. Pest Manag. Sci. 2014, 70, 1367–1377. [Google Scholar] [CrossRef]
- Yuan, J.S.; Tranel, P.J.; Stewart, C.N. Non-target-site herbicide resistance: A family business. Trends Plant Sci. 2007, 12, 1360–1385. [Google Scholar] [CrossRef]
- Moretti, M.L.; Alárcon-Reverte, R.; Pearce, S.; Morran, S.; Hanson, B.D. Transcription of putative tonoplast transporters in response to glyphosate and paraquat stress in Conyza bonariensis and Conyza canadensis and selection of reference genes for qRT-PCR. PLoS ONE 2017. [Google Scholar] [CrossRef]
- Feng, P.C.C.; Tran, M.; Chiu, T.; Sammons, R.D.; Heck, G.R.; CaJacob, C.A. Investigations into glyphosate-resistant horseweed (Conyza canadensis): Retention, uptake, translocation, and metabolism. Weed Sci. 2004, 52, 498–505. [Google Scholar] [CrossRef]
- Peng, Y.; Abercrombie, L.G.; Yuan, J.S.; Riggins, C.W.; Sammons, R.D.; Tranel, J.; Stewart, C.N. Characterization of the horseweed (Conyza canadensis) transcriptome using GS-FLX 454 pyrosequencing and its application for expression analysis of candidate non-target herbicide resistance genes. Pest Manag. Sci. 2010, 66, 1053–1062. [Google Scholar] [CrossRef] [PubMed]
- Yuan, J.S.; Abercrombie, L.L.G.; Cao, Y.; Halfhill, M.D.; Zhou, X.; Peng, Y.; Hu, J.; Rao, M.R.; Heck, G.R.; Larosa, T.J.; et al. Functional Genomics Analysis of Horseweed (Conyza canadensis) with Special Reference to the Evolution of Non–Target-Site Glyphosate Resistance. Weed Sci. 2010, 58, 109–117. [Google Scholar] [CrossRef]
- Délye, C. Unraveling the genetic bases of non-target-site-based resistance (NTSR) to herbicides: A major challenge for weed science in the forthcoming decade. Pest Manag. Sci. 2013, 69, 176–187. [Google Scholar] [CrossRef] [PubMed]
- Gardin, J.A.C.; Gouzy, J.; Carrère, S.; Délye, C. ALOMYbase, a resource to investigate non-target-site-based resistance to herbicides inhibiting acetolactate-synthase (ALS) in the major grass weed Alopecurus myosuroides (black-grass). BMC Genom. 2015, 16, 590. [Google Scholar] [CrossRef] [PubMed]
- Gehan, M.A.; Greenham, K.; Mockler, T.C.; McClung, C.R. Transcriptional networks-crops, clocks, and abiotic stress. Curr. Opin. Plant Biol. 2015, 24, 39–46. [Google Scholar] [CrossRef]
- Piasecki, C.; Carvalho, I.; Cechin, J.; Goulart, F.; Maia, L.; Agostinetto, D.; Caverzan, A.; Stewart, C.N., Jr.; Vargas, L. Oxidative stress and differential antioxidant enzyme activity in glyphosate-resistant and sensitive hairy fleabane in response to glyphosate treatment. Bragantia 2019, in press. [Google Scholar]
- Mueller, T.M.; Massey, J.H.; Hayes, R.M.; Main, C.L.; Stewart, C.N., Jr. Shikimate accumulates in both glyphosate-sensitive and glyphosate-resistant horseweed (Conyza canadensis L. Cronq.). J. Agric. Food Chem. 2003, 51, 680–684. [Google Scholar] [CrossRef]
- Délye, C.; Jasieniuk, M.; Le Corre, V. Deciphering the evolution of herbicide resistance in weeds. Trends Genet. 2013, 29, 649–658. [Google Scholar] [CrossRef]
- Cobb, A.H.; Reade, J.P.H. Herbicides and Plant Physiology, 2nd ed.; Wiley-Blackwell: Shropshire, UK, 2010; p. 286. [Google Scholar]
- González-Torralva, F.; Brown, A.P.; Chivasa, S. Comparative proteomic analysis of horseweed (Conyza canadensis) biotypes identifies candidate proteins for glyphosate resistance. Sci. Rep. 2017, 7, 42565. [Google Scholar] [CrossRef]
- Gaines, T.A.; Lorentz, L.; Figge, A.; Herrmann, J.; Maiwald, F.; Ott, M.C.; Han, H.; Busi, R.; Yu, Q.; Powles, S.B.; et al. RNA-Seq transcriptome analysis to identify genes involved in metabolism-based diclofop resistance in Lolium rigidum. Plant J. 2014, 78, 865–876. [Google Scholar] [CrossRef]
- Maroli, A.S.; Nandula, V.K.; Dayan, F.E.; Duke, S.O.; Gerard, P.; Tharayil, N. Metabolic profiling and enzyme analyses indicate a potential role of antioxidant systems in complementing glyphosate resistance in an Amaranthus palmeri biotype. J. Agric. Food Chem. 2015, 63, 9199–9209. [Google Scholar] [CrossRef]
- Kreuz, K.; Tommasini, R.; Martinoia, E. Old enzymes for a new job: Herbicide detoxification in plants. Plant Physiol. 1996, 111, 349–353. [Google Scholar] [CrossRef]
- Siminszky, B. Plant cytochrome P450-mediated herbicide metabolism. Phytochem. Rev. 2006, 5, 445–458. [Google Scholar] [CrossRef]
- Schuler, M.A.; Werck-Reichhart, D. Functional genomics of P450s. Annu. Rev. Plant Biol. 2003, 54, 629–667. [Google Scholar] [CrossRef]
- Xu, J.; Wang, X.; Guo, W. The cytochrome P450 superfamily: Key players in plant development and defense. J. Integr. Agric. 2015, 14, 1673–1686. [Google Scholar] [CrossRef] [Green Version]
- Cummins, I.; Dixon, D.P.; Freitag-Pohl, S.; Skipsey, M.; Edwards, R. Multiple roles for plant glutathione transferases in xenobiotic detoxification. Drug Metab. Rev. 2011, 43, 266–280. [Google Scholar] [CrossRef]
- Busi, R.; Porri, A.; Gaines, T.A.; Powles, S.B.P. Pyroxasulfone resistance in Lolium rigidum is metabolism-based. Pestic. Biochem. Physiol. 2018, 148, 74–80. [Google Scholar] [CrossRef]
- Bowles, D.; Lim, E.-K.; Poppenberger, B.; Vaistij, F.E. Glycosyltransferases of lipophilic small molecules. Annu. Rev. Plant Biol. 2006, 57, 567–597. [Google Scholar] [CrossRef]
- Tani, E.; Chachalis, D.; Travlos, I.S. A Glyphosate resistance mechanism in Conyza canadensis involves synchronization of EPSPS and ABC-transporter genes. Plant Mol. Biol. Rep. 2015, 33, 1721–1730. [Google Scholar] [CrossRef]
- Tani, E.; Chachalis, D.; Travlos, I.S.; Bilalis, D. Environmental conditions influence induction of key ABC-transporter genes affecting glyphosate resistance mechanism in Conyza canadensis. Int. J. Mol. Sci. 2016, 17, 342. [Google Scholar] [CrossRef]
- Dinelli, G.; Marotti, I.; Bonetti, A.; Catizone, P.; Urbano, J.M.; Barnes, J. Physiological and molecular basis of glyphosate resistance in C. bonariensis (L.) Cronq. biotypes from Spain. Weed Res. 2008, 48, 257–265. [Google Scholar] [CrossRef]
- Schönbrunn, E.; Eschenburg, S.; Shuttleworth, W.A.; Scloss, J.V.; Amrhein, N.; Evans, J.N.S.; Kabsch, W. Interaction of the herbicide glyphosate with its target enzyme 5-enolpyruvylshikimate 3-phosphate synthase in atomic detail. Proc. Nat. Acad. Sci. USA 2001, 98, 1376–1380. [Google Scholar] [CrossRef] [Green Version]
- Gill, S.S.; Tuteja, N. Reactive oxygen species and antioxidant machinery in abiotic stress tolerance in crop plants. Plant Physiol. Biochem. 2010, 48, 909–930. [Google Scholar] [CrossRef]
- Foyer, C.H. Redox homeostasis and antioxidant signaling: A metabolic interface between stress perception and physiological responses. Plant Cell 2005, 17, 1866–1875. [Google Scholar] [CrossRef]
- Garg, N.; Manchanda, G. ROS generation in plants: Boon or bane? Plant Biosyst. 2009, 143, 81–96. [Google Scholar] [CrossRef]
- Harre, N.T.; Nie, H.; Jiang, Y.; Young, B.G. Differential antioxidant enzyme activity in rapid-response glyphosate-resistant Ambrosia trifida. Pest Manag. Sci. 2018, 74, 2125–2132. [Google Scholar] [CrossRef]
- Kumar, S.; Trivedi, P.K. Glutathione S-transferases: Role in combating abiotic stresses including arsenic detoxification in plants. Front. Plant Sci. 2018, 9, 751. [Google Scholar] [CrossRef]
- Bolger, A.M.; Lohse, M.; Usadel, B. Trimmomatic: A flexible trimmer for Illumina sequence data. Bioinformatics 2014, 30, 2114–2120. [Google Scholar] [CrossRef]
- Grabherr, M.G.; Haas, B.J.; Yassour, M.; Levin, J.Z.; Thompson, D.A.; Amit, I.; Adiconis, X.; Fan, L.; Raychowdhury, R.; Zeng, Q.; et al. Full-length transcriptome assembly from RNA-Seq data without a reference genome. Nat. Biotechnol. 2011, 29, 644–652. [Google Scholar] [CrossRef] [Green Version]
- Conesa, A.; Madrigal, P.; Tarazona, S.; Gomez-Cabrero, D.; Cervera, A.; McPherson, A.; Szcześniak, M.W.; Gaffney, D.J.; Elo, L.L.; Zhang, X.; et al. A survey of best practices for RNA-seq data analysis. Genome Biol. 2016, 17, 13. [Google Scholar] [CrossRef]
- Haas, B.J.; Papanicolaou, A.; Yassour, M.; Grabherr, M.; Blood, P.D.; Bowden, J.; Couger, M.B.; Eccles, D.; Li, B.; Lieber, M.; et al. De novo transcript sequence reconstruction from RNA-seq using the Trinity platform for reference generation and analysis. Nat. Protoc. 2013, 8, 1494–1512. [Google Scholar] [CrossRef]
- Cock, P.J.A.; Antao, T.; Chang, J.T.; Chapman, B.A.; Cox, C.J.; Dalke, A.; Friedberg, I.; Hamelryck, T.; Kauff, F.; Wilczynski, B.; et al. Biopython: Freely available Python tools for computational molecular biology and bioinformatics. Bioinformatics 2009, 25, 1422–1423. [Google Scholar] [CrossRef]
- Apweiler, R.; Bairoch, A.; Wu, C.H.; Barker, W.C.; Boeckmann, B.; Ferro, S.; Gasteiger, E.; Huang, H.; Lopez, R.; Magrane, M.; et al. UniProt: The Universal Protein knowledgebase. Nucleic Acids Res. 2004, 32, D115–D119. [Google Scholar] [CrossRef]
- Buchfink, B.; Xie, C.; Huson, D.H. Fast and sensitive protein alignment using DIAMOND. Nat. Methods 2015, 12, 59–60. [Google Scholar] [CrossRef]
- Petersen, T.N.; Brunak, S.; Von Heijne, G.; Nielsen, H. SignalP 4.0: Discriminating signal peptides from transmembrane regions. Nat. Methods 2011, 8, 785–786. [Google Scholar] [CrossRef]
- Lagesen, K.; Hallin, P.; Rødland, E.A.; Stærfeldt, H.-H.; Rognes, T.; Ussery, D.W. RNAmmer: Consistent and rapid annotation of ribosomal RNA genes. Nucleic Acids Res. 2007, 35, 3100–3108. [Google Scholar] [CrossRef]
- Camacho, C.; Coulouris, G.; Avagyan, V.; Ma, N.; Papadopoulos, J.; Bealer, K.; Madden, T.L. BLAST+: Architecture and applications. BMC Bioinform. 2009, 10, 421. [Google Scholar] [CrossRef]
- Altschul, S.F.; Gish, W.; Miller, W.; Myers, E.W.; Lipman, D.J. Basic Local Alignment Search Tool. J. Mol. Biol. 1990, 215, 403–410. [Google Scholar] [CrossRef]
- Bray, N.L.; Pimentel, H.; Melsted, P.; Pachter, L. Near-optimal probabilistic RNA-seq quantification. Nat. Biotechnol. 2016, 34, 525–527. [Google Scholar] [CrossRef]
- Robinson, M.D.; McCarthy, D.J.; Smyth, G.K. edgeR: A Bioconductor package for differential expression analysis of digital gene expression data. Bioinformatics 2010, 26, 139–140. [Google Scholar] [CrossRef]
- Yuan, J.S.; Wang, D.; Stewart, C.N. Statistical methods for efficiency adjusted real-time PCR quantification. Biotechnol. J. 2008, 3, 112–123. [Google Scholar] [CrossRef]


| No | Contig ID | UniProt ID | Functional Category | Putative Localization | Transcription Fold Change | Ratio GR/GS | |
|---|---|---|---|---|---|---|---|
| GR | GS | ||||||
| ABC_1 | DN38339_c0_g1 | Q9SKX0 | ABC trans. C family 13 | Integral component of membrane | 3.7 | 1.2 | 3.1 |
| ABC_2 | DN41040_c1_g2 | Q8LGU1 | ABC trans. C family 8 | Vacuolar membrane | 17 | 2.4 | 7.1 |
| ABC_3 | DN27993_c1_g1 | Q7DM58 | ABC trans. C family 4 | Plasma membrane/Vacuole | 9.5 | 3.6 | 2.6 |
| ABC_4 | DN37018_c0_g1 | Q9C8H0 | ABC trans. C family 12 | Integral component of membrane | 15.6 | 3.5 | 4.5 |
| ABC_5 | DN25809_c0_g1 | Q8LGU1 | ABC trans. C family 8 | Vacuole | 3.5 | 0.5 | 7 |
| ABC_6 | DN38603_c0_g1 | Q9ZR72 | ABC trans. B family 1 | Plasma membrane | 3.3 | 0.9 | 3.7 |
| ABC_7 | DN41040_c1_g1 | Q8LGU1 | ABC trans. C family 8 | Vacuole | 18 | 3 | 6 |
| ABC_8 | DN42180_c1_g3 | Q7DM58 | ABC trans. C family 4 | Golgi apparatus/Plasma and vacuole membrane | 3.9 | 1.9 | 2 |
| ABC_9 | DN41654_c6_g1 | Q9ZU35 | ABC trans. G family 7 | Chloroplast | 4 | 1.3 | 3.1 |
| ABC_10 | DN23566_c0_g1 | Q8LGU1 | ABC trans. C family 8 | Vacuole | 4.2 | 0.6 | 7 |
| ABC_11 | DN42180_c1_g1 | Q7DM58 | ABC trans. C family 4 | Golgi apparatus/Plasma and vacuole membrane | 8 | 1 | 8 |
| ABC_12 | DN32993_c0_g1 | Q7DM58 | ABC trans. C family 14** | Golgi apparatus/Plasma and vacuole membrane | 19 | 2.8 | 6.8 |
| ABC_13 | DN41851_c0_g1 | Q9ZR72 | ABC trans. B family 1 | Plasma membrane | 3.5 | 1.4 | 2.5 |
| ABC_14 | DN37243_c0_g1 | Q9C9W0 | ABC trans. I family 17 | Plasma membrane and Vacuole | 4.1 | 1.6 | 2.6 |
| ABC_15 | DN37746_c1_g1 | Q9FNU2 | ABC trans. B family 27 | Vacuole | 14.6 | 5.9 | 2.5 |
| ABC_16 | DN41980_c0_g1 | Q9M1C7 | ABC trans. C family 9** | Vacuole | 23.3 | 7.6 | 3.1 |
| ABC_17 | DN29514_c0_g1 | Q9FNU2 | ABC trans. B family 25 | Vacuole | 6.9 | 1.5 | 4.6 |
| ABC_18 | DN41405_c0_g1 | Q9LYS2 | ABC trans. C family 10 | Vacuole | 17.9 | 7.8 | 2.3 |
| ABC_19 | DN42119_c0_g1 | Q42093 | ABC trans. C family 2 | Vacuole | 3.8 | 1 | 3.8 |
| No | Contig ID | UniProt ID | Functional Annotation | Putative Localization | Transcription Fold Change | Ratio GR/GS | |
|---|---|---|---|---|---|---|---|
| GR | GS | ||||||
| CYP450_1 | DN41388_c1_g1 | O49858 | CYP450 82A3 | Membrane | 4.5 | 0.4 | 11.5 |
| CYP450_2 | DN27559_c0_g1 | Q9STK7 | CYP450 71A26 | Integral component of membrane | 3.3 | 1.0 | 3.3 |
| CYP450_3 | DN22805_c0_g1 | A0A103YCT3 | CYP450 | Uncharacterized | 4.2 | 0.7 | 6.0 |
| CYP450_4 | DN35527_c1_g1 | A0A103XYM0 | CYP450 78A5 | Integral component of membrane | 10.8 | 0.4 | 27 |
| CYP450_5 | DN15853_c0_g1 | A0A251TZE7 | CYP450 71B7 | Endoplasmic reticulum | 5.6 | 1.0 | 5.6 |
| CYP450_6 | DN34846_c0_g1 | Q9LMX7 | CYP450 78A5 | Endoplasmic reticulum | 3.5 | 0.8 | 4.5 |
| CYP450_7 | DN35866_c0_g1 | A0A251SVC5 | CYP450 76C2 | Uncharacterized | 4.0 | 0.8 | 5.0 |
| CYP450_8 | DN25141_c0_g1 | O81973 | CYP450 93A3 | Integral component of membrane | 7.3 | 3.0 | 2.4 |
| CYP450_9 | DN31873_c0_g1 | A0A103YMI2 | CYP450 94A1 | Integral component of membrane | 5.5 | 1.9 | 2.9 |
| CYP450_10 | DN73328_c0_g1 | A0A251RP29 | CYP450 82A4 | Integral component of membrane | 3.8 | 1.4 | 2.7 |
| No | Contig ID | UniProt ID | Functional Annotation | Putative Localization | Transcription Fold Change | Ratio GR/GS | |
|---|---|---|---|---|---|---|---|
| GR | GS | ||||||
| GST_1 | DN34237_c0_g1 | Q9M0G0 | Glutathione hydrolase 3 | Vacuole | 4.6 | 1 | 4.6 |
| GT_1 | DN32482_c0_g1 | Q6VAA9 | Glycosyltransferase 73E1 UDP | Uncharacterized | 7 | 3.1 | 2.2 |
| GT_2 | DN30716_c0_g1 | Q9C768 | Glycosyltransferase 76B1 UDP | Intracellular membrane-bounded organelle | 4.9 | 2.1 | 2.3 |
| GT_3 | DN44583_c0_g1 | Q6VAB0 | Glycosyltransferase 85C2 UDP | Uncharacterized | 5.1 | 2.5 | 2 |
| GT_4 | DN30626_c0_g1 | Q9LZD8 | Glycosyltransferase 89A UDP | Intracellular membrane-bounded organelle | 8.7 | 1.8 | 4.8 |
| GT_5 | DN23238_c0_g1 | Q6VAA4 | Glycosyltransferase 85C1 UDP** | Uncharacterized | 13.4 | 6.8 | 2 |
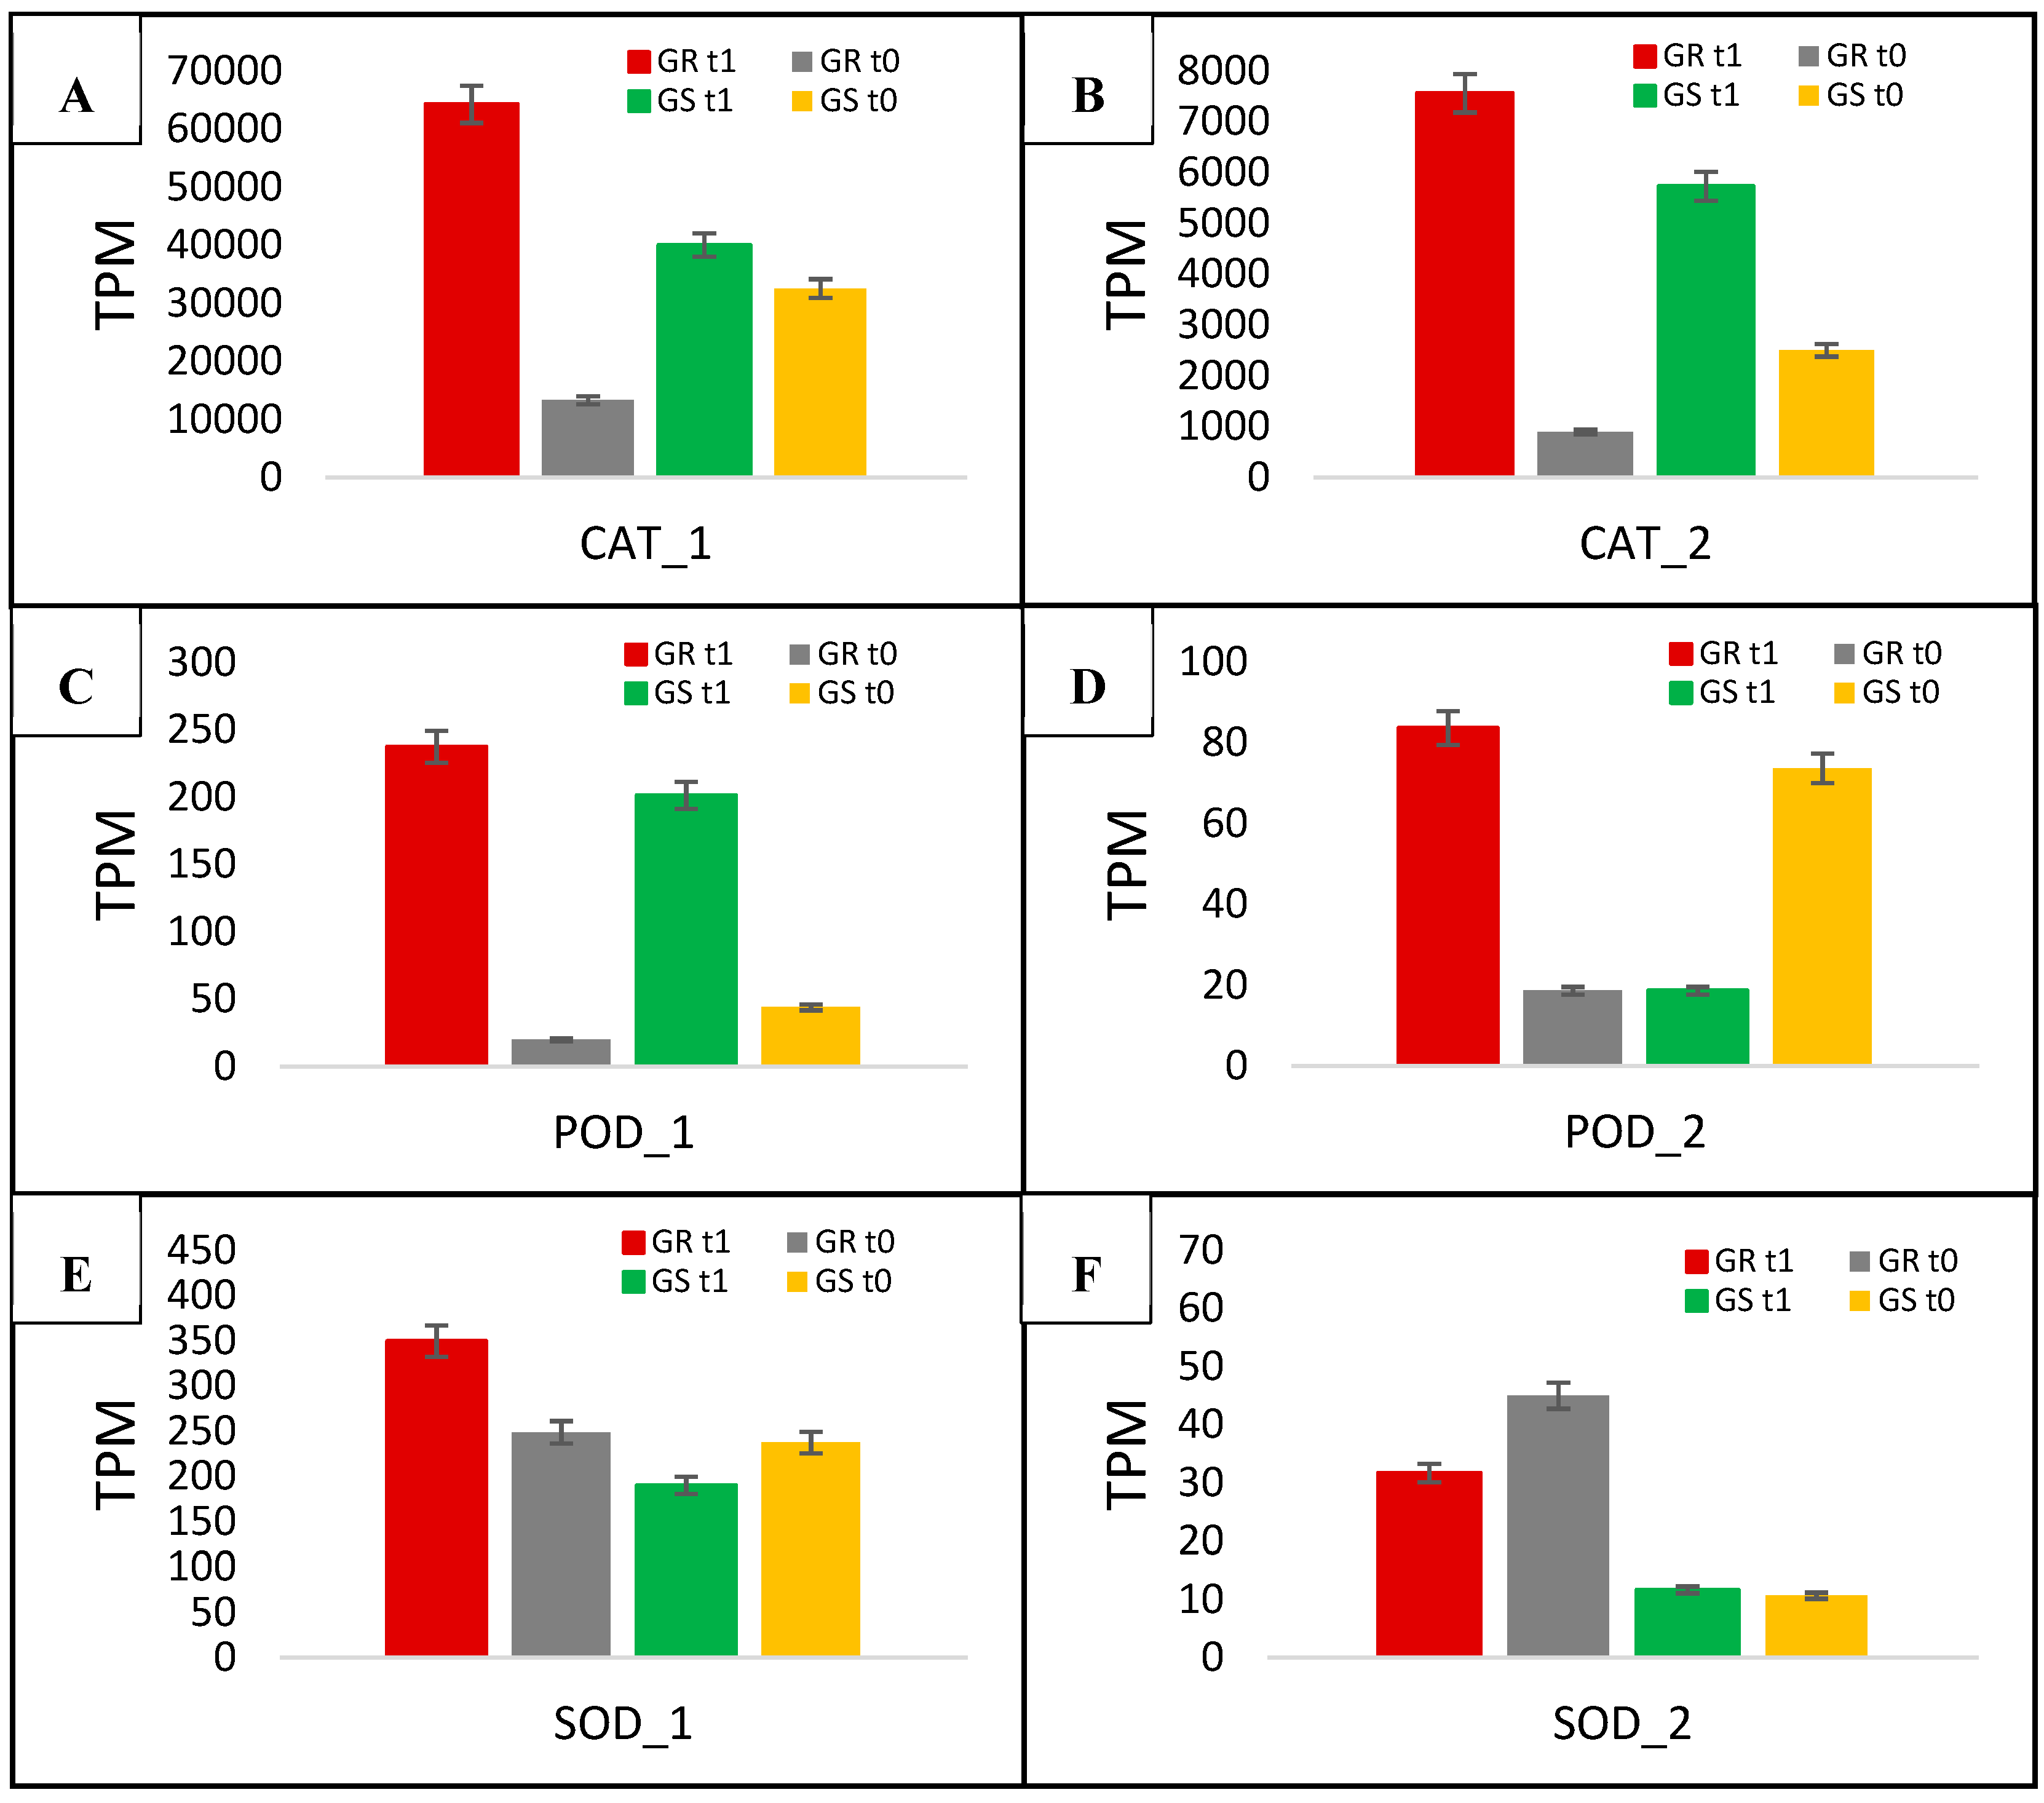
| No | Contig ID | UniProt ID | Functional Annotation | Putative Localization | Transcription Fold Change | Ratio GR/GS | |
|---|---|---|---|---|---|---|---|
| GR | GS | ||||||
| CAT_1 | DN41650_c0_g1 | P45739 | Catalase | Peroxisome | 4.8 | 1.2 | 4 |
| CAT_2 | DN32938_c3_g1 | P29756 | Catalase-1/2 | Peroxisome | 8.5 | 2.3 | 3.7 |
| POD_1 | DN35984_c0_g1 | Q9SZB9 | Peroxidase 47 | Extracellular region or secreted | 11.9 | 4.6 | 2.6 |
| POD_2 | DN34083_c0_g1 | Q9SJZ2 | Peroxidase 17 | Extracellular region or secreted | 4.5 | 0.2 | 22.5 |
| SOD_1 | DN36049_c1_g1 | Q9FMX0 | Superoxide dismutase 3 | Chloroplast | 1.4 | 0.8 | 1.7 |
| SOD_2 | DN32389_c0_g1 | O04996 | Superoxide dismutase | Cytoplasm | 0.7 | 1.1 | 0.6 |
© 2019 by the authors. Licensee MDPI, Basel, Switzerland. This article is an open access article distributed under the terms and conditions of the Creative Commons Attribution (CC BY) license (http://creativecommons.org/licenses/by/4.0/).
Share and Cite
Piasecki, C.; Yang, Y.; Benemann, D.P.; Kremer, F.S.; Galli, V.; Millwood, R.J.; Cechin, J.; Agostinetto, D.; Maia, L.C.; Vargas, L.; et al. Transcriptomic Analysis Identifies New Non-Target Site Glyphosate-Resistance Genes in Conyza bonariensis. Plants 2019, 8, 157. https://doi.org/10.3390/plants8060157
Piasecki C, Yang Y, Benemann DP, Kremer FS, Galli V, Millwood RJ, Cechin J, Agostinetto D, Maia LC, Vargas L, et al. Transcriptomic Analysis Identifies New Non-Target Site Glyphosate-Resistance Genes in Conyza bonariensis. Plants. 2019; 8(6):157. https://doi.org/10.3390/plants8060157
Chicago/Turabian StylePiasecki, Cristiano, Yongil Yang, Daiane P. Benemann, Frederico S. Kremer, Vanessa Galli, Reginald J. Millwood, Joanei Cechin, Dirceu Agostinetto, Luciano C. Maia, Leandro Vargas, and et al. 2019. "Transcriptomic Analysis Identifies New Non-Target Site Glyphosate-Resistance Genes in Conyza bonariensis" Plants 8, no. 6: 157. https://doi.org/10.3390/plants8060157