Article

Elevated Ozone Concentration Reduces Photosynthetic Carbon Gain but Does Not Alter Leaf Structural Traits, Nutrient Composition or Biomass in Switchgrass

1
DOE Center for Advanced Bioenergy and Bioproducts Innovation and Carl R. Woese Institute for Genomic Biology, University of Illinois at Urbana-Champaign, Urbana, IL 61801, USA
2
Institute for Sustainability, Energy, and Environment, University of Illinois at Urbana-Champaign, Urbana, IL 61801, USA
3
Normandie Université, UNICAEN, INRA, UMR 950 Ecophysiologie Végétale, Agronomie et nutritions N, C, S, Esplanade de la Paix, Université Caen Normandie, 14032 Caen Cedex 5, France
4
Global Change and Photosynthesis Research Unit, USDA ARS, Urbana, IL 61801, USA
*
Author to whom correspondence should be addressed.
Plants 2019, 8(4), 85; https://doi.org/10.3390/plants8040085
Submission received: 27 February 2019 / Revised: 27 March 2019 / Accepted: 29 March 2019 / Published: 2 April 2019
(This article belongs to the Special Issue Ozone Tolerance Mechanisms)

Abstract

:
Elevated tropospheric ozone concentration (O3) increases oxidative stress in vegetation and threatens the stability of crop production. Current O3 pollution in the United States is estimated to decrease the yields of maize (Zea mays) up to 10%, however, many bioenergy feedstocks including switchgrass (Panicum virgatum) have not been studied for response to O3 stress. Using Free Air Concentration Enrichment (FACE) technology, we investigated the impacts of elevated O3 (~100 nmol mol−1) on leaf photosynthetic traits and capacity, chlorophyll fluorescence, the Ball–Woodrow–Berry (BWB) relationship, respiration, leaf structure, biomass and nutrient composition of switchgrass. Elevated O3 concentration reduced net CO2 assimilation rate (A), stomatal conductance (gs), and maximum CO2 saturated photosynthetic capacity (Vmax), but did not affect other functional and structural traits in switchgrass or the macro- (except potassium) and micronutrient content of leaves. These results suggest that switchgrass exhibits a greater O3 tolerance than maize, and provide important fundamental data for evaluating the yield stability of a bioenergy feedstock crop and for exploring O3 sensitivity among bioenergy feedstocks.

1. Introduction

Obtaining renewable energy from biomass feedstocks is projected to reduce reliance on traditional fossil fuels and emissions of greenhouse gases while benefitting economic growth and energy security [1,2,3]. Currently, the production of corn-based ethanol is the most common biofuel feedstock in the USA, but ethanol can also be derived from woody feedstocks or other dedicated bioenergy crops [1,3,4,5]. Switchgrass, a native perennial warm-season C4 grass of North America [6], has been recognized as an emerging and promising bioenergy feedstock [4,7,8]. With broad adaptability, switchgrass can produce high biomass yields under limited water and nutrient supply on marginal croplands [9,10,11]. Switchgrass also has the potential to produce greater biomass yields (13 Mg ha−1) than maize grain (11 Mg ha−1) given similar inputs [4]. Several studies have examined the impact of environmental variables on switchgrass [10,12,13,14,15], the majority of those focusing on switchgrass breeding and management, biomass improvement and enhancement and conversion efficiency of biomass to biofuels [1,3,7,8,9,10,11,16]. Another important consideration is the yield stability of bioenergy feedstocks, which can be altered by atmospheric pollutants.
Tropospheric ozone (O3) is a well-known airborne pollutant that forms from reactions of NOx with volatile organic compounds in the presence of sunlight [17,18]. The average current ambient O3 concentration in the northern hemisphere is 20–50 nmol mol−1, but, as a result of time-varying and non-uniform distribution of pollutant precursors, higher concentrations of 120 nmol mol−1 or more can be observed in industrial cities [19,20,21,22,23]. Long-range transport events may carry precursor pollutants over long distances outside of industrial areas, and even over distances of intercontinental and hemispheric scales [24,25,26]. Current concentration of tropospheric O3 significantly reduce photosynthesis and productivity on scales from individual plants to ecosystems, and lead to global crop yield losses and reduced terrestrial net primary productivity [23,27,28,29,30,31,32,33,34].
As a strong oxidant, O3 enters plants through the stomata and reacts with the plasmalemma to form reactive oxygen species (ROS) including hydrogen peroxide and superoxide, which can subsequently alter cellular components, trigger signaling cascades, and eventually cause cellular damage or even programmed cell death [23,35,36,37,38,39]. In addition, the photosynthetic apparatus can be damaged by O3 leading to reduced ribulose-1,5-bisphosphate carboxylase/oxygenase (Rubisco) activity in the chloroplast, lower rates of carbon fixation and reduced quantum yield of primary photochemistry [33,38,39,40,41,42]. O3 has also been shown to alter the relationship between photosynthesis and stomatal conductance and reduce water use efficiency [43]. However, O3 effects on stomatal conductance vary greatly across plant species and depend on levels of O3 exposure [44]. Previous studies have found that exposure to very high O3 can induce rapid stomata closure, subsequently limiting CO2 uptake and reducing net assimilation [39,45]. Additionally, previous studies have shown that exposure to chronic O3 pollution can induce stomatal sluggishness resulting in incomplete stomatal closure and reduced water use efficiency [46,47]. Changes in stomatal conductance at elevated O3 can result from damage to guard cells and/or from altered stomatal density on the leaf surface, but few studies have investigated such changes in C4 plants. The Ball–Woodrow–Berry (BWB) model [48] describes stomatal conductance as a linear function of the relationship between photosynthesis, atmospheric humidity and the concentration of CO2 at the leaf surface, and is fundamental to scaling from the leaf to the canopy or to model carbon and water flux [49]. Whether O3 pollution alters this relationship in switchgrass has not been investigated and is important for accurately modeling carbon and water fluxes in an elevated O3 environment.
It is well established that elevated O3 negatively impacts plant growth, development and production in C3 species, but fewer studies have been conducted to understand the overall effects of elevated O3 on C4 species. Previous studies have shown that elevated O3 significantly reduce photosynthesis and biomass in maize (Zea mays L.) [50,51,52,53,54] and sugarcane [55,56,57]. In particular, O3 caused yield loss are greater in dry and hot conditions than that in wet and optimal temperature conditions, implying that the yield response of O3 can be modulated by precipitation in future climate [31,53]. Due to possessing Kranz anatomy and phosphoenolpyruvate carboxylase (PEPC) but very low photorespiration, C4 plants generally exhibit high photosynthetic capacity under some environmental conditions, and thus O3 response of C3 and C4 species might be very different. Additionally, greater sensitivity to O3 has been associated with lower leaf mass per unit area in C3 species [58], but the effects of O3 on C4 species have been less well studied. Therefore, examining leaf photosynthetic and anatomical responses to O3 in C4 species can provide important insight into understanding the mechanisms of O3 response as well as exploring O3 sensitivity of potential bioenergy species.
In the present study, we used switchgrass, a promising bioenergy feedstock crop, to investigate the effects of season-long elevated O3 on leaf photosynthetic gas exchange, respiration, chlorophyll fluorescence, leaf structure, biomass and nutrient composition. Considering switchgrass has a close phyologenetic relationship with maize [59], we hypothesized that elevated O3 would lead to: (a) reductions in photosynthetic traits and capacity; (b) alterations in leaf structure; and (c) changes in biomass and nutrient composition.

2. Results

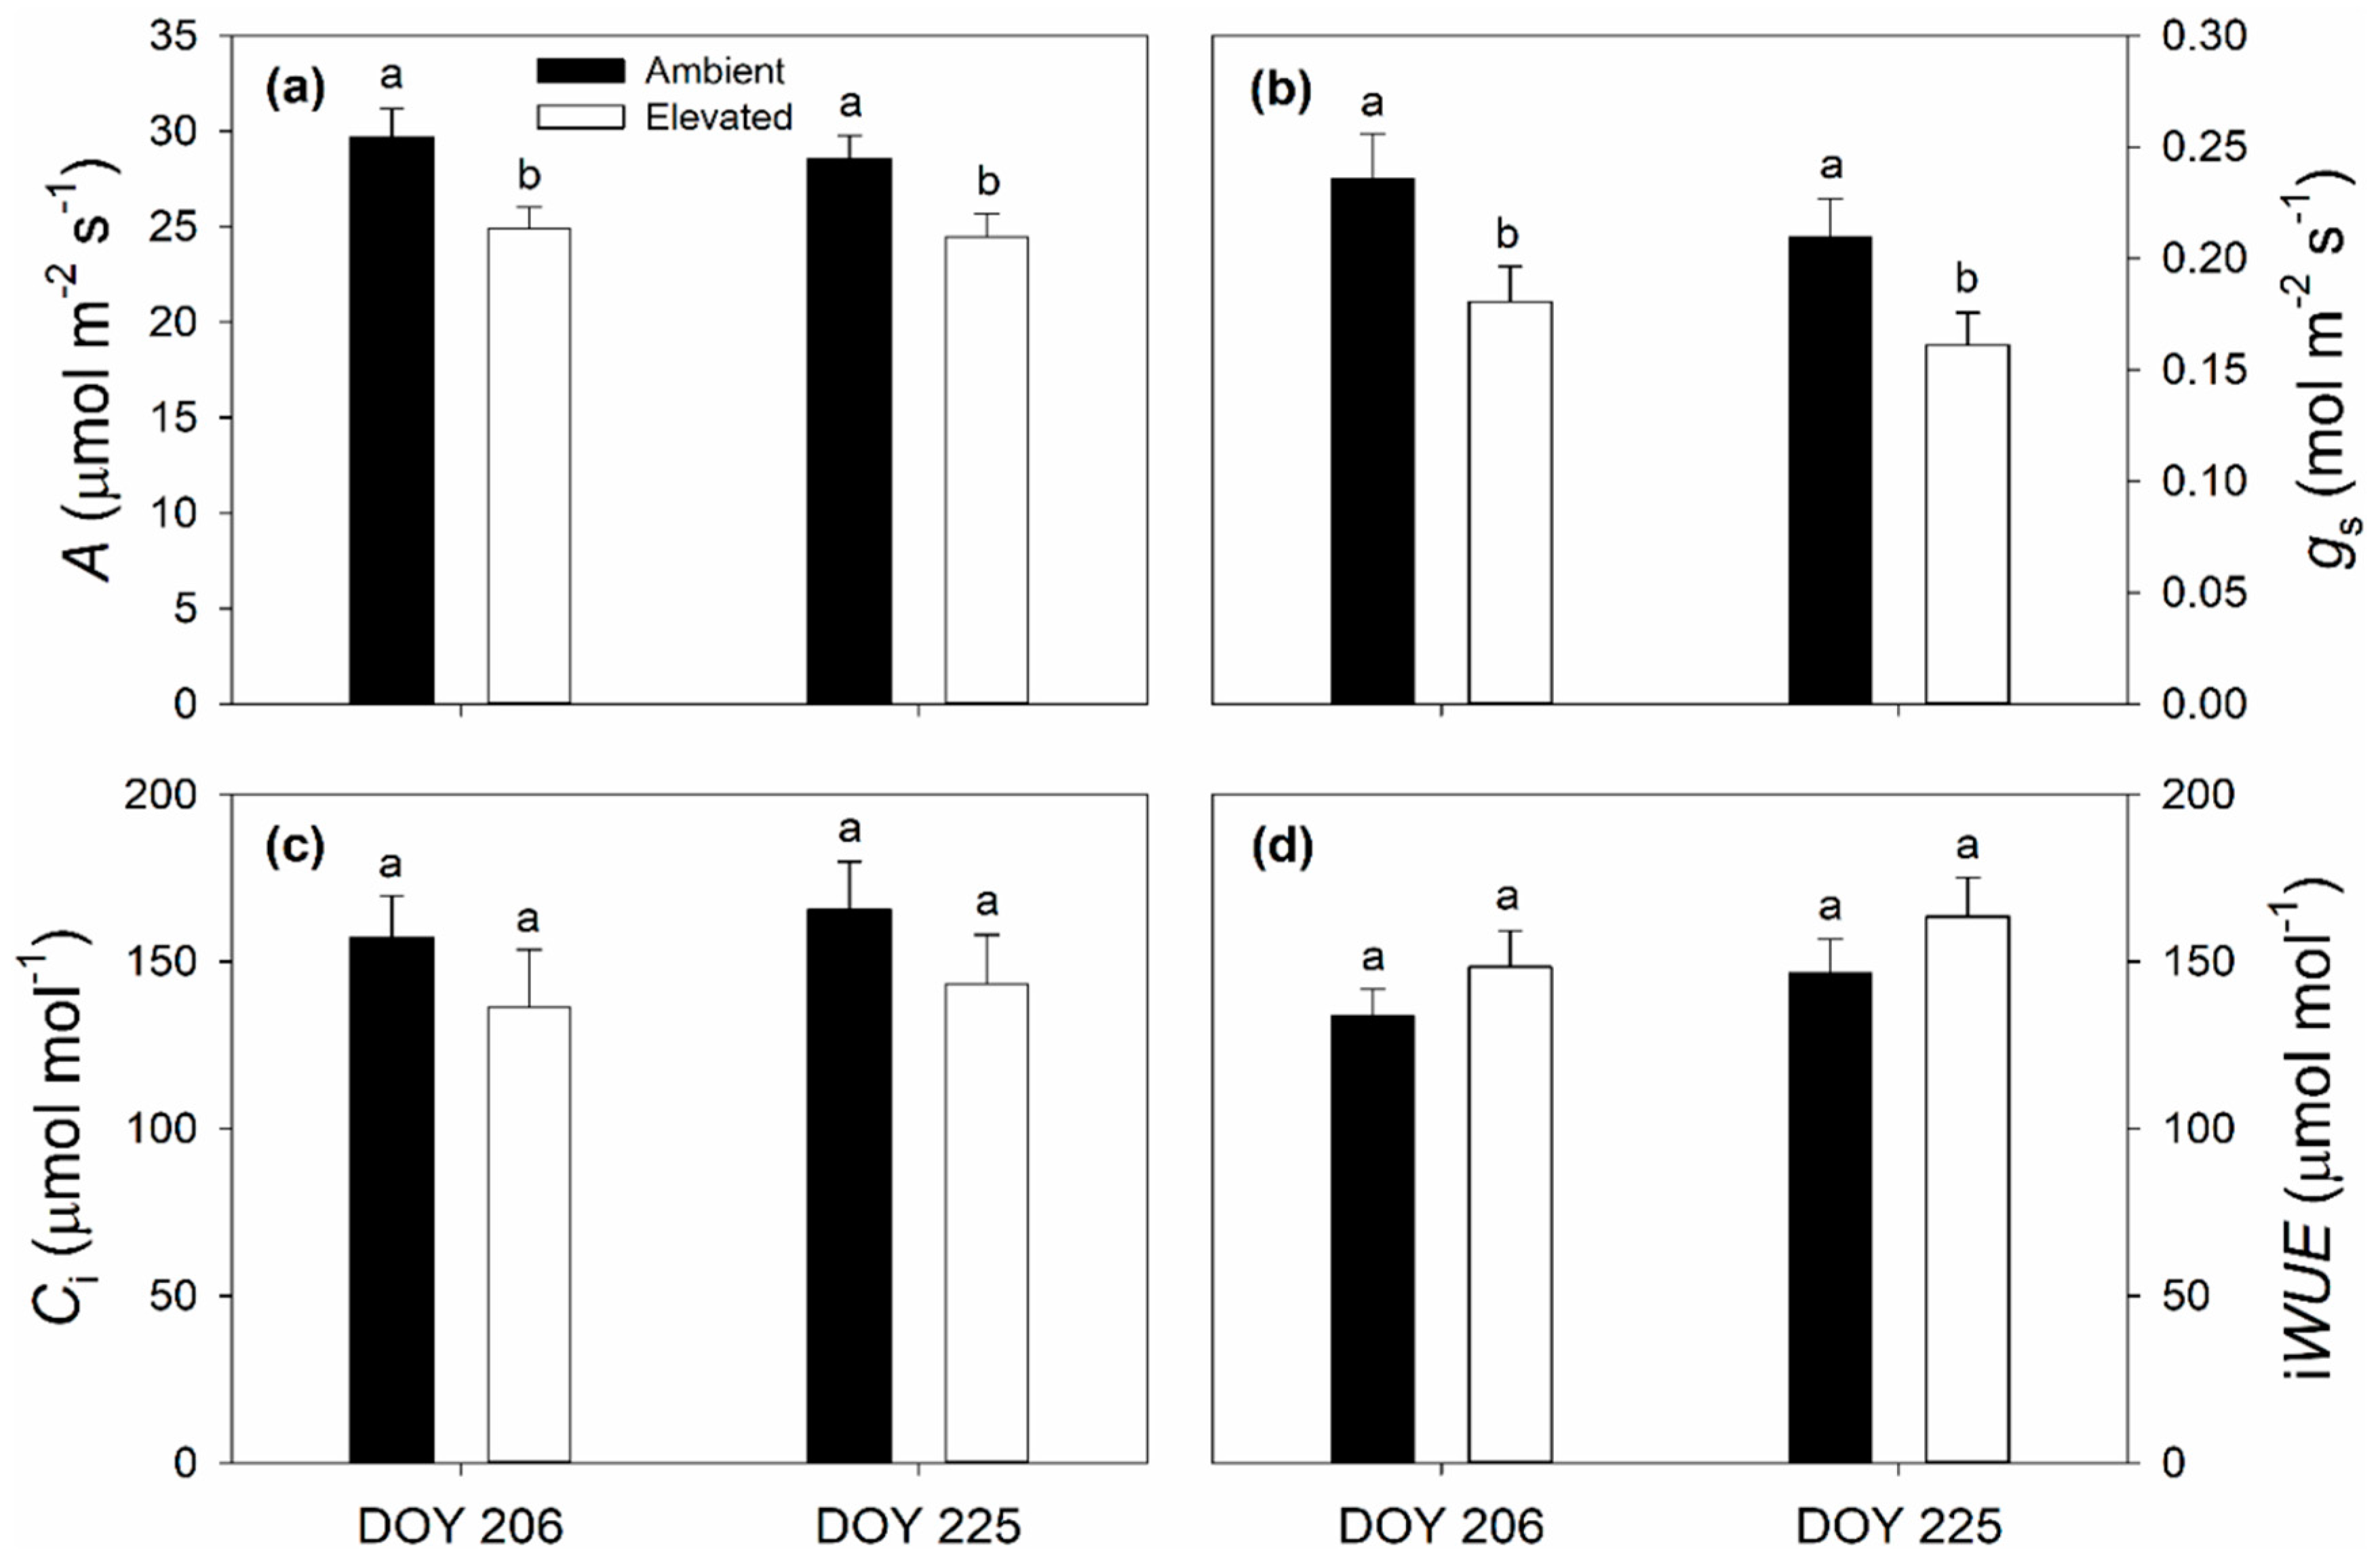
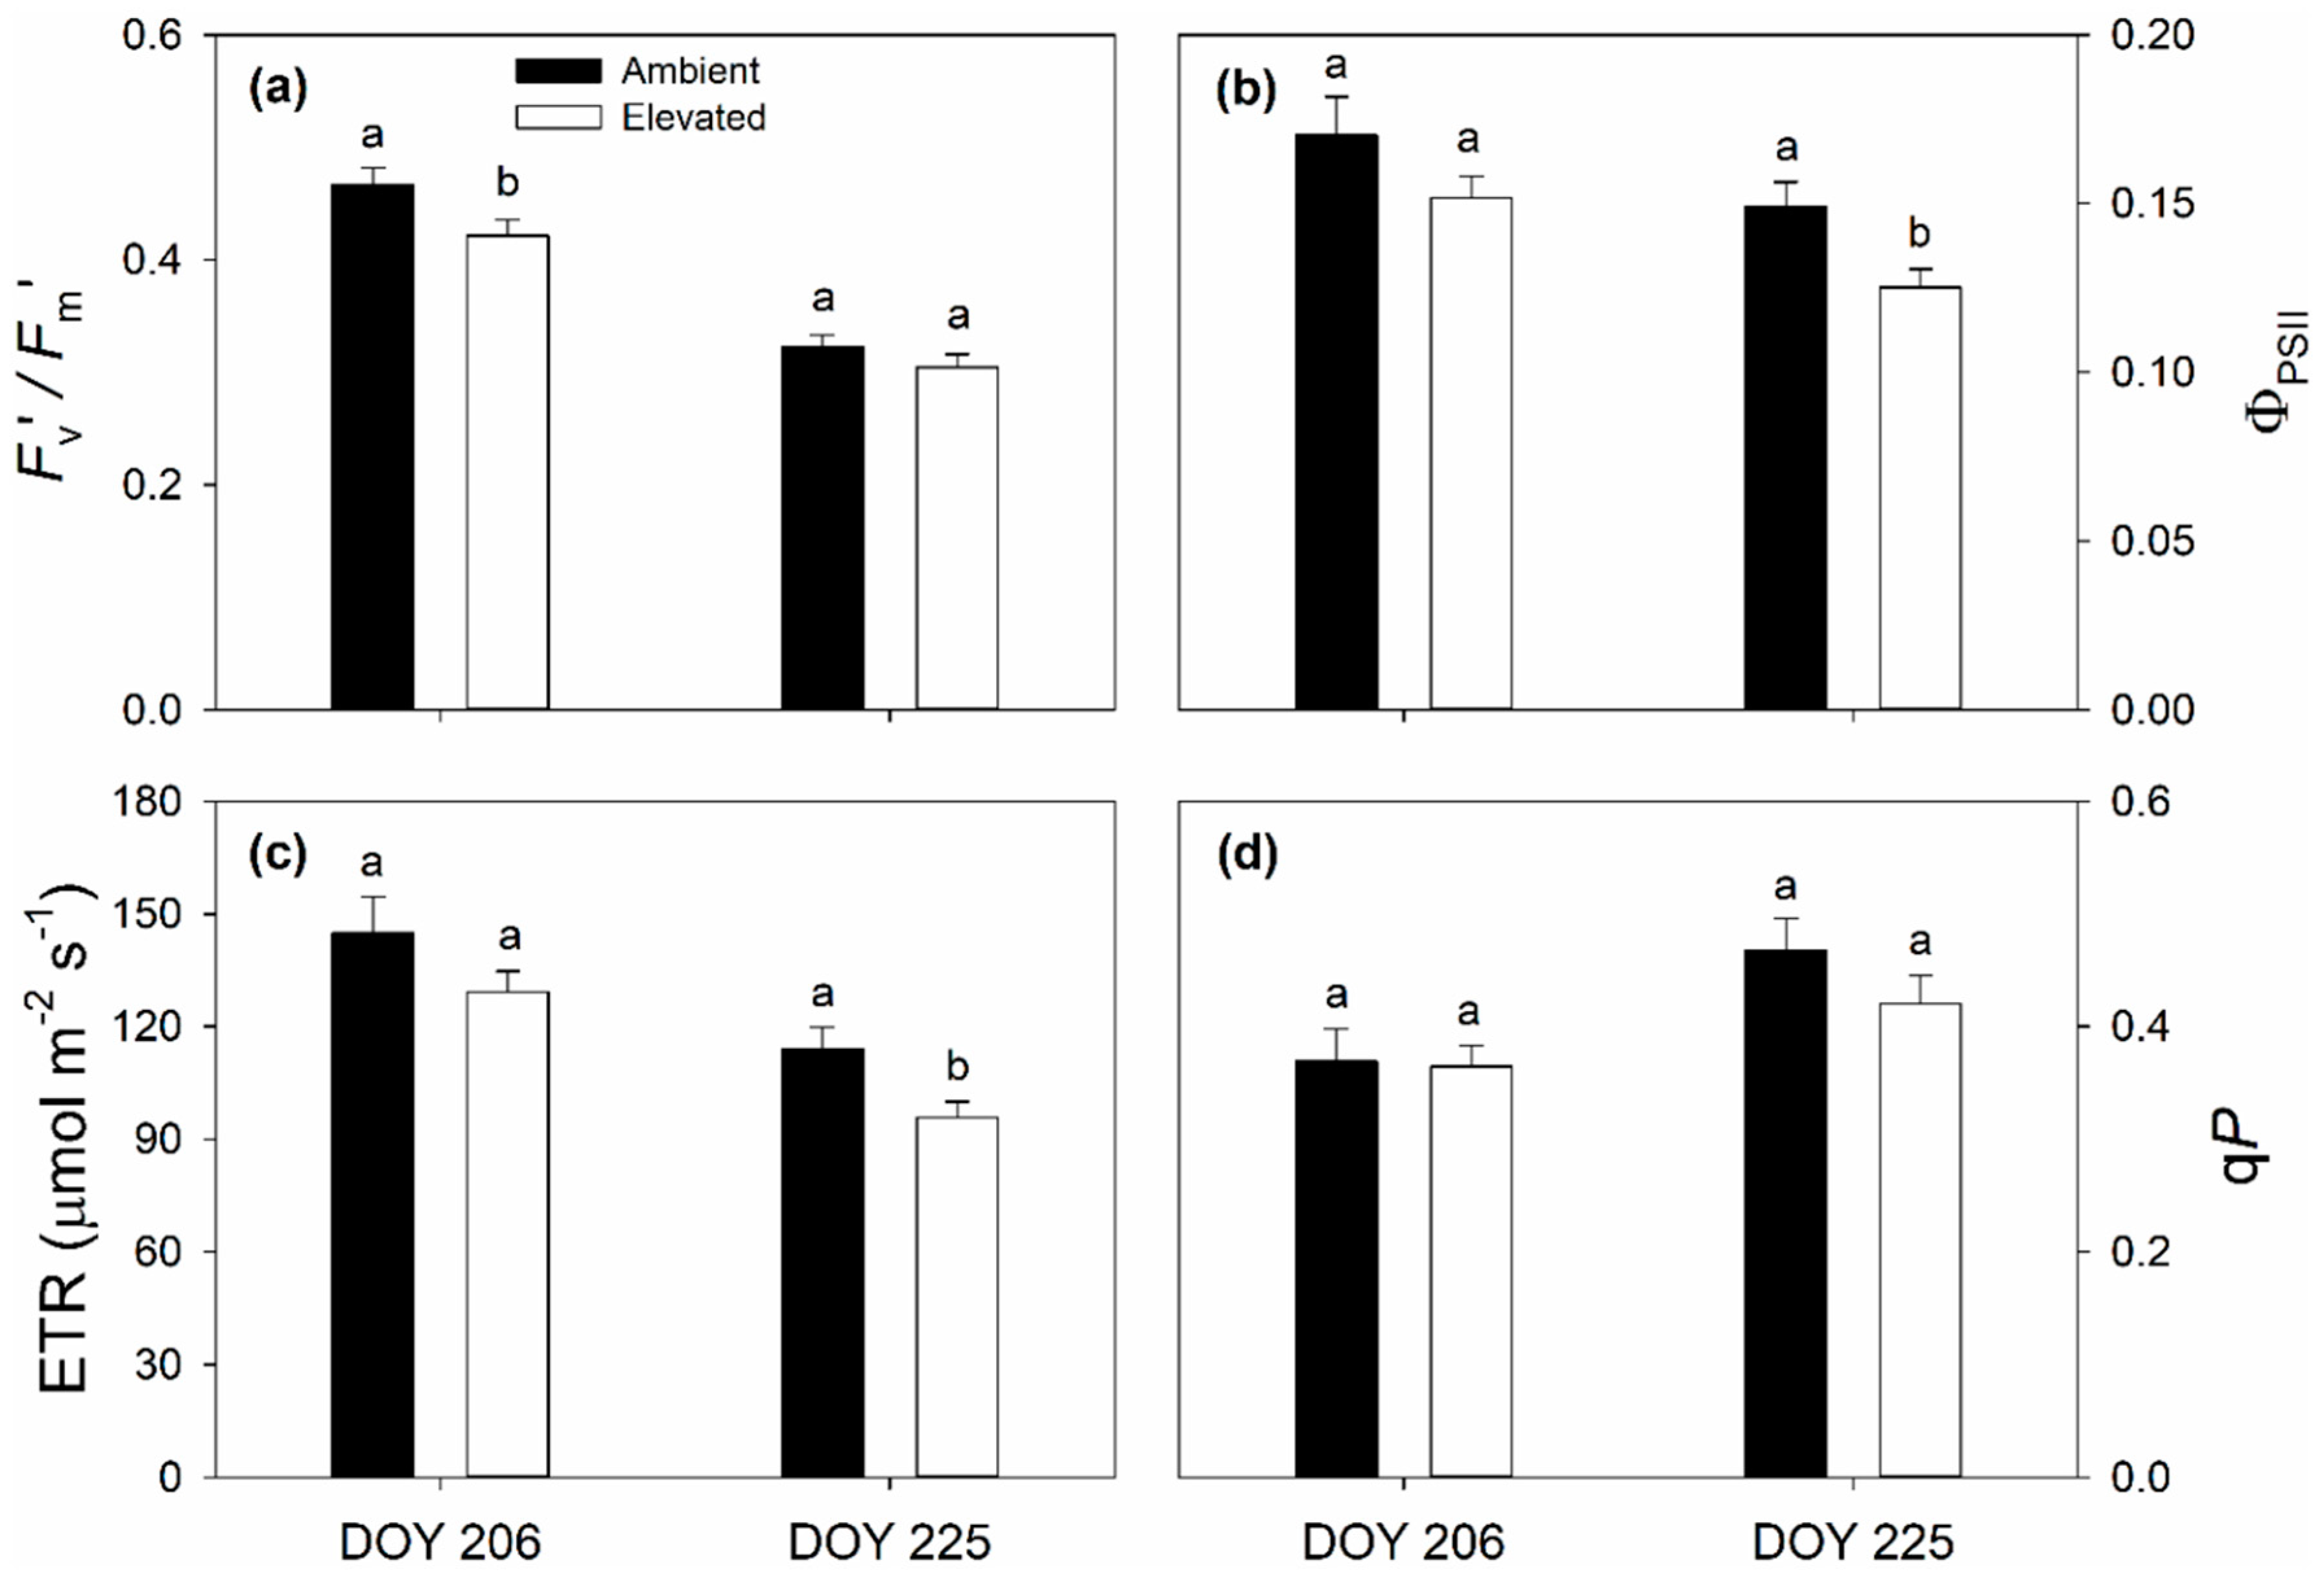
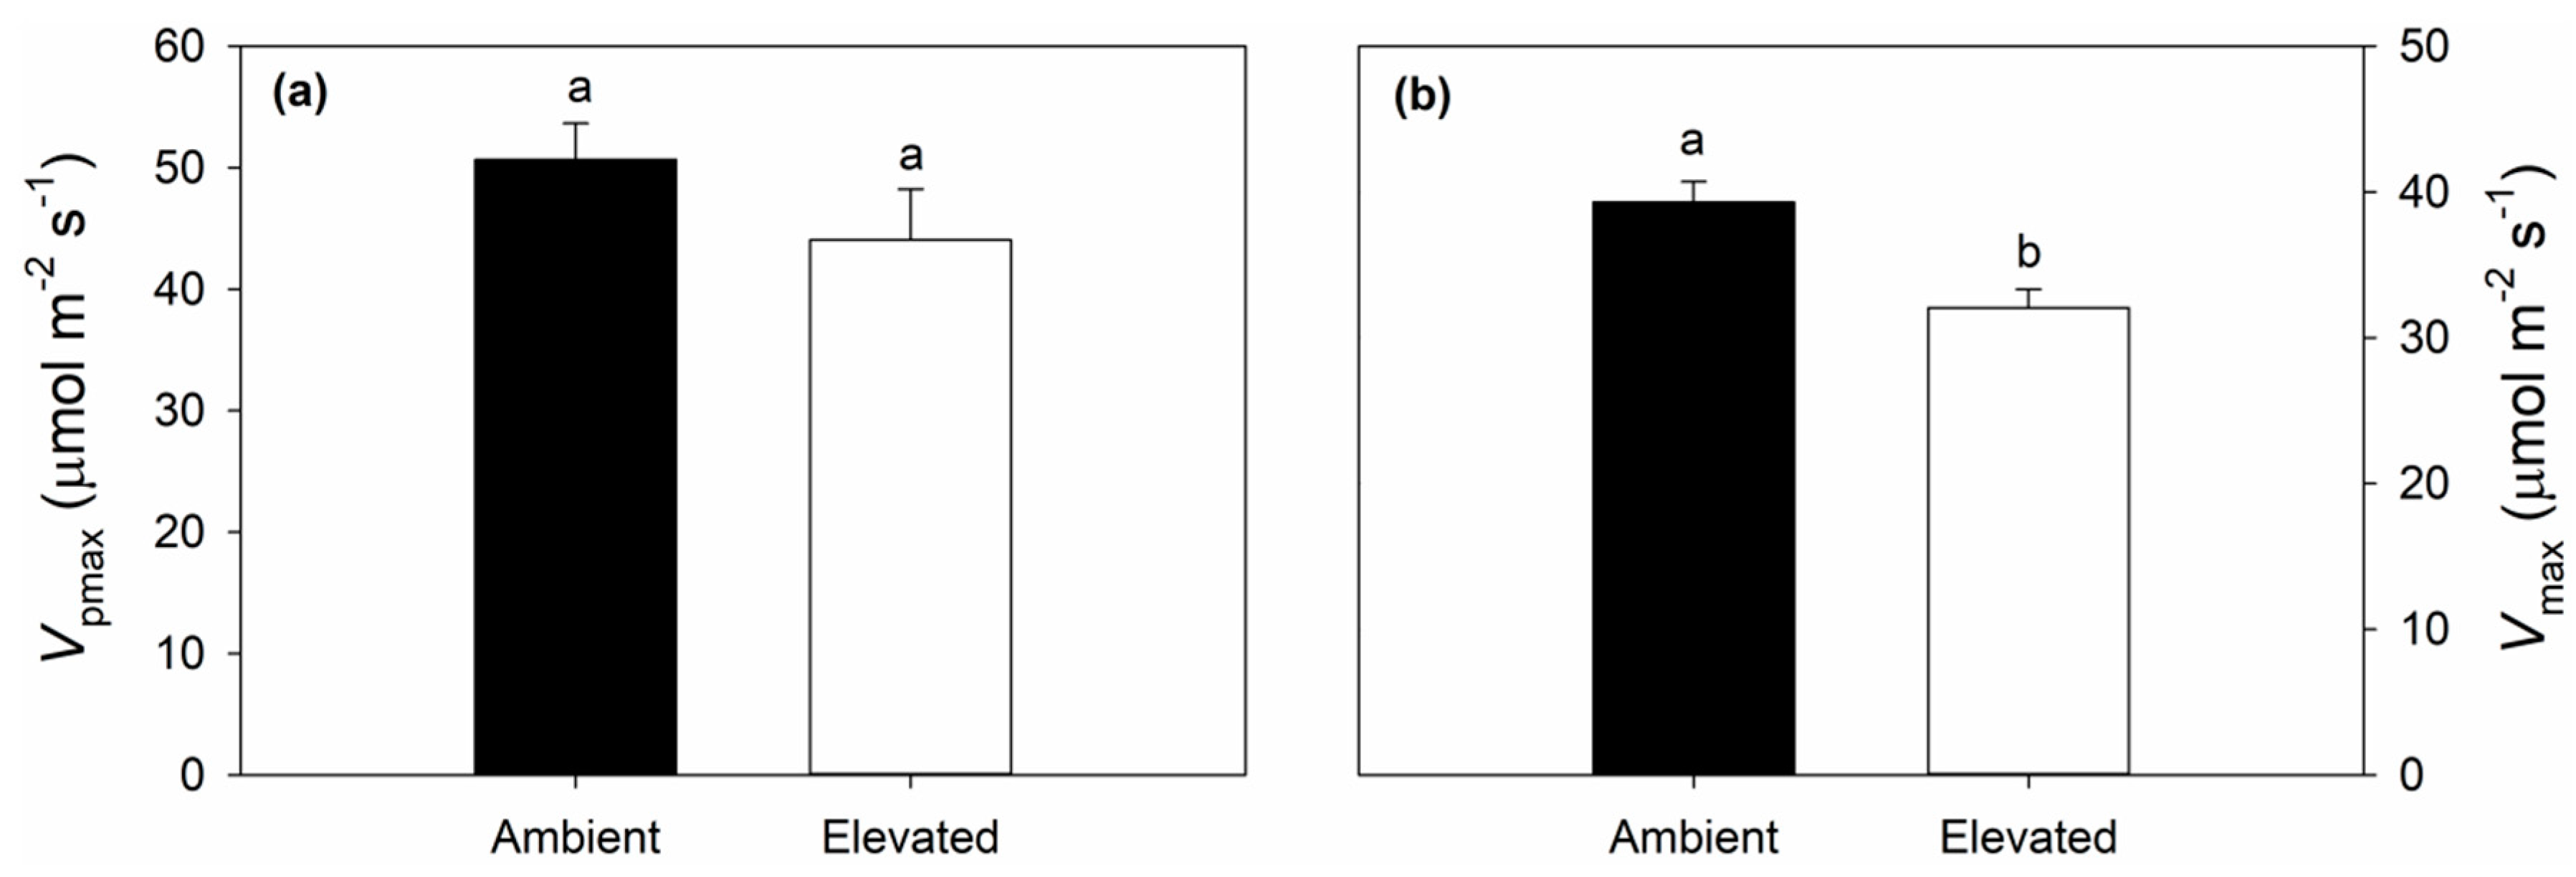
2.1. Leaf Photosynthetic and Chlorophyll Fluorescence Responses to Elevated O3

On 25 July (DOY 206) and 13 August (DOY 225), 2018, elevated O3 concentration significantly reduced in situ net CO2 assimilation rates (A) and stomatal conductance to water vapor (gs), but there was no significant effect of elevated O3 on intercellular CO2 concentration (Ci) or instantaneous water use efficiency (iWUE) (Figure 1). Chlorophyll fluorescence parameters were not as consistently altered by elevated O3. A significant reduction in PSII maximum efficiency (Fv’/Fm’) was observed on DOY 206, but not DOY 225 (Figure 2a), while significant reductions in quantum yield of PSII (ΦPSII) and electron transport rate (ETR) were only observed on DOY 225 (Figure 2b,c). The coefficient of photochemical quenching (qP) was not affected by elevated O3 on either DOY 206 or DOY 225 in 2018 (Figure 2d). A slight decrease in gs in aging leaves (DOY 206 vs. DOY 225) was observed in both ambient (0.24 ± 0.020 vs. 0.21 ± 0.017) and elevated (0.18 ± 0.016 vs. 0.16 ± 0.015) O3 (Figure 1b). Decreased Fv’/Fm’, ΦPSII and ETR and increased qP in aging leaves were also observed in ambient and elevated O3 (Figure 2). Elevated O3 concentration did not affect the maximum carboxylation capacity of phosphoenolpyruvate (Vpmax) (Figure 3a), but reduced the maximum CO2 saturated photosynthetic capacity (Vmax) (Figure 3b) in switchgrass.

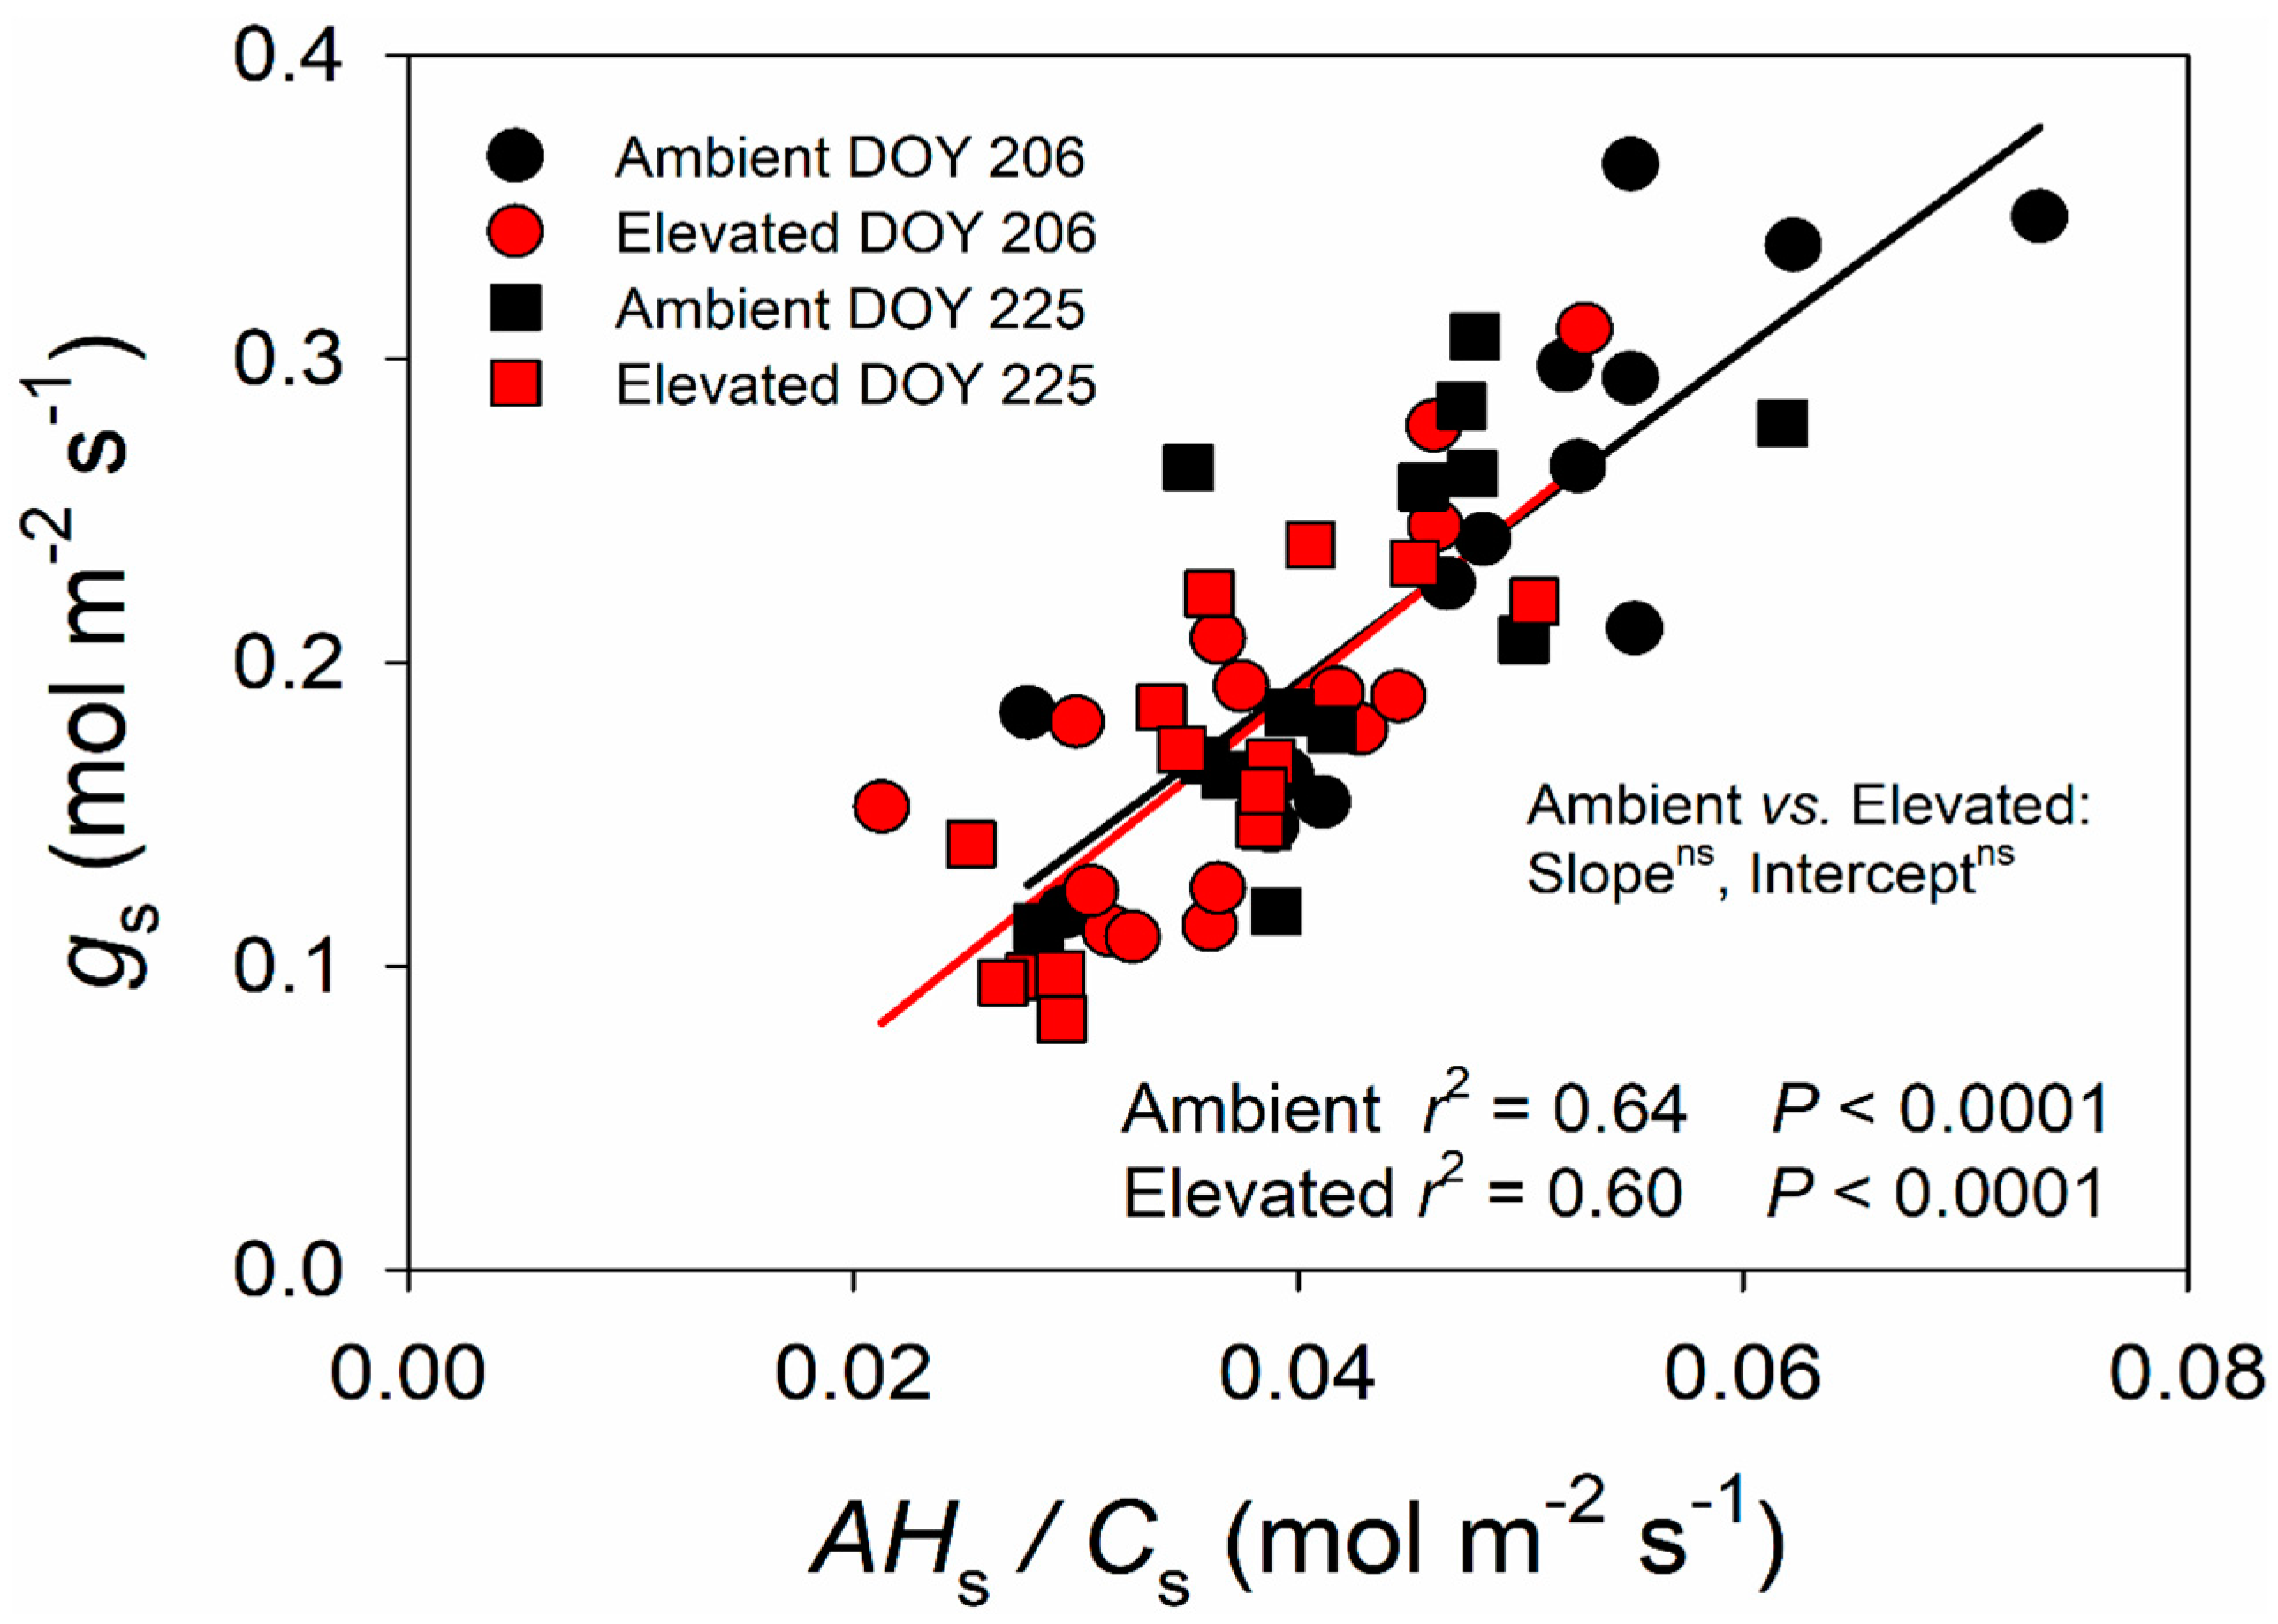
2.2. Changes in the BWB Relationship due to Elevated O3

To further estimate the effect of elevated O3 on switchgrass carbon and water fluxes, the Ball–Woodrow–Berry (BWB) model was applied to gas exchange data collected in the field. As predicted, A H s C s was strongly correlated with gs in both ambient (p < 0.0001) and elevated (p < 0.0001) O3 (Figure 4). However, there was no significant difference in the slope or intercept of the relationship between gs and A H s C s in ambient and elevated O3 (Figure 4).

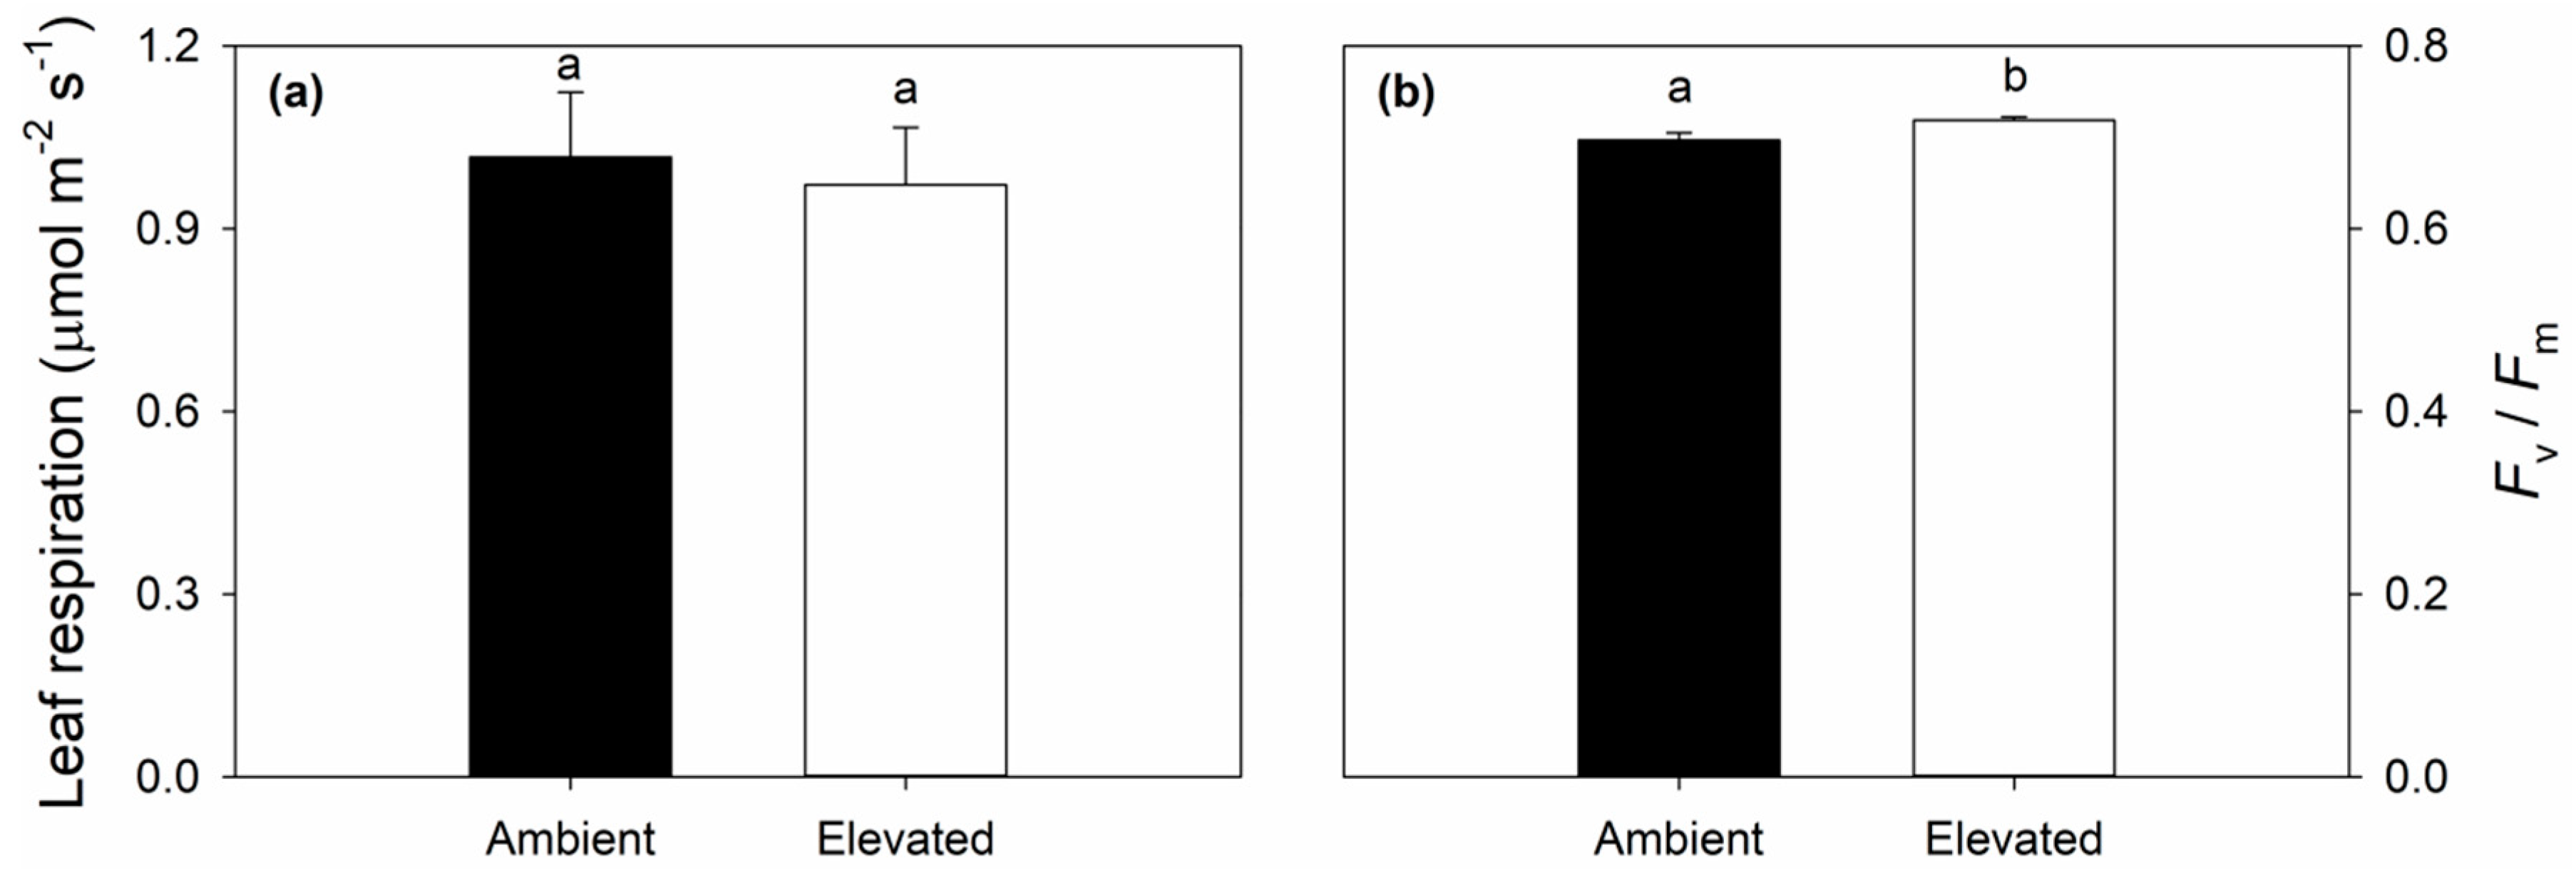
2.3. Leaf Respiration and Dark Adapted Chlorophyll Fluorescence Responses to Elevated O3

Leaf dark respiration did not differ significantly between ambient and elevated O3 (Figure 5a). Although elevated O3 treated leaves had significantly greater dark adapted chlorophyll fluorescence (Fv/Fm) than ambient leaves (Figure 5b), the Fv/Fm values were very similar and both were higher than 0.7 (0.70 ± 0.0084 vs. 0.72 ± 0.0039) at ambient and elevated O3, indicating that leaves under both treatments were not experiencing photodamage.

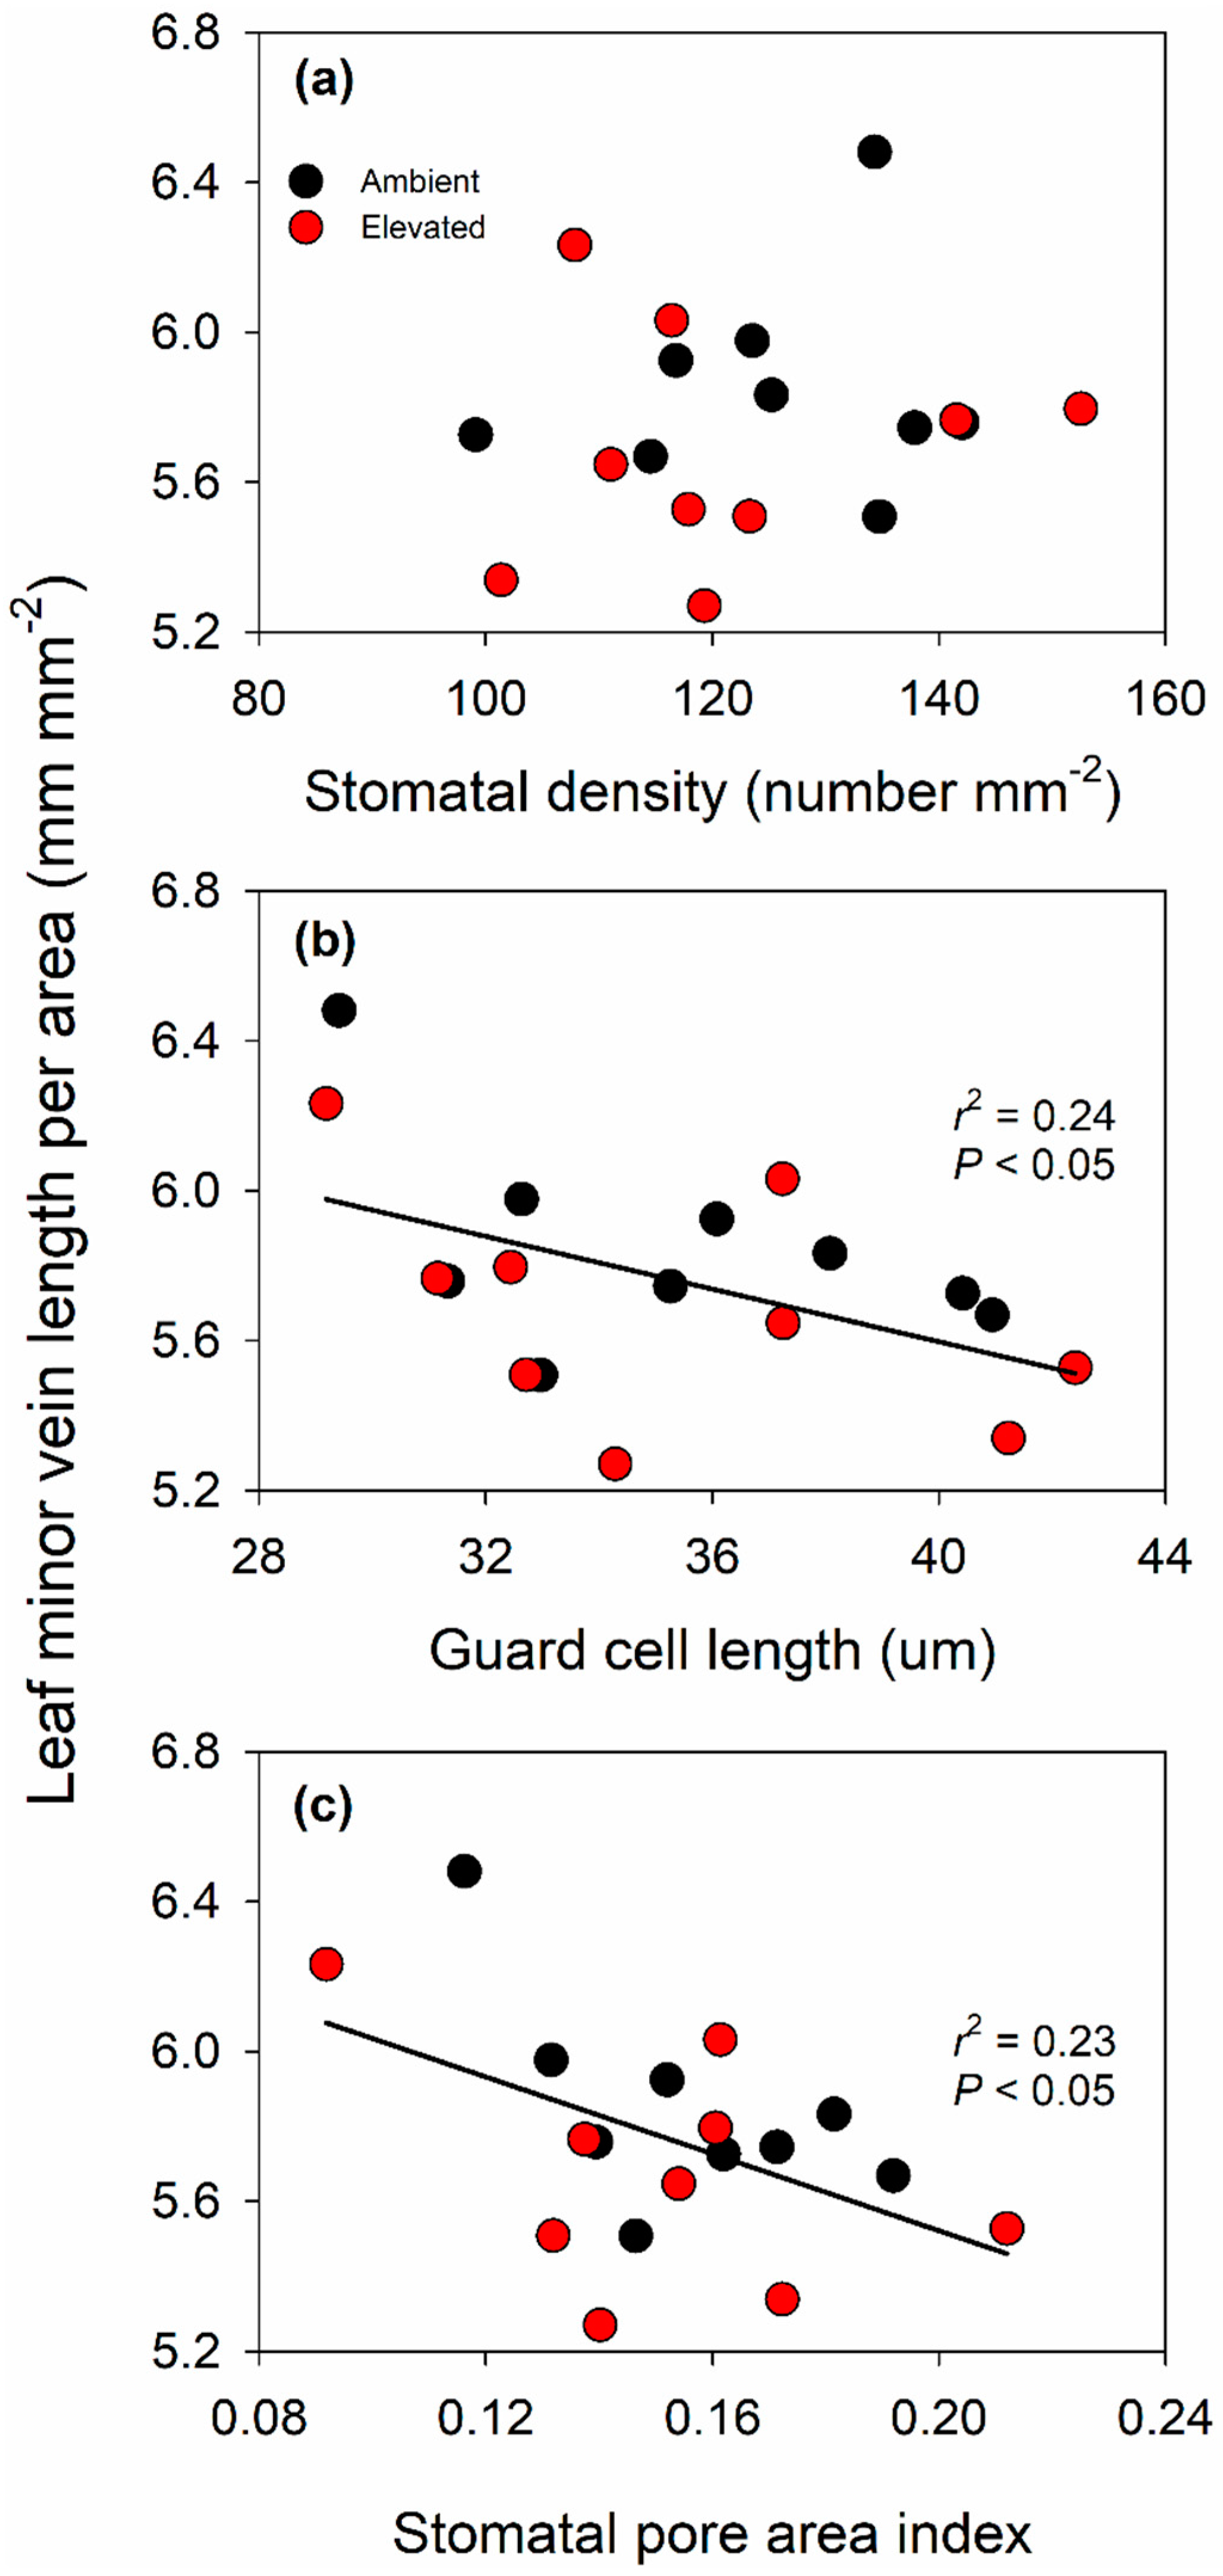
2.4. Leaf Morphology and Anatomy Were Not Altered by Elevated O3

Leaf thickness, conduit size, inner bundle sheath size, vein size and sclerenchyma size tended to be greater in ambient compared to elevated O3, however the trends were not statistically significant (Table 1). There were no significant effects of elevated O3 on other traits of leaf anatomy (Table 1). In addition, elevated O3 did not alter stomatal and minor vein characteristics in switchgrass (Table 1). In both ambient and elevated O3 treatment, leaf minor vein length per leaf area was not correlated with stomatal density (Figure 6a), but was negatively correlated with guard cell length (Figure 6b) and stomatal pore area index (Figure 6c).

2.5. No Changes in Biomass and Nutrient Composition between Ambient and Elevated O3

There was no significant effect of elevated O3 on leaf area, biomass or tiller number in switchgrass after growing in chronic elevated O3 for two months (Table 2). Additionally, there was no significant effect of elevated O3 on leaf mass per area (LMA) (64.8 ± 1.12 vs. 69.4 ± 2.60) (Table 2). Leaf and stem N content, and leaf and stem C:N were also unchanged by elevated O3 (Table 2). Elevated O3 led to a significant decrease in potassium (K) and in leaf stable carbon isotope composition (δ13C) (Table 3). However, no changes in the content of micronutrients or leaf stable nitrogen isotope composition (δ15N) were observed (Table 3).

3. Discussion

3.1. Impact of Elevated O3 on Photosynthesis and Stomatal Conductance

It is well known that elevated O3 negatively influences the growth, development, production and yield of C3 plants. In contrast, there is a much more limited body of information about the impacts of elevated O3 on photosynthesis and performance of C4 species. Here, we studied the effects of elevated O3 on leaf photosynthetic and structural traits using a promising C4 bioenergy crop, switchgrass, which was grown under season-long elevated O3 in the field with FACE technology. We found that elevated O3 significantly reduced midday A and gs (Figure 2), consistent with past observations in maize [50,51,52,53,54] and sugarcane [56,57]. Additionally, maximum photosynthetic capacity (Vmax) was lower in elevated O3 (Figure 3), also consistent with previous observations in maize [53]. However, intercellular CO2 concentration (Ci) and instantaneous water use efficiency (iWUE) did not statistically differ between ambient and elevated O3 (Figure 1), and the slope between gs and A H s C s was also different (Figure 4). In C3 species, it is commonly observed that elevated O3 impairs photosynthetic capacity, with reduced gs being a consequence rather than a driver of lower A [29,60]. Additionally, stomata can be damaged by O3 exposure leading to sluggish response to other environmental parameters [61]. Thus, in elevated O3, greater gs may be required to support a given A, which decreases water use efficiency [61]. In switchgrass, this was not observed, and both A and gs were proportionally affected, leading to no change in iWUE or the slope of the BWB model. To our knowledge, this is the first study to test how the slope of the BWB is affected by elevated O3 in C4 species, but, in rice, elevated O3-induced changes in the BWB relationship were observed in O3 sensitive cultivars, but not more tolerant cultivars [43]. In sugarcane, the degree to which A and gs were affected by elevated O3 varied with genotype [57], thus it is possible that slope of the BWB relationship was also impacted, but this was not explicitly tested. In this study on switchgrass, only one genotype was investigated, but it is also possible that there is intraspecific genetic variation in O3 response within switchgrass.
Long-term exposure to elevated O3 stress often significantly reduces either light- and/or dark-adapted chlorophyll fluorescence parameters [39,40,41,42]. In switchgrass, the effects of elevated O3 on fluorescence were inconsistent. Reductions in Fv’/Fm’ were only found on DOY 206, while quantum yield of PSII (ΦPSII) and electron transport rate (ETR) were reduced later in the growing season. No changes in photochemical quenching (qP) were observed in O3-exposed leaves (Figure 2), indicating PSII photochemistry did not change in the O3-treated leaves of switchgrass. Although maximum dark-adapted quantum yield of photosystem II (Fv/Fm) was significantly increased in O3-exposed leaves, both values of ambient and elevated O3 were higher than 0.7 (Figure 5b), which further confirmed that PSII reaction center was not damaged by elevated O3. Overall, PSII photochemistry in switchgrass was not strongly impacted by O3 stress, even though there were reductions on photosynthetic capacity and stomatal conductance.

3.2. Effect of Elevated O3 on Leaf Structure

Leaf structural traits such as leaf mass per area (LMA) are predicted to contribute to O3 sensitivity among species [62,63], but the effects of elevated O3 on leaf anatomical traits have not been well studied, especially in C4 species. There was no significant effect of O3 in switchgrass foliar anatomy (Table 1), which may result from the unique leaf structural features of C4 species including large bundle sheath volumes that enable greater Rubisco content than needed for photosynthetic saturation [64]. Feng et al. (2018) showed that tree species with greater LMA tended to have more O3 tolerance [63]. Switchgrass has greater LMA than maize [53], and showed greater tolerance to O3, although only a single genotype of switchgrass was investigated. A more thorough characterization of the relationship between LMA and O3 tolerance in grasses would be needed to test if the relationship found in trees translates to other functional groups.
Leaf minor vein density is an important determinant of leaf water and nutrient transport efficiency, which together are essential for hydraulic conductance and stomatal function. Previous work in other species reported that elevated O3 decreases whole plant hydraulic conductance [65], but studies have not examined how elevated O3 impacts the anatomical determinants of hydraulic conductance such as leaf minor vein density. Under temperature stress, leaf minor vein density and stomatal density increased in parallel supporting greater leaf hydraulic conductance [66]. Other studies have also shown that the correlation between leaf minor vein density and stomatal density varies with environmental factors including temperature, atmospheric humidity and altitude [66,67,68,69]. In this study on switchgrass, there was no correlation between leaf minor vein density and stomatal density (Figure 6a), but there was an unexpected negative correlation between leaf minor vein density and guard cell length as well as between the leaf minor vein density and stomatal pore area index (Figure 6b,c). Across a diverse range of species, leaf minor vein density is positively correlated with stomatal density [70], however the opposite pattern of what was observed here. Study of additional genotypes and conditions would be needed to more broadly understand this relationship in switchgrass.

3.3. Effect of Elevated O3 on Biomass and Nutrient Composition

Many previous studies have shown that elevated O3 negatively affects both biomass and yield production across plant species [27,29]. A review of woody species estimated that elevated O3 reduces biomass by 7% across diverse tree species [28]. Similarly, a review of the effects of elevated O3 on reproductive processes suggested that yield and seed weight are reduced to a similar extent in both C3 and C4 species [71]. However, few C4 species have been studied in detail, and most of the prior work focused on maize. In tobacco, growth at high N treatment protected from O3 damage [72] suggesting that the negative impacts of O3 on biomass may be improved by soil nutrient conditions. Similar results were observed in switchgrass which was grown under high fertility at the FACE site in this study (Table 2). No differences in leaf and stem N content or above-ground biomass were observed in ambient and elevated O3. Given the decrease in photosynthesis, it is somewhat surprising that no differences in above-ground biomass were observed. However, in wheat, root biomass is reduced more than shoot biomass at elevated O3 [27], and it is possible that there was a change in allocation in switchgrass at elevated O3 as well.
Other nutrients including magnesium (Mg), phosphorus (P), sulfur (S), potassium (K), zinc (Zn), calcium (Ca) and iron (Fe) are important components of the photosynthetic apparatus and reactions [73,74,75] and also impact the efficiency of biomass combustion systems [76]. Here, a significant decrease in elevated O3 was only observed for K (Table 3), which may be associated with reductions in net CO2 assimilation (A) and stomatal conductance (gs) (Figure 1) [75]. Indeed, changes in nutrient composition highly depend on the soil properties and on the O3 impact on plant metabolism [77,78,79]. There was a significant, but small, reduction in leaf stable carbon isotope composition (δ13C) but no change in nitrogen isotope composition (δ15N) at elevated O3. Generally, δ13C is positively correlated with water use efficiency [80,81,82], while δ15N serves as an indicator of plant N acquisition, fixation and cycling [83,84,85]. Both δ13C and δ15N are strongly controlled by environmental conditions. Although elevated O3 did not alter iWUE on DOY 206 and DOY 225 (Figure 1 and Table 1), decreased δ13C suggests that there was an accumulated effect of elevated O3 over the life-time of the leaf, albeit small. As discussed above, plants grown in sufficient N were not compromised by elevated O3, which could partially explain the limited effects of elevated O3 on δ15N [72].

3.4. Implications for Bioenergy Feedstock Development

Although a successful bioenergy industry will require high productivity and yield stability of bioenergy feedstocks, how the bioenergy crops acclimate to a rapidly changing, more polluted environment should be considered seriously. Our results provide evidence that switchgrass exhibits O3 tolerance, and suggest that C4 bioenergy crops including maize and switchgrass differ in O3 tolerance. However, the year of our experiment was extremely wet, and previous work in maize also showed that O3 sensitivity was greater in dry years [31], thus additional side-by-side experiments with more genotypes and species are needed for a definitive comparison. In natural environments ambient O3 concentrations strongly vary over the land surface throughout the day and over the season, resulting in geographic variation in O3 pollution. Therefore, understanding variation in C4 bioenergy feedstock responses to elevated O3 could be used to better place specific feedstocks on a dynamic landscape.

4. Materials and Methods

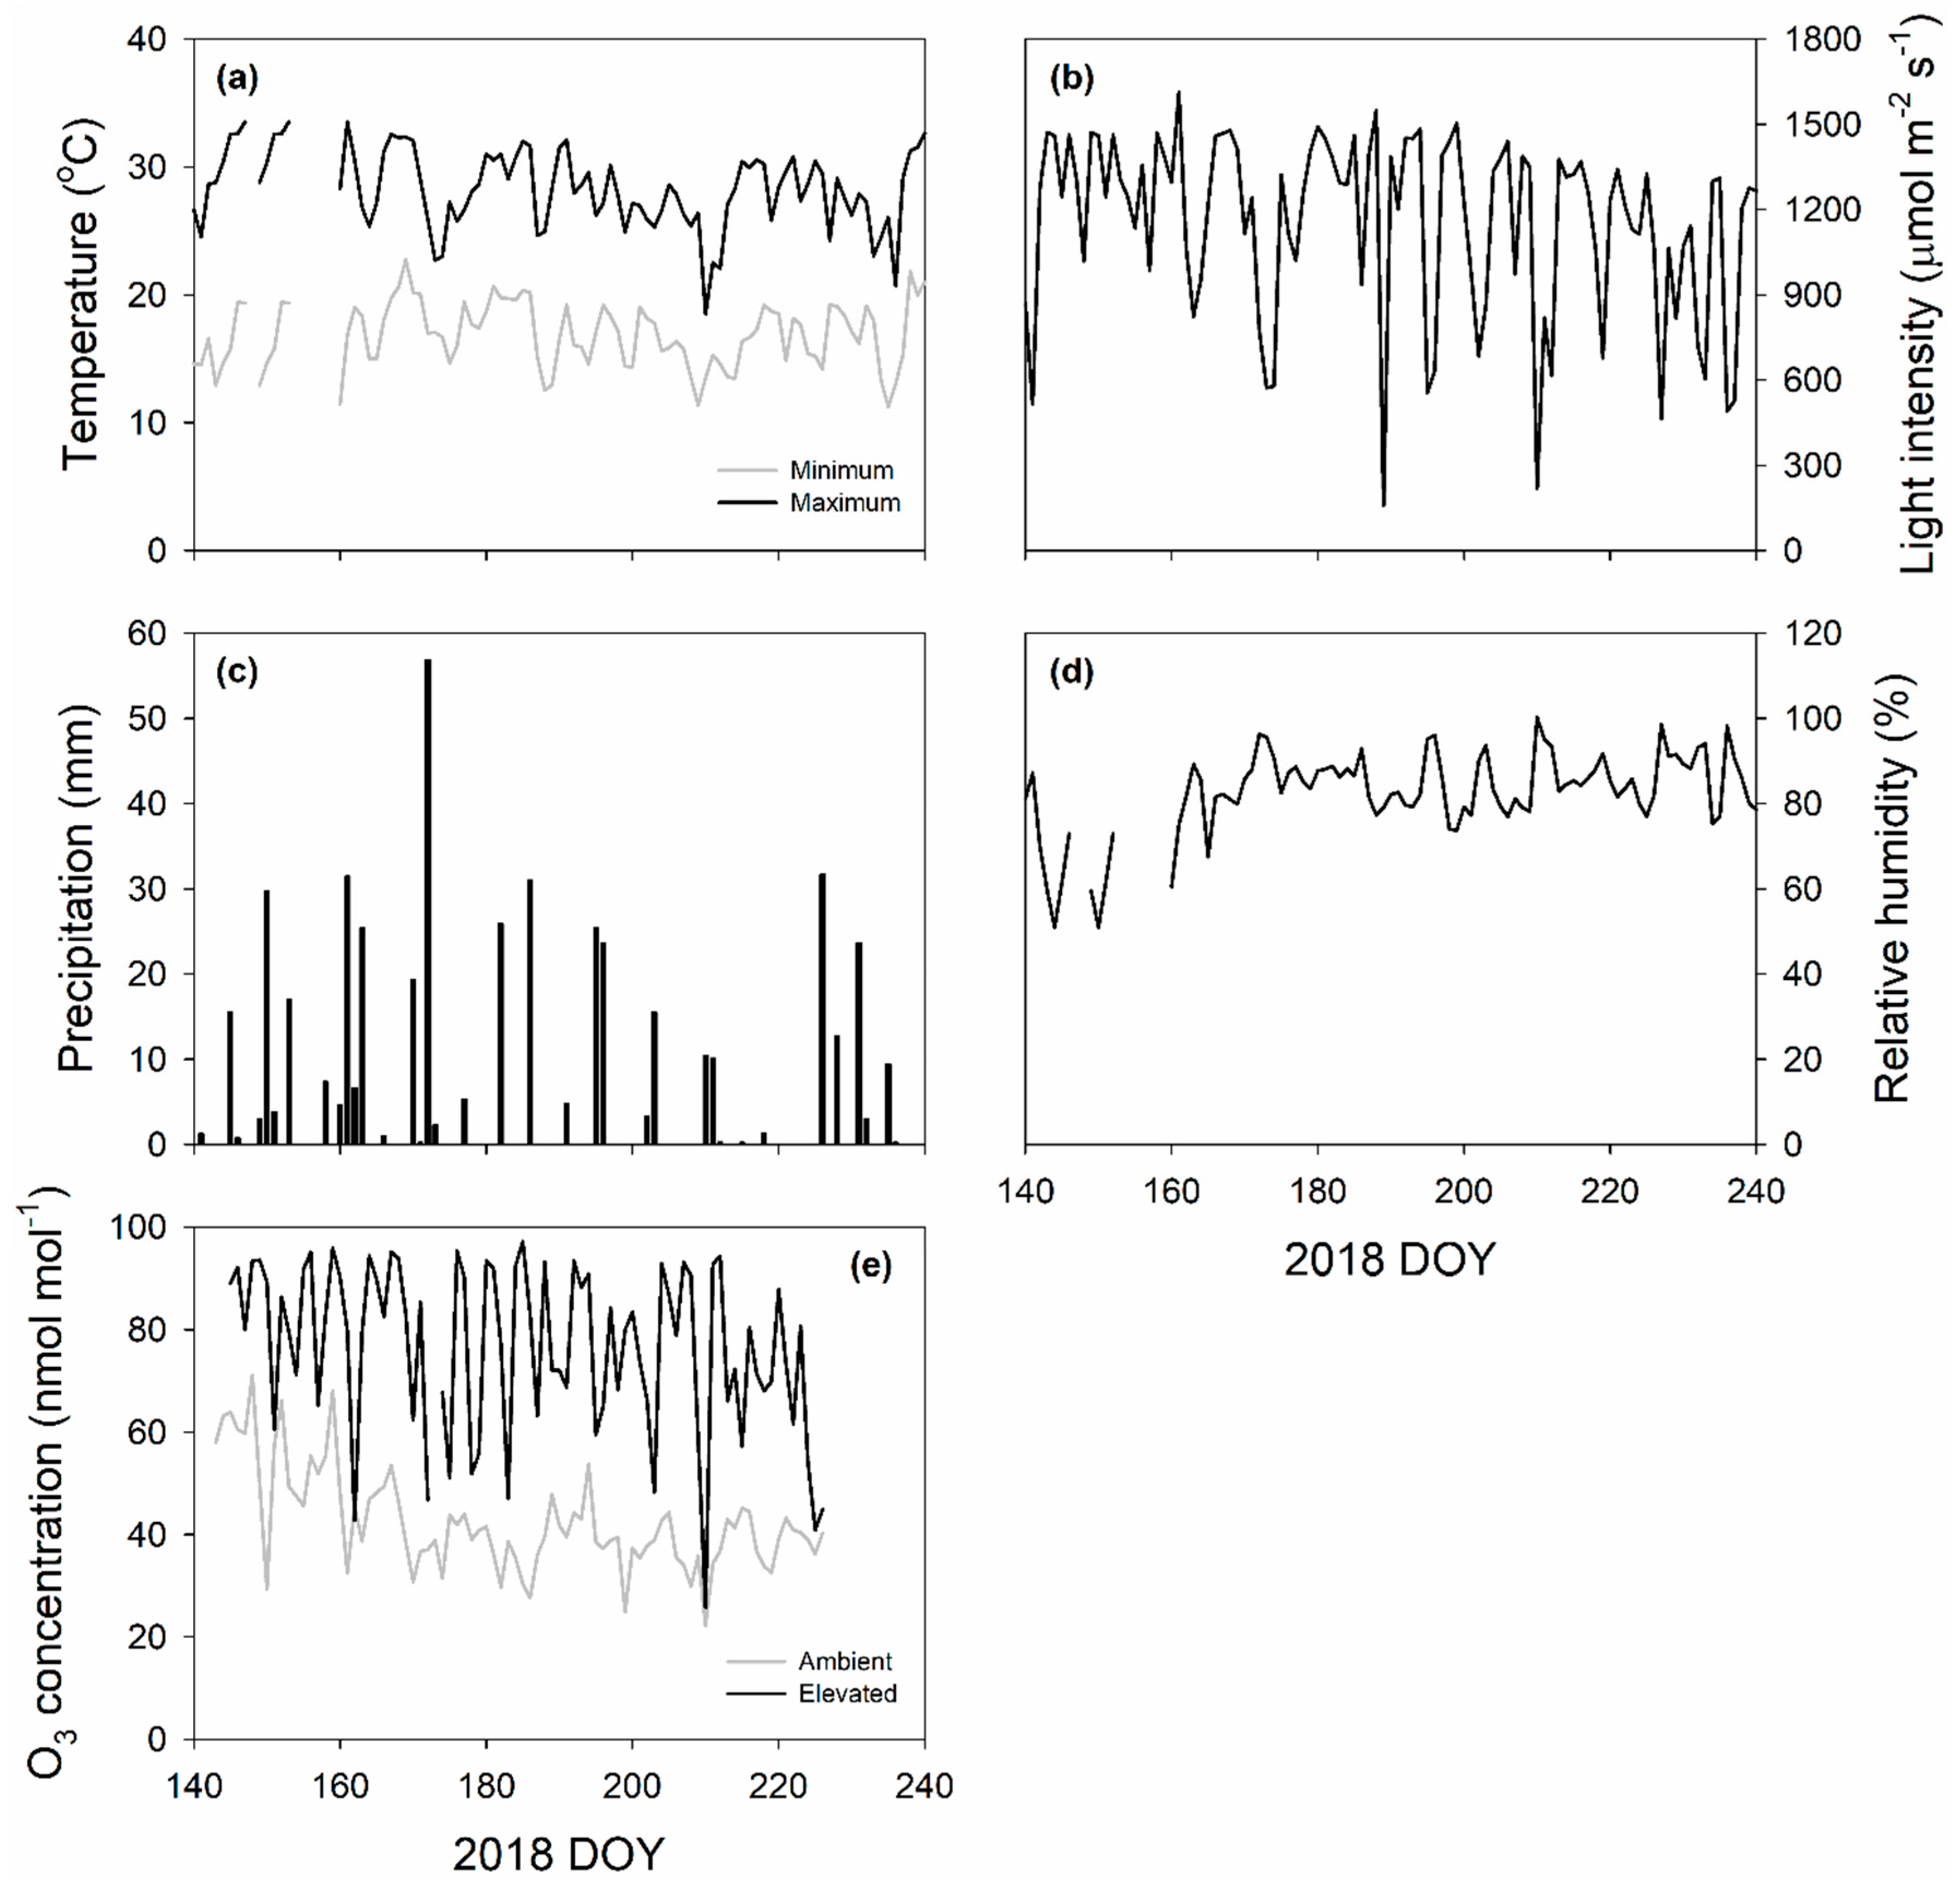
4.1. Field Site, Plant Material and Growth Condition

The study was conducted at the Free Air Concentration Enrichment (FACE) facility in Champaign, IL, USA (www.igb.illinois.edu/soyface/, 40°02’N, 88°14’W) in 2018. Six plots in octagonal shape of 20 m diameter were designed for this study: three at ambient O3 concentration (30–50 nmol mol−1) and three fumigated to elevated O3 concentration (~100 nmol mol−1). The weather conditions including daily maximum and minimum air temperature, averaged light intensity (9:00–18:00), precipitation, averaged daily relative humidity and O3 concentration (10:00–18:00) during growing season of 2018 were monitored by an on-site weather station at the FACE facility and shown in Figure 7.
Seedlings of switchgrass (Panicum virgatum Kanlow, generously provided by DK Lee, University of Illinois at Urbana-Champaign) were transplanted in the central part of each plot on 24 May (DOY 144) in 2018. Elevated O3 plots were fumigated on 25 May (DOY 145) in 2018 and followed the protocol described in detail by Morgan et al. (2004) [86] and Yendrek et al. [53,54]. Elevated O3 fumigation was carried out using the O3-enriched air that was delivered to and released within the experimental plots with FACE technology. O3 was generated by an O3 generator (CFS-3 2G; Ozonia) using pure oxygen and monitored by a chemiluminescence O3 sensor (Model 49i, Thermo Scientific, Massachusetts, USA) that connected to the tube pumping air from the central point of plot. Fumigation was applied for 8 h per day from 10:00 to 18:00 when leaves were not too wet and when wind speed was not too low, with the target O3 concentration of 100 nL L−1 at the central point of elevated plots. O3 fumigation was stopped on 13 August (DOY 225) in 2018 once the second round of midday photosynthesis measurements were finished (Figure 7e). In 2018, the 1 min average O3 concentrations within the elevated plots were within 20% of the target concentration 81.6% of the time.

4.2. Leaf Midday Gas Exchange, Chlorophyll Fluorescence and A/Ci Curve

In situ midday gas exchange and chlorophyll fluorescence measurements were made on fully expanded leaves between 11:00 and 14:00 on sunny days of 25 July (DOY 206) and 13 August (DOY 225) in 2018. The net CO2 assimilation rates (A), stomatal conductance to water vapor (gs), intercellular CO2 concentration (Ci) and chlorophyll fluorescence (Fv’/Fm’, ΦPSII, ETR, and qP) under illumination were measured with a portable photosynthesis system (LI 6400, LICOR Biosciences, Lincoln, NE, USA) following previously published protocols [53,87,88]. Briefly, the environmental conditions within the leaf cuvette were set to match ambient conditions: leaf cuvette temperature was 29 °C, CO2 concentration was 400 µmol mol−1, light intensity at the leaf surface was 1950 µmol m−2 s−1 and relative humidity was 60% for the DOY 206; leaf cuvette temperature was 31 °C, CO2 concentration was 420 µmol mol−1, light intensity at the leaf surface was 1750 µmol m−2 s−1 and relative humidity was 60% for DOY 225, 2018. The measurement was performed when photosynthesis had stabilized, typically 3–5 min after leaf enclosure. Considering the heterogeneity of physiology and structure within a given leaf [89,90], we measured photosynthesis and other functional traits (see below) in the middle part of all leaves. In all cases, 4–5 leaves of different individuals within each plot were measured, and were averaged for analyses. The instantaneous water use efficiency (iWUE) was calculated as A/gs.
Three sun-exposed leaves of different individuals within each plot were selected to measure the response of A to Ci using a LI-6400. Predawn on DOY 206, leaves were excised and recut immediately under water to prevent leaf water potential decrease, chloroplast inorganic phosphate concentration or maximum photosystem II efficiency decrease [91]. With the cut end immersed, leaves were quickly transported to the laboratory where they were exposed to ambient CO2 concentration and saturating light levels to achieve a steady-state. The middle part of the leaf was then enclosed in cuvette and measurements were initiated at a CO2 concentration of 400 µmol mol−1, air temperature of 25 °C, light intensity of 1800 µmol m−2 s−1 and relative humidity of 60%. CO2 concentration within the cuvette was then changed sequentially as follows: 400, 300, 200, 100, 50, 400, 500, 600, 800, 1000, and 1200 µmol mol−1. The maximum carboxylation capacity of phosphoenolpyruvate (Vpmax) and CO2 saturated photosynthetic capacity (Vmax) were calculated according to Farquhar et al. (1980), von Caemmerer (2000) and Markelz et al. (2011) [92,93,94].

4.3. Ball–Woodrow–Berry Relationship

The Ball–Woodrow–Berry (BWB) relationship was calculated as:
g s   =   a A H s C s   +   b
where gs is stomatal conductance to water vapor (mol (H2O) m−2 s−1); A is net CO2 assimilation rate (µmol (CO2) m−2 s−1); Hs and Cs are relative humidity (Pa (air) Pa (Saturated)−1) and CO2 concentration (Pa (CO2) Pa (air)−1) at the leaf surface, respectively; and a and b are the slope (mol (H2O) mol (CO2)−1) and intercept (mol (H2O) m−2 s−1) of the BWB relationship, respectively [43,48].
Hs was calculated as:
H s =   E s E sat
where Es is the partial pressure (Pa) of vapor at the leaf surface and Esat is the partial pressure (Pa) of vapor at saturation.
Es was determined as:
T r   =   g s E i     E s P
where Tr is transpiration (mol (H2O) m−2 s−1) and P is air pressure (Pa). Ei is the partial pressure of vapor (Pa) at substomatal cavity and is assumed to be saturated:
E i   =   E sat   = 611 exp ( λ R ( 1 273 . 15 1 T l ) )
where λ and R are the latent heat of vaporization and (set at 2,500,000 J kg−1) and the gas constant of vapor and (set at 461 J kg−1 K−1) [40], respectively, and Tl is leaf temperature (K).
Cs was determined by the following equation:
A =   g s 1 . 6   ( C s C i )
where 1.6 is the ratio of conductance for H2O to that for CO2 and has dimensions of ((mol(H2O) m−2 s−1)/(mol(CO2) m−2 s−1)) and Ci is intercellular CO2 concentration (Pa (CO2) Pa (air)−1).
The values of A, gs, Tr, Ci, P and Tl were observed from a portable photosynthesis analyzer Licor-6400. The slope a and intercept b of the BWB relationship were estimated using linear regression with observed gs and calculated A H s C s .

4.4. Dark Respiration and Dark-Adapted Chlorophyll Fluorescence

Leaf respiration rates and chlorophyll fluorescence under dark were also measured using the LI-6400. Immediately after each A/Ci curve was completed, the leaf was removed from the cuvette and kept in the cabinet under dark for at least 50 min. Environmental controls inside the cuvette were maintained to match the ambient conditions: leaf cuvette temperature was 27 °C, CO2 concentration was 400 µmol mo−1, relative humidity was 60% but light intensity at the leaf surface was 0 µmol m−2 s−1. Leaf dark respiration was measured after readings stabilized, typically 3–10 min after leaf enclosure. To examine the effects of elevated O3 on photosystem II (PS II) activity, dark-adapted chlorophyll fluorescence was measured. Following the respiration rates measurements, the leaf was further illuminated with a saturating irradiance (>7000 µmol m−2 s−1) to measure the minimum fluorescence yield (F0) and the maximum dark-adapted fluorescence yield (Fm). The spatially averaged maximum dark-adapted quantum yield of photosystem II (PSII), Fv/Fm was calculated as the ratio of (FmF0) to Fm.

4.5. Leaf Anatomy

Immediately after each dark-adapted chlorophyll fluorescence measurement was completed, leaf samples of 16 cm2 were excised with a razor blade and stored in 70% ethanol for further analysis in the laboratory. For each leaf sample, three hand-cut transverse sections were viewed under a microscope (Leica DM 2000, Leica Microsystems, Wetzlar, Germany) and imaged using a digital camera (SPOT Insight 4 Mp CCD, Diagnostic Instruments, Inc. USA). Using an image analysis software (Image J, National Institutes of Health, Bethesda, MD, USA), the following leaf structural traits were measured followed previous published methods [95,96]: bundle sheath density (number mm−1), distance between secondary vein (mm), leaf thickness (µm), interveinal distance (IVD, µm), conduit diameter (µm), conduit size (µm2), out bundle sheath size (µm2), inner bundle sheath size (µm2), vein size (µm2), colorless cell size (µm2), upper epidermis cell size (µm2), lower epidermis cell size (µm2), motor cell size (µm2), and sclerenchyma size (µm2).
To measure stomatal density and guard cell length, clear nail polish impressions were collected from abaxial surface of the lamina using other leaf discs from the same leaf sample used for leaf anatomical measurement and viewed and imaged under microscope. The stomatal pore area index (SPI) was calculated as (stomatal density) × (guard cell length)2 [97].
Using a ~2 cm2 leaf disc from the same leaf sample used for leaf anatomical and stomatal measurement, minor vein density (i.e., minor vein length per leaf area) was determined. After the epidermis was removed with a sharp razor blade, the remaining leaf samples were put in bleach (Clorox Professional Products Company, Oakland, CA, USA) to clear mesophyll cells. The samples were then stained with toluidine blue (Electron Microscopy Sciences, Hatfield, PA, USA) and imaged under microscope. The length minor vein per leaf area was measured with Image J manually.

4.6. Biomass, C and N Content and Nutrient Composition Quantification

All plants were harvest on 23 August (DOY 235) in 2018. Three individuals of each plot were selected for the biomass, C and N content measurement. Leaf area was measured by an area meter (LI-2000, LICOR Biosciences, Lincoln, NE, USA) and the number of tillers of each plant was counted. Leaf and stem dry mass were determined after oven-drying for 1 week at 50 °C. Leaf dry mass per area (LMA) was calculated as dry mass/ area. Dried leaf and stem samples were then ground and weighted, and C and N content (%) was determined by a Costech 4010 elemental analyzer (Costech Analytical Technologies, Inc., Valencia, CA, USA).
Macro- and micronutrients were quantified as previously described [98] by inductively high-resolution coupled plasma mass spectrometry (Element 2TM, Thermo Scientific). Briefly, samples were submitted to a microwave acid sample digestion (Multiwave ECO, Anton Paar, les Ulis, France) (1 mL of concentrated HNO3, 250 μL of H2O2 and 900 μL of Milli-Q water for 40 mg DW). All samples were previously spiked with two internal standard solutions of gallium and rhodium for final concentrations of 10 and 2 μg L−1. After acid digestion, samples were diluted to 50 mL with Milli-Q water to obtain solutions containing 2.0% (v/v) of nitric acid, then filtered at 0.45 μm using a teflon filtration system. Quantification of each element was performed using external standard calibration curves. The quality of mineralization and analysis were checked using a certified reference material of Citrus leaves (CRM NCS ZC73018, Sylab, Metz, France). Isotopic analysis of C and N was performed with a continuous flow isotope mass spectrometer (Isoprime, GV Instruments, Manchester, UK) linked to a C/N/S analyser (EA3000, EuroVector, Milan, Italy).

4.7. Statistical Analysis

The differences in physiological and structural traits between ambient and elevated O3 were tested with one-way ANOVA followed by the Tukey’s post hoc test using SPSS 16.0 (SPSS, Chicago, Illinois, USA). The differences in slope and intercept of BMB relationship (observed stomatal conductance vs. A H s C s ) between ambient and elevated O3 were tested with standardized major axis tests using SMATR v2.0 [99]. All statistical tests were considered significant at p < 0.05.

Author Contributions

E.A.A. designed the study; S.L., G.C. and A.O. performed the measurements; S.L. performed the statistical analysis; S.L., and E.A.A. contributed to the interpretation of results; and S.L. wrote the first version of the manuscript, which was reviewed and revised by all the authors

Acknowledgements

We would like to thank Jesse McGrath, Chris Moller, Noah Mitchell and Aidan McMahon for technical and field assistance. We also would like to thank Prof. DoKyoung Lee (University of Illinois at Urbana-Champaign) for providing plant materials. The authors acknowledge the PLATIN’ (Plateau d’Isotopie de Normandie) core facility for the nutrient and isotope analysis used in this study. This work was funded by the DOE Center for Advanced Bioenergy and Bioproducts Innovation (U.S. Department of Energy, Office of Science, Office of Biological and Environmental Research under Award Number DE-SC0018420).

Conflicts of Interest

The authors declare no conflict of interest. Any opinions, findings, and conclusions or recommendations expressed in this publication are those of the author(s) and do not necessarily reflect the views of the U.S. Department of Energy.

References

  1. McLaughlin, S.B.; De La Torre Ugarte, D.G.; Jr Garten, C.T.; Lynd, L.R.; Sanderson, M.A.; Tolbert, V.R.; Wolf, D.D. High-value renewable energy from prairie grasses. Environ. Sci. Technol. 2002, 36, 2122–2129. [Google Scholar] [CrossRef]
  2. Tilman, D.; Socolow, R.; Foley, J.A.; Hill, J.; Larson, E.; Lynd, L.; Pacala, S.; Reilly, J.; Searchinger, T.; Somerville, C.; et al. Beneficial biofuels-the food, energy, and environment trilemma. Science 2009, 325, 270–271. [Google Scholar] [CrossRef] [PubMed]
  3. Wullschleger, S.D.; Davis, E.B.; Borsuk, M.E.; Gunderson, C.A.; Lynd, L.R. Biomass production in switchgrass across the United States: Database description and determinants of yield. Agron. J. 2010, 102, 1158–1168. [Google Scholar] [CrossRef]
  4. Vadas, P.A.; Barnett, K.H.; Undersander, D.J. Economics and energy of ethanol production from alfalfa, corn, and switchgrass in the upper Midwest, USA. Bioenerg. Res. 2008, 1, 44–55. [Google Scholar] [CrossRef]
  5. U.S. Department of Energy. U.S. Billion-Ton Update: Biomass Supply for a Bioenergy and Bioproducts Industry. In ORNL/TM-2011/224; Perlack, R.D., Stokes, B.J., Eds.; Oak Ridge National Laboratory: Oak Ridge, TN, USA, 2011. [Google Scholar]
  6. Moser, L.E.; Vogel, K.P. Switchgrass, big bluestem, and indiangrass. In An Introduction to Grassland Agriculture, 5th ed.; Barnes, R.F., Miller, D.A., Nelson, C.J., Eds.; Iowa State Univ. Press: Ames, IA, USA, 1995; pp. 409–420. [Google Scholar]
  7. McLaughlin, S.B.; Kszos, L.A. Development of switchgrass (Panicum virgatum) as a bioenergy feedstock in the United States. Biomass Bioenergy 2005, 28, 515–535. [Google Scholar] [CrossRef]
  8. Schmer, M.R.; Vogel, K.P.; Mitchell, R.B.; Perrin, R.K. Net energy of cellulosic ethanol from switchgrass. Proc. Natl. Acad. Sci. USA 2008, 105, 464–469. [Google Scholar] [CrossRef]
  9. Vogel, K.P. Energy production from forages (or American agriculture-back to the future). J. Soil Water Conserv. 1996, 51, 137–139. [Google Scholar]
  10. Casler, M.D.; Vogel, K.P.; Taliaferro, C.M.; Wynia, R.L. Latitudinal adaptation of switchgrass populations. Crop Sci. 2004, 44, 293–303. [Google Scholar] [CrossRef]
  11. Mitchell, R.; Vogel, K.P.; Sarath, G. Managing and enhancing switchgrass as a bioenergy feedstock. Biofuels Bioprod. Bioref. 2008, 2, 530–539. [Google Scholar] [CrossRef]
  12. Stroup, J.A.; Sanderson, M.A.; Muir, J.P.; McFarland, M.J.; Reed, R.L. Comparison of growth and performance in upland and lowland switchgrass types to water and nitrogen stress. Bioresour. Technol. 2003, 86, 65–72. [Google Scholar] [CrossRef]
  13. Barney, J.N.; Jeremiah Mann, J.; Kyser, G.B.; Blumwald, E.; Van Deynze, A.; DiTomaso, J.M. Tolerance of switchgrass to extreme soil moisture stress: Ecological implications. Plant Sci. 2009, 177, 724–732. [Google Scholar] [CrossRef]
  14. Jiang, Y.; Yao, Y.; Wang, Y. Physiological response, cell wall components, and gene expression of switchgrass under short-term drought stress and recovery. Crop Sci. 2012, 52, 2718–2727. [Google Scholar] [CrossRef]
  15. Kim, S.; Rayburn, A.L.; Voigt, T.; Parrish, A.; Lee, D.K. Salinity effects on germination and plant growth of prairie cordgrass and switchgrass. Bioenerg. Res. 2012, 5, 225–235. [Google Scholar] [CrossRef]
  16. Sanderson, M.A.; Adler, P.R.; Boateng, A.A.; Casler, M.D.; Sarath, G. Switchgrass as a biofuels feedstoack in the USA. Can. J. Plant Sci. 2006, 86, 1315–1325. [Google Scholar] [CrossRef]
  17. Sillman, S. The relation between ozone, NOx and hydrocarbons in urban and polluted rural environments. Atmos. Environ. 1999, 33, 1821–1845. [Google Scholar] [CrossRef]
  18. Atkinson, R. Atmospheric chemistry of VOCs and NOx. Atmos. Environ. 2000, 34, 2063–2101. [Google Scholar] [CrossRef]
  19. Fowler, D.; Amann, M.; Anderson, F.; Ashmore, M.; Cox, P.; Depledge, M.; Derwent, D.; Grennfelt, P.; Hewitt, N.; Hov, O.; et al. Ground-Level Ozone in the 21st Century: Future Trends, Impacts and Policy Implications; The Royal Society: London, UK, 2008. [Google Scholar]
  20. Sharma, P.; Kuniyal, J.C.; Chand, K.; Guleria, R.P.; Dhyani, P.P.; Chauhau, C. Surface ozone concentration and its behaviour with aerosols in the northwestern Himalaya, India. Atmos. Environ. 2013, 71, 44–53. [Google Scholar] [CrossRef]
  21. Monks, P.S.; Archibald, A.T.; Colette, A.; Cooper, O.; Coyle, M.; Derwent, R.; Fowler, D.; Granier, C.; Law, K.S.; Mills, G.E.; et al. Tropospheric ozone and its precursors form the urban to the global scale from air quality to short-lived climate forcer. Atmos. Chem. Phys. 2015, 15, 8889–8973. [Google Scholar] [CrossRef]
  22. Yuan, X.; Calatayud, V.; Jiang, L.; Manning, W.J.; Hayes, F.; Tian, Y.; Feng, Z. Assessing the effects of ambient ozone in China on snap bean genotypes by using ethylenediurea (EDU). Environ. Pollut. 2015, 205, 199–208. [Google Scholar] [CrossRef] [PubMed]
  23. Ainsworth, E.A. Understanding and improving global crop response to ozone pollution. Plant J. 2017, 90, 886–897. [Google Scholar] [CrossRef] [PubMed]
  24. Auvray, M.; Bey, I. Long-range transport to Europe: Seasonal variations and implications for the European ozone budget. J. Geophys. Res. 2005, 110, D11303. [Google Scholar] [CrossRef]
  25. Liao, K.J.; Hou, X.; Baker, D.R. Impacts of interstate transport of pollutants on high ozone events over the Mid-Atlantic United States. Atmos. Environ. 2014, 84, 100–112. [Google Scholar] [CrossRef]
  26. Weiss-Penzias, P.; Jaffe, D.A.; Jaegle´, L.; Liang, Q. Influence of long-range-transported pollution on the annual and diurnal cycles of carbon monoxide and ozone at Cheeka Peak Observatory. J. Geophys. Res. 2004, 109, D23S14. [Google Scholar] [CrossRef]
  27. Feng, Z.; Kobayashi, K.; Ainsworth, E.A. Impact of elevated ozone concentration on growth, physiology, and yield of wheat (Triticum aestivum L.): A meta-analysis. Glob. Chang. Biol. 2008, 14, 2696–2708. [Google Scholar]
  28. Wittig, V.E.; Ainsworth, E.A.; Naidu, A.L.; Karnosky, D.F.; Long, S.P. Quantifying the impact of current and future tropospheric ozone on the tree biomass, growth, physiology and biochemistry: A quantitative meta-analysis. Glob. Chang. Biol. 2009, 15, 396–424. [Google Scholar] [CrossRef]
  29. Ainsworth, E.A.; Yendrek, C.R.; Sitch, S.; Collins, W.J.; Emberson, L.D. The effects of tropospheric ozone on net primary productivity and implications for climate change. Annu. Rev. Plant. Biol. 2012, 63, 637–661. [Google Scholar] [CrossRef] [PubMed]
  30. Wilkinson, S.; Mills, G.; Illidge, R.; Davies, W.J. How is ozone pollution reducing our food supply? J. Exp. Bot. 2012, 63, 527–536. [Google Scholar] [CrossRef] [PubMed]
  31. McGrath, J.M.; Betzelberger, A.M.; Wang, S.; Shook, E.; Zhu, X.-G.; Long, S.P.; Ainsworth, E.A. An analysis of ozone damage to historical maize and soybean yields in the United States. Proc. Natl. Acad. Sci. USA 2015, 112, 14390–14395. [Google Scholar] [CrossRef] [PubMed]
  32. Rebouças, D.M.; De Sousa, Y.M.; Bagard, M.; Costa, J.H.; Jolivet, Y.; De Melo, D.F.; Repellin, A. Combined effects of ozone and drought on the physiology and membrane lipids of two cowpea (Vigna unguiculata (L.) Walp) cultivars. Plants 2017, 6, 14. [Google Scholar] [CrossRef] [PubMed]
  33. Mills, G.; Sharps, K.; Simpson, D.; Pleijel, H.; Broberg, M.; Uddling, J.; Jaramillo, F.; Davies, W.; Dentener, F.; Van den Berg, M.; et al. Ozone pollution will compromise efforts to increase global wheat production. Glob. Chang. Biol. 2018, 24, 3560–3574. [Google Scholar] [CrossRef]
  34. Ainsworth, E.A.; Lemonnier, P.; Wedow, J.M. The influence of rising tropospheric carbon dioxide and ozone on plant productivity. Plant Biol. 2019. [CrossRef]
  35. Heath, R.L. The Biochemistry of Ozone Attack on the Plasma Membrane of Plant Cells. In Phytochemical Effects of Environmental Compounds. Recent Advances in Phytochemistry; Saunders, J.A., Kosak-Channing, L., Conn, E.E., Eds.; Springer: Boston, MA, 1987; Volume 21. [Google Scholar]
  36. Long, S.P.; Naidu, S.L. Effect of oxidants at the biochemical, cell and physiological levels, with particular reference to ozone. In Air Pollution and Plant Life; Bell, J.N.B., Treshow, M., Eds.; John Wiley & Sons, Ltd.: West Sussex, UK, 2002; pp. 69–88. [Google Scholar]
  37. Pasqualini, S.; Piccioni, C.; Reale, L.; Ederli, L.; Della, T.G.; Ferranti, F. Ozone-induced cell death in tobacco cultivar Bel W3 plant. The role of programmed cell death in lesion formation. Plant Physiol. 2003, 133, 1122–1134. [Google Scholar] [CrossRef]
  38. Fiscus, E.L.; Booker, F.L.; Burkey, K.O. Crop responses to ozone: Uptake, models of action, carbon assimilation and partitioning. Plant Cell Environ. 2005, 28, 997–1011. [Google Scholar] [CrossRef]
  39. Li, S.; Harley, P.C.; Niinemets, Ü. Ozone-induced foliar damage and release of stress volatiles is highly dependent on stomatal openness and priming by low-level ozone exposure in Phaseolus vulgaris. Plant Cell Environ. 2017, 40, 1984–2003. [Google Scholar] [CrossRef]
  40. Flowers, M.D.; Fiscus, E.L.; Burkey, K.O.; Booker, F.L.; Dubois, J.-J.B. Photosynthesis, chlorophyll fluorescence, and yield of snap bean (Phaseolus vulgaris L.) genotypes differing in sensitivity to ozone. Environ. Exp. Bot. 2007, 61, 190–198. [Google Scholar] [CrossRef]
  41. Guidi, L.; Degl’Innocenti, E.; Martinelli, F.; Piras, M. Ozone effects on carbon metabolism in sensitive and insensitive Phaseolus cultivars. Environ. Exp. Bot. 2009, 66, 117–125. [Google Scholar] [CrossRef]
  42. Li, S.; Tosens, T.; Harley, P.C.; Jiang, Y.; Kanagendran, A.; Grosberg, M.; Jaamets, K.; Niinemets, Ü. Glandular trichomes as a barrier against atmospheric oxidative stress: Relationships with ozone uptake, leaf damage, and emission of LOX products across a diverse set of species. Plant Cell Environ. 2018, 40, 1263–1277. [Google Scholar] [CrossRef]
  43. Masutomi, Y.; Kinose, Y.; Takimoto, T.; Yonekura, T.; Oue, H.; Kobayashi, K. Ozone changes the linear relationship between photosynthesis and stomatal conductance and decreases water use efficiency in rice. Sci. Total Environ. 2019, 655, 1009–1016. [Google Scholar] [CrossRef]
  44. Paoletti, E.; Grulke, N.E. Does living in elevated CO2 ameliorate tree response to ozone? A review on stomatal responses. Environ. Pollut. 2005, 137, 483–493. [Google Scholar] [CrossRef]
  45. Vahisalu, T.; Puzõrjova, I.; Brosché, M.; Valk, E.; Lepiku, M.; Moldau, H.; Pechter, P.; Wang, Y.-S.; Lindgren, O.; Salojärvi, J.; et al. Ozone-triggered rapid stomatal response involves the production of reactive oxygen species, and is controlled by SLAC1 and OST1. Plant J. 2010, 62, 442–453. [Google Scholar] [CrossRef]
  46. Paoletti, E.; Grulke, N.E. Ozone exposure and stomatal sluggishness in different plant physiognomic classes. Environ. Pollut. 2010, 158, 2664–2671. [Google Scholar] [CrossRef]
  47. Hoshika, Y.; Omasa, K.; Paoletti, E. Both ozone exposure and soil water stress are able to induce stomatal sluggishness. Environ. Exp. Bot. 2013, 88, 19–23. [Google Scholar] [CrossRef]
  48. Ball, J.T.; Woodrow, I.E.; Berry, J.A. A model predicting stomatal conductance and its contribution to the control of photosynthesis under different environmental conditions. In Progress in Photosynthesis Research; Biggins, J., Ed.; Martinus Nijhoff Publishers: Dordrecht, The Netherlands, 1987; pp. 221–224. [Google Scholar]
  49. Wolz, K.J.; Wertin, T.M.; Abordo, M.; Wang, D.; Leakey, A.D.B. Diversity in stomatal function is integral to modelling plant carbon and water fluxes. Nat. Ecol. Evol. 2017, 1, 1292–1298. [Google Scholar] [CrossRef]
  50. Leitao, L.; Bethenod, O.; Biolley, J.-P. The impact of ozone on juvenile maize (Zea mays L.) plant photosynthesis: Effects on vegetative biomass, pigmentation, and carboxylases (PEPc and rubisco). Plant Biol. 2007, 9, 478–488. [Google Scholar] [CrossRef]
  51. Leitao, L.; Maoret, J.J.; Biolley, J.P. Changes in PEP carboxylase, rubisco and rubisco activase mRNA levels from maize (Zea mays) exposed to a chronic ozone stress. Biol. Res. 2007, 40, 137–153. [Google Scholar] [CrossRef]
  52. Singh, A.A.; Agrawal, S.B.; Shahi, J.P.; Agrawal, M. Assessment of growth and yield losses in two Zea mays L. cultivars (quality protein maize and nonquality protein maize) under projected levels of ozone. Environ. Sci. Pollut. Res. 2014, 21, 2628–2641. [Google Scholar] [CrossRef]
  53. Yendrek, C.R.; Erice, G.; Montes, C.M.; Tomaz, T.; Sorgini, C.A.; Brown, P.J.; McIntyre, L.M.; Leakey, A.D.B.; Ainsworth, E.A. Elevated ozone reduces photosynthetic carbon gain by accelerating leaf senescence of inbred and hybrid maize in a genotype-specific manner. Plant Cell Environ. 2017, 40, 3088–3100. [Google Scholar] [CrossRef]
  54. Yendrek, C.R.; Tomaz, T.; Montes, C.M.; Cao, Y.; Morse, A.M.; Brown, P.J.; McIntyre, L.M.; Leakey, A.D.B.; Ainsworth, E.A. High-throughput phenotyping of maize leaf physiological and biochemical traits using hyperspectral reflectance. Plant Physiol. 2017, 173, 614–626. [Google Scholar] [CrossRef]
  55. Grantz, D.A.; Vu, H.B. O3 sensitivity in a potential C4 bioenergy crop: Sugarcane in California. Crop Sci. 2009, 49, 643–650. [Google Scholar] [CrossRef]
  56. Grantz, D.A.; Vu, H.B.; Tew, T.L.; Veremis, J.C. Sensitivity of gas exchange parameters to ozone in diverse C4 sugarcane hybrids. Crop Sci. 2012, 52, 1270–1280. [Google Scholar] [CrossRef]
  57. Moura, B.B.; Hoshika, Y.; Ribeiro, R.V.; Paoletti, E. Exposure- and flux-based assessment of ozone risk to sugarcane plants. Atmos. Environ. 2018, 176, 252–260. [Google Scholar] [CrossRef]
  58. Bussotti, F. Functional leaf traits, plant communities and acclimationprocesses in relation to oxidative stress in trees: A critical overview. Glob. Chang. Biol. 2008, 14, 2727–2739. [Google Scholar]
  59. Grass Phylogeny Working Group. Phylogeny and subfamilial classification of the grasses (Poaceae). Ann. Mo. Bot. Gard. 2001, 88, 373–457. [Google Scholar] [CrossRef]
  60. Reich, P.B. Quantifying plant response to ozone: A unifying theory. Tree Physiol. 1987, 3, 63–91. [Google Scholar] [CrossRef]
  61. Hoshika, Y.; Katata, G.; Deushi, M.; Watanabe, M.; Koike, T.; Paoletti, E. Ozone-induced stomatal sluggishness changes carbon and water balance of temperate deciduous forests. Sci. Rep. 2015, 5, 09871. [Google Scholar] [CrossRef]
  62. Li, P.; Calatayud, V.; Gao, F.; Uddling, J.; Feng, Z. Differences in ozone sensitivity among woody species are related to leaf morphology and antioxidant levels. Tree Physiol. 2016, 36, 1105–1116. [Google Scholar] [CrossRef]
  63. Feng, Z.; Büker, P.; Pleijel, H.; Emberson, L.; Karlsson, P.E.; Uddling, J. A unifying explanation for variation in ozone sensitivity among woody plants. Glob. Chang. Biol. 2018, 24, 78–84. [Google Scholar] [CrossRef]
  64. Pignon, C.P.; Lundgren, M.R.; Osborne, C.P.; Long, S.P. Bundle sheath chloroplast volume can house sufficient Rubisco to avoid limiting C4 photosynthesis during chilling. J. Exp. Bot. 2019, 70, 357–365. [Google Scholar] [CrossRef]
  65. Zhang, W.-W.; Wang, M.; Wang, A.-Y.; Yin, X.-H.; Feng, Z.-Z.; Hao, G.-Y. Elevated ozone concentration decreases whole-plant hydraulic conductance and disturbs water use regulation in soybean plants. Physiol. Plant. 2018, 163, 183–195. [Google Scholar] [CrossRef]
  66. Hu, J.; Yang, Q.-Y.; Huang, W.; Zhang, S.B.; Hu, H. Effects of temperature on leaf hydraulic architecture of tobacco plants. Planta 2014, 240, 489–496. [Google Scholar] [CrossRef] [PubMed]
  67. Uhl, D.; Mosbrugger, V. Leaf venation density as a climate and environmental proxy: A critical review and new data. Palaeogeogr. Palaeoclimatol. Palaeoecol. 1999, 149, 15–26. [Google Scholar] [CrossRef]
  68. Kouwenberg, L.L.; Kürschner, W.M.; McElwain, J.C. Stomatal frequency change over altitudinal gradients: Prospects for paleoaltimetry. Rev. Mineral. Geochem. 2007, 66, 215–241. [Google Scholar] [CrossRef]
  69. Carins Murphy, M.R.; Jordan, G.J.; Brodribb, T.J. Acclimation to humidity modifies the link between leaf size and the density of veins and stomata. Plant Cell Environ. 2014, 37, 124–131. [Google Scholar] [CrossRef]
  70. Brodribb, T.J.; Jordan, G.J.; Carpenter, R.J. Unified changes in cell size permit coordinated lead evolution. New Phytol. 2013, 199, 559–570. [Google Scholar] [CrossRef]
  71. Leisner, C.P.; Ainsworth, E.A. Quantifying the effects of ozone on plant reproductive growth and development. Glob. Chang. Biol. 2012, 18, 606–616. [Google Scholar] [CrossRef]
  72. Yendrek, C.R.; Leisner, C.P.; Ainsworth, E.A. Chronic ozone exacerbates the reduction in photosynthesis and acceleration of senescence caused by limited N availability in Nicotiana sylvestris. Glob. Chang. Biol. 2013, 19, 3155–3166. [Google Scholar] [CrossRef] [PubMed]
  73. Longstreth, D.J.; Nobel, P.S. Nutrient influences on leaf photosynthesis. Plant Physiol. 1980, 65, 541–543. [Google Scholar] [CrossRef] [PubMed]
  74. Spiller, S.; Terry, N. Limiting factors in photosynthesis: II. iron stress diminishes photochemical capacity by reducing the number of photosynthetic units. Plant Physiol. 1980, 65, 121–125. [Google Scholar] [CrossRef] [PubMed]
  75. Zhao, D.; Oosterhuis, D.M.; Bednarz, C.W. Influence of potassium deficiency on photosynthesis, chlorophyll content, and chloroplast ultrastructure of cotton plants. Photosynthetica 2001, 39, 103–109. [Google Scholar] [CrossRef]
  76. Lewandowski, I.; Kicherer, A. Combustion quality of biomass: Practical relevance and experiments to modify the biomass quality of Miscanthus × giganteus. Eur. J. Agron. 1997, 6, 163–177. [Google Scholar] [CrossRef]
  77. Reich, P.B.; Schoettle, A.W. Effects of ozone and acid rain on white pine (Pinus strobus) seedlings grown in five soils. III Nutrient relations. Can. J. Bot. 1988, 66, 1517–1531. [Google Scholar] [CrossRef]
  78. Oksanen, E.; Riikonen, J.; Kaakinen, S.; Holopainen, T.; Vapaavuori, E. Structural characteristics and chemical composition of birch (Betula pendula) leaves are modified by increasing CO2 and ozone. Glob. Chang. Biol. 2005, 11, 732–748. [Google Scholar] [CrossRef]
  79. Thomas, V.F.D.; Braun, S.; Flückiger, W. Effects of simultaneous ozone exposure and nitrogen loads on carbohydrate concentrations, biomass, growth, and nutrient concentrations of young beech trees (Fagus sylvatica). Environ. Pollut. 2006, 143, 341–354. [Google Scholar] [CrossRef] [PubMed]
  80. Farquhar, G.D.; O’Leary, M.H.; Berry, J.A. On the relationship between carbon isotope discrimination and the intercellular carbon dioxide concentration in leaves. Aust. J. Plant Physiol. 1982, 9, 121–137. [Google Scholar] [CrossRef]
  81. Farquhar, G.D.; Ehleringer, J.R.; Hubick, K.T. Carbon isotope discrimination and photosynthesis. Annu. Rev. Plant Physiol. Plant Mol. Biol. 1989, 40, 503–537. [Google Scholar] [CrossRef]
  82. Farquhar, G.D.; Richards, R.A. Isotopic composition of plant carbon correlates with water-use efficiency of wheat genotypes. Aust. J. Plant Physiol. 1984, 11, 539–552. [Google Scholar] [CrossRef]
  83. Handley, L.L.; Raven, J.A. The use of natural abundance of nitrogen isotopes in plant physiology and ecology. Plant Cell Environ. 1992, 15, 965–985. [Google Scholar] [CrossRef]
  84. Evans, R.D. Physiological mechanisms influencing plant nitrogen isotope composition. Trends Plant Sci. 2001, 6, 121–126. [Google Scholar] [CrossRef]
  85. Robinson, D. δ15N as an integrator of the nitrogen cycle. Trends Ecol. Evol. 2001, 16, 153–162. [Google Scholar] [CrossRef]
  86. Morgan, P.B.; Bernacchi, C.J.; Ort, D.R.; Long, S.P. An in vivo analysis of the effect of season-long open-air elevation of ozone to anticipated 2050 levels on photosynthesis in soybean. Plant Physiol. 2004, 135, 2348–2357. [Google Scholar] [CrossRef]
  87. Naidu, S.L.; Long, S.P. Potential mechanisms of low-temperature tolerance of C4 photosynthesis in Miscanthus × giganteus: An in vivo analysis. Planta 2004, 220, 145–155. [Google Scholar] [CrossRef]
  88. Leakey, A.D.B.; Uribelarrea, M.; Ainsworth, E.A.; Naidu, S.L.; Rogers, A.; Ort, D.R.; Long, S.P. Photosynthesis, productivity, and yield of maize are not affected by open-air elevation of CO2 concentration in the absence of drought. Plant Physiol. 2006, 140, 779–790. [Google Scholar] [CrossRef]
  89. Nardini, A.; Gortan, E.; Ramani, M.; Salleo, S. Heterogeneity of gas exchange rates over the leaf surface in tobacco: An effect of hydraulic architecture? Plant Cell Environ. 2008, 31, 804–812. [Google Scholar] [CrossRef] [PubMed]
  90. Li, S.; Zhang, Y.J.; Sack, L.; Scoffoni, C.; Ishida, A.; Chen, Y.-J.; Cao, K.-F. Heterogeneity and spatial pattering of structure and physiology across the leaf surface in giant leaves of Alocasia macrorrhiza. PLoS ONE 2013, 8, e66016. [Google Scholar]
  91. Bernacchi, C.J.; Morgan, P.B.; Ort, D.R.; Long, S.P. The growth of soybean under free air [CO2] enrichment (FACE) stimulates photosynthesis while decreasing in vivo Rubisco capacity. Planta 2005, 220, 434–446. [Google Scholar] [CrossRef] [PubMed]
  92. Farquhar, G.D.; von Caemmere, S.; Berry, J.A. A biochemical model of photosynthetic CO2 fixation in C3 species. Planta 1980, 149, 178–190. [Google Scholar] [CrossRef]
  93. Von Caemmerer, S. Biochemcial models of leaf photosynthesis; CSIRO Publishing: Collingwood, Australia, 2000. [Google Scholar]
  94. Markelz, R.J.C.; Strellner, R.S.; Leakey, A.D.B. Impairment of C4 photosynthesis by drought is exacerbated by limiting nitrogen and ameliorated by elevated [CO2] in maize. J. Exp. Bot. 2011, 62, 3235–3246. [Google Scholar] [CrossRef]
  95. Twidwell, E.K.; Johnson, K.D.; Patterson, J.A.; Cherney, J.H.; Bracker, C.E. Degradation of switchgrass anatomical tissue by rumen microorganisms. Crop Sci. 1991, 30, 1321–1328. [Google Scholar] [CrossRef]
  96. Christin, P.-A.; Osborne, C.P.; Chatelet, D.S.; Columbus, J.T.; Besnard, G.; Hodkinson, T.R.; Garrison, L.M.; Vorontsove, M.S.; Edwards, E.J. Anatomical enablers and the evolution of C4 photosynthesis in grasses. Proc. Natl. Acad. Sci. USA 2013, 110, 1381–1386. [Google Scholar] [CrossRef]
  97. Sack, L.; Cowan, P.D.; Jaikumar, N.; Holbrook, N.M. The hydrology of leaves: Co-ordination of structure and function in temperate woody species. Plant Cell Environ. 2003, 26, 1343–1356. [Google Scholar] [CrossRef]
  98. Maillard, A.; Etienne, P.; Diquélou, S.; Trouverie, J.; Billard, V.; Yvin, J.C.; Ourry, A. Nutrient deficiencies modify the ionomic composition of plant tissues: A focus on cross-talk between molybdenum and other nutrients in Brassica napus. J. Exp. Bot. 2016, 67, 5631–5641. [Google Scholar] [CrossRef] [PubMed]
  99. Warton, D.I.; Wright, I.J.; Falster, D.S.; Westoby, M. Bivariate line-fitting methods for allometry. Biol. Rev. 2006, 81, 259–291. [Google Scholar] [CrossRef] [PubMed]
Figure 1. Average values of: net CO2 assimilation rate (A) (a); stomatal conductance (gs) (b); intercellular CO2 concentration (Ci) (c); and instantaneous water use efficiency (iWUE) (d) of ambient and elevated O3 concentration treated switchgrass leaf measured on 25 July (DOY 206) and 13 August (DOY 225) in 2018. Error bars show standard errors (n = 3). Significant differences between ambient and elevated O3 are indicated by different letters.
Plants 08 00085 g001
Figure 2. PSII maximum efficiency (Fv’/Fm’) (a); quantum yield of PSII (ΦPSII) (b); electron transport rate (ETR) (c); and coefficient of photochemical quenching (qP) (d) in ambient and elevated O3 concentration treated switchgrass leaf measured on DOY 206 and DOY 225 in 2018. Error bars show standard errors (n = 3). Significant differences between ambient and elevated O3 are indicated by different letters.
Plants 08 00085 g002
Figure 3. Maximum carboxylation capacity of PEPC (Vpmax) (a); and CO2-saturated photosynthetic rate (Vmax) (b) of switchgrass grown at ambient and elevated O3 concentrations measured on DOY 206 in 2018. Error bars show standard errors (n = 3). Significant differences between ambient and elevated O3 are indicated by different letters.
Plants 08 00085 g003
Figure 4. Relationship between stomatal conductance (gs) and A H s C s for switchgrass grown under ambient and elevated O3 concentrations measured on DOY 206 and DOY 225 in 2018, where A is net CO2 assimilation rate (µmol (CO2) m−2 s−1), Hs is relative humidity (Pa (air) Pa (Saturated)−1) and Cs is CO2 concentration (Pa (CO2) Pa (air)−1) at the leaf surface. The data were fitted by linear regressions.
Plants 08 00085 g004
Figure 5. Leaf dark respiration (a); and maximum dark-adapted quantum yield of photosystem II (Fv/Fm) (b) in ambient and elevated O3 concentration treated switchgrass leaf measured on DOY 206 in 2018. Error bars show standard errors (n = 3). Significant differences between ambient and elevated O3 are indicated by different letters.
Plants 08 00085 g005
Figure 6. Relationship between leaf vein length per area and stomatal density (a); relationship between leaf vein length per area and guard cell length (b); and relationship between leaf vein length per area and stomatal pore area index (c). The data in (b,c) were fitted by linear regressions.
Plants 08 00085 g006
Figure 7. Daily maximum and minimum air temperature (a); averaged light intensity (b); precipitation (c); averaged daily relative humidity (d); and O3 concentration (e) during growing season in 2018 measured by an on-site weather station at the FACE facility in Champaign, IL.
Plants 08 00085 g007
Table 1. Leaf structural traits of switchgrass exposed to ambient and elevated O3 in 2018. Data are presented as means ± SE (n = 3). Significant differences between ambient and elevated O3 are indicated by different letters.
Ambient O3Elevated O3
Bundle sheath density (number mm−1)5.63 ± 0.13 (a)5.70 ± 0.11 (a)
Distance between secondary vein (mm)1.08 ± 0.056 (a)0.97 ± 0.025 (a)
Leaf thickness (µm)203.3 ± 4.99 (a)195.9 ± 5.81 (a)
Interveinal distance (IVD, µm)175.2 ± 3.56 (a)173.1 ± 2.65 (a)
Conduit diameter (µm)32.5 ± 1.09 (a)31.6 ± 1.22 (a)
Conduit size (µm2)781.3 ± 43.3 (a)723.8 ± 50.5 (a)
Out bundle sheath size (µm2)20885.2 ± 891.6 (a)20315.1 ± 945.2 (a)
Inner bundle sheath size (µm2)12443.0 ± 515.7 (a)11928.3 ± 625.7 (a)
Vein size (µm2)4263.3 ± 248.1 (a)4034.5 ± 289.0 (a)
Colorless cell size (µm2)336.2 ± 21.4 (a)364.2 ± 33.1 (a)
Upper epidermis cell size (µm2)141.0 ± 5.52 (a)143.9 ± 6.87 (a)
Lower epidermis cell size (µm2)205.9 ± 11.4 (a)200.9 ± 14.0 (a)
Motor cell size (µm2)767.9 ± 39.6 (a)794.9 ± 50.7 (a)
Sclerenchyma size (µm2)755.4 ± 43.2 (a)657.5 ± 50.4 (a)
Stomatal density (mm−2)125.3 ± 4.55 (a)121.1 ± 5.42 (a)
Guard cell length (µm)35.2 ± 1.34 (a)35.3 ± 1.51 (a)
Stomatal pore area index (SPI, ×10−2)0.15 ± 0.0081 (a)0.15 ± 0.011 (a)
Vein density (mm mm−2)5.85 ± 0.092 (a)5.68 ± 0.10 (a)
Table 2. Leaf and stem biomass, N content and C:N of switchgrass exposed to ambient and elevated O3 in 2018. Data are presented as means ± SE (n = 3). Significant differences between ambient and elevated O3 are indicated by different letters.
Ambient O3Elevated O3
Leaf area (cm2 plant−1)5624.5 ± 659.6 (a)6681.1 ± 875.3 (a)
Leaf biomass (g plant−1)36.4 ± 4.28 (a)44.1 ± 4.58 (a)
Leaf mass per area (LMA, g m−2)64.8 ± 1.12 (a)69.4 ± 2.60 (a)
Tiller number31.0 ± 2.96 (a)32.4 ± 2.45 (a)
Tiller biomass (g plant−1)75.2 ± 8.89 (a)97.0 ± 13.12 (a)
Leaf area per tiller (cm2 branch−1)178.8 ± 13.99 (a)198.6 ± 13.37 (a)
Leaf mass per tiller (g plant−1)1.15 ± 0.086 (a)1.36 ± 0.054 (a)
Average tiller mass (g)2.39 ± 0.20 (a)2.87 ± 0.21 (a)
Leaf N (%)2.53 ± 0.045 (a)2.49 ± 0.035 (a)
Leaf C:N17.8 ± 0.29 (a)18.1 ± 0.24 (a)
Stem N (%)1.36 ± 0.057 (a)1.39 ± 0.049 (a)
Stem C:N33.0 ± 1.49 (a)32.2 ± 1.23 (a)
Table 3. Leaf nutrient composition, stable carbon (δ13C) and nitrogen (δ15N) isotope composition of switchgrass exposed to ambient and elevated O3 in 2018. Data are presented as means ± SE (n = 3). Significant differences between ambient and elevated O3 are indicated by different letters.
Ambient O3Elevated O3
Mg (mg kg−1)5079.1 ± 229.8 (a)5617.5 ± 285.2 (a)
P (mg kg−1)2466.8 ± 65.9 (a)2732.1 ± 146.9 (a)
S (mg kg−1)2326.0 ± 77.0 (a)2316.1 ± 86.1 (a)
K (mg kg−1)18695.6 ± 737.5 (a)16245.0 ± 688.3 (b)
Ca (mg kg−1)5994.7 ± 387.8 (a)7590.4 ± 685.4 (a)
B (mg kg−1)3.43 ± 0.10 (a)3.71 ± 0.086 (a)
Mn (mg kg−1)65.1 ± 10.7 (a)52.5 ± 9.91 (a)
Fe (mg kg−1)459.7 ± 61.1 (a)457.2 ± 43.2 (a)
Ni (mg kg-1)3.18 ± 0.26 (a)2.80 ± 0.23 (a)
Cu (mg kg−1)9.78 ± 0.43 (a)9.07 ± 0.33 (a)
Zn (mg kg−1)27.6 ± 2.18 (a)27.4 ± 2.21 (a)
Mo (mg kg−1)1.17 ± 0.069 (a)1.27 ± 0.24 (a)
Na (mg kg−1)106.3 ± 11.5 (a)142.7 ± 23.5 (a)
V (mg kg−1)0.36 ± 0.021 (a)0.36 ± 0.014 (a)
Co (mg kg−1)0.13 ± 0.012 (a)0.11 ± 0.0080 (a)
δ13C (‰)−12.22 ± 0.060 (a)−12.49 ± 0.080 (b)
δ15N (‰)4.04 ± 0.46 (a)5.35 ± 0.78 (a)

