Assessment of Ozone Sensitivity in Three Wheat Cultivars Using Ethylenediurea

Abstract
:1. Introduction
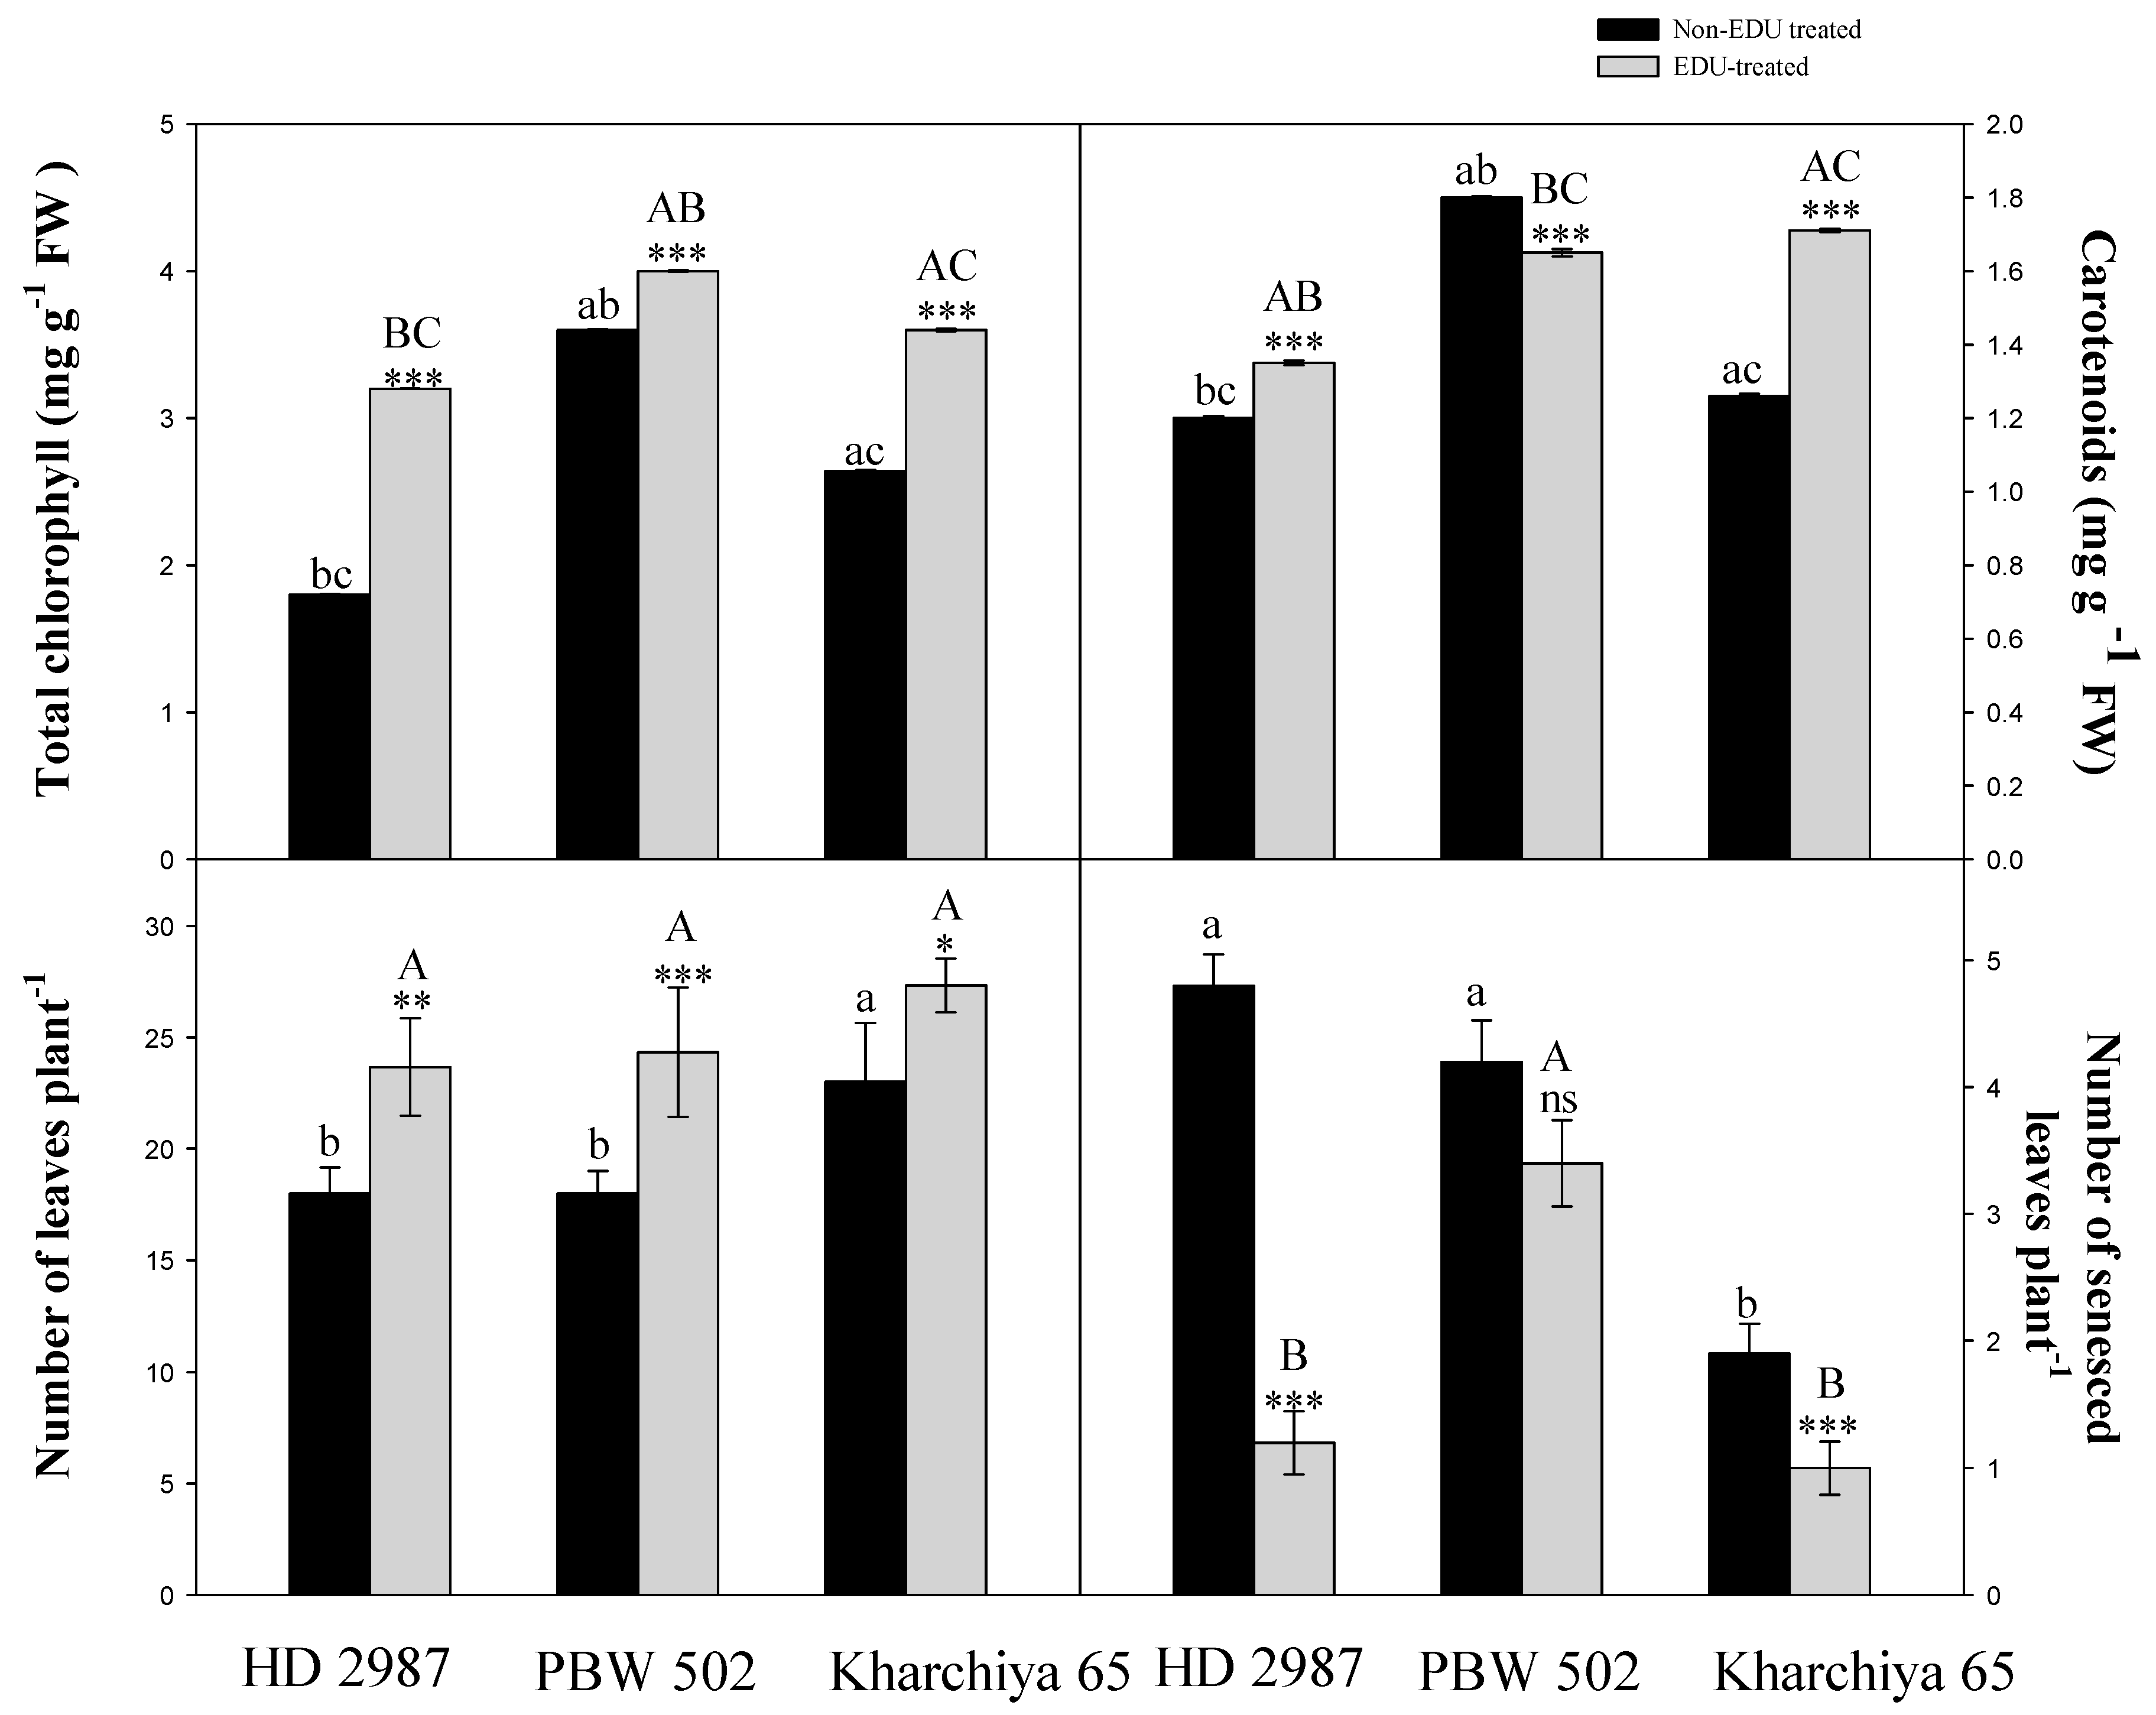
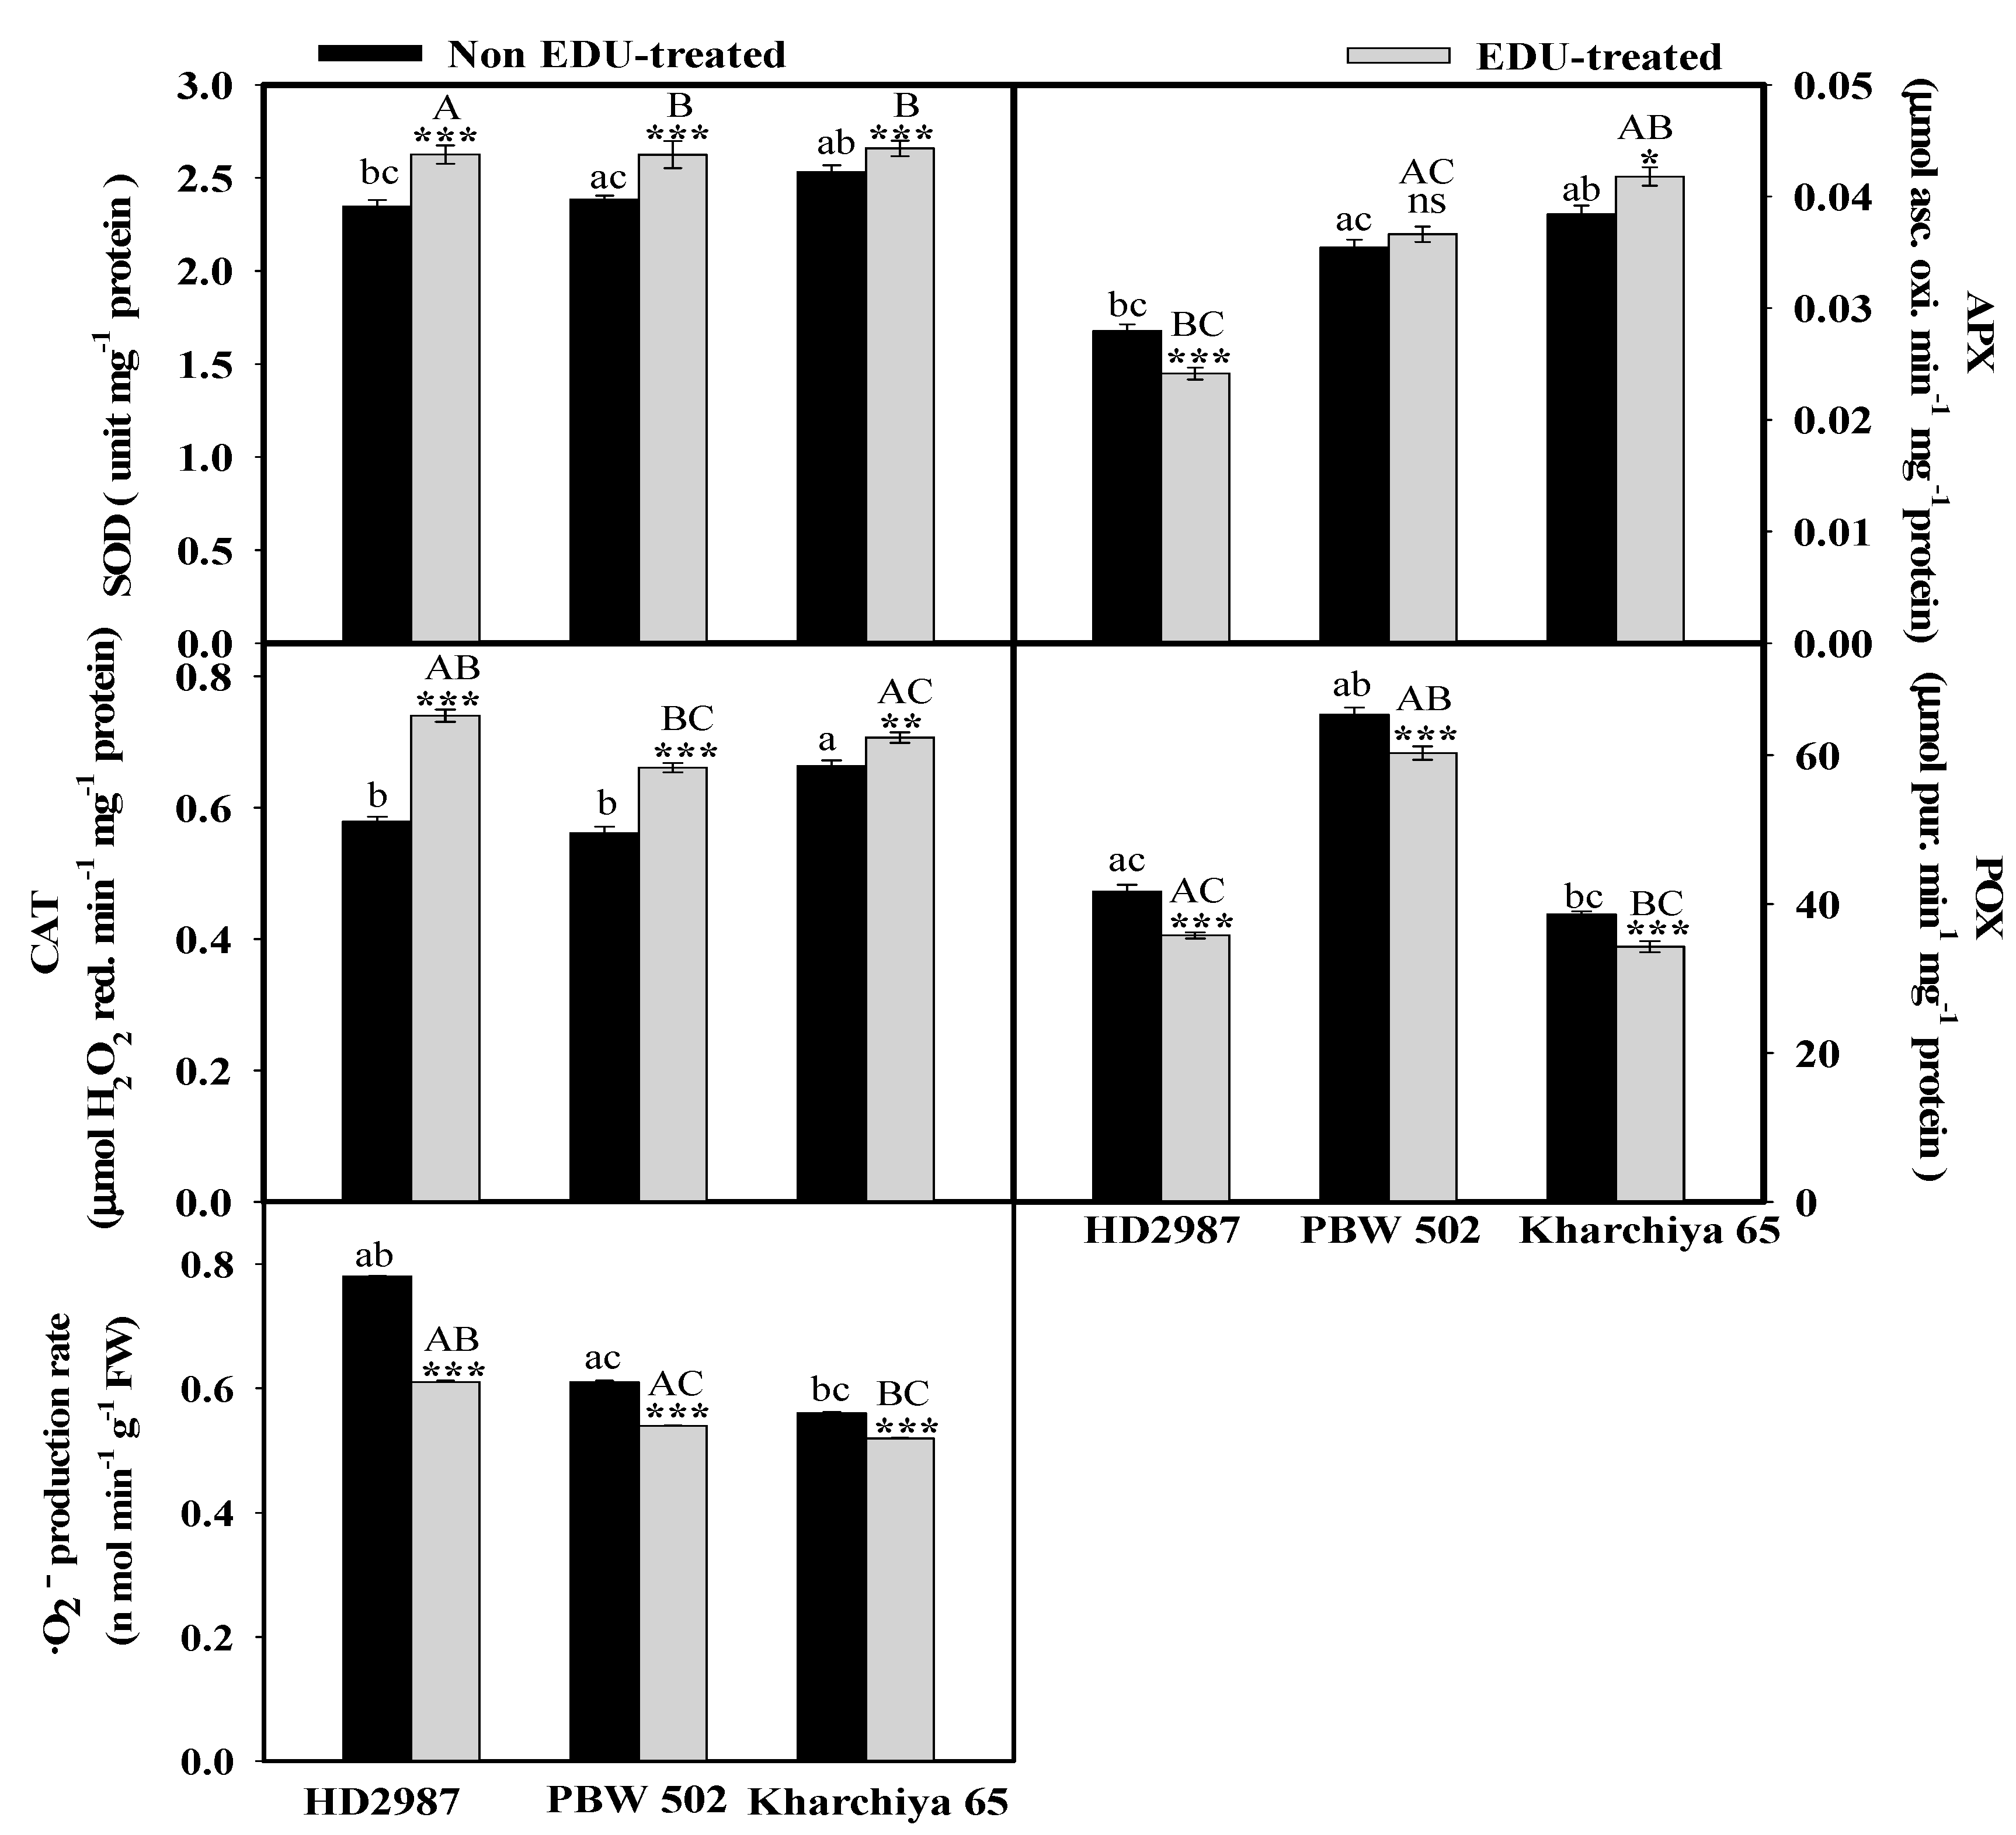
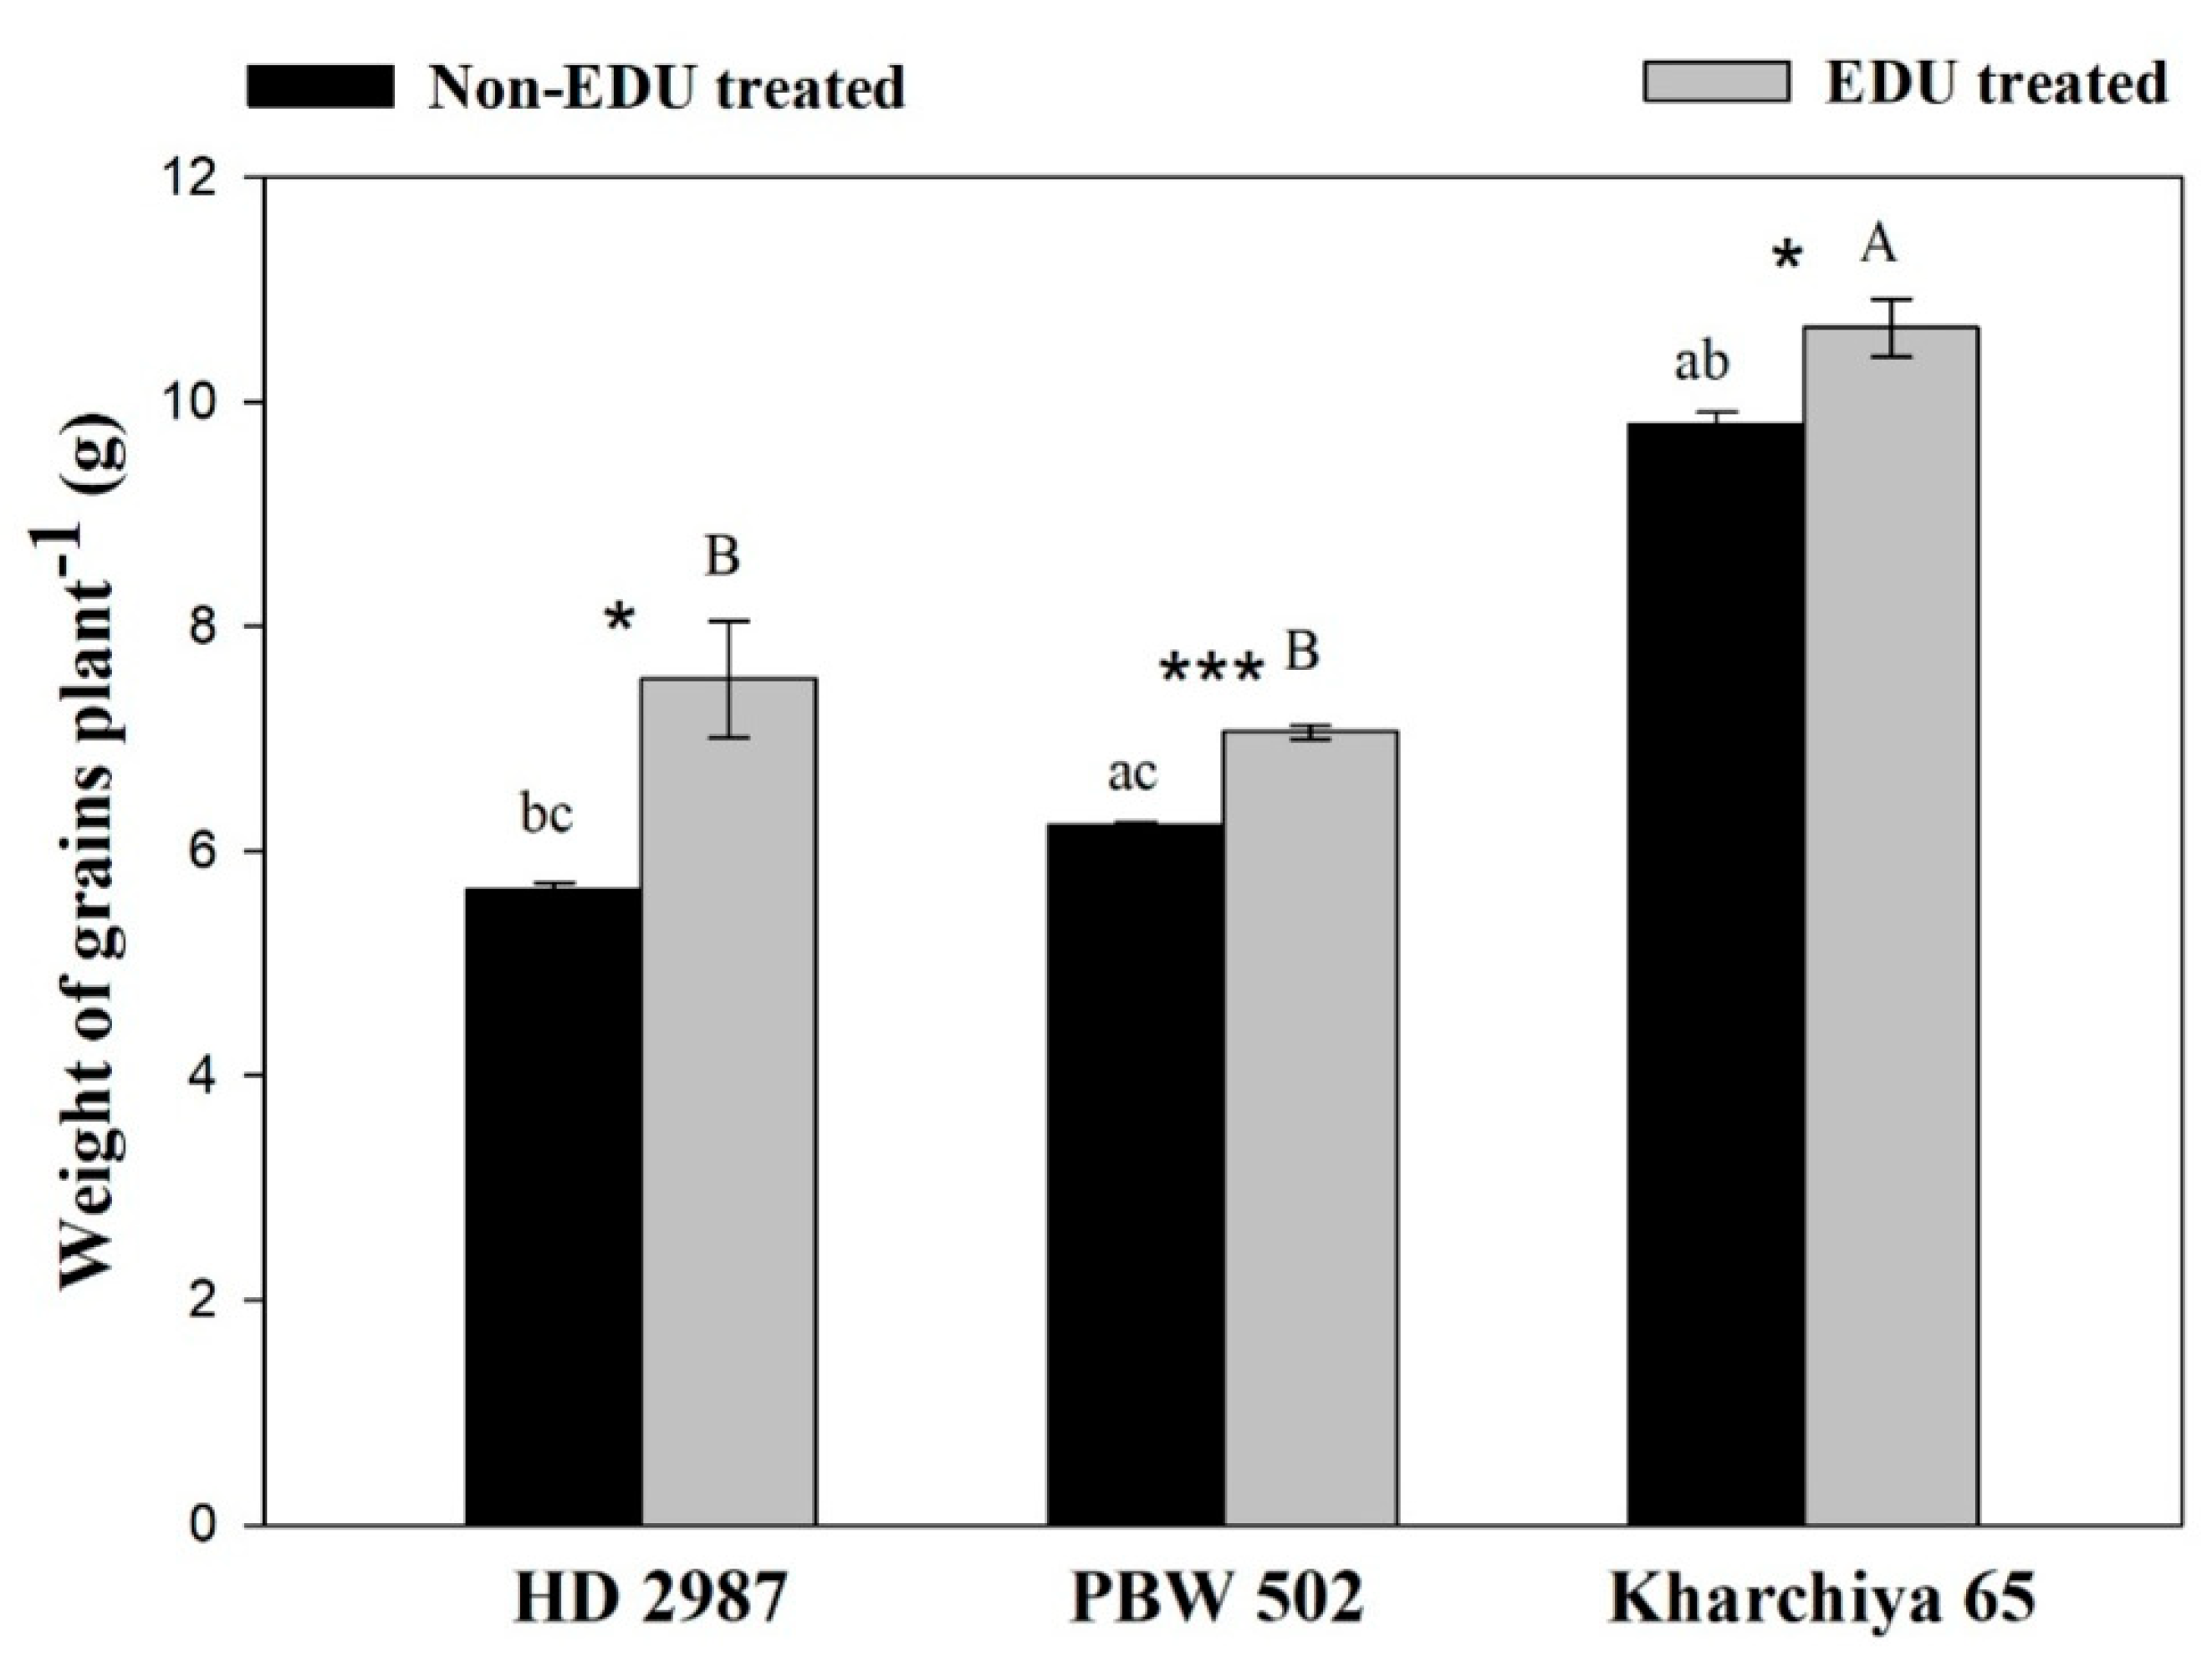
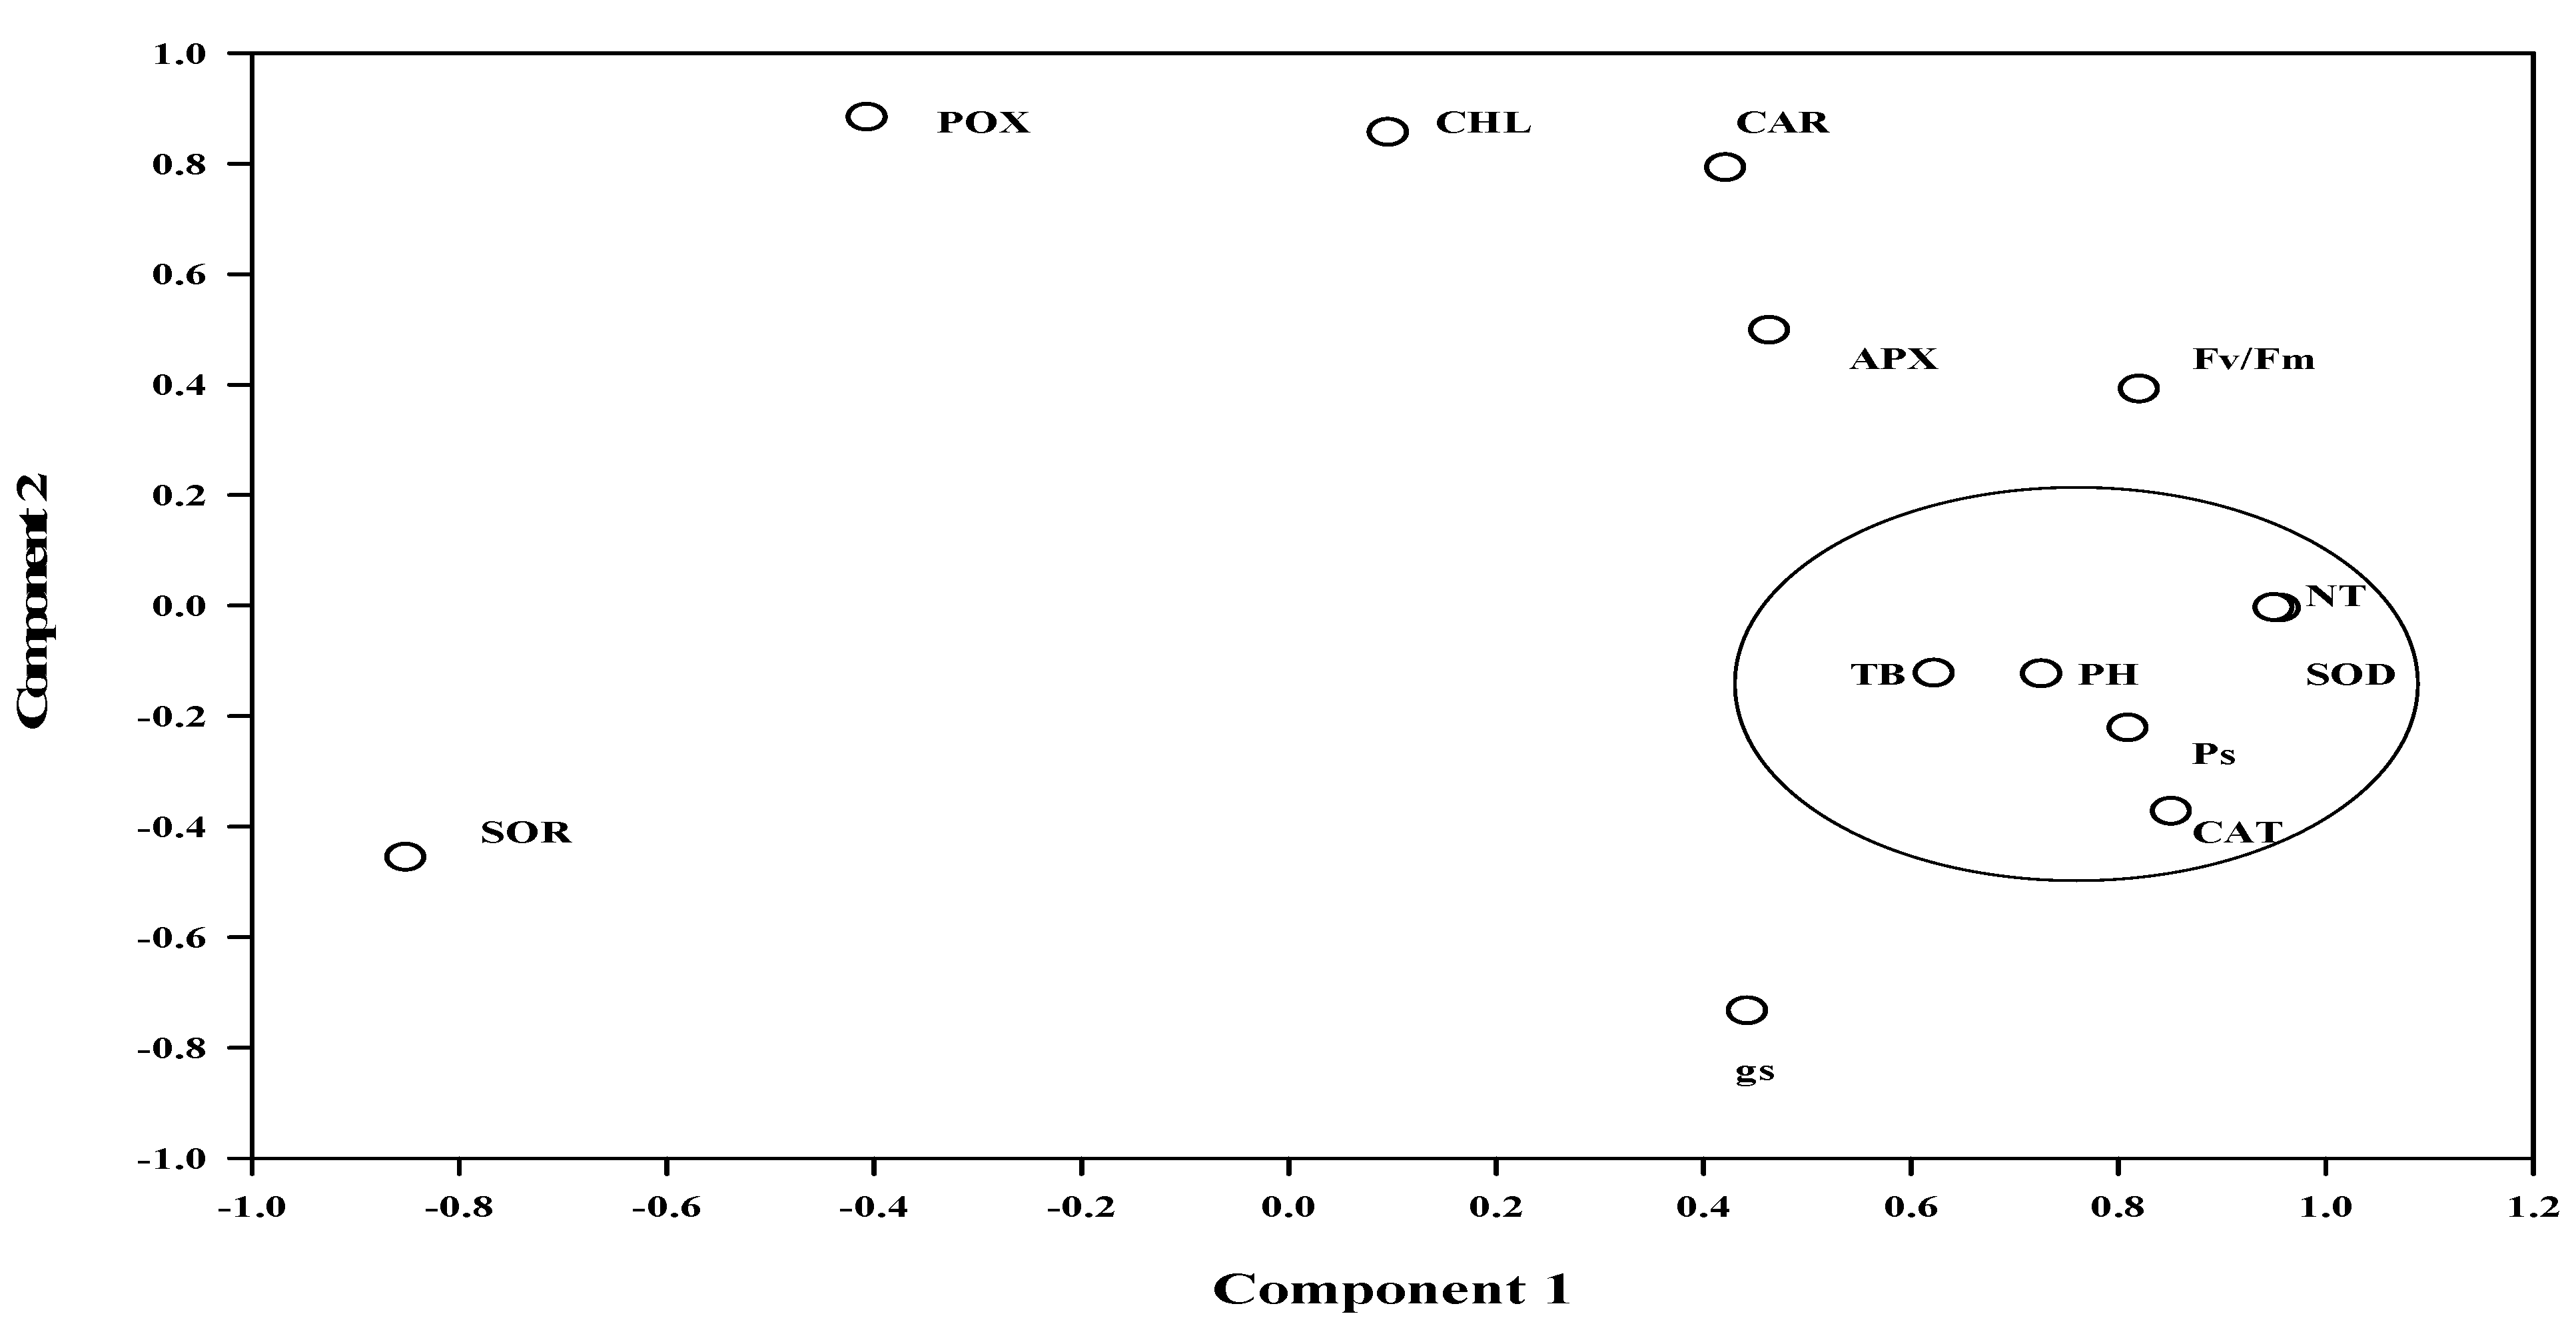
2. Results
3. Discussion
4. Materials and Methods
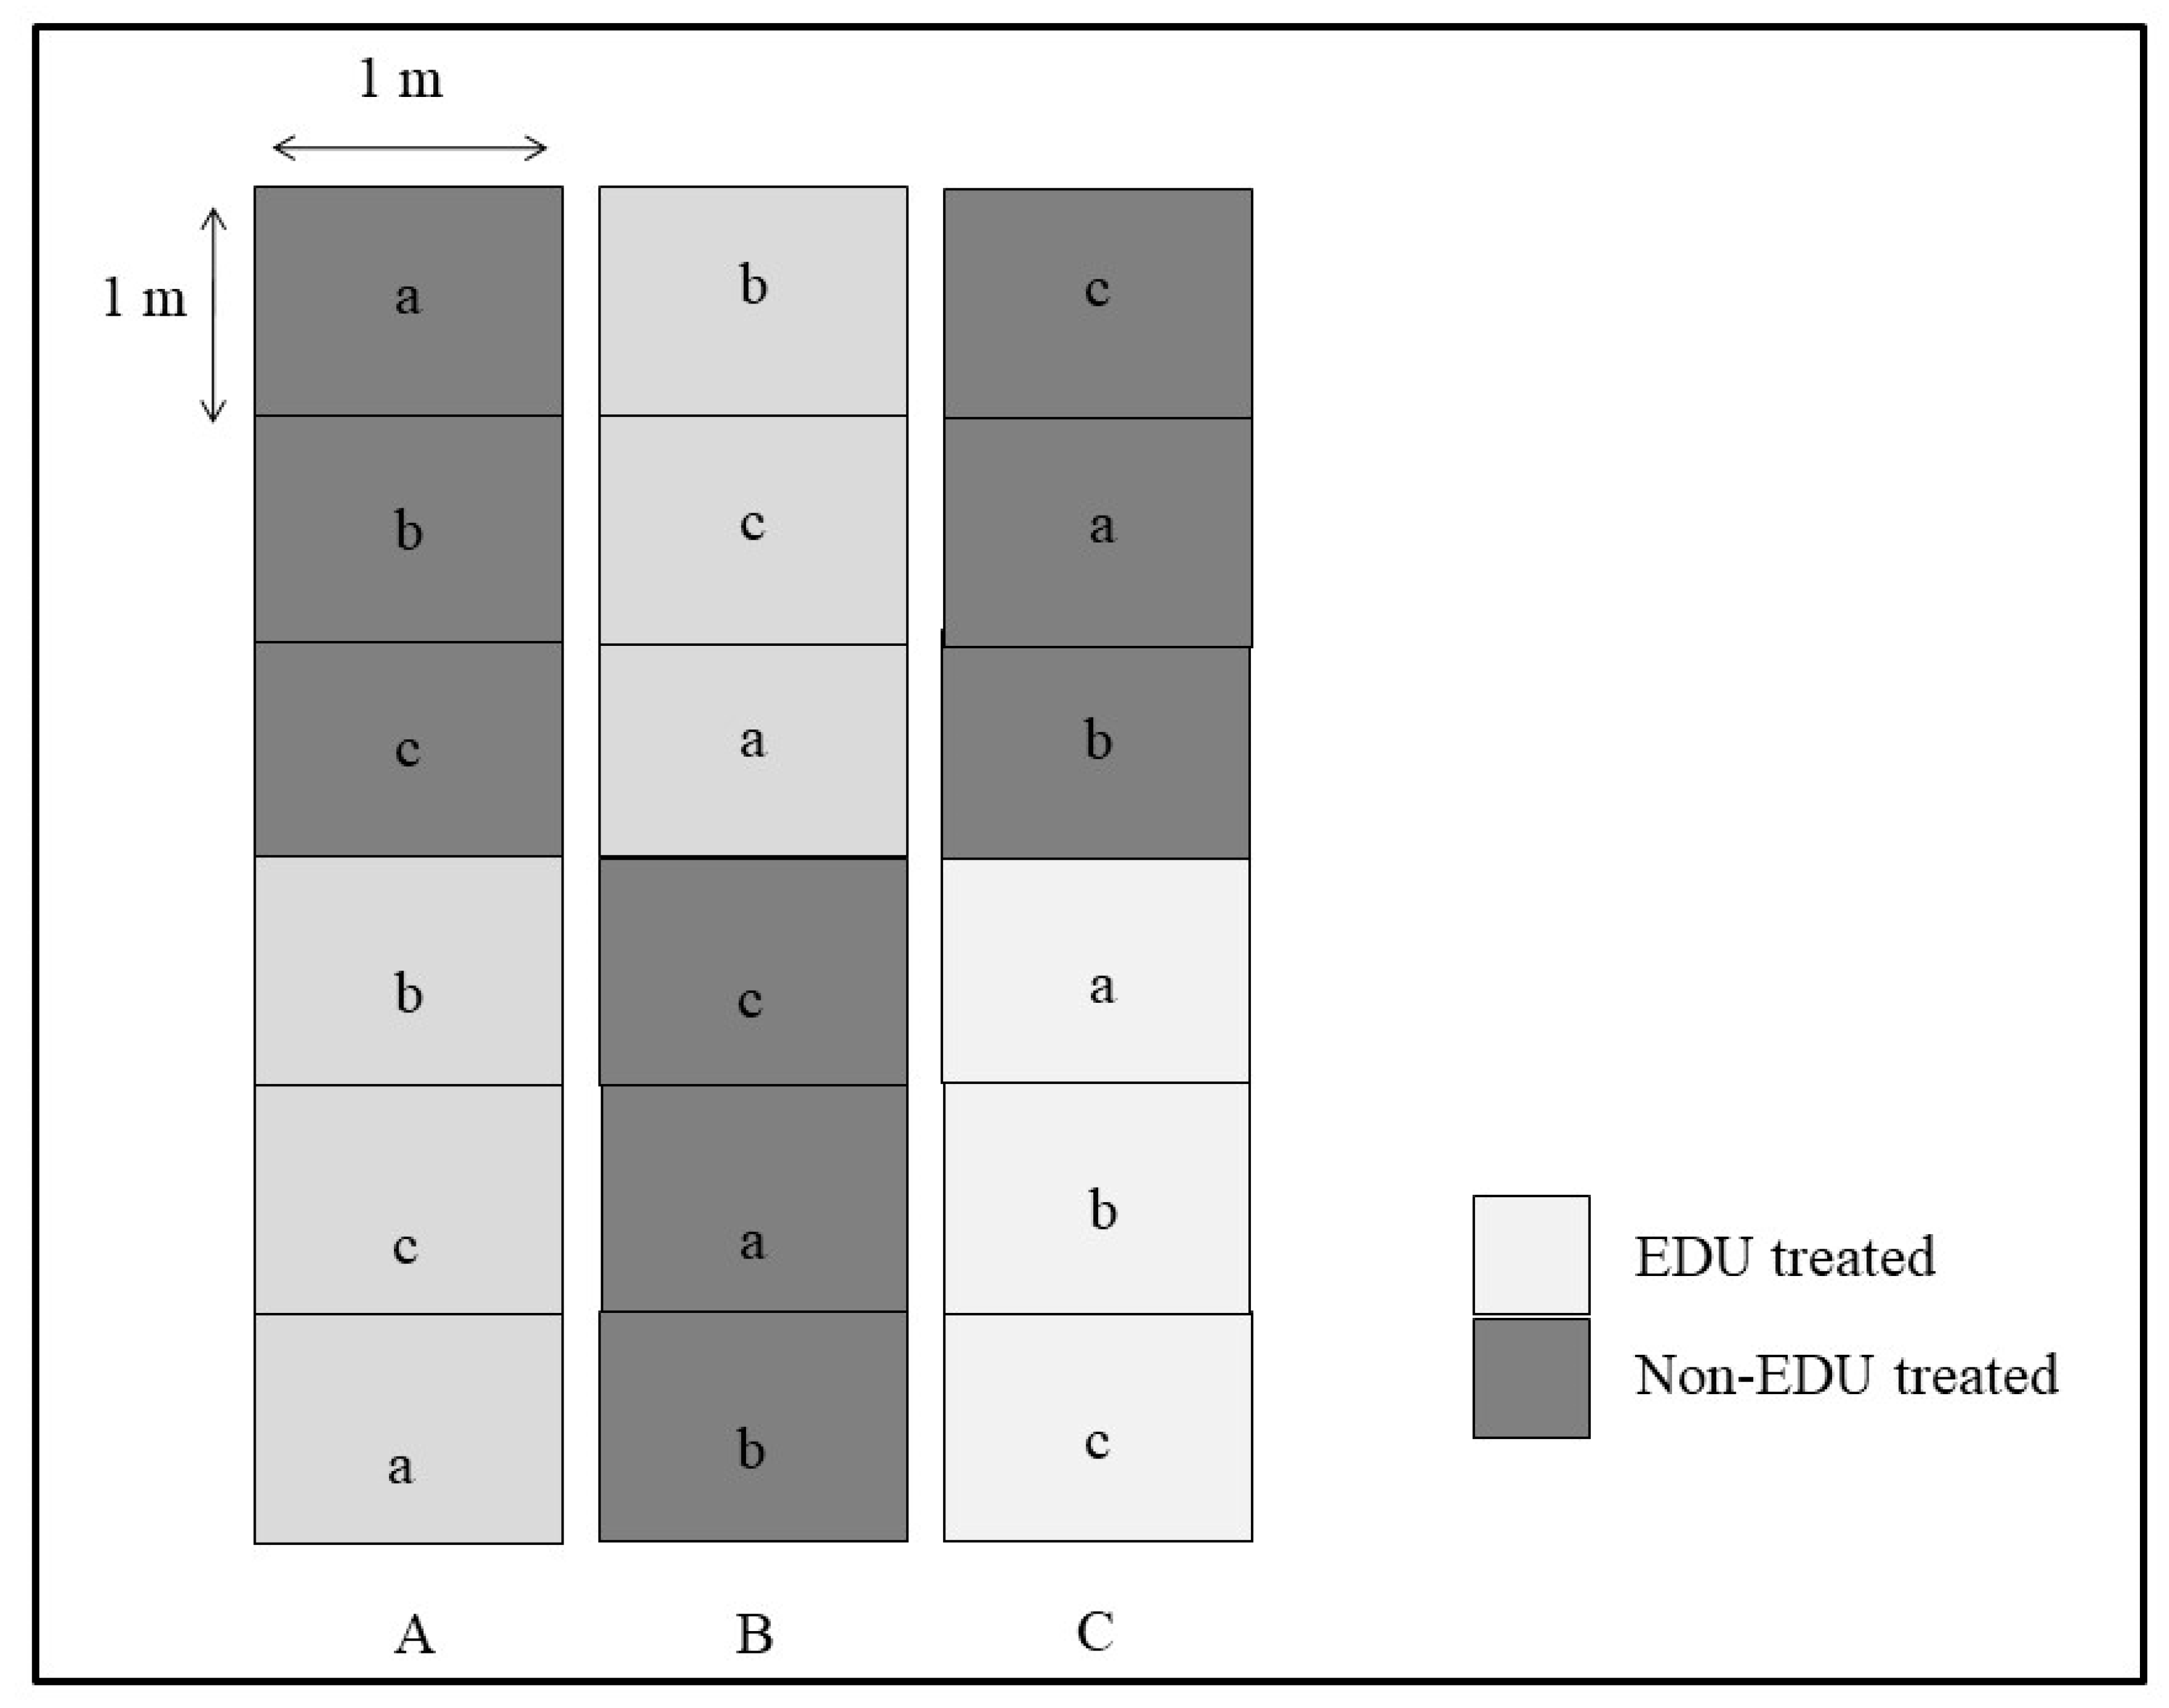
4.1. Experimental Site and Plant
4.2. Raising of Plants and EDU Treatment
4.3. Meteorological Data
4.4. Ozone Monitoring
4.5. Growth Parameters and Total Biomass
4.6. Physiological Parameters
4.7. Biochemical Parameters
4.8. Yield
4.9. Statistical Analyses
5. Conclusions
Author Contributions
Funding
Acknowledgments
Conflicts of Interest
References
- Ainsworth, E.A. Understanding and improving global crop response to ozone pollution. Plant J. 2017, 90, 886–897. [Google Scholar] [CrossRef] [PubMed]
- FAO (Food and Agricultural Organisation of the United Nations). How to Feed the World in 2050. 2009. Available online: http:// www.fao.org/wsfs/docs/expertpaper (accessed on 13 December 2018).
- Monks, P.S.; Archibald, A.T.; Colette, A.; Cooper, O.; Coyle, M.; Derwent, R.; Fowler, D.; Granier, C.; Law, K.S.; Mills, G.E.; et al. Tropospheric ozone and its precursors from the urban to the global scale from air quality to short-lived climate forcer. Atmos. Chem. Phys. 2015, 15, 8889–8973. [Google Scholar] [CrossRef] [Green Version]
- Van Dingenen, R.; Dentener, F.J.; Raes, F.; Krol, M.C.; Emberson, L.; Cofala, J. The global impact of ozone on agricultural crop yields under current and future air quality legislation. Atmos. Environ. 2009, 43, 604–618. [Google Scholar] [CrossRef]
- Avnery, S.; Mauzerall, D.L.; Liu, J.; Horowitz, L.W. Global crop yield reductions due to surface ozone exposure: 2. Year 2030 potential crop production losses and economic damage under two scenarios of O3 pollution. Atmos. Environ. 2011, 45, 2297–2309. [Google Scholar] [CrossRef]
- Tai, A.P.; Martin, M.V.; Heald, C.L. Threat to future global food security from climate change and ozone air pollution. Nat. Clim. Chang. 2014, 4, 817. [Google Scholar] [CrossRef]
- Lal, S.; Venkataramani, S.; Naja, M.; Kuniyal, J.C.; Mandal, T.K.; Bhuyan, P.K.; Kumari, K.M.; Tripathi, S.N.; Sarkar, U.; Das, T.; et al. Loss of crop yields in India due to surface ozone: An estimation based on a network of observations. Environ. Sci. Pollut. Res. 2017, 24, 20972–20981. [Google Scholar] [CrossRef] [PubMed]
- Carnahan, J.E.; Jenner, E.L.; Wat, E.K.W. Prevention of ozone injury to plants by a new protectant chemical. Phytopathology 1978, 68, 1229. [Google Scholar] [CrossRef]
- Singh, A.A.; Fatima, A.; Mishra, A.K.; Chaudhary, N.; Mukherjee, A.; Agrawal, M.; Agrawal, S.B. Assessment of ozone toxicity among 14 Indian wheat cultivars under field conditions: Growth and productivity. Environ. Monit. Assess. 2018, 190, 190. [Google Scholar] [CrossRef] [PubMed]
- Feng, Z.; Jiang, L.; Calatayud, V.; Dai, L.; Paoletti, E. Intraspecific variation in sensitivity of winter wheat (Triticum aestivum L.) to ambient ozone in northern China as assessed by ethylenediurea (EDU). Environ. Sci. Pollut. Res. 2018, 25, 29208–29218. [Google Scholar] [CrossRef]
- Wahid, A.; Ahmad, S.S.; Zhao, Y.; Bell, J.N.B. Evaluation of ambient air pollution effects on three cultivars of sesame (Sesamum indicum L.) by using ethylenediurea. Pak. J. Bot. 2012, 44, 99–110. [Google Scholar]
- Singh, S.; Agrawal, M.; Agrawal, S.B.; Emberson, L.; Bueker, P. Use of ethylenediurea for assessing the impact of ozone on mung bean plants at a rural site in a dry tropical region of India. Int. J. Environ. Waste Manag. 2010, 5, 125–135. [Google Scholar] [CrossRef]
- Pandey, A.K.; Majumder, B.; Keski-Saari, S.; Kontunen-Soppela, S.; Pandey, V.; Oksanen, E. High Variation in Resource Allocation Strategies among 11 Indian Wheat (Triticum aestivum) Cultivars Growing in High Ozone Environment. Climate 2019, 7, 23. [Google Scholar] [CrossRef]
- FAO (Food and Agricultural Organisation of the United States). World Food Situation: FAO Cereal Supply and Demand Brief. 2016. Available online: http://www.fao.org/worldfood situation (accessed on 3 December 2018).
- Feng, Z.; Wang, L.; Pleijel, H.; Zhu, J.; Kobayashi, K. Differential effects of ozone on photosynthesis of winter wheat among cultivars depend on antioxidative enzymes rather than stomatal conductance. Sci. Total Environ. 2016, 572, 404–411. [Google Scholar] [CrossRef] [PubMed] [Green Version]
- Yuan, X.; Calatayud, V.; Jiang, L.; Manning, W.J.; Hayes, F.; Tian, Y.; Feng, Z. Assessing the effects of ambient ozone in China on snap bean genotypes by using ethylenediurea (EDU). Environ. Pollut. 2015, 205, 199–208. [Google Scholar] [CrossRef] [Green Version]
- Pandey, A.K.; Majumder, B.; Keski-Saari, S.; Kontunen-Soppela, S.; Mishra, A.; Sahu, N.; Pandey, V.; Oksanen, E. Searching for common responsive parameters for ozone tolerance in 18 rice cultivars in India: Results from ethylenediurea studies. Sci. Tot Environ. 2015, 532, 230–238. [Google Scholar] [CrossRef] [PubMed]
- Gupta, S.K.; Sharma, M.; Majumder, B.; Maurya, V.K.; Lohani, M.; Deeba, F.; Pandey, V. Impact of Ethylene diurea (EDU) on growth, yield and proteome of two winter wheat varieties under high ambient ozone phytotoxicity. Chemosphere 2018, 196, 161–173. [Google Scholar] [CrossRef] [PubMed]
- Tiwari, S.; Agrawal, M.; Manning, W.J. Assessing the impact of ambient ozone on growth and productivity of two cultivars of wheat in India using three rates of application of ethylenediurea (EDU). Environ. Pollut. 2005, 138, 153–160. [Google Scholar] [CrossRef] [PubMed]
- Agrawal, S.B.; Singh, A.; Rathore, D. Role of ethylene diurea (EDU) in assessing impact of ozone on Vigna radiata L. plants in a suburban area of Allahabad (India). Chemosphere 2005, 61, 218–228. [Google Scholar] [CrossRef] [PubMed]
- Pandey, A.K.; Majumder, B.; Keski-Saari, S.; Kontunen-Soppela, S.; Pandey, V.; Oksanen, E. Differences in responses of two mustard cultivars to ethylenediurea (EDU) at high ambient ozone concentrations in India. Agric. Ecosyst. Environ. 2014, 196, 158–166. [Google Scholar] [CrossRef]
- Rai, R.; Agrawal, M.; Choudhary, K.K.; Agrawal, S.B.; Emberson, L.; Büker, P. Application of ethylene diurea (EDU) in assessing the response of a tropical soybean cultivar to ambient O3: Nitrogen metabolism, antioxidants, reproductive development and yield. Ecotox. Environ. Saf. 2015, 112, 29–38. [Google Scholar] [CrossRef]
- Feng, Z.; Wang, S.; Szantoi, Z.; Chen, S.; Wang, X. Protection of plants from ambient ozone by applications of ethylenediurea (EDU): A meta-analytic review. Environ. Pollut. 2010, 158, 3236–3242. [Google Scholar] [CrossRef] [PubMed] [Green Version]
- Agathokleous, E.; Saitanis, C.J.; Stamatelopoulos, D.; Mouzaki-Paxinou, A.C.; Paoletti, E.; Manning, W.J. Olive oil for dressing plant leaves so as to avoid O3 injury. Water Air Soil Pollut. 2016, 227, 282. [Google Scholar] [CrossRef]
- Agathokleous, E.; Mouzaki-Paxinou, A.C.; Saitanis, C.J.; Paoletti, E.; Manning, W.J. The first toxicological study of the antiozonant and research tool ethylene diurea (EDU) using a Lemna minor L. bioassay: Hints to its mode of action. Environ. Pollut. 2016, 213, 996–1006. [Google Scholar] [CrossRef]
- Zheng, Y.; Shimizu, H.; Barnes, J.D. Limitations to CO2 assimilation in ozone-exposed leaves of Plantago major. New Phytol. 2002, 155, 67–78. [Google Scholar] [CrossRef]
- Tiwari, S.; Agrawal, M. Effectiveness of different EDU concentrations in ameliorating ozone stress in carrot plants. Ecotox. Environ. Saf. 2010, 73, 1018–1027. [Google Scholar] [CrossRef]
- Singh, A.A.; Chaurasia, M.; Gupta, V.; Agrawal, M.; Agrawal, S.B. Responses of Zea mays L. cultivars ‘Buland’ and ‘Prakash’ to an antiozonant ethylene diurea grown under ambient and elevated levels of ozone. Acta Physiol. Plant. 2018, 40, 1–15. [Google Scholar] [CrossRef]
- Paoletti, E.; Contran, N.; Manning, W.J.; Castagna, A.; Ranieri, A.; Tagliaferro, F. Protection of ash (Fraxinus excelsior) trees from ozone injury by ethylenediurea (EDU): Roles of biochemical changes and decreased stomatal conductance in enhancement of growth. Environ. Pollut. 2008, 155, 464–472. [Google Scholar] [CrossRef] [PubMed]
- Tiwari, S. Ethylenediurea as a potential tool in evaluating ozone phytotoxicity: A review study on physiological, biochemical and morphological responses of plants. Environ. Sci. Pollut. Res. 2017, 24, 14019–14039. [Google Scholar] [CrossRef]
- Paoletti, E.; Contran, N.; Manning, W.J.; Ferrara, A.M. Use of the antiozonant ethylenediurea (EDU) in Italy: Verification of the effects of ambient ozone on crop plants and trees and investigation of EDU’s mode of action. Environ. Pollut. 2009, 157, 1453–1460. [Google Scholar] [CrossRef]
- Singh, S.; Agrawal, S.B.; Agrawal, M. Differential protection of ethylenediurea (EDU) against ambient ozone for five cultivars of tropical wheat. Environ. Pollut. 2009, 157, 2359–2367. [Google Scholar] [CrossRef] [PubMed]
- Singh, S.; Singh, P.; Agrawal, S.B.; Agrawal, M. Use of Ethylenediurea (EDU) in identifying indicator cultivars of Indian clover against ambient ozone. Ecotox. Environ. Saf. 2018, 147, 1046–1055. [Google Scholar] [CrossRef]
- Paoletti, E.; De Marco, A.; Beddows, D.C.; Harrison, R.M.; Manning, W.J. Ozone levels in European and USA cities are increasing more than at rural sites, while peak values are decreasing. Environ. Pollut. 2014, 192, 295–299. [Google Scholar] [CrossRef]
- Manning, W.J.; Paoletti, E.; Sandermann, H., Jr.; Ernst, D. Ethylenediurea (EDU): A research tool for assessment and verification of the effects of ground level ozone on plants under natural conditions. Environ. Pollut. 2011, 159, 3283–3293. [Google Scholar] [CrossRef] [PubMed]
- Szantoi, Z.; Chappelka, A.H.; Muntifering, R.B.; Somers, G.L. Use of ethylenediurea (EDU) to ameliorate ozone effects on purple coneflower (Echinacea purpurea). Environ. Pollut. 2007, 150, 200–208. [Google Scholar] [CrossRef] [PubMed]
- Biswas, D.K.; Xu, H.; Li, Y.G.; Liu, M.Z.; Chen, Y.H.; Sun, J.Z.; Jiang, G.M. Assessing the genetic relatedness of higher ozone sensitivity of modern wheat to its wild and cultivated progenitors/relatives. J. Exp. Bot. 2008, 59, 951–963. [Google Scholar] [CrossRef] [Green Version]
- Akhtar, N.; Yamaguchi, M.; Inada, H.; Hoshino, D.; Kondo, T.; Fukami, M.; Funada, R.; Izuta, T. Effects of ozone on growth, yield and leaf gas exchange rates of four Bangladeshi cultivars of rice (Oryza sativa L.). Environ. Pollut. 2010, 158, 2970–2976. [Google Scholar] [CrossRef] [PubMed]
- Agathokleous, E. Perspectives for elucidating the ethylenediurea (EDU) mode of action for protection against O3 phytotoxicity. Ecotox. Environ. Saf. 2017, 142, 530–537. [Google Scholar] [CrossRef] [PubMed]
- Wang, X.; Zheng, Q.; Yao, F.; Chen, Z.; Feng, Z.; Manning, W.J. Assessing the impact of ambient ozone on growth and yield of a rice (Oryza sativa L.) and a wheat (Triticum aestivum L.) cultivar grown in the Yangtze Delta, China, using three rates of application of ethylenediurea (EDU). Environ. Pollut. 2007, 148, 390–395. [Google Scholar] [CrossRef]
- Annual Report 2012–2013 (2013). Directorate of Wheat Research, Karnal, India. Available online: https://farmer.gov.in/imagedefault/pestanddiseasescrops/wheatannualreport2013.pdf (accessed on 15 July 2017).
- Mauzerall, D.L.; Wang, X. Protecting agricultural crops from the effects of tropospheric ozone exposure: Reconciling science and standard setting in United States, Europe and Asia. Annu. Rev. Energy Environ. 2001, 26, 237–287. [Google Scholar] [CrossRef]
- Machlachan, S.; Zalik, S. Plastid structure, chlorophyll concentration and free amino acid composition of a chlorophyll mutant of barley. Can. J. Bot. 1963, 41, 1053–1062. [Google Scholar] [CrossRef]
- Duxbury, A.C.; Yentsch, C.S. Plankton pigment monographs. J. Mar. Res. 1956, 15, 91–101. [Google Scholar]
- Elstner, E.F.; Heuper, A. Inhibition of nitrite formation from hydroxylammonium chloride: A simple assay for superoxide dismutase. Ann. Biochem. 1976, 70, 616–620. [Google Scholar] [CrossRef]
- Singh, A.A.; Agrawal, S.B.; Shahi, J.P.; Agrawal, M. Investigating the response of tropical maize (Zea mays L.) cultivars against elevated levels of O3 at two developmental stages. Ecotoxicology 2014, 23, 1447–1463. [Google Scholar] [CrossRef] [PubMed]


| Parameters | EDU Treatment | Cultivar | EDU × Cultivar | ||||||
|---|---|---|---|---|---|---|---|---|---|
| df | F | p | df | F | p | df | F | p | |
| Total biomass | 1 | 154 | <0.001 | 2 | 186 | <0.001 | 2 | 15.34 | 0.014 |
| Plant height | 1 | 17.39 | 0.013 | 2 | 54.55 | <0.001 | 2 | 2.76 | 0.122 |
| No. of tillers per plant | 1 | 60.5 | 0.001 | 2 | 19.92 | 0.001 | 2 | 0.071 | 0.932 |
| No. of senesced leaves | 1 | 5.56 | 0.078 | 2 | 19.85 | 0.005 | 2 | 10.42 | 0.018 |
| No. of leaves | 1 | 10.91 | 0.030 | 2 | 2.935 | 0.111 | 2 | 0.131 | 0.879 |
| Total chlorophyll | 1 | 207 | <0.001 | 2 | 219 | <0.001 | 2 | 314 | <0.001 |
| Carotenoids | 1 | 119 | <0.001 | 2 | 256 | <0.001 | 2 | 335 | <0.001 |
| Ps | 1 | 59.1 | 0.002 | 2 | 4.03 | 0.073 | 2 | 0.76 | 0.482 |
| gs | 1 | 9.04 | 0.040 | 2 | 17.99 | 0.005 | 2 | 0.385 | 0.690 |
| Fv/Fm | 1 | 40.79 | 0.003 | 2 | 10.34 | 0.013 | 2 | 3.032 | 0.105 |
| SOD | 1 | 374.1 | <0.001 | 2 | 300.2 | <0.001 | 2 | 138.6 | <0.001 |
| POX | 1 | 121.3 | <0.001 | 2 | 227.2 | <0.001 | 2 | 197.5 | <0.001 |
| CAT | 1 | 106.9 | <0.001 | 2 | 107.1 | <0.001 | 2 | 66.9 | <0.001 |
| APX | 1 | 0.205 | 0.674 | 2 | 145.1 | <0.001 | 2 | 33.95 | 0.001 |
| Superoxide radical Production rate | 1 | 87.11 | <0.001 | 2 | 111.4 | <0.001 | 2 | 91.95 | <0.001 |
| Yield | 1 | 134 | <0.001 | 2 | 103.9 | <0.001 | 2 | 2.064 | 0.219 |
| Cultivars | Parameters | Non-EDU Treated | EDU-Treated | Significance |
|---|---|---|---|---|
| HD 2987 | Plant height (cm) | 84.76 ± 0.38 b | 97.00 ± 0.57 B | *** |
| No. of tillers plant−1 | 4.33 ± 0.33 b | 6.66 ± 0.33 B | ** | |
| Total biomass (g) | 5.96 ± 0.08 bc | 7.30 ± 0.15 BC | ** | |
| Ps (μmol CO2 m−2 s−1) | 16.24 ± 0.83 b | 21.84 ± 0.15 A | ** | |
| gs (mol m−2 s−1) | 0.69 ± 0.04 a | 0.81 ± 0.01 A | * | |
| Fv/Fm | 0.71 ± 0.01 b | 0.79 ± 0.01 A | * | |
| PBW 502 | Plant height (cm) | 85.76 ± 0.58 b | 95.20 ± 0.96 B | ** |
| No. of tillers plant−1 | 4.66 ± 0.33 b | 7.33 ± 0.67 B | * | |
| Total biomass (g) | 7.66 ± 0.06 ac | 10.30 ± 0.05 AC | *** | |
| Ps (μmol CO2 m−2 s−1) | 16.48 ± 0.46 b | 19.79 ± 1.75 A | ns | |
| gs (mol m−2 s−1) | 0.50 ± 0.04 a | 0.60 ± 0.04 B | * | |
| Fv/Fm | 0.77 ± 0.01 ab | 0.82 ± 0.01 A | * | |
| Kharchiya 65 | Plant height (cm) | 125.23 ± 0.66 a | 132.96 ± 0.79 A | ** |
| No. of tillers plant−1 | 7.33 ± 0.67 a | 9.67 ± 0.33 A | * | |
| Total biomass (g) | 10.33 ± 0.06 ab | 11.60 ± 0.20 AB | ** | |
| Ps (μmol CO2 m−2 s−1) | 21.07 ± 1.36 a | 23.12 ± 1.83 A | ns | |
| gs (mol m−2 s−1) | 0.62 ± 0.02 a | 0.78 ± 0.01 A | ** | |
| Fv/Fm | 0.80 ± 0.02 a | 0.81 ± 0.00 A | ns |
© 2019 by the authors. Licensee MDPI, Basel, Switzerland. This article is an open access article distributed under the terms and conditions of the Creative Commons Attribution (CC BY) license (http://creativecommons.org/licenses/by/4.0/).
Share and Cite
Fatima, A.; Singh, A.A.; Mukherjee, A.; Dolker, T.; Agrawal, M.; Agrawal, S.B. Assessment of Ozone Sensitivity in Three Wheat Cultivars Using Ethylenediurea. Plants 2019, 8, 80. https://doi.org/10.3390/plants8040080
Fatima A, Singh AA, Mukherjee A, Dolker T, Agrawal M, Agrawal SB. Assessment of Ozone Sensitivity in Three Wheat Cultivars Using Ethylenediurea. Plants. 2019; 8(4):80. https://doi.org/10.3390/plants8040080
Chicago/Turabian StyleFatima, Adeeb, Aditya Abha Singh, Arideep Mukherjee, Tsetan Dolker, Madhoolika Agrawal, and Shashi Bhushan Agrawal. 2019. "Assessment of Ozone Sensitivity in Three Wheat Cultivars Using Ethylenediurea" Plants 8, no. 4: 80. https://doi.org/10.3390/plants8040080