Article

Evolutionary Analysis of GH3 Genes in Six Oryza Species/Subspecies and Their Expression under Salinity Stress in Oryza sativa ssp. japonica

State Key Laboratory for Hybrid Rice, College of Life Sciences, Wuhan University, Wuhan 430072, China
*
Author to whom correspondence should be addressed.
Plants 2019, 8(2), 30; https://doi.org/10.3390/plants8020030
Submission received: 4 January 2019 / Revised: 21 January 2019 / Accepted: 22 January 2019 / Published: 24 January 2019

Abstract

:
Glycoside Hydrolase 3 (GH3), a member of the Auxin-responsive gene family, is involved in plant growth, the plant developmental process, and various stress responses. The GH3 gene family has been well-studied in Arabidopsis thaliana and Zea mays. However, the evolution of the GH3 gene family in Oryza species remains unknown and the function of the GH3 gene family in Oryza sativa is not well-documented. Here, a systematic analysis was performed in six Oryza species/subspecies, including four wild rice species and two cultivated rice subspecies. A total of 13, 13, 13, 13, 12, and 12 members were identified in O. sativa ssp. japonica, O. sativa ssp. indica, Oryza rufipogon, Oryza nivara, Oryza punctata, and Oryza glumaepatula, respectively. Gene duplication events, structural features, conserved motifs, a phylogenetic analysis, chromosome locations, and Ka/Ks ratios of this important family were found to be strictly conservative across these six Oryza species/subspecies, suggesting that the expansion of the GH3 gene family in Oryza species might be attributed to duplication events, and this expansion could occur in the common ancestor of Oryza species, even in common ancestor of rice tribe (Oryzeae) (23.07~31.01 Mya). The RNA-seq results of different tissues displayed that OsGH3 genes had significantly different expression profiles. Remarkably, the qRT-PCR result after NaCl treatment indicated that the majority of OsGH3 genes play important roles in salinity stress, especially OsGH3-2 and OsGH3-8. This study provides important insights into the evolution of the GH3 gene family in Oryza species and will assist with further investigation of OsGH3 genes’ functions under salinity stress.

1. Introduction

Auxin is crucial for various aspects of plant growth and development, including signaling transport, plant metabolism, apical dominance, and shoot elongation [1,2]. Auxin’s production, storage, degradation, and migration to the region of its action are tightly regulated both spatially and temporally [2,3]. Auxin-regulated genes include different Auxin-responsive families, such as Auxin/Indole-3-Acetic Acid genes (AUX/IAAs act as repressors), Auxin Response Factor genes (ARFs act as transcription activators), Small Auxin Up RNA genes (SAURs regulate the auxin-signaling pathway), and Gretchen Hagen 3 genes (GH3s) [3,4]. The GH3 enzyme family conjugates amino acids to chemically diverse compounds, such as Jasmonic acid (JA), Indole-3-acetic acid (IAA), and Salicylic acid (SA) at the cellular level and modulates crosstalk among JA, IAA, and SA, which in turn is involved in plant physiological processes [1,5,6,7,8,9].
Since the first GH3 gene was cloned from soybean [4], genome-wide analyses have identified 19 GH3 genes in Arabidopsis thaliana, 13 in Oryza sativa ssp. japonica, 13 in Zea mays, 15 in Solanum lycopersicum, 2 in Physcomitrella patens, and 18 in Selaginella moellendorffii [6,8,9,10,11,12,13]. To date, GH3 genes have been categorized into three groups (I–III) based on sequence similarity and substrate specificities [5,9]. In Arabidopsis, GH3 proteins from group I, with JA and/or SA-amido synthetase activity, use JA or SA as a substrate. GH3 proteins from group II, with IAA-amido synthetase activity, have Auxin-inducible expression profiles [5,9]. GH3 proteins from group III remain largely unknown to date. AtGH3-12/PBS3, an acyladenylase family member, is the best-studied class III protein. It regulates SA-dependent defense response by encoding a putative serine-threonine kinase that is involved in the conjugation of glutamic acid to 4-aminobenzoate and 4-hydroxybenzoate [9]. In O. sativa ssp. japonica, the GH3 gene family includes 13 members: four members in group I (OsGH3-3, -5, -6, and -12) and nine members in group II (OsGH3-1, -2, -4, -7, -8, -9, -10, -11, and -13). Of all OsGH3 genes, OsGH3-1, -2, -8, and -13 regulate the modulation of crosstalk between the IAA [13,14], JA, and SA signaling pathways for rice tolerance to biotic or/and abiotic stresses [13,15,16,17]. OsGH3-2 modulates Auxin and Abscisic acid (ABA) levels, triggering drought and cold tolerances [18]. Rice overexpressing OsGH3-2 has several filamentous roots and a lower number of lateral roots, indicating that OsGH3-2 is involved in the regulation of lateral root development [13,18]. The ‘Auxin-miR167-ARF8-OsGH3-2’ signaling pathway was proposed by Yang et al. (2009). It assumes that OsGH3-2 is positively regulated by ARF8 (an Auxin response factor) and is negatively degraded by miR167. miR167 is regulated by Auxin [19]. Previous research has also reported that OsGH3-8 can be induced by Auxin, SA, and JA, and plays an important role in rice growth and disease resistance [15]. OsGH3-8 is a common downstream target of OsMADS1 and OsMADS6 and controls rice floret fertility [20,21]. Recently, Dai et al. (2018) reported that OsGH3-8 can modulate the plant architecture by the miR156f-OsSPL7-OsGH3-8 pathway in rice [22]. Additionally, OsGH3-13 improves rice drought tolerance by downregulating IAA content [17].
Cultivated rice (O. sativa L.) is the second-most important staple food crop worldwide [23,24,25]. Oryza species, with great economic value, can provide major genes for the hybrid rice revolution and sustainable rice production [26]. However, the characterization and evolution relation of GH3 genes in Oryza species are still largely unknown. The function of the GH3 gene family in Oryza sativa under salinity stress remains unclear. In this study, we performed a genome-wide analysis of GH3 gene family members to analyze gene structure, protein motifs, chromosomal localizations, and collinear gene pairs among six Oryza species/subspecies. Furthermore, functional annotations and a cis-acting element analysis of OsGH3 genes were performed. Finally, the expression patterns of 13 OsGH3 genes in different tissues and under salinity stress were examined using RNA-seq and qRT-PCR. The present study may provide a better understanding of the evolution of GH3 genes in Oryza species and functions of OsGH3 genes in O. sativa under salinity stress.

2. Materials and Methods

2.1. Plant Materials

Rice ‘Nipponbare’ (O. sativa ssp. japonica) was chosen for the quantitative real-time RT-PCR (qRT-PCR). After 2 days of germination in water at 37 °C, seeds were grown in containers with sponges as supporting materials in Yoshida solution with 60% relative humidity and with a light and temperature regime of 14 h/10 h, light/dark, 30 °C/22 °C. Three-leaf stage seedlings were transferred to 200 mM NaCl Yoshida solution for salt treatment. Then, leaves and roots of treatment/control seedlings were collected at 0, 3, 6, 12, and 24 h for RNA extraction. For each biological replicate, 15 seedlings were collected and mixed to minimize the effect of transcriptome unevenness among rice seedlings. Total RNA was extracted using the TRIzol method and reverse transcribed into cDNA using the PrimeScript RT reagent Kit (TakaRa, Dalian, China).

2.2. Identification of the GH3 Genes

Potential members of the GH3 gene family were identified based on the Hidden Markov model (HMM) and BLAST homology searches [27,28]. Protein and nucleotide sequences of wild rice (Oryza rufipogon, version: OR_W1943.39; Oryza nivara, version: v1.0; Oryza punctata, version: v1.2; Oryza glumaepatula, version: v1.5) and cultivated rice (O. sativa ssp. indica, version: ASM465v1, version: R498) were downloaded from EnsemblPlants (http://plants.ensembl.org/index.html) and MBKBASE (http://www.mbkbase.org/R498/). GH3 protein sequences of Arabidopsis and rice (O. sativa ssp. japonica) were downloaded from the TAIR Database (https://www.arabidopsis.org/) and RiceData (http://www.ricedata.cn/gene/) as query sequences [11,12,29]. These query sequences were used to search for GH3 protein sequences in five Oryza species’ protein databases using local ncbi-blast-2.7.1+ (ftp://ftp.ncbi.nlm.nih.gov/blast/executables/blast+/LATEST) in the Blastp method with a cut-off E-value of e−5. Then, PF03321 was downloaded from Pfam (http://pfam.xfam.org/) and PF03321 was used to query the Oryza species’ proteins database using HMMER 3.0 software (http://hmmer.org/) [27]. Since the GH3 domain is longer than 400, protein sequences with a length of less than 400 were deleted in this study. Finally, the GH3 domains of all the nonredundant protein sequences were verified by SMART (http://smart.embl-heidelberg.de/) and Pfam (http://pfam.xfam.org/search/sequence) [8,27].

2.3. Phylogenetic Analysis

Multiple sequences alignments with Arabidopsis and O. sativa ssp. japonica were conducted by Clustal W, separately. A phylogenetic tree was generated by MEGA 6.0 using the Neighbor Joining (NJ) method with 1000 bootstrap replicates [27,28,30,31]. Subsequently, GH3 sequences of five Oryza species were systematically named based on the clustering results and names from previous studies [11,12,31].

2.4. Analysis of Gene Structure and Conserved Motifs

The exon/intron structure of GH3 genes was analyzed by comparing the coding DNA sequences (CDS) and the genomic sequences using the GSDS 2.0 (http://gsds.cbi.pku.edu.cn/). The Multiple Expectation Maximization for motif Elicitation (MEME, http://meme-suite.org/tools/meme) tool was used to predict conserved motifs of GH3 proteins with these parameters: the number of motifs (20) and other parameters (default values) [27,29,30]. Gene structure and conserved motifs were visualized using TBtools [32].

2.5. Analysis of Chromosome Locations, Gene Duplication Events, and Ka/Ks Values

Chromosome locations of GH3 genes were obtained from GFF3 files. Gene duplication patterns of GH3 genes were analyzed by the ‘duplicate_gene_classifier’ script in MCScanX (http://chibba.pgml.uga.edu/mcscan2/) with the default parameters [28,33]. Chromosome locations and gene duplication events were visualized using Circos software (http://circos.ca/) [34]. The synonymous (Ks) and nonsynonymous (Ka) substitution rates were estimated using DnaSP 5.0 (http://www.ub.edu/dnasp/) [35]. Divergence time (T) was estimated by T = Ks/(2 × 9.1 × 10−9) × 10−6 million years ago (Mya) [28,36].

2.6. Microsynteny Analysis, Cis-Acting Element Analysis, and Functional Annotation Analysis

The microsynteny between six Oryza species/subspecies was analyzed by MCScanX with the default parameters. Collinear gene pairs between six Oryza species/subspecies were drawn using Circos software [34]. Cis-acting regulatory elements (Cis-elements) of each promoter (2 Kbp upstream from the translation start site, ATG) of the OsGH3 gene were analyzed by the PLANTCARE program (http://bioinformatics.psb.ugent.be/webtools/plantcare/html) [37].The functional annotations of the OsGH3 proteins (OsGH3s) were performed using Blast2GO software [38]. The KEGG pathways of OsGH3s were carried out using the KEGG database (http://www.kegg.jp) [39].

2.7. Expression Analysis and Co-Expression Network Analysis of OsGH3 Genes Based on the RNA-seq Datasets from Different Tissues

Raw datasets (SRX100741, SRX100757, SRX100743, SRX100745, SRX100746, SRX100747, SRX100749, SRX100753, SRX100754, SRX100756, SRX100755, SRR042529, and SRX016110) were obtained from the NCBI (https://www.ncbi.nlm.nih.gov/). These datasets were used to analyze the expression profiles of OsGH3 genes in different tissues (leaves-20 days, post-emergence inflorescence, pre-emergence inflorescence, anther, pistil, seed-5 days after pollination (DAP), embryo-25 DAP, endosperm-25 DAP, seed-10 DAP, shoots, and seedling four-leaf stage). Tophat2 was applied to map raw data to the reference genome (MSU 7.0, http://rice.plantbiology.msu.edu/). Then, Cufflinks software was adopted to calculate gene expression [40]. The R package was used to generate quantitative differences in the expression level of each gene based on the log2FPKM values [29].
A co-expression network in different tissues was constructed based on RNA-seq datasets using the Comparative Co-Expression Network Construction and Visualization tool (CoExpNetViz, http://bioinformatics.psb.ugent.be/webtools/coexpr/) with previously reported parameters [27]. The Co-expression network was visualized using Cytoscape V.3.1.0. The correlation coefficient >0.50 or < −0.50 was limited.

2.8. Expression Analysis of OsGH3 Genes under Salinity Stress by qRT-PCR

Primers of OsGH3 genes were designed by Primer 5.0 in specific regions or 3’–UTR regions (Primers in Table S1) [29]. The qRT-PCR reaction (10 μL) was formulated using ChamQ™ SYBR® Color qPCR Master Mix (Vazyme, Shanghai, China). qRT-PCR was carried out in 96-well plates on a CFX96 Touch™ Real-Time PCR Detection System (Bio-Rad, Hercules, CA, USA). Ubi (LOC_Os03g13170, encodes the ubiquitin fusion protein) was used as an internal control. The average threshold cycle (Ct) from three biological replicates was used to determine the fold change of OsGH3 gene expression by the 2−ΔΔCT method [29].

3. Results

3.1. Identification and Classification of the GH3 Gene Family

A total of 13, 13, 13, 12, and 12 members were identified in O. sativa ssp. indica, O. rufipogon, O. nivara, O. punctata, and O. glumaepatula, respectively. Based on the homologous sequence cluster result with Arabidopsis and O. sativa ssp. japonica, all GH3 genes were grouped into two groups (Table 1 and Figure 1): group1 and group2. In O. sativa ssp. indica, O. rufipogon, and O. nivara, four members of GH3s belonged to group1, and nine members of GH3s belonged to group2. In O. punctata and O. glumaepatula, four members of GH3s belonged to group1, and eight members of GH3s belonged to group2 (Table 1 and Figure 1). We found that the classification, chromosome locations, and number of GH3 genes were strictly conservative among these six Oryza species, and small differences in the number of GH3 genes could be produced from assembly or sequencing errors because these two incomplete sequences were also identified, namely OpGH10 (ID: OPUNC07G18660.1) in O. punctata and OgGH7 (ID: OGLUM06G14160.1) in O. glumaepatula. Considering this reason, these two incomplete sequences were removed in further research. Interestingly, no members of group III were found in five Oryza species, while 10 members of group III were found in Arabidopsis (Figure 1).

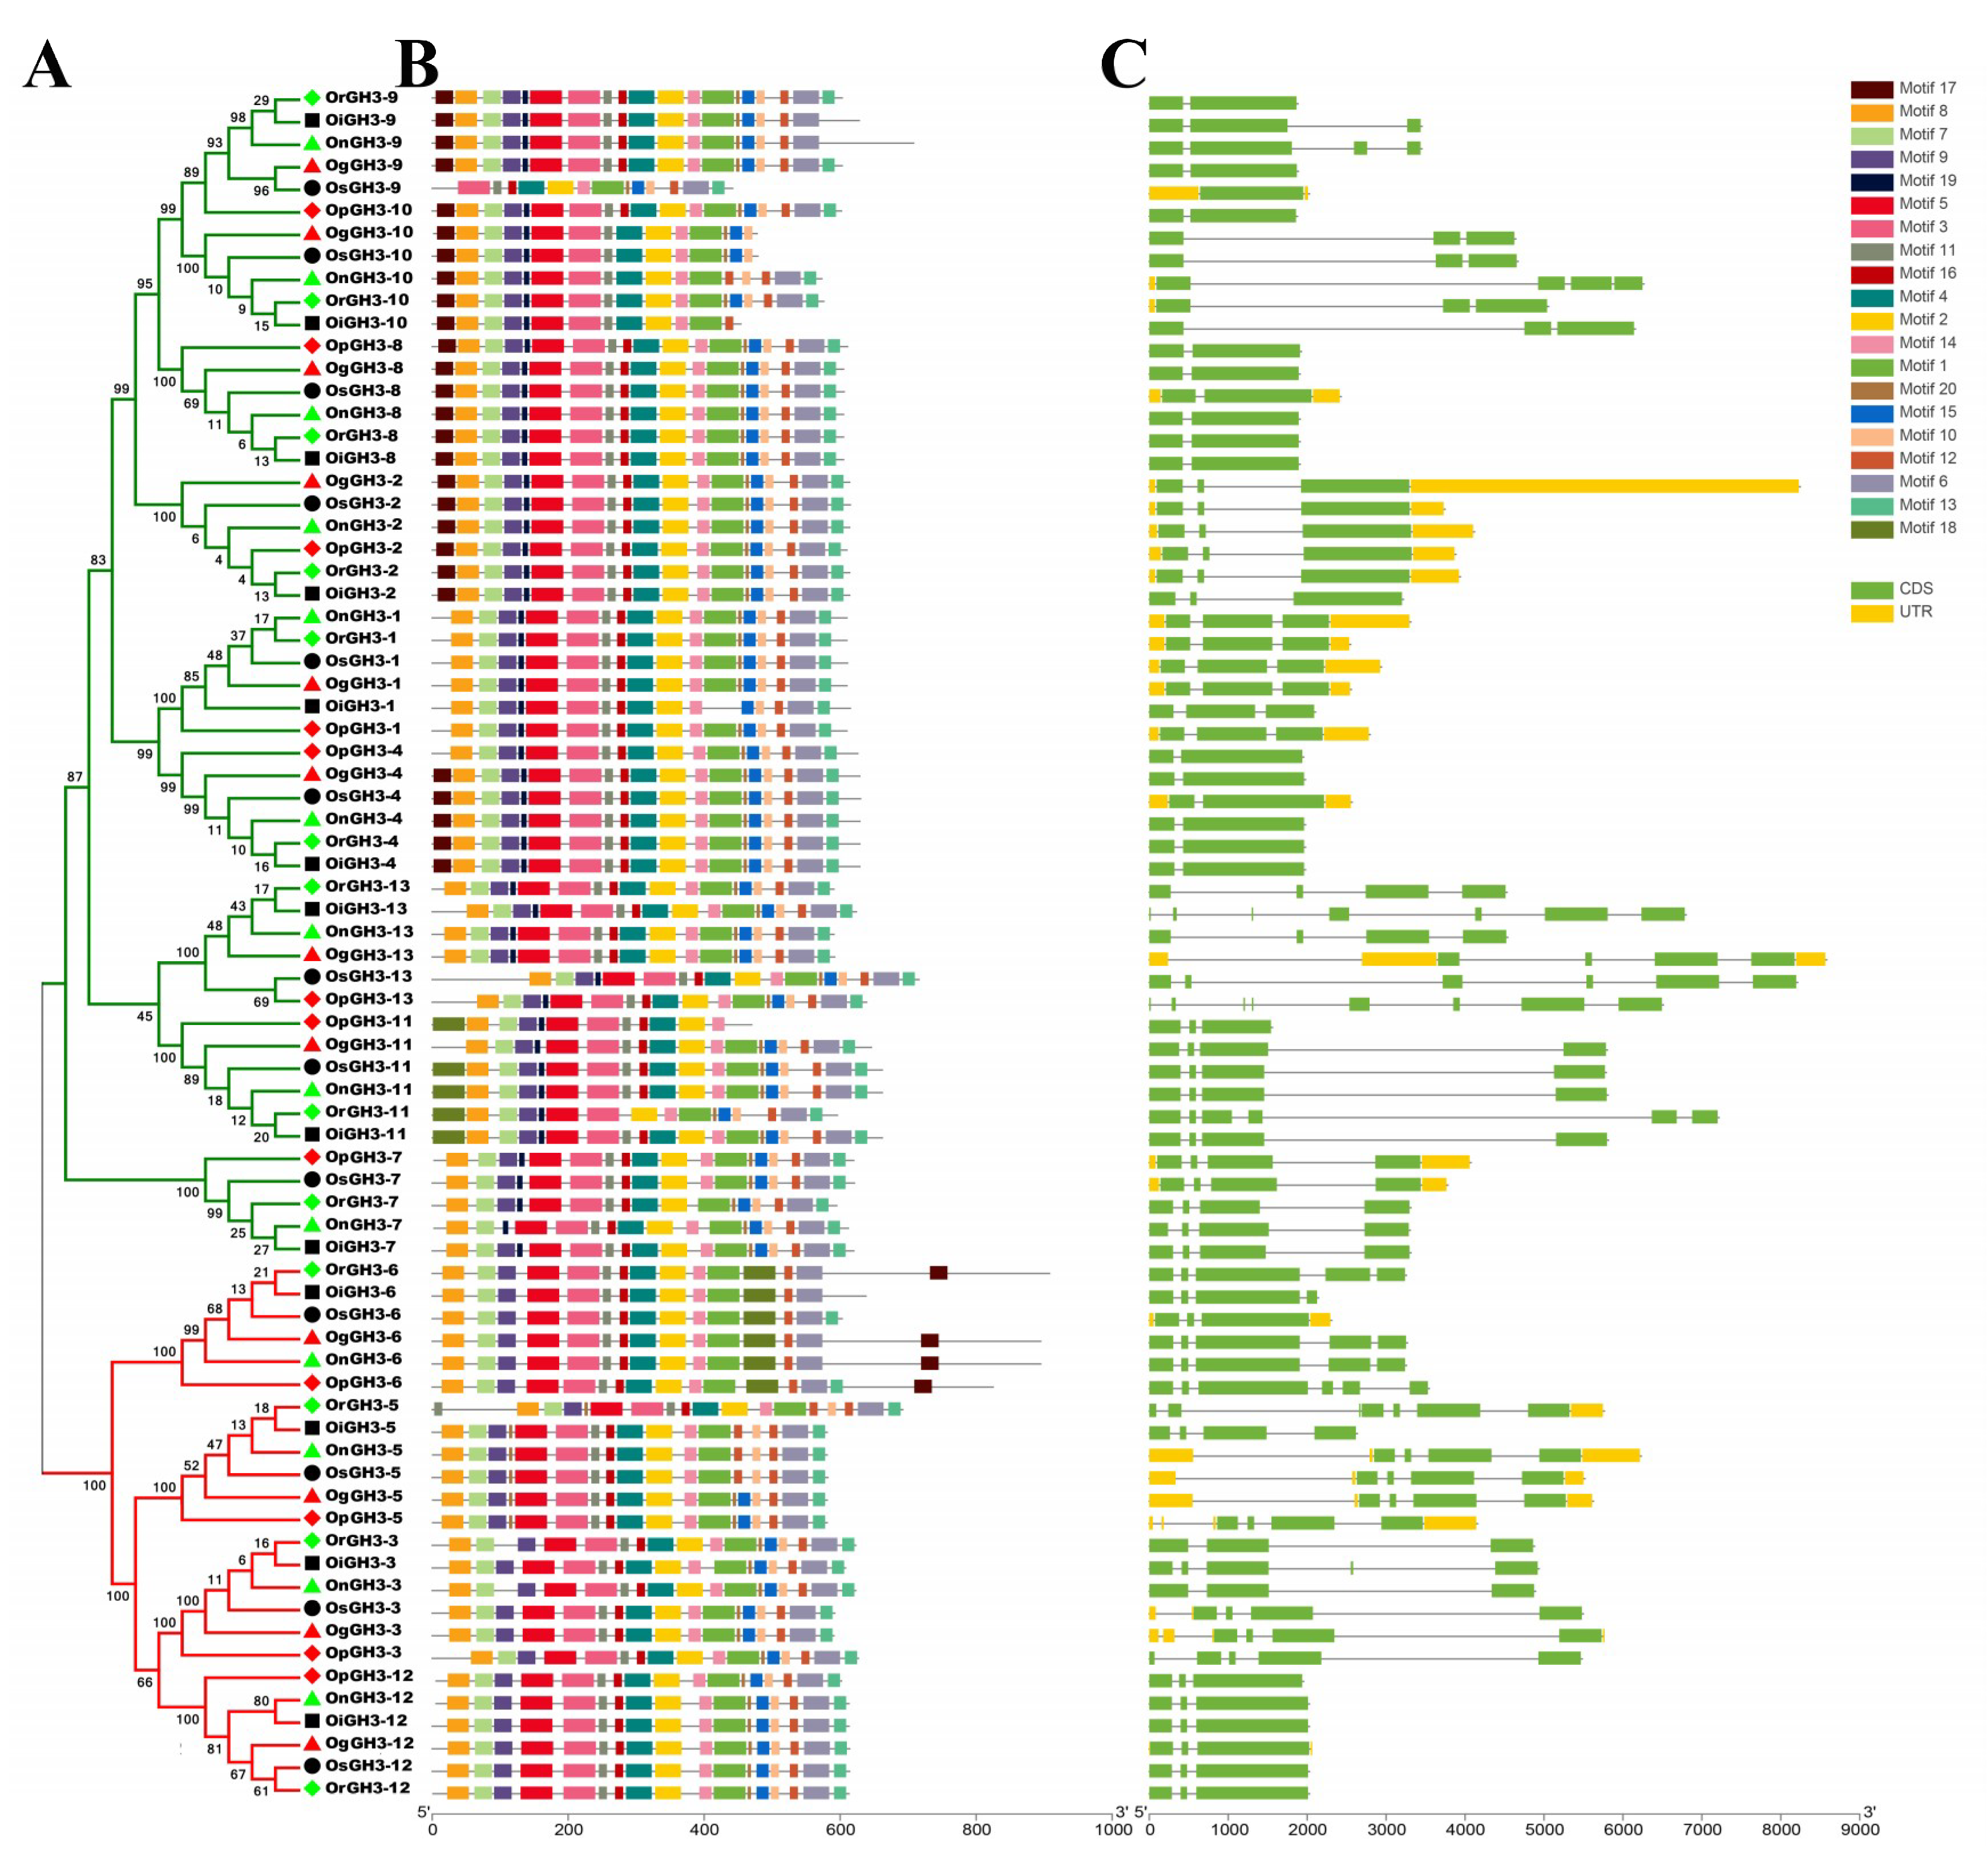
3.2. Gene Structure and Conserved Motif Analysis

Earlier studies have shown that gene structure diversity can provide the primary power for the evolution of multigene families [7,27,28,29,36]. Thus, an exon/intron analysis was performed to obtain more insights into the structural diversity of GH3s in Oryza species (Figure 2). The analysis results showed that the intron number of GH3s in six Oryza species/subspecies ranged from 1 to 7, GH3-4 contained the fewest introns (1), and GH3-13 contained the most introns (3–7) (Figure 2). Furthermore, conserved motifs of 63 GH3 proteins were analyzed by MEME. As a result, 20 conserved motifs were identified, and the 63 GH3 proteins showed a similar conserved motifs arrangement. Notably, we found that GH3s from the same group showed differences in the number and the length of exons/introns. These results suggest that the gene function from the similar group has diversified. In short, the gene structure and conserved motif analysis of GH3s strongly supports the reliability of the group classification of GH3s in Figure 1.

3.3. Chromosome Locations, Duplication Events, Selection Pressure, and Microsynteny Analysis

The chromosome locations result showed that 13 GH3 genes were unevenly mapped on 12 chromosomes among the six species and subspecies. Four GH3 genes (30.77%) mapped on chromosome (Chr) 7, three GH3 genes (23.08%) mapped on Chr1 and Chr5, two GH3 genes (15.38%) mapped on Chr11, and one GH3 gene (7.69%) mapped on Chr6. No GH3 gene was found on Chr2, Chr3, Chr4, Chr8, Chr10, and Chr12 (Figure 3A–F). These uneven distribution patterns of the GH3 gene family have also been observed in Arabidopsis, maize, tomato, and potato [5,6,8,9,10]. Moreover, we discovered six pairs of segmental duplication events and two pairs of tandem duplication events in the six Oryza species/subspecies (Figure 3). Interestingly, GH3-1 and GH3-4 segmental duplication events were found in every species/subspecies (Figure 3). However, GH3-9 and GH3-10 tandem duplication events were only found in O. sativa ssp. indica and O. nivara (Figure 3B,E,G). Our findings suggest that duplication events were major factors determining the expansion of the GH3 gene family. Next, Ka/Ks values of duplicated GH3 gene pairs were calculated to evaluate the driving force underlying the GH3 gene’s evolution. Ka/Ks >1, <1, and =1 mean a positive selection, a negative selection, and a neutral selection, respectively. The Ka/Ks results showed that the Ka/Ks values of eight duplicated GH3 genes ranged from 0.1245 to 0.2070 and were less than 1 (Table 2). These results demonstrated that the duplicated GH3 genes were under a strong negative selection during the evolution process. The segmental duplication events of these six gene pairs were estimated to occur between 23.20 and 31.01 Mya (Table 2). Besides this, to further understand the evolutionary process of the GH3 genes in Oryza species, a microsynteny analysis was conducted among the six Oryza species/subspecies. In total, 169 collinear gene pairs were identified (Figure 4, Table S2).

3.4. Analysis of Cis-Elements in OsGH3 Genes

The Cis-elements present in the stress-responsive gene promoters can provide an important insight into the stress response of plants [28,41,42]. Thus, the PlantCare database was used to identify the Cis-elements present in the promoter regions in the OsGH3 genes. Our results showed a high frequency of occurrence of Cis-elements in OsGH3 genes (Figure 5) and that 47 Cis-elements were identified. These Cis-elements can be divided into 3 primary categories, including 20 secondary categories based on the previously described functional categories [43]. The cis-elements in the growth and development primary category showed a higher frequency of occurrence than that in the stress response and phytohormone response primary category (Figure 5A,B). In the growth and development primary category, the number of light responsive/responsiveness secondary category elements exceeded 160 and contained 23 types of elements (Figure 5A). In the phytohormone response primary category, the MeJA-responsiveness secondary category was the top secondary category (64), including the CGTCA-motif and the TGACG-motif, followed by the abscisic acid responsiveness secondary category (55), including the ABRE element (Figure 5A). In the phytohormone response primary category, the top three secondary categories were the anaerobic induction, anoxic specific inducibility, and drought inducibility secondary categories, respectively (Figure 5A). The result of the Cis-element position analysis showed that Cis-elements are unevenly distributed on all genes, and several Cis-elements were preferentially present on individual genes; for instance, the OsGH3-9 promoter regions had a lot of MeJA-responsive Cis-elements (Figure 5C). Thus, we proposed that OsGH3 genes have the potential to improve stress tolerances because the OsGH3 genes contain several biotic/abiotic stress motifs in their promoter regions. It could also be further speculated that OsGH3-9 plays an important role in MeJA-related processes.

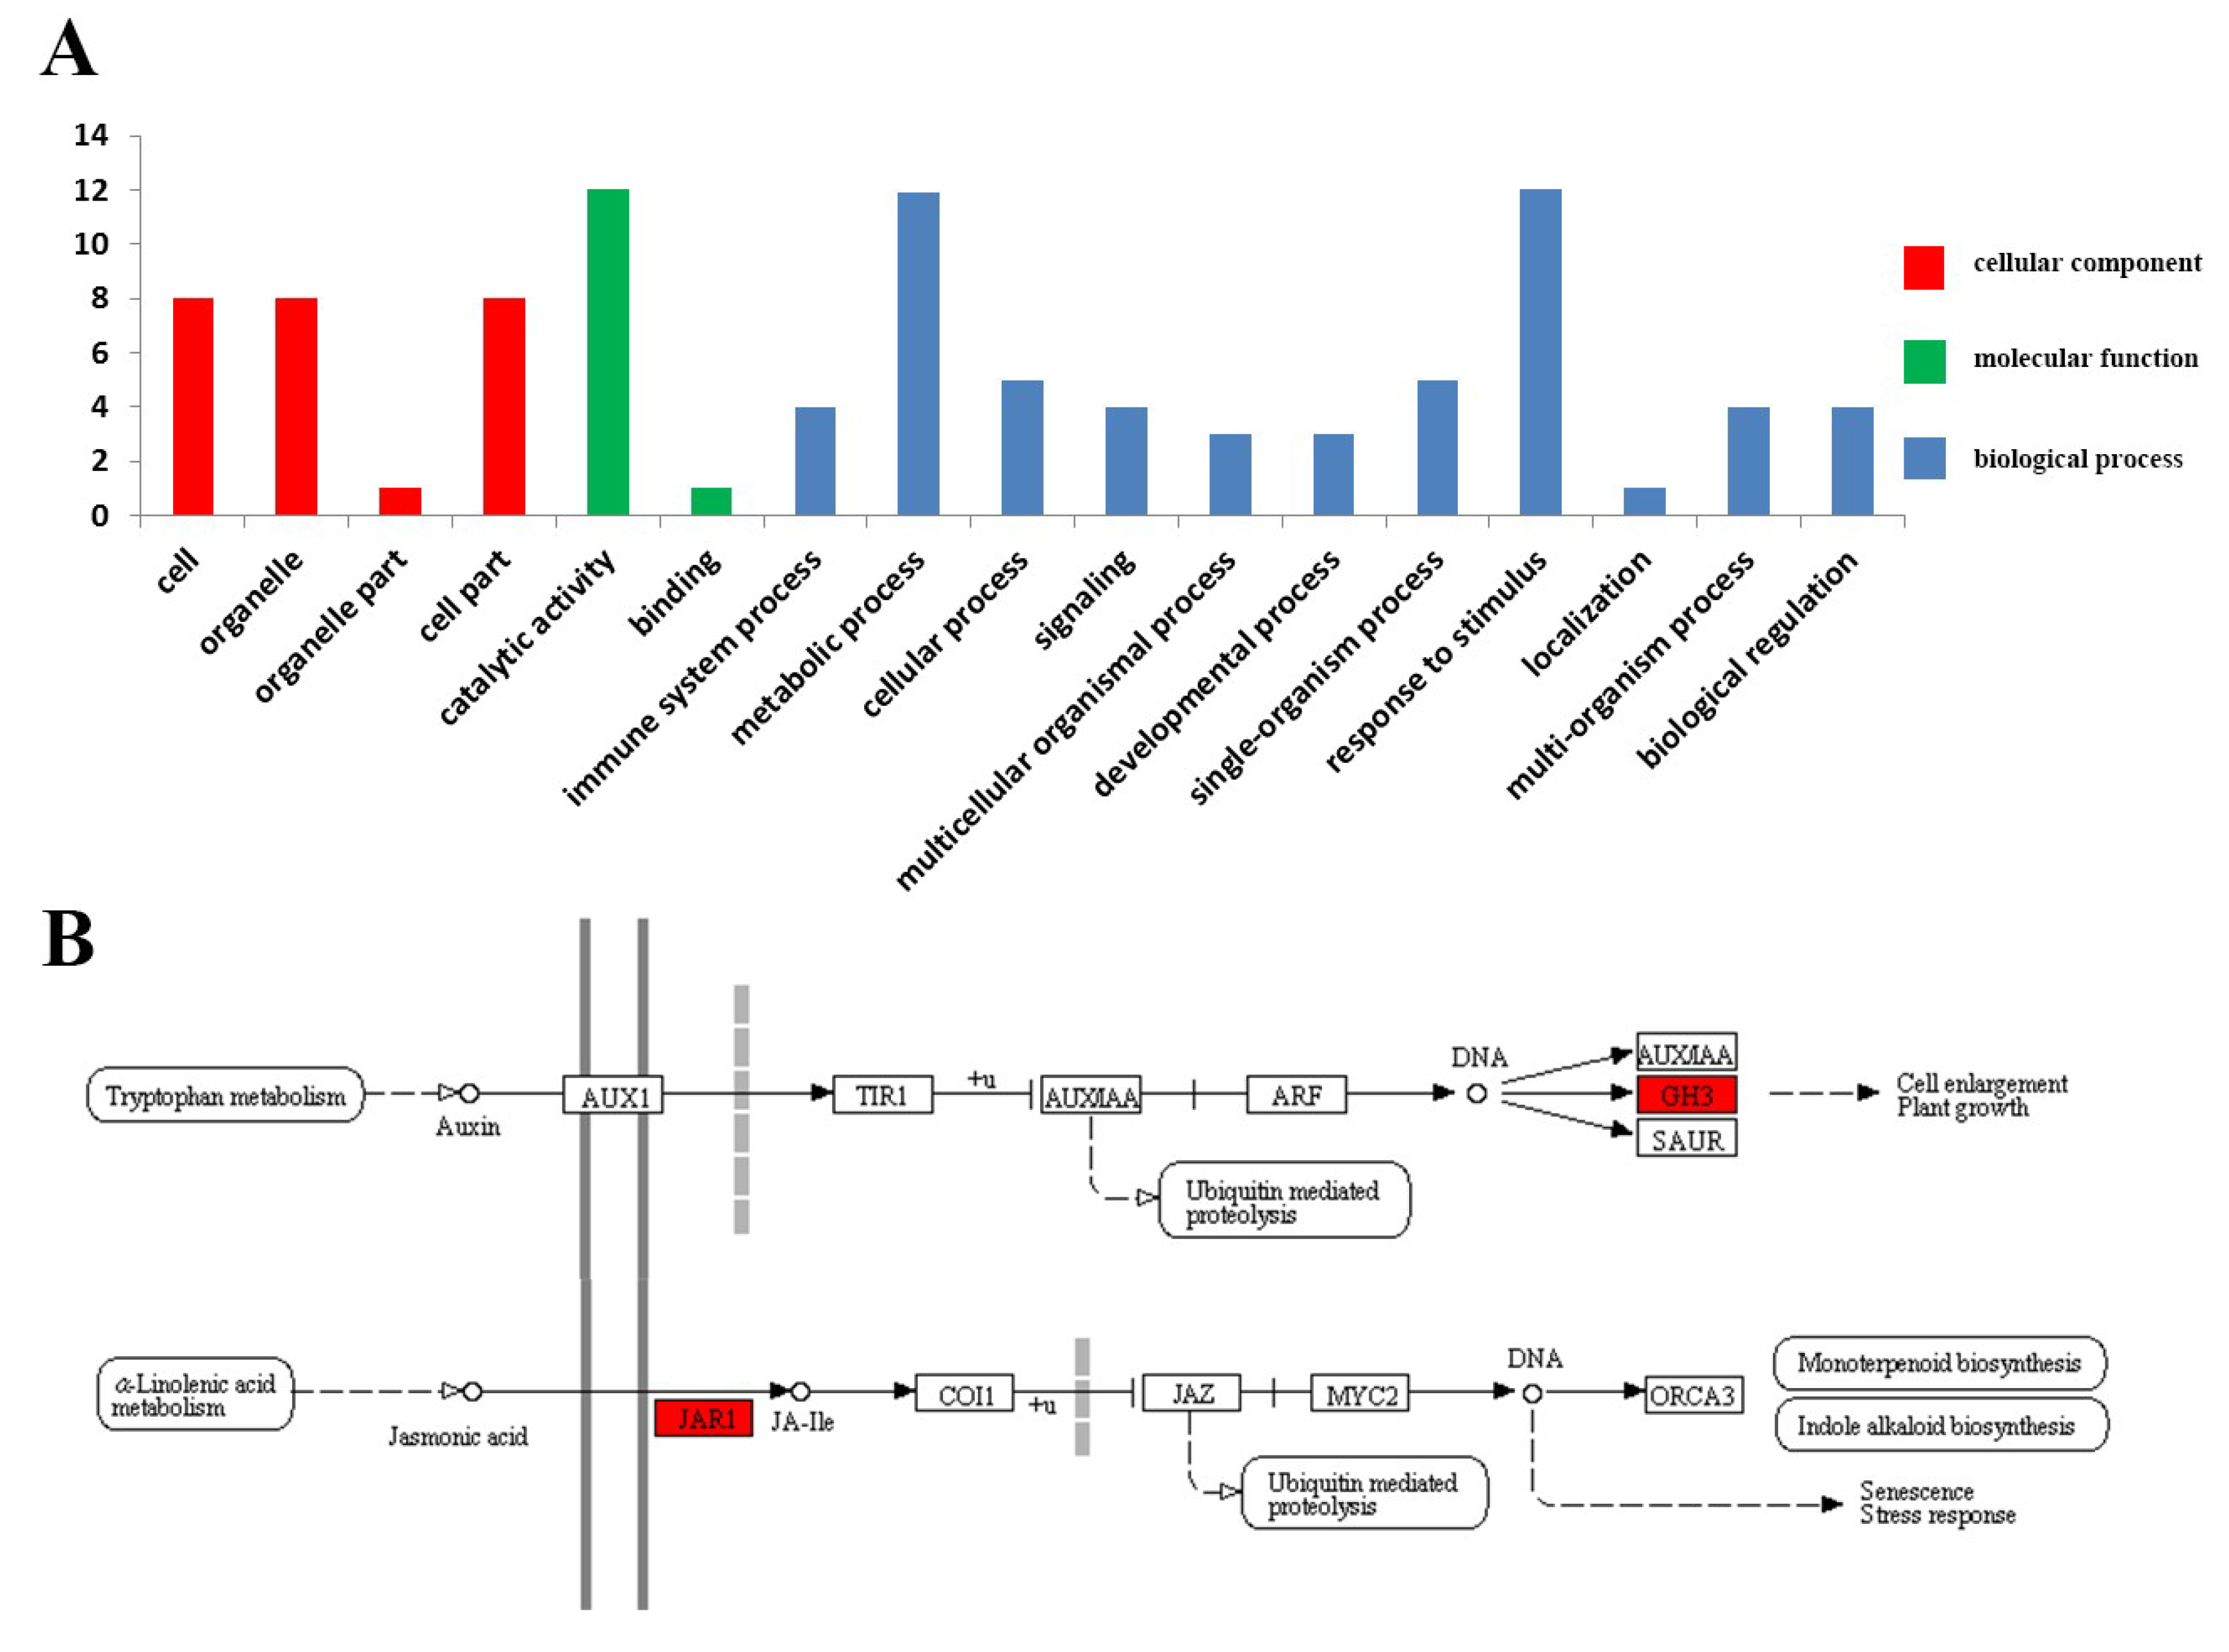
3.5. Functional Annotations Analysis of the OsGH3 Proteins

The results of the GO annotation and KEGG pathway analysis provide us with a better understanding of the biological functions of the different OsGH3 proteins. In this study, the GO annotation result revealed that 13 OsGH3 proteins were divided into 17 specific classes represented under the functional domains molecular functions, cellular components, and biological processes. Catalytic activity, metabolic process, and response to stimulus were predominant among the above-specified classes (Figure 6). KEGG pathway results revealed that nine OsGH3 proteins (eight OsGH3 proteins belonged to group2, except for OsGH3-6) were enriched on the Auxin pathway, while three OsGH3 proteins (belonging to group 1) were enriched on the JA pathway. These results support previous reports that GH3 proteins from group I, with JA and/or SA-amido synthetase activity, use JA or SA as a substrate. GH3 proteins from group II, with IAA-amido synthetase activity, have Auxin-inducible expression profiles [5,9].

3.6. Expression Analysis of OsGH3 Genes in Different Tissues and under Salinity Stress

The expression analysis results revealed that OsGH3 genes showed different expression patterns in different tissues (Figure 7, Table S3). All OsGH3 genes clustered into two major groups based on expression levels (Figure 7A). The genes in Group I (including eight members) showed low expression levels in all tissues, whereas the genes in Group II (including five members) had relatively high expression levels in some tissues. For example, OsGH3-5 showed a high expression level in anther and shoots. OsGH3-4 displayed relatively high expression levels in seed-5 DAP. OsGH3-2 exhibited a high expression level in anther and post-emergence inflorescence. OsGH3-8 exhibited a high expression level in anther, post-emergence inflorescence, and seed-5 DAP (Figure 7A). Besides this, the co-expression network results indicated that there was a strong co-expression relationship network within the GH3 family’s genes and that OsGH3-11, OsGH3-2, and OsGH3-4 were Hub genes in this network.
It is common knowledge that salinity stress is a serious threat to crop yield worldwide [44]. The expression pattern under salinity stress can provide crucial clues to help us identify OsGH3 genes’ functions. Hence, a qRT-PCR analysis at different time points after NaCl treatment was carried out. After NaCl treatment, the expression levels of all OsGH3 genes showed significant changes. The expression patterns of all OsGH3 genes in roots were different from that in leaves (Figure 8). In leaves, the expression levels of OsGH3-1, OsGH3-2, OsGH3-8, and OsGH3-10 were upregulated at all of the tested points and reached the highest at 6 h, 6 h, 24 h, and 24 h, respectively, whereas OsGH3-3, OsGH3-4, OsGH3-7, OsGH3-9, OsGH3-12, and OsGH3-13 were upregulated at two or three time points (Figure 8A). In contrast, the expression levels of OsGH3-5 and OsGH3-11 were downregulated at two or three time points in leaves (Figure 8A). The expression level of OsGH3-6 showed downregulation at all of the tested points in leaves (Figure 8A). In roots, the expression levels of five genes, namely OsGH3-2, OsGH3-4, OsGH3-8, OsGH3-9, and OsGH3-12, were upregulated at all of the tested points and reached the highest at different points, while OsGH3-3, OsGH3-5, OsGH3-7, and OsGH3-10 were upregulated at two or three time points (Figure 8B). Interestingly, OsGH3-1 and OsGH3-13 were upregulated at only one time point, respectively 12 h and 24 h, in roots (Figure 8B). Yet, the expression levels of OsGH3-11 and OsGH3-13 showed downregulation at two or three time points (Figure 8B) in roots. Specifically, we observed that OsGH3-2 and OsGH3-8 were upregulated at all tested points, namely 3 h, 6 h, 12 h, and 24 h in leaves and 3 h, 6 h, 12 h, and 24 h in roots, while OsGH3-6 was downregulated at 3 h, 6 h, 12 h, and 24 h in leaves and at 3 h, 6 h, and 12 h in roots (Figure 8). Overall, the expression profiles in leaves and roots of these genes were different, indicating that OsGH3 genes have different roles under salinity stress.

4. Discussion

The GH3 gene family has been identified in several plants, such as Arabidopsis [9], O. sativa ssp. japonica [11,12,13], Z. mays [7], S. lycopersicum [6], P. patens [8], and S. moellendorffii [8], and it has important effects on plant growth, the plant developmental process, and various stress responses. Unfortunately, the evolutionary analysis of the GH3 gene family in Oryza species has not been well-studied to date. In recent years, the constantly released genomes of various wild rice species provide us with an opportunity to conduct a comprehensive analysis of this important gene family, including their gene structure, conserved motifs, a phylogenetic analysis, chromosome locations, gene duplication events, Ka/Ks ratios, and expression patterns.
The present study demonstrated that the number (13 members) and the gene structure of GH3 genes are strictly conservative across six Oryza species/species. The Oryza species has more GH3 genes than Marchantia polymorpha L. (two, mosses) [45], Physcomitrella patens (two, mosses) [46], Picea abies (seven, gymnosperms), Amborella trichopoda (six, angiosperms), Prunus persica (seven, eudicots), Capsicum annuum (11, eudicots), Vitis vinifera (nine, eudicots), Hordeum vulgare (five, monocots), and Phalaenopsis equestris (six, monocots) [8]. The number of GH3 genes in Oryza species is lower than that in Selaginella moellendorffii (18, ferns), A. thaliana (17, eudicots), Brassica rapa (38, eudicots), S. lycopersicum (17, eudicots), Glycine max (24, eudicots), Elaeis guineensis (16, monocots), and Musa acuminata (18, monocots) [8]. These results revealed that the GH3 genes have been expanded to different degrees in various plants. Additionally, there was no positive correlation between the number of GH3 genes and the size of the specie genome. For instance, the genome size of A. trichopoda is nearly twice that of O. sativa ssp. japonica, while O. sativa ssp. japonica (13) has a larger number of GH3 genes as compared with A. trichopoda (6). Therefore, we speculated that the difference in the number of OsGH3 genes is not related to the size of the genome. Besides this, we also observed an interesting phenomenon in which group III did not exist in mosses, ferns, gymnosperms, and angiosperms, whereas group III existed in eudicots and a few monocots [8], such as Brassicaceae plants. Considering these results, it can be deduced that group III might be the youngest group and originated from group I or group II and that group III could be related to the adaptation of plants to specific environments because group III has a species-specific expansion in various plants.
In the six Oryza species/subspecies, the same duplication events (GH3-1 and GH3-4) were found and duplication events of these six gene pairs were estimated to occur between 23.20 and 31.01 Mya. These results suggest that the expansion of the GH3 gene family might be attributed to duplication events and this expansion could occur in the common ancestors of Oryza species, resulting in similar structures and characteristics among the existing Oryza species. The calculated divergence time (23.20–31.01 Mya) of these duplication events is earlier than the differentiation time (~14 Mya) of Oryza species, while it is close to the origin time (~23.9 Mya) of the rice tribe (Oryzeae) [47,48,49,50]. Thus, it can be further deduced that the GH3 gene family produced these duplication events in a common ancestor of Oryzeae. Interestingly, tandem duplication events (GH3-9 and GH3-10) were only found in O. sativa ssp. japonica and O. nivara. This may be evidence to support the double domestication hypotheses of Chinese-cultivated rice subspecies [49,51,52,53] that O. sativa ssp. japonica originated from O. rufipogon and O. nivara and that O. sativa ssp. indica originated from O. rufipogon [47].
The expression results of different tissues were consistent with previous findings on other species that GH3 genes displayed tissue-specific expression profiles [10,54]. For example, OsGH3-5 showed a high expression level in anther and shoots, implying that OsGH3-5 is involved in anther and shoot development. OsGH3-3 displayed relatively high expression levels in seed-5 DAP, which suggests that OsGH3-3 may be associated with seed development and growth. In addition, OsGH3-2, OsGH3-4, and OsGH3-8 had a high expression level in post-emergence inflorescence, indicating that these three genes may work together on post-emergence inflorescence development. Previous studies have reported that several GH3 genes play crucial roles in biotic and abiotic stress response [5,6,7]. For example, the SbGH3 gene was expressed at a low level under a normal condition, whereas it was substantially enhanced under salt and drought stress [55]. In chickpea CaGH3-1 and -7, and in Medicago MtGH3-7, -8, and -9, expression levels were significantly enhanced under drought or/and salinity stress [7]. In this study, we also found that the expression levels of OsGH3 genes were different under salinity stress. The majority of OsGH3 genes showed upregulation at different time points after NaCl treatment, indicating that OsGH3 genes play important roles in salinity stress response. However, some OsGH3 genes showed different expression profiles in leaves and roots. It can be inferred that the OsGH3 genes have different roles in roots and leaves. In addition, several OsGH3 genes formed a co-expression relationship network. Coincidentally, several genes showed a similar expression trend in the same tissues after NaCl treatment, such as OsGH3-5 and OsGH3-6, in leaves. These results indicated that OsGH3 genes may collaborate with each other in the response to salinity stress. Importantly, OsGH3-2 and OsGH3-8 were significantly upregulated at all the tested points in leaves and roots. OsGH3-1 was upregulated at all the tested points in leaves, while it was upregulated at only one time point in roots. Conversely, OsGH3-9 and OsGH3-12 were upregulated at all the tested points in roots, while they were upregulated at two time points in leaves. Based on these results, we speculate that OsGH3-2 and OsGH3-8 play important roles in leaves and roots and that OsGH3-1 plays a greater role in leaves than in roots under salinity stress, while OsGH3-9 and OsGH3-12 play a greater role in roots than in leaves under salinity stress.
In summary, a systematic analysis of GH3 in six Oryza species/subspecies was performed. The results revealed that the gene structure, conserved motifs, phylogenetic analysis, chromosome location, gene duplication events, and Ka/Ks ratios of the GH3 family were strictly conservative among Oryza species. The expansion of the GH3 family might be attributed to segmental duplication and tandem duplication, and this expansion could have occurred in the common ancestors of Oryza species and can be traced back to the origin time (~23.9 Mya) of the rice tribe (Oryzeae) [47]. The tandem duplication events (GH3-9 and GH3-10) were only found in O. sativa ssp. japonica and O. nivara. This may be evidence to support the double domestication hypotheses of Chinese-cultivated rice subspecies [49]. Similar to previous reports [10,54], OsGH3 genes showed tissue-specific expression. In addition, the qRT-PCR result indicated that OsGH3 genes play vital roles under salinity stress.

Supplementary Materials

The following are available online at https://www.mdpi.com/2223-7747/8/2/30/s1, Table S1: Primers of OsGH3 genes for qRT-PCR in this study. Table S2: The homologous analyses of GH3 genes among different species were carried out using MCscanX software. Table S3: The FPKM (fragments per kilo base of exon per million fragments mapped) values of OsGH3 genes in different tissues.

Author Contributions

W.K. performed all of the experiments, analyzed the data, prepared the figures and tables, and wrote the paper. Y.L. conceived and designed the experiments as well as modified the paper. H.Z., X.D., Y.Z., and C.L. analyzed parts of the data and prepared parts of the figures or tables. M.G. wrote and thoroughly revised the manuscript. Z.G. performed parts of the qRT-PCR experiments. All authors read and approved the final version of the manuscript.

Funding

This study was funded by the National Key Research and Development Program of China (2016YFD0100400), the National Special Key Project for Transgenic Breeding (Grant No. 2016ZX08001001), the 863 program (2014AA10A604-9), and a Key Grant Project of Chinese Ministry of Education Grant (No. 313039).

Conflicts of Interest

The authors declare no conflict of interest.

Ethics Approval and Consent to Participate

The experiments did not involve endangered or protected species. No specific permits were required for these locations/activities.

References

  1. Woodward, A.W.; Bartel, B. Auxin: Regulation, action, and interaction. Ann. Bot. 2005, 95, 707–735. [Google Scholar] [CrossRef] [PubMed]
  2. Baranwal, V.; Negi, N.; Khurana, P. Auxin response factor genes repertoire in mulberry: Identification, and structural, functional and evolutionary analyses. Genes 2017, 8, 202. [Google Scholar] [CrossRef] [PubMed]
  3. Chen, Y.; Xi, H.; Cao, J. Small auxin upregulated RNA (SAUR) gene family in maize: Identification, evolution, and its phylogenetic comparison with Arabidopsis, rice, and sorghum. J. Integr. Plant Biol. 2014, 56, 133–150. [Google Scholar] [CrossRef] [PubMed]
  4. Hagen, G.; Kleinschmidt, A.; Guilfoyle, T. Auxin-regulated gene expression in intact soybean hypocotyl and excised hypocotyl sections. Planta 1984, 162, 147–153. [Google Scholar] [CrossRef]
  5. Staswick, P.E.; Tiryaki, I.; Rowe, M.L. Jasmonate response locus JAR1 and several related Arabidopsis genes encode enzymes of the firefly luciferase superfamily that show activity on Jasmonic, Salicylic, and Indole-3-acetic acids in an assay for adenylation. Plant Cell 2002, 14, 1405–1415. [Google Scholar] [CrossRef] [PubMed]
  6. Kumar, R.; Agarwal, P.; Tyagi, A.K.; Sharma, A.K. Genome-wide investigation and expression analysis suggest diverse roles of Auxin-responsive GH3 genes during development and response to different stimuli in tomato (Solanum lycopersicum). Mol. Genet. Genom. 2012, 287, 221–235. [Google Scholar] [CrossRef]
  7. Singh, V.K.; Jain, M.; Garg, R. Genome-wide analysis and expression profiling suggest diverse roles of GH3 genes during development and abiotic stress responses in legumes. Front. Plant. Sci. 2015, 5, 789. [Google Scholar] [CrossRef]
  8. Zhang, C.; Zhang, L.; Wang, D.; Ma, H.; Liu, B.; Shi, Z.; Ma, X.; Chen, Y.; Chen, Q. Evolutionary history of the glycoside hydrolase 3 (GH3) family based on the sequenced genomes of 48 plants and identification of Jasmonic acid-related GH3 proteins in Solanum tuberosum. Int. J. Mol. Sci. 2018, 19, 1850. [Google Scholar] [CrossRef]
  9. Okrent, R.A.; Brooks, M.D.; Wildermuth, M.C. Arabidopsis GH3.12 (PBS3) conjugates amino acids to 4-substituted benzoates and is inhibited by Salicylate. J. Biol. Chem. 2009, 284, 9742–9754. [Google Scholar] [CrossRef]
  10. Feng, S.; Yue, R.; Tao, Y.; Yang, Y.; Zhang, L.; Xu, M.; Wang, H.; Shen, C. Genome-wide identification, expression analysis of Auxin-responsive GH3 family genes in maize (Zea mays L.) under abiotic stresses. Acta Bot. Sin. 2015, 57, 783–795. [Google Scholar]
  11. Jain, M.; Kaur, N.; Tyagi, A.K.; Khurana, J.P. The Auxin-responsive GH3 gene family in rice (Oryza sativa). Funct. Integr. Genom. 2006, 6, 36–46. [Google Scholar] [CrossRef] [PubMed]
  12. Terol, J.; Domingo, C.; Talón, M. The GH3 family in plants: Genome wide analysis in rice and evolutionary history based on EST analysis. Gene 2006, 371, 279–290. [Google Scholar] [CrossRef] [PubMed]
  13. Fu, J.; Yu, H.; Li, X.; Xiao, J.; Wang, S. Rice GH3 gene family: Regulators of growth and development. Plant Signal. Behav. 2011, 6, 570–574. [Google Scholar] [CrossRef]
  14. Fu, J.; Liu, H.; Li, Y.; Yu, H.; Li, X.; Xiao, J.; Wang, S. Manipulating broad-spectrum disease resistance by suppressing pathogen-induced Auxin accumulation in rice. Plant Signal. Behav. 2011, 155, 589–602. [Google Scholar] [CrossRef] [PubMed]
  15. Ding, X.; Cao, Y.; Huang, L.; Zhao, J.; Xu, C.; Li, X.; Wang, S. Activation of the indole-3-acetic acid-amido synthetase GH3-8 suppresses expansin expression and promotes Salicylate- and Jasmonate-independent basal immunity in rice. Plant Cell 2008, 20, 228–240. [Google Scholar] [CrossRef] [PubMed]
  16. Domingo, C.; Andrés, F.; Tharreau, D.; Iglesias, D.J.; Talón, M. Constitutive expression of OsGH3.1 reduces Auxin content and enhances defense response and resistance to a fungal pathogen in rice. Mol. Plant Microbe Interact. 2009, 22, 201–210. [Google Scholar] [CrossRef] [PubMed]
  17. Zhang, S.; Li, C.; Cao, J.; Zhang, Y.; Zhang, S.; Xia, Y.; Sun, D.; Sun, Y. Altered architecture and enhanced drought tolerance in rice via the down-regulation of Indole-3-acetic acid by TLD1/OsGH3.13 activation. Plant Physiol. 2009, 151, 1889–1901. [Google Scholar] [CrossRef] [PubMed]
  18. Du, H.; Wu, N.; Fu, J.; Wang, S.; Li, X.; Xiao, J.; Xiong, L. A GH3 family member, OsGH3-2, modulates Auxin and Abscisic acid levels and differentially affects drought and cold tolerance in rice. J. Exp. Bot. 2012, 63, 6467–6480. [Google Scholar] [CrossRef] [PubMed]
  19. Yang, J.; Han, S.; Yoon, E.; Lee, W. Evidence of an Auxin signal pathway, microRNA167-ARF8-GH3, and its response to exogenous Auxin in cultured rice cells. Nucleic Acids Res. 2006, 34, 1892–1899. [Google Scholar] [CrossRef] [PubMed]
  20. Zhang, J.; Nallamilli, B.R.; Mujahid, H.; Peng, Z.H. OsMADS6 plays an essential role in endosperm nutrient accumulation and is subject to epigenetic regulation in rice (Oryza sativa). Plant J. 2010, 64, 604–617. [Google Scholar] [CrossRef] [PubMed]
  21. Yadav, S.R.; Khanday, I.; Majhi, B.B.; Veluthambi, K.; Vijayraghavan, U. Auxin-responsive OsMGH3, a common downstream target of OsMADS1 and OsMADS6, controls rice floret fertility. Plant Cell Physiol. 2011, 52, 2123–2135. [Google Scholar] [CrossRef] [PubMed]
  22. Dai, Z.; Wang, J.; Yang, X.; Lu, H.; Miao, X.; Shi, Z. Modulation of plant architecture by the miR156fOsSPL7OsGH3. 8 pathway in rice. J. Exp. Bot. 2018, 69, 5117–5130. [Google Scholar] [CrossRef]
  23. Rafii, M.Y.; Kalhori, N.; Hanafi, M.M.; Sahebi, M.; Mahmud, T.M.M.; Abiri, R.; Azizi, P.; Taheri, S.; Atabaki, N.; Shabanimofrad, M. Improvement of drought tolerance in rice (Oryza sativa L.): Genetics, genomic tools, and the WRKY gene family. Biomed. Res. Int. 2018, 4, 1–20. [Google Scholar]
  24. Lavania, D.; Dhingra, A.; Grover, A. Analysis of transactivation potential of rice (Oryza sativa L.) heat shock factors. Planta 2018, 247, 1–10. [Google Scholar] [CrossRef] [PubMed]
  25. Brozynska, M.; Copetti, D.; Furtado, A.; Wing, R.A.; Crayn, D.; Fox, G.; Ishikawa, R.; Henry, R.J. Sequencing of Australian wild rice genomes reveals ancestral relationships with domesticated rice. Plant Biotechnol. J. 2017, 15, 765–774. [Google Scholar] [CrossRef] [PubMed] [Green Version]
  26. Vaughan, D.A.; Morishima, H.; Kadowaki, K. Diversity in the Oryza genus. Curr. Opin. Plant Biol. 2003, 6, 139–146. [Google Scholar] [CrossRef]
  27. Kong, W.; Yang, S.; Wang, Y.; Bendahmane, M.; Fu, X. Genome-wide identification and characterization of aquaporin gene family in Beta vulgaris. PeerJ 2017, 5, e3747. [Google Scholar] [CrossRef]
  28. Cao, Y.; Meng, D.; Chen, Y.; Abdullah, M.; Jin, Q.; Lin, Y.; Cai, Y. Comparative and expression analysis of ubiquitin conjugating domain-containing genes in two Pyrus species. Cells 2018, 7, 77. [Google Scholar] [CrossRef]
  29. Kong, W.; Bendahmane, M.; Fu, X. Genome-wide identification and characterization of aquaporins and their role in the flower opening processes in carnation (Dianthus caryophyllus). Molecules 2018, 23, 1895. [Google Scholar] [CrossRef]
  30. Verma, J.; Wardhan, V.; Singh, D.; Chakraborty, S.; Chakraborty, N. Genome-wide identification of the Alba gene family in plants and stress-responsive expression of the rice Alba genes. Genes 2018, 9, 183. [Google Scholar] [CrossRef]
  31. Mohanta, T.; Mohanta, N.; Bae, H. Identification and expression analysis of PIN-like (PILS) gene family of rice treated with Auxin and Cytokinin. Genes 2015, 6, 622–640. [Google Scholar] [CrossRef]
  32. Chen, C.; Xia, R.; Chen, H.; He, Y. TBtools, a toolkit for biologists integrating various HTS-data handling tools with a user-friendly interface. bioRxiv 2018, 289660. [Google Scholar] [CrossRef]
  33. Wang, Y.; Tang, H.; Debarry, J.D.; Tan, X.; Li, J.; Wang, X.; Lee, T.H.; Jin, H.; Marler, B.; Guo, H. MCScanX: A toolkit for detection and evolutionary analysis of gene synteny and collinearity. Nucleic Acids Res. 2012, 40, e49. [Google Scholar] [CrossRef] [PubMed]
  34. Krzywinski, M.; Schein, J.; Birol, I.; Connors, J.; Gascoyne, R.; Horsman, D.; Jones, S.J.; Marra, M.A. Circos: An information aesthetic for comparative genomics. Genome Res. 2009, 19, 1639–1645. [Google Scholar] [CrossRef] [Green Version]
  35. Librado, P.; Rozas, J. DnaSP v5: A software for comprehensive analysis of DNA polymorphism data. Bioinformatics 2009, 25, 1451–1452. [Google Scholar] [CrossRef] [PubMed]
  36. Luo, S.; Hu, W.; Yue, W.; Liu, B.; Yan, H.; Yan, X. Genome-wide identification, classification, and expression of phytocyanins in Populus trichocarpa. Planta 2018, 247, 1133–1148. [Google Scholar] [CrossRef] [PubMed]
  37. Lescot, M.; Dehais, P.; Thijs, G.; Marchal, K.; Moreau, Y.; Van de Peer, Y.; Rouze, P.; Rombauts, S. PlantCARE, a database of plant cis-acting regulatory elements and a portal to tools for in silico analysis of promoter sequences. Nucleic Acids Res. 2002, 30, 325–327. [Google Scholar] [CrossRef] [PubMed] [Green Version]
  38. Ye, J.; Fang, L.; Zheng, H.; Zhang, Y.; Chen, J.; Zhang, Z.; Wang, J.; Li, S.; Li, R.; Bolund, L. WEGO: A web tool for plotting GO annotations. Nucleic Acids Res. 2006, 34, W293–W297. [Google Scholar] [CrossRef]
  39. Kanehisa, M.; Goto, S. KEGG: Kyoto encyclopaedia of genes and genomes. Nucleic Acids Res. 2000, 28, 27–30. [Google Scholar] [CrossRef]
  40. Trapnell, C.; Roberts, A.; Goff, L.; Pertea, G.; Kim, D.; Kelley, D.R.; Pimentel, H.; Salzberg, S.L.; Rinn, J.L.; Pachter, L. Differential gene and transcript expression analysis of RNA-seq experiments with TopHat and Cufflinks. Nat. Protoc. 2012, 7, 562. [Google Scholar] [CrossRef]
  41. Tran, L.S.; Nakashima, K.; Sakuma, Y.; Osakabe, Y.; Qin, F.; Simpson, S.D.; Maruyama, K.; Fujita, Y.; Shinozaki, K.; Yamaguchishinozaki, K. Co-expression of the stress-inducible zinc finger homeodomain ZFHD1 and NAC transcription factors enhances expression of the ERD1 gene in Arabidopsis. Plant J. 2010, 49, 46–63. [Google Scholar] [CrossRef]
  42. Walther, D.; Brunnemann, R.; Selbig, J. The regulatory code for transcriptional response diversity and its relation to genome structural properties in A. thaliana. PLoS Genet. 2007, 3, e11. [Google Scholar] [CrossRef] [PubMed]
  43. Abdullah, M.; Cao, Y.; Cheng, X.; Meng, D.; Chen, Y.; Shakoor, A.; Gao, J.; Cai, Y. The sucrose synthase gene family in chinese pear (Pyrus bretschneideri Rehd.): Structure, expression, and evolution. Molecules 2018, 23, 1144. [Google Scholar] [CrossRef] [PubMed]
  44. Parihar, P.; Singh, S.; Singh, R.; Singh, V.P.; Prasad, S.M. Effect of salinity stress on plants and its tolerance strategies: A review. Environ. Sci. Pollut. Res. 2015, 22, 4056–4075. [Google Scholar] [CrossRef]
  45. Bowman, J.L.; Kohchi, T.; Yamato, K.T.; Jenkins, J.; Shu, S.; Ishizaki, K.; Yamaoka, S.; Nishihama, R.; Nakamura, Y.; Berger, F. Insights into land plant evolution garnered from the Marchantia polymorpha genome. Cell 2017, 171, 287–304. [Google Scholar] [CrossRef] [PubMed]
  46. Bierfreund, N.M.; Tintelnot, S.; Reski, R.; Decker, E.L. Loss of GH3 function does not affect phytochrome-mediated development in a moss, Physcomitrella patens. J. Plant Physiol. 2004, 161, 823–835. [Google Scholar] [CrossRef] [PubMed]
  47. Tang, L.; Zou, X.H.; Achoundong, G.; Potgieter, C.; Second, G.; Zhang, D.Y.; Ge, S. Phylogeny and biogeography of the rice tribe (Oryzeae): Evidence from combined analysis of 20 chloroplast fragments. Mol. Phylogenet. Evol. 2010, 54, 266–277. [Google Scholar] [CrossRef]
  48. Stein, J.C.; Yu, Y.; Copetti, D.; Zwickl, D.J.; Zhang, L.; Zhang, C.; Chougule, K.; Gao, D.; Iwata, A.; Goicoechea, J.L. Genomes of 13 domesticated and wild rice relatives highlight genetic conservation, turnover and innovation across the genus Oryza. Nat. Genet. 2018, 7, 285–296. [Google Scholar] [CrossRef]
  49. Choi, J.Y.; Platts, A.E.; Fuller, D.Q.; Hsing, Y.I.; Wing, R.A.; Purugganan, M.D. The rice paradox: Multiple origins but single domestication in Asian rice. Mol. Biol. Evol. 2017, 34, 969–979. [Google Scholar] [CrossRef]
  50. Kim, K.; Lee, S.-C.; Lee, J.; Yu, Y.; Yang, K.; Choi, B.-S.; Koh, H.-J.; Waminal, N.E.; Choi, H.-I.; Kim, N.-H. Complete chloroplast and ribosomal sequences for 30 accessions elucidate evolution of Oryza AA genome species. Sci. Rep. 2015, 5, 15655. [Google Scholar] [CrossRef]
  51. Kovach, M.J.; Sweeney, M.T.; Mccouch, S.R. New insights into the history of rice domestication. Trends Genet. 2007, 23, 578–587. [Google Scholar] [CrossRef] [PubMed]
  52. Londo, J.P.; Yu-Chung, C.; Kuo-Hsiang, H.; Tzen-Yuh, C.; Schaal, B.A. Phylogeography of Asian wild rice, Oryza rufipogon, reveals multiple independent domestications of cultivated rice, Oryza sativa. Proc. Natl. Acad. Sci. USA 2006, 103, 9578–9583. [Google Scholar] [CrossRef] [PubMed]
  53. Wei, X.; Qiao, W.H.; Chen, Y.T.; Wang, R.S.; Cao, L.R.; Zhang, W.X.; Yuan, N.N.; Li, Z.C.; Zeng, H.L.; Yang, Q.W. Domestication and geographic origin of Oryza sativa in China: Insights from multilocus analysis of nucleotide variation of O. sativa and O. rufipogon. Mol. Ecol. 2012, 21, 5073–5087. [Google Scholar] [CrossRef] [PubMed]
  54. Yang, Y.; Yue, R.; Sun, T.; Zhang, L.; Chen, W.; Zeng, H.; Wang, H.; Shen, C. Genome-wide identification, expression analysis of GH3 family genes in Medicago truncatula under stress-related hormones and Sinorhizobium meliloti infection. Appl. Microbiol. Biotechnol. 2015, 99, 841–854. [Google Scholar] [CrossRef] [PubMed]
  55. Wang, S.; Bai, Y.; Shen, C.; Wu, Y.; Zhang, S.; Jiang, D.; Guilfoyle, T.J.; Chen, M.; Qi, Y. Auxin-related gene families in abiotic stress response in Sorghum bicolor. Funct. Integr. Genom. 2010, 10, 533–546. [Google Scholar] [CrossRef] [PubMed]
Figure 1. (A) A phylogenetic tree of GH3 protein sequences from five Oryza species and Arabidopsis. (B) A phylogenetic tree of GH3 protein sequences from six Oryza species/subspecies. Clustal W is used for multiple sequence alignment. MEGA 6.0 is adopted for phylogenetic reconstruction by using the Neighbor Joining (NJ) clustering method. Bootstrap numbers (1000 replicates) are shown. Different colors of circles represent different subfamilies. The different species are indicated by different shaped markers.
Plants 08 00030 g001
Figure 2. The phylogenetic tree (A), motif compositions (B), and exon/intron structure (C) of the GH3 genes in six Oryza species/subspecies. (A) Sequence alignments and the NJ-Phylogenetic trees were made using ClustalW and MEGA 6.0, respectively. A bootstrap number (1000 replicates) is adopted. The red and green colors in the phylogenetic tree represent group1 and group2, respectively. (B,C) The widths of the grey bars represent the relative lengths of genes and proteins. The green boxes and grey lines display exons and introns, respectively.
Plants 08 00030 g002
Figure 3. The chromosome location and duplication events of GH3 genes in six species/subspecies (A–F), and duplication events in six Oryza species/subspecies (G). Os represents Oryza sativa ssp. japonica. Oi represents Oryza sativa ssp. indica. Or represents Oryza rufipogon. On represents Oryza nivara. Op represents Oryza punctata. Og represents Oryza glumaepatula. The chromosomes of different Oryza species/subspecies are shown by different colors. The location of each GH3 gene is marked with a grey line using Circos software. The whole genome duplication (WGD) or segmental duplication/Tandem duplication gene pairs are linked by blue/red lines. The red and green genes in A–F belong to group1 and group2, respectively.
Plants 08 00030 g003
Figure 4. The collinear gene pairs across six Oryza species/subspecies. The chromosome colors and abbreviations of species are the same as in Figure 3. The red lines represent collinear gene pairs.
Plants 08 00030 g004
Figure 5. Identification of cis-acting elements in all GH3 genes of Oryza sativa ssp. japonica. (A) The different bars represent different primary categories, the different characters represent different secondary categories, and the different colors in histograms represent the number of different promoter elements in each secondary category. (B) Pie charts of different sizes indicate the ratio of each primary/secondary category. (C) The different groups of GH3 genes in the phylogenetic tree are shown by different colors. The differently colored boxes represent the different secondary categories.
Plants 08 00030 g005
Figure 6. Gene ontology classification and KEGG pathway annotation of OsGH3 genes. (A) The Y-axis indicates the actual gene number and the X-axis indicates three categories (cellular component, molecular function, and biological process). (B) The OsGH3-gene-related KEGG pathways are marked in red.
Plants 08 00030 g006
Figure 7. Expression profiles of OsGH3 genes in different tissues (A) and a co-expression network diagram of OsGH3 genes in different tissues. (A) The color scale at the bottom of the image represents log2FPKM; red indicates a high level; and green represents a low level of transcript abundance. (B) The Correlation from weak to strong is shown by dotted line to solid line. Connectivity from weak to strong is shown from green to red. DAP, days after pollination.
Plants 08 00030 g007
Figure 8. The expression pattern of the 13 OsGH3 genes in ‘Nipponbare’ seedling leaf (A) and root (B) after NaCl treatment for 0 h, 3 h, 6 h, 12 h, and 24 h. The 2−ΔΔCT method was adopted to calculate the fold change of OsGH3 gene expression from three biological replicates. The error bars show the standard deviations of the three independent qRT-PCR biological replicates. * represents a significant difference relative to the 0 h group (p < 0.05).
Plants 08 00030 g008
Table 1. GH3 genes identified in six Oryza species/subspecies.
SpeciesNameGene IdentifierCHRCHR.startCHR.endSubfamily
Oryza sativa ssp. japonicaOsGH3-3LOC_Os01g12160.1Oschr16,624,9636,630,462Group1
OsGH3-5LOC_Os05g50890.1Oschr529,200,19829,205,717Group1
OsGH3-6LOC_Os05g05180.2Oschr52,522,9032,525,214Group1
OsGH3-12LOC_Os11g08340.1Oschr114,401,4924,403,522Group1
OsGH3-1LOC_Os01g57610.1Oschr133,308,44833,311,391Group2
OsGH3-2LOC_Os01g55940.1Oschr132,221,37632,225,123Group2
OsGH3-4LOC_Os05g42150.1Oschr524,643,51624,646,086Group2
OsGH3-7LOC_Os06g30440.1Oschr617,586,89917,590,682Group2
OsGH3-8LOC_Os07g40290.1Oschr724,149,64924,152,079Group2
OsGH3-9LOC_Os07g38890.1Oschr723,325,19723,327,227Group2
OsGH3-10LOC_Os07g38860.1Oschr723,314,48223,319,154Group2
OsGH3-11LOC_Os07g47490.1Oschr728,391,72528,400,307Group2
OsGH3-13LOC_Os11g32520.1Oschr1119,188,56519,190,125Group2
Oryza sativa ssp. indicaOiGH3-3BGIOSGA002109-PAOichr17,084,8917,089,830Group1
OiGH3-5BGIOSGA020457-PAOichr530,569,92130,572,557Group1
OiGH3-6BGIOSGA018825-PAOichr52,768,2502,770,394Group1
OiGH3-12BGIOSGA034955-PAOichr114,242,5224,244,552Group1
OiGH3-1BGIOSGA004585-PAOichr136,754,83936,756,946Group2
OiGH3-2BGIOSGA004510-PAOichr135,535,34535,538,565Group2
OiGH3-4BGIOSGA017778-PAOichr526,098,76026,100,739Group2
OiGH3-7BGIOSGA021194-PAOichr618,602,73918,606,054Group2
OiGH3-8BGIOSGA023979-PAOichr722,260,57022,262,481Group2
OiGH3-9BGIOSGA024029-PAOichr721,410,89221,414,347Group2
OiGH3-10BGIOSGA025998-PAOichr721,402,46121,402,912Group2
OiGH3-11BGIOSGA023736-PAOichr726,392,48226,397,014Group2
OiGH3-13BGIOSGA03388PAOichr1115,962,36915,968,186Group2
Oryza rufipogonOrGH3-3ORUFI01G08270.1Orchr16,148,9666,153,847Group1
OrGH3-5ORUFI05G29440.1Orchr525,858,36125,864,126Group1
OrGH3-6ORUFI05G03070.1Orchr52,229,7252,232,983Group1
OrGH3-12ORUFI11G05180.1Orchr114,022,5564,024,586Group1
OrGH3-1ORUFI01G36550.1Orchr130,644,22630,646,778Group2
OrGH3-2ORUFI01G35260.1Orchr129,632,34029,636,282Group2
OrGH3-4ORUFI05G23110.1Orchr521,592,62621,594,605Group2
OrGH3-7ORUFI06G16960.1Orchr616,046,44616,049,761Group2
OrGH3-8ORUFI07G21680.1Orchr721,004,76521,006,676Group2
OrGH3-9ORUFI07G20520.1Orchr720,243,06920,244,953Group2
OrGH3-10ORUFI07G20500.1Orchr720,233,90720,238,965Group2
OrGH3-11ORUFI07G26860.1Orchr724,893,28624,900,088Group2
OrGH3-13ORUFI11G16590.1Orchr1119,413,08419,420,302Group2
Oryza nivaraOnGH3-3ONIVA01G09800.1Onchr17,585,0197,589,913Group1
OnGH3-5ONIVA05G29530.1Onchr527,396,67127,402,904Group1
OnGH3-6ONIVA05G02860.1Onchr52,172,4652,175,724Group1
OnGH3-12ONIVA11G05730.1Onchr114,716,8854,718,915Group1
OnGH3-1ONIVA01G38150.1Onchr132,674,09932,677,412Group2
OnGH3-2ONIVA01G36390.1Onchr131,322,60931,326,729Group2
OnGH3-4ONIVA05G22520.1Onchr522,188,29522,190,274Group2
OnGH3-7ONIVA06G18950.1Onchr617,364,60517,367,911Group2
OnGH3-8ONIVA07G19200.1Onchr718,453,79218,455,703Group2
OnGH3-9ONIVA07G18070.1Onchr717,588,41117,591,865Group2
OnGH3-10ONIVA07G18060.1Onchr717,579,62017,585,886Group2
OnGH3-11ONIVA07G25530.1Onchr723,284,87823,289,419Group2
OnGH3-13ONIVA11G14940.1Onchr1116,487,97416,493,787Group2
Oryza punctataOpGH3-3OPUNC01G07310.1Opchr16,025,9166,031,401Group1
OpGH3-5OPUNC05G25060.1Opchr530,476,51830,480,678Group1
OpGH3-6OPUNC05G02820.1Opchr52,336,6892,340,237Group1
OpGH3-12OPUNC11G05160.1Opchr114,742,4634,744,418Group1
OpGH3-1OPUNC01G32450.1Opchr135,758,42535,761,223Group2
OpGH3-2OPUNC01G31080.1Opchr134,433,99234,437,877Group2
OpGH3-4OPUNC05G19440.1Opchr526,021,39326,023,350Group2
OpGH3-7OPUNC06G12520.1Opchr613,614,32513,618,401Group2
OpGH3-8OPUNC07G19610.1Opchr726,181,74526,183,673Group2
OpGH3-9OPUNC07G18650.1Opchr725,197,94625,199,823Group2
OpGH3-11OPUNC07G24330.1Opchr729,891,76029,898,273Group2
OpGH3-13OPUNC11G12860.1Opchr1120,394,63820,400,442Group2
Oryza glumaepatulaOgGH3-3OGLUM01G08700.1Ogchr17,724,2497,730,000Group1
OgGH3-5OGLUM05G28990.1Ogchr529,839,31629,844,943Group1
OgGH3-6OGLUM05G02960.1Ogchr52,520,0302,523,301Group1
OgGH3-12OGLUM11G05200.1Ogchr114,202,8894,204,936Group1
OgGH3-1OGLUM01G37610.1Ogchr136,364,85136,367,411Group2
OgGH3-2OGLUM01G36180.1Ogchr135,099,33535,107,582Group2
OgGH3-4OGLUM05G23040.1Ogchr525,041,85325,043,832Group2
OgGH3-8OGLUM07G20630.1Ogchr723,059,91123,061,822Group2
OgGH3-9OGLUM07G19490.1Ogchr722,131,58022,133,468Group2
OgGH3-10OGLUM07G19470.1Ogchr722,122,12822,126,771Group2
OgGH3-11OGLUM07G25930.1Ogchr727,048,55327,056,767Group2
OgGH3-13OGLUM11G14980.1Ogchr1118,442,62018,448,411Group2
Note: CHR/chr in Table 1 represents chromosome. Os represents Oryza sativa ssp. japonica. Oi represents Oryza sativa ssp. indica. Or represents Oryza rufipogon. On represents Oryza nivara. Op represents Oryza punctata. Og represents Oryza glumaepatula. The full length of BGIOSGA025998-PA is obtained by integrating BGIOSGA025998-PA and BGIOSGA025998-PA based on the R498 genome annotation.
Table 2. Ka, Ks, and Ka/Ks values for the duplication gene pairs from six Oryza species/subspecies.
Seq1Seq2KsKaKa/Ks RatioDate (MY)Duplication Type
OiGH3-1OiGH3-40.56440.2070.36731.010989WGD or segmental duplication
OsGH3-1OsGH3-40.42740.12510.29323.483516WGD or segmental duplication
OgGH3-1OgGH3-40.42230.12730.30123.203297WGD or segmental duplication
OnGH3-1OnGH3-40.42370.12690.30023.28022WGD or segmental duplication
OpGH3-1OpGH3-40.47540.12450.26226.120879WGD or segmental duplication
OrGH3-1OrGH3-40.41980.12520.29823.065934WGD or segmental duplication
OiGH3-10OiGH3-90.24070.13650.56713.225275Tandem duplication
OnGH3-10OnGH3-90.250.12740.51013.736264Tandem duplication

