Article

Effect of Elevated CO2 Concentration on the Disease Severity of Compatible and Incompatible Interactions of Brassica napusLeptosphaeria maculans Pathosystem

1
Department of Plant Science, University of Manitoba, 66 Dafoe Road, Winnipeg, MB R3T 2N2, Canada
2
College of Plant Protection, Jilin Agricultural University, Changchun, Jilin 130118, China
*
Author to whom correspondence should be addressed.
Plants 2019, 8(11), 484; https://doi.org/10.3390/plants8110484
Submission received: 14 October 2019 / Revised: 3 November 2019 / Accepted: 5 November 2019 / Published: 8 November 2019
(This article belongs to the Special Issue 2019 Feature Papers by Plants’ Editorial Board Members)

Abstract

:
Global warming by increased atmospheric CO2 concentration has been widely accepted. Yet, there has not been any consistent conclusion on the doubled CO2 concentration that in the future will affect plant disease incidence and severity. Blackleg disease, mainly caused by Leptosphaeria maculans, is a major disease on canola production globally. Brassica napus and L. maculans have a gene-for-gene interaction, which causes an incompatible reaction between canola plants carrying resistance genes and L. maculans isolates carrying corresponding avirulence genes. In this study, B. napus varieties and lines inoculated with different Leptosphaeria isolates were subjected to simulated growth conditions, namely, growth chambers with normal environments and with controlled CO2 concentrations of 400, 600, and 800 ppm. The results indicated that the elevated CO2 concentrations have no noticeable effect on the inferred phenotypes of the canola–blackleg interactions. However, the disease severity decreased in most of the B. napusL. maculans interactions at extremely high CO2 concentration (800 ppm). The varied pathogenicity changes of the B. napus–L. maculans pathosystem under elevated CO2 concentrations at 400 or 600 ppm may be due to the genetic background or physiological differences in plants and pathogenicity differences in L. maculans isolates having different Avr gene profiles. The mechanisms by which elevated CO2 concentrations affect the B. napus–L. maculans pathosystem will help us understand how climate change will impact crops and diseases.

1. Introduction

Climate change is an important dynamic that will affect food production globally. The atmosphere’s elevated concentration of CO2, one of the most important climate change influences, is due to anthropogenic emissions [1]. The concentration of CO2 has been increasing and is predicted to double at the end of this century by the Intergovernmental Panel on Climate Change (IPCC) [2]. Levels will climb from the current level of 380 µmol/mol to 730–1020 µmol/mol [3]. The effects of rising CO2 concentrations on crop growth and physiological processes have been extensively studied [4,5,6,7]. For instance, rising CO2 can enhance the physiological performance of Brassica napus seedlings under optimal water supply [8]. Li et al. (2017) reported that increased CO2 could alter green tea quality by the stimulation of primary and secondary metabolism [9]. They found that the higher concentration of CO2 could enhance photosynthesis, C:N ratio, Rubisco carboxylation activity, water-use efficiency, and final yield or quality [6,8,9,10,11].
Plant disease symptoms in pathosystems are influenced by, or require, three components—a susceptible host, an aggressive or virulent pathogen, and a conducive environment for the pathogen to cause disease [12,13]. Thus, the variations in environmental conditions, including CO2 concentration change, may potentially affect plant disease susceptibility and severity. A couple of studies have investigated the elevated CO2 concentration effects on plant–pathogen interactions. The exposure of tomato plants to elevated CO2 led to a lower disease incidence and severity caused by tomato (Solanum lycopersicum) mosaic virus (TMV) and Pseudomonas syringae. However, the plant’s susceptibility to necrotrophic Botrytis cinerea was increased [14]. Ferrocino et al. (2013) found that increased CO2 concentration had no detectable impact on the Fusarium wilt of lettuce (Lactuca sativa) or the abundance of Fusarium spp. [15]. The leaf spot disease incidence and severity always increased in redbud (Cercis canadensis) and sweetgum trees (Liquidambar styraciflua) under increased CO2 concentration in a five–year survey [16]. Elevated CO2 reduced the disease incidence and severity significantly in the red maple fungal pathogen Phyllosticta minima [13]. The species diversity of foliar fungal plant disease decreased when the CO2 concentration increased [17]. The disease incidence and severity of rocket plants (Eruca sativa) caused by Fusarium oxysporum increased under elevated CO2 conditions with controlled temperatures [18]. Considering the above, it is difficult to find a consistent pattern to the effects of elevated CO2 concentration on disease incidence and severity in plants.
Canola (Brassica napus) is one of the most important cash crops in Canada, reaching a production of 20.3 MMT in 2018 (Canola Council of Canada). Blackleg, caused by the fungal pathogen Leptosphaeria maculans, is one of the most important and devastating diseases in canola worldwide, which causes significant yield loss [19]. The incidence and severity of blackleg disease in canola vary with the geographic distribution, varieties, crop rotation, and climate conditions. This disease has been controlled historically by crop rotation and the utilization of canola varieties with major gene resistances [20,21]. A gene–for–gene interaction has been reported between B. napus with a certain R gene and its corresponding avirulence gene (Avr) in the L. maculans isolate [22,23]. This pathosystem brings incompatible and compatible interactions in the canola plant, with and without a certain R gene, respectively, that can defend against the L. maculans pathogen with the corresponding Avr gene. Currently, a total of 16 Avr genes have been identified in L. maculans [24,25,26,27,28]. Corresponding to the Avr genes in L. maculans, various major resistance genes in Brassica spp. have been identified [29,30,31,32,33]. Apart from the qualitative resistance (major gene resistance), the effect of quantitative resistance against an isolate of L. maculans in selected Canadian canola cultivars under increased temperature was investigated [34]. Very few studies have reported on the effects of environmental changes, especially the CO2 concentration, on the interactions of the B. napus–L. maculans pathosystem. In this study, we conducted experiments in controlled-environment rooms with three different CO2 concentrations of 400, 600, and 800 ppm. The aims were to understand the effects of elevated CO2 on (1) the compatible and incompatible interactions between B. napus and L. maculans isolates; (2) the disease severities of the susceptible and resistant canola varieties; and (3) the pathogenicity of different isolates carrying different Avr gene races.

2. Results

2.1. Inferred Phenotyping

The mean rating scores and their inferred disease resistance for the seedlings of B. napus varieties and lines had different variations based on the inoculum and CO2 concentrations (Table 1). L. maculans isolate D5, which carries AvrLm1-2-4-7-S-LepR1-LepR2, showed susceptible (S) and intermediate resistance (IR) on B. napus line 1065 under CO2 concentrations of 400 and 800 ppm, respectively, whereas it showed a resistance (R) reaction under a normal environment (NE) and a CO2 concentration of 600 ppm. The inferred plant phenotypes of L. maculans isolate D10 (AvrLm5-6-7-LepR1) inoculated onto B. napus varieties and lines 1135 and 01-23-2-1 carrying LepR2 and Rlm7 genes, respectively, were changed from susceptible into intermediate resistance at the highest CO2 concentration (800 ppm). The DM118 isolate showed a high disease rating score of 6.00 (IR) at the 600 ppm concentration of CO2 when inoculated onto the B. napus 1065 line. The disease rating score was decreased to 5.25 under 800 ppm CO2 when the DS103 isolate was inoculated onto B. napus line 1065. A CRISPR mutant isolate umavr7 produced from DS103 showed intermediate resistance (5.25) in B. napus variety or line 1065 under 400 ppm, reduced from a susceptible reaction (8.33, NE; 6.67, 600 ppm; 8.00, 800 ppm). In addition, it was also reduced when CO2 concentrations increased from 400 to 800 ppm (Table 1). Usually, the L. biglobosa isolate is considered as non–aggressive or less virulent to B. napus. In this study, we found that L. biglobosa showed intermediate resistance on B. napus line 1135 under a normal environment and 600 ppm CO2, and under a normal environment in both B. napus varieties and lines 02-22-2-1 and Goé Land (Table 1).

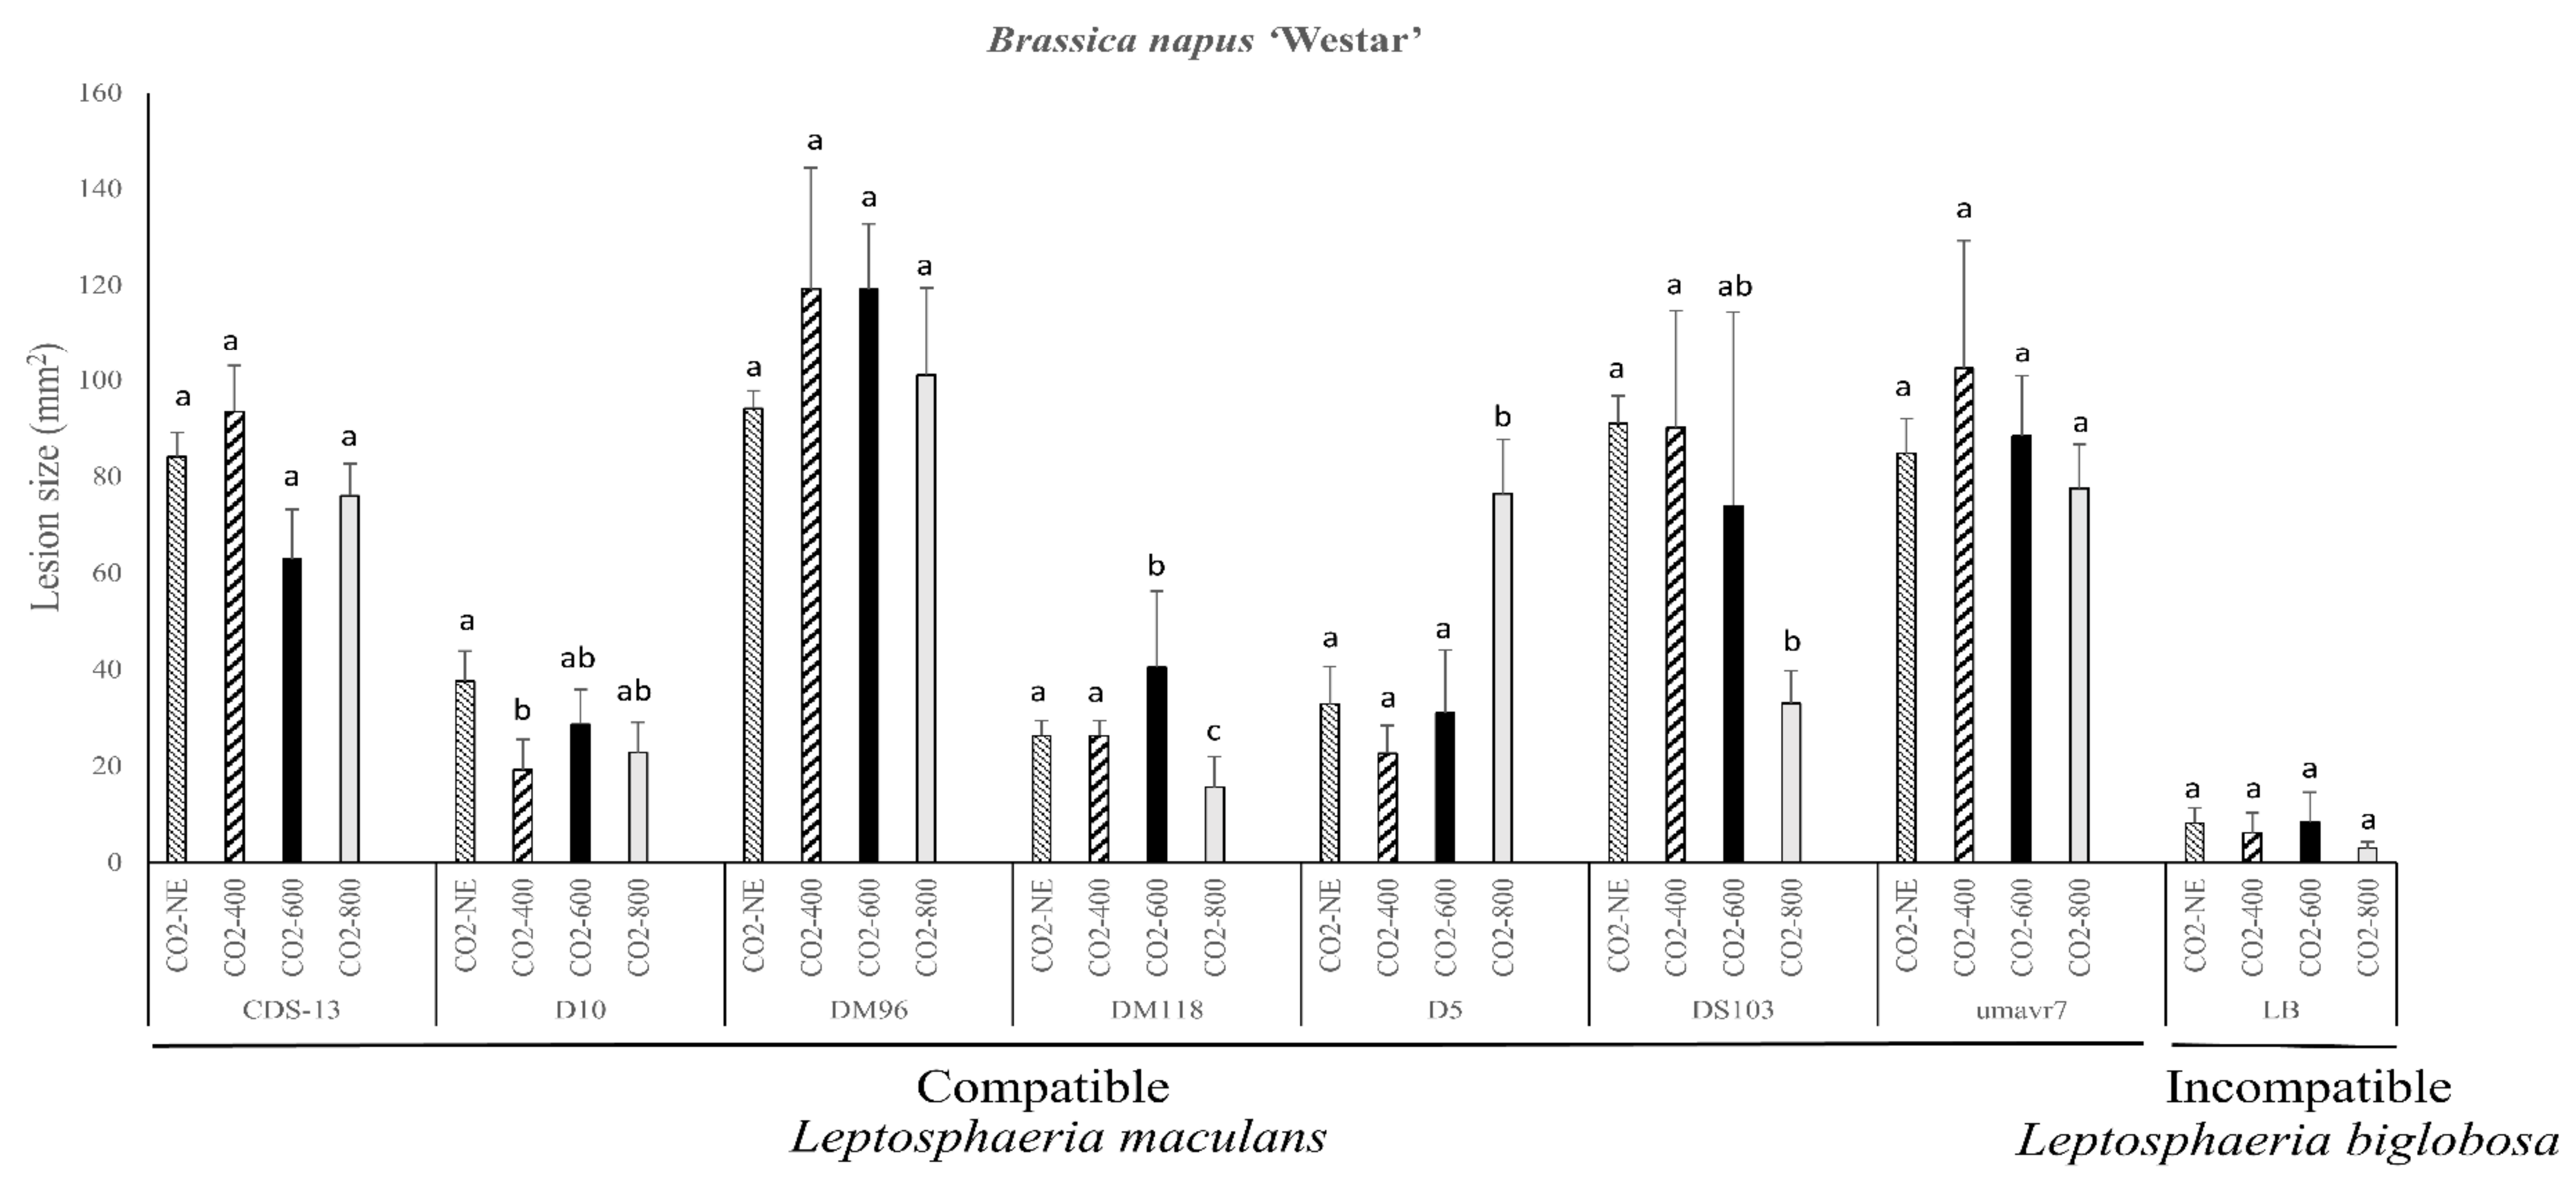
2.2. Pathogenicity Evaluation of the Susceptible B. napus Variety Westar

The L. biglobosa isolate, which is avirulent to the canola plants, did not show any significant lesion size change under different CO2 concentrations on B. napus variety Westar. The lesion size decreased slightly when the CO2 concentration was increased to 800 ppm (Figure 1). All the other seven involved L. maculans isolates showed virulence and clear disease symptoms on B. napus variety Westar. The cotyledon lesion size caused by L. maculans isolate D10 was significantly decreased under 400 ppm of CO2. The largest lesion size caused by DM118 was under 600 ppm of CO2. This was significantly larger than those produced under a normal environment, 400 ppm, and 800 ppm. The D5 isolate caused a significantly larger lesion size when the CO2 concentration increased to 800 ppm. In contrast, the lesion size caused by isolate DS103 was significantly smaller under 800 ppm (Figure 1). The lesion size caused by L. maculans isolates CDS-13, DM96, and umavr7 had no significant change under the four different CO2 concentrations (Figure 1).

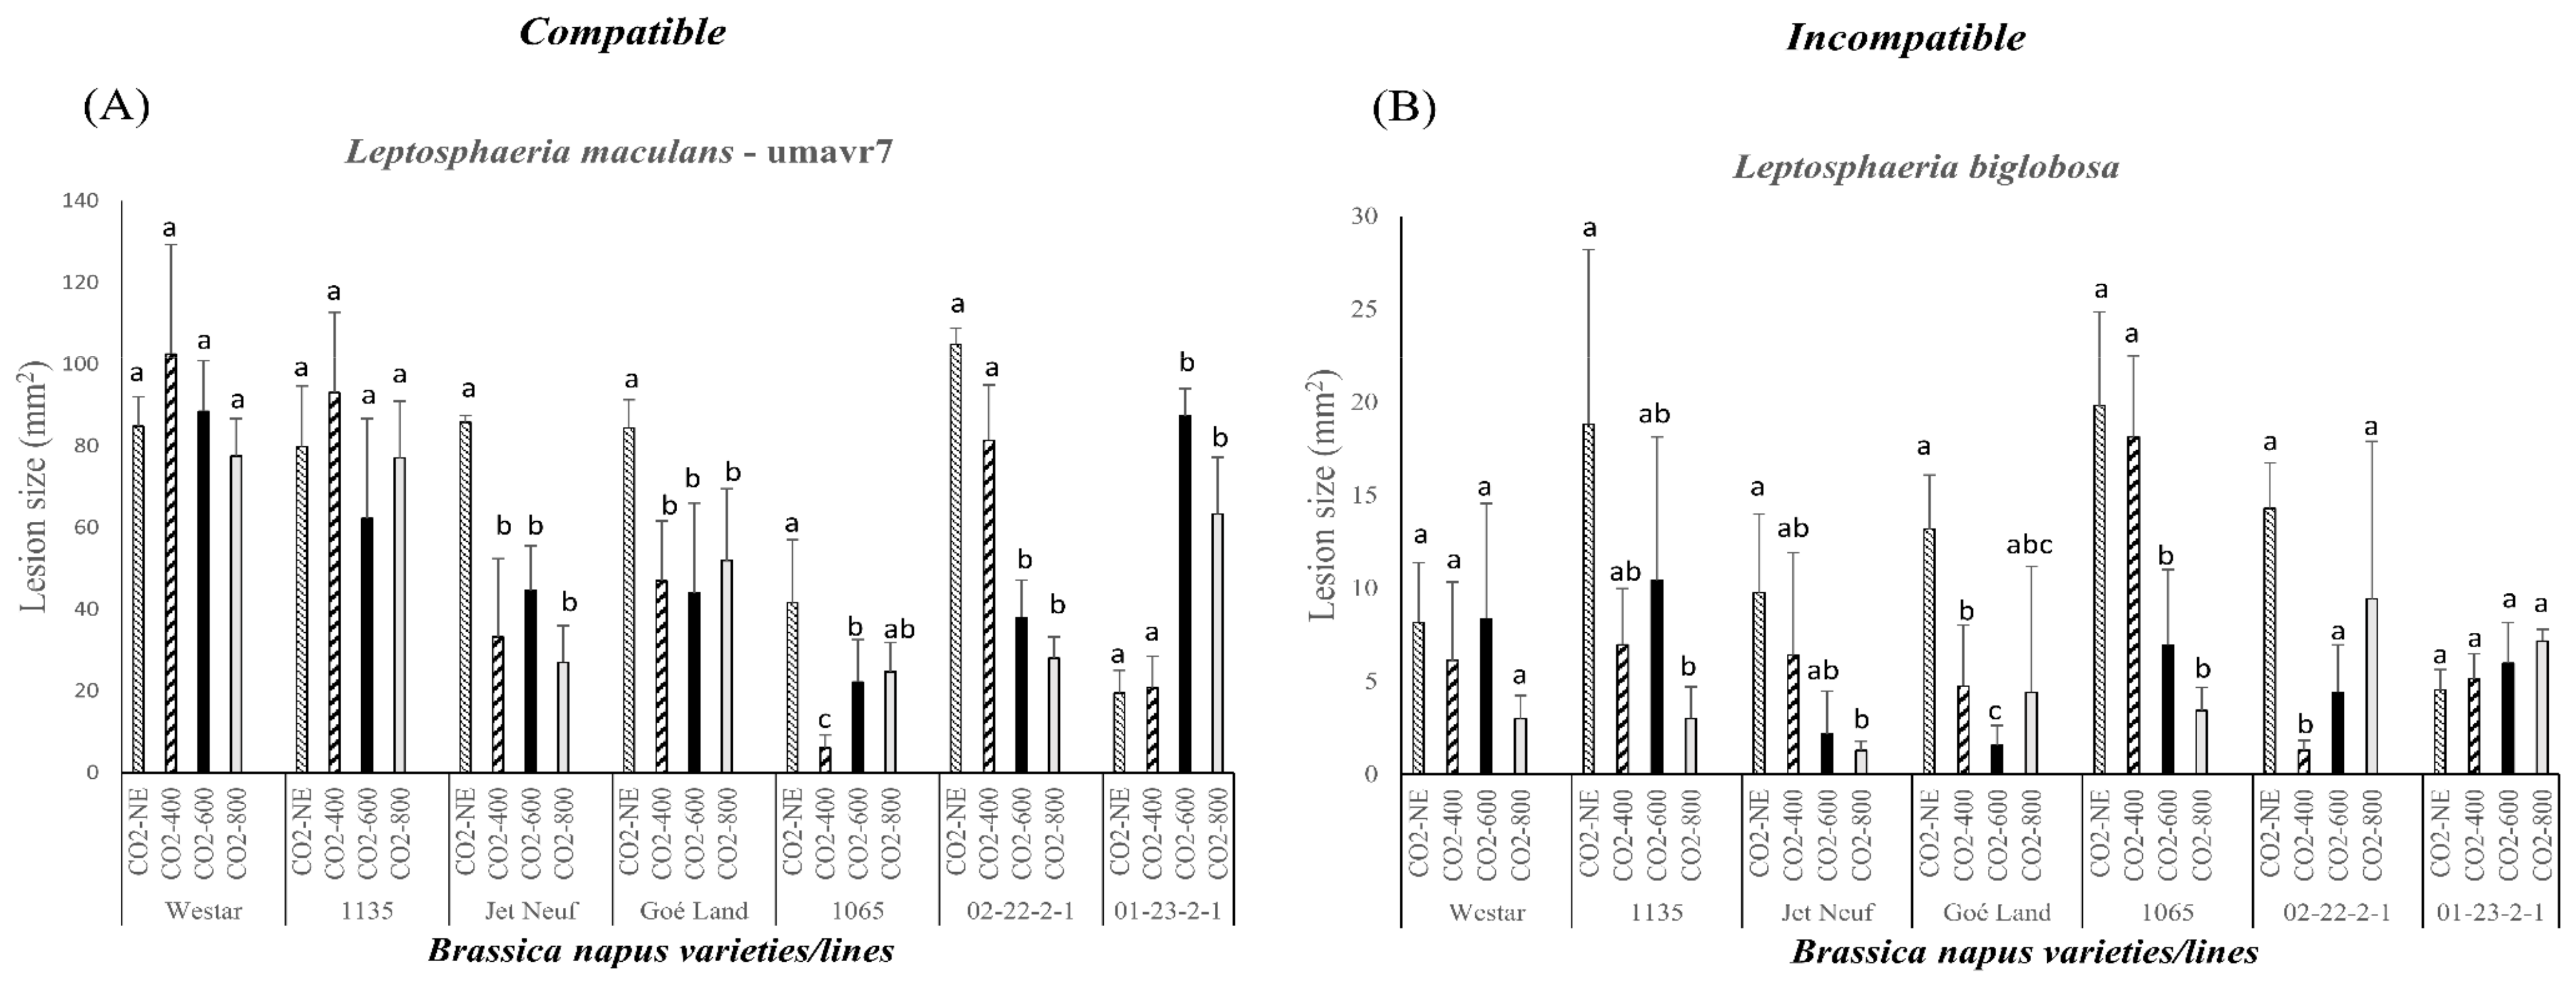
2.3. Pathogenicity Evaluation of Compatible and Incompatible Interactions between Leptosphaeria spp. and B. napus

The two isolates umavr7 and L. biglobosa, which have virulence and avirulence, respectively, to all studied B. napus varieties and lines, were used to investigate the compatible and incompatible reactions and the effect of CO2 concentrations (Table 1 and Figure 2). The lesion sizes were significantly decreased on B. napus varieties and lines Jet Neuf (Rlm4) and Goé Land (Rlm9) inoculated by umavr7 as the CO2 concentrations increased (Figure 2A). umavr7 caused significantly smaller lesions on B. napus line 02-22-2-1 (Rlm3) under 600 and 800 ppm of CO2 compared with the normal environment and 400 ppm. In B. napus line 1065 (LepR1), the lesion size was significantly decreased under 400 ppm of CO2. The lesion sizes were all smaller in B. napus line 1065 under elevated CO2 concentrations compared to those in the normal environment (Figure 2A). However, the increased CO2 concentrations enhanced the pathogenicity of umavr7 significantly when inoculated onto B. napus line 01-23-2-1 (Rlm7) (Figure 2A). There were no significant changes in lesion size when the umavr7 isolate was inoculated onto B. napus varieties and lines Westar and 1135 under different CO2 concentrations (Figure 1 and Figure 2A).
For the incompatible interaction, the lesion sizes were decreased under the highest CO2 concentration (800 ppm) when inoculated onto seven B. napus varieties and lines, except 01-23-2-1 (Rlm7), compared to those under the normal environment (Figure 2B). For example, the lesion sizes were significantly smaller under 800 ppm CO2 when inoculated onto B. napus varieties and lines 1135, Jet Neuf, and 1065 (Figure 2B). The smallest lesions caused by the L. biglobosa isolate from B. napus line Goé Land and 02-22-2-1 were under CO2 concentrations of 600 and 400 ppm, respectively (Figure 2B). As in the compatible interaction, the higher CO2 concentration enhanced the pathogenicity of the L. biglobosa isolate when inoculated onto B. napus line 01-23-2-1 (Figure 2A,B).

2.4. Pathogenicity Evaluation of Compatible and Incompatible Interactions on Different Brassica napus Varieties and Lines Caused by Leptosphaeria maculans

L. maculans isolates showed compatible and incompatible interactions with the different B. napus varieties and lines since they carried different Avr gene profiles corresponding to the resistance genes (Figure 3). For example, L. maculans isolate CDS-13 showed compatible reactions on the B. napus varieties and lines Westar, 1135, Jet Neuf, 02-22-2-1, and Goé Land; however, it displayed incompatible interactions with 1065 and 01-23-2-1 (Figure 3A). Similarly, L. maculans isolates D5, D10, DM96, DM118, and DS103 showed various interactions on different B. napus varieties and lines (Figure 3). As shown in Figure 3, most of the lesion sizes caused by L. maculans isolates decreased at the extremely high CO2 concentration (800 ppm) compared with those under the normal environment. Only isolates D5 and DM96 caused larger lesions on B. napus variety Westar at the extremely high CO2 concentration (Figure 3B).
For each L. maculans isolate, CDS-13 caused a significantly smaller lesion size on B. napus varieties and lines 1135, Jet Neuf, 02-22-2-1, and 1065 at the CO2 concentration of 800 ppm. On B. napus line Goé Land, CDS-13 caused a significantly larger lesion size at 600 ppm of CO2. As well, lesions caused by the CDS-13 isolate were larger on B. napus line 02-22-2-1 at 600 ppm. The lesion sizes on B. napus line Jet Neuf caused by CDS-13 were significantly decreased when CO2 concentration increased (Figure 3A). L. maculans isolate D5 caused significantly smaller lesions on B. napus line Goé Land when the CO2 concentrations increased. The lesion sizes on B. napus varieties and lines 02-22-2-1 and Jet Neuf caused by D5 were significantly decreased at 400 ppm CO2 (Figure 3B). L. maculans isolate D10 caused significantly decreased lesion sizes on B. napus varieties and lines 1135, 02-22-2-1, 1065, and Jet Neuf under a CO2 concentration of 800 ppm. It caused no significant change on the B. napus line Goé Land, showing an incompatible reaction under extremely high CO2 concentration (800 ppm). The largest lesion size on B. napus line 02-22-2-1 caused by D10 was under 600 ppm CO2 (Figure 3C). DM96 caused significantly smaller lesion sizes on B. napus varieties and lines 1135, 01-23-2-1, Jet Neuf, and Goé Land at 800 ppm of CO2. It caused the smallest lesions on 02-22-2-1 at 400 ppm CO2 and showed an incompatible reaction with the AvrLm3 gene (Figure 3D). L. maculans isolates DM118 and DS103, carrying AvrLm3 and AvrLm7, only showed incompatible interactions on B. napus varieties and lines 02-22-2-1 (Rlm3) and 01-23-2-1 (Rlm7), respectively (Figure 3E,F). DM118 induced significantly smaller lesions on B. napus varieties and lines 01-23-2-1, Goé Land, and 02-22-2-1 at a CO2 concentration of 800 ppm, whereas DS103 caused significantly smaller lesions on B. napus varieties and lines Jet Neuf, 1065, and 02-22-2-1 (Figure 3E,F). The lesion sizes were decreased at 400 ppm and then increased at 600 ppm when DM118 was inoculated onto B. napus varieties and lines 1135, Jet Neuf, and Goé Land (Figure 3E). DS103 caused a steady decline of lesion sizes on most of the B. napus varieties and lines when the CO2 concentration was elevated (Figure 3F).

3. Discussion

Plants usually benefit by increasing the photosynthetic products and/or utilization efficiencies of water and nutrients when growing under rising temperatures and CO2 concentrations [35]. However, the effects of elevated CO2 concentration on plant–pathogen interactions have undergone limited studies, producing inconsistent results [13,15,16,17,18,36]. In this study, we aimed to investigate how elevated CO2 concentration affects the canola–blackleg interaction using different B. napus varieties and lines with different R genes and Leptosphaeria isolates with various Avr gene profiles. We found that the CO2 concentration has no impact on the inferred phenotypes, which are determined by the qualitative resistance (R gene) in canola. However, the extremely high CO2 concentration (800 ppm) inhibits the pathogenicity of Leptosphaeria spp. on the canola plant with the exception of D5 isolate on the susceptible B. napus variety Westar. The variability of the enhanced or inhibited pathogenicity in B. napus–L. maculans interactions will provide a starting point for future studies on the physiology and genetics of certain B. napus lines in response to fungal disease under different CO2 concentrations.
B. napus has both qualitative (R gene resistance in the seedling) and quantitative (adult plant) resistance to blackleg disease [37]. Currently, most of the canola cultivars grown in Canadian canola fields have single or multiple R genes (Canola Council of Canada). Therefore, the main resistance of canola seedlings to blackleg disease is determined by the qualitative resistance (R gene(s)) [38,39]. There were slight changes in the disease rating scores of different B. napus varieties and lines in responding to various Leptosphaeria spp. isolates under different elevated CO2 concentrations, and these did not shift the inferred phenotypes of the interactions in this study. This result supports the conclusion that the R gene-mediated resistance is the major factor for canola seedlings in conferring the environmental element variations (i.e., elevated CO2 concentration). This is similar to a previous review that indicated that the abiotic stress tolerance may or may not correlate with the plant’s resistance to disease [40]. There was no change of inferred phenotypes of the susceptible B. napus variety Westar conferred by different Leptosphaeria isolates under different CO2 concentrations. The interactions between canola varieties and lines carrying different R genes and Leptosphaeria isolates had slight changes, that is, from susceptible to intermediate resistance/susceptible or from resistance to intermediate resistance, indicating that physiological stresses and variations occurred in the host plant or that the fungal pathogen may affect the disease severity aside from the major R gene mediation.
Global climate warming caused by the elevated CO2 concentration is well documented and widely accepted [2]. Although the elevated CO2 concentration has no impact on the major R gene-determined resistance of canola seedlings, it should have profound effects on plant and fungi growth, development and reproduction. Therefore, the degree of disease severity quantified by lesion size had significant variations under different CO2 concentrations. The main finding of this study was that the lesion sizes were significantly smaller in most of the B. napus varieties inoculated with different L. maculans isolates at extremely high CO2 concentration (800 ppm). The disease incidence or severity was decreased under elevated CO2 concentrations in previous studies [13,41,42,43,44]. For example, resistance was induced at 700 ppm and associated with the canopy size in the Fitzroy–Colletotrichum gloeosporioides pathosystem [41]. McElrone et al. (2005) found that elevated CO2 significantly reduced the disease incidence and severity of a red maple (Acer rubrum) fungal pathogen (Phyllosticta minima) through the changes in leaf chemistry and host physiology, that is, stomatal conductance reduction and smaller openings for fungi germ tubes or reduced nutritive quality [13]. Conversely, the elevated CO2 concentration increased the disease incidence and severity of rice blast (Magnaporthe oryzae) and sheath blight (Rhizoctonia solani) in rice (Oryza sativa), probably because a higher number of tillers was observed, which may increase the chance for sclerotia to adhere to the leaf sheath [45]. The leaf spot disease incidence and severity in redbud (Cercis canadensis) and sweetgum trees (Liquidambar styraciflua) were increased under elevated CO2 concentration, since the enhanced photosynthetic efficiency in the remaining leaf tissues minimized or mitigated any increases of the disease symptoms [16]. An interesting study conducted by Eastburn et al. (2010) found that increased CO2 concentration significantly reduced and increased the disease severity of downy mildew and brown spot disease in the soybean, respectively [42]. They also found that CO2 or O3 treatment had no effects on the incidence of sudden death syndrome (SDS) of the soybean [42]. All these findings indicated that the effects of elevated CO2 concentration on the disease incidence and severity depended on the plant and pathogen species. The effects of elevated CO2 concentration on physiological processes, leaf chemistry, the stomatal opening system, and even on L. maculans growth rate, sporulation and aggressiveness, probably caused the decreased disease severity of canola seedlings inoculated by different L. maculans isolates. Further studies are needed to investigate causes of the inhibition of Leptosphaeria isolates’ pathogenicity on the canola plant under elevated CO2 concentration and at the molecular level.
There were different lesion size variation patterns for the canola plants inoculated with different L. maculans isolates carrying different Avr gene profiles under CO2 concentrations of 400 and 600 ppm. For example, compatible interactions (i.e., CDS-13 on B. napus varieties and lines 02-22-1 and Goé Land; D5 on 1135; D10 on B. napus varieties and lines 1135, 02-22-2-1, and 01-23-2-1; DM118 on B. napus varieties and lines Westar, 1135, and Goé Land) showed largest lesion sizes at an elevated CO2 concentration of 600 ppm. Several studies reported that elevated CO2 concentration stimulated fungal growth, aggressiveness, sporulation, and fecundity [13,46,47,48]. The increased disease expression at elevated CO2 concentration may induce the larger lesions in certain plant species, varieties, or lines. This may be the reason that L. maculans isolates displayed increased pathogenicity on B. napus varieties and lines specifically at elevated CO2 concentration. However, several compatible interactions showed the highest lesion size at a CO2 concentration of 400 ppm or a normal environment. For incompatible interactions, the disease expression also increased at different CO2 concentrations (normal environment, 400, or 600 ppm), and the disease severity mostly was inhibited at extremely high CO2 concentration (800 ppm) (Figure 3). Therefore, the increased pathogenicity of Leptosphaeria spp. observed here did not produce a consistent expression pattern under certain CO2 concentrations, indicating that the disease development could result from the characteristics of Leptosphaeria or other changes in the host plant. It is well known that L. maculans isolates usually carry different Avr gene profiles, thus they show different pathogenicity and interactions with canola plants. L. maculans isolates carrying more Avr genes may show less virulence on the B. napus varieties and lines since they only cause disease symptoms in the varieties and lines without the corresponding resistance genes. Therefore, the effects of elevated CO2 concentration on the effector or elicitor gene in Leptosphaeria may differ and induce different disease severity in canola plants. On the other hand, differences in the host (canola) plant traits (i.e., genetic background, resistance genes, plant morphology, and leaf and cotyledon structure) probably initiate various defense mechanisms under high CO2 concentration stresses. Long-term studies including fungal genetics and biology, plant physiology, and genetics, etc., are needed to disclose the mechanisms of B. napus and Leptosphaeria spp. interactions under elevated CO2 concentration.
Global warming at present and in the future could reduce the disease severity of the canola–blackleg pathosystem through elevated CO2 at an extremely high level of 800 ppm. However, in this study, the pathogenicity of Leptosphaeria spp. seems increased in a couple of interactions with different B. napus varieties and lines at 400 ppm or 600 ppm CO2. We cannot make specific predictions on the change patterns from field trials since the CO2 concentration can be easily controlled only in a growth chamber. The B. napus varieties and lines used in this study are differential lines used for the characterization of Avr gene profiling in L. maculans isolates. We were trying to understand the effects of elevated CO2 concentration on different resistant gene (R) in response to various L. maculans isolates harboring different Avr genes. Since the most commercial canola varieties in fields in Canada have the Rlm3 gene [38], it is not practical to use cultivars with one R gene to represent the effects of elevated CO2 concentration. However, the results obtained from this study provide a clue of how elevated CO2 concentration affects the RAvr interactions of the B. napus–Leptosphaeria maculans pathosystem in both compatible and incompatible reactions. The numbers of B. napus varieties and lines and L. maculans isolates employed in this study will also trigger a discussion of how the different canola plant varieties show different resistance mechanisms in response to the different Leptosphaeria spp. infections under elevated CO2 concentration.

4. Materials and Methods

4.1. Brassica napus Varieties and Lines and Leptosphaeria maculans Isolates

B. napus varieties and lines carrying known R genes were used to test the compatible and incompatible interactions with different isolates (Table 1). For example, B. napus line 02-22-2-1, having the Rlm3 gene, showed compatible interaction with the isolate without the AvrLm3 gene, while showing incompatible reaction with the isolate carrying the AvrLm3 gene. Accordingly, several other B. napus varieties and lines (i.e., Jet Neuf, 01-23-2-1, Goé Land, 1065, and 1135 harboring Rlm4, Rlm7, Rlm9, LepR1, and LepR2, respectively) were included in this study (Table 1). These B. napus varieties and lines from different countries (Canada, France, and others) were extensively used for the characterization of Avr gene profiles in L. maculans isolates [38]. A susceptible B. napus variety Westar, which is a spring canola variety that has none of the resistant genes to blackleg disease, was also included as a control (Table 1).
The previously characterized International Blackleg of Crucifers Network (IBCN) L. maculans isolates D5 and D10 having AvrLm1-2-4-7-S-LepR1-LepR2 and AvrLm5-6-9-LepR1, respectively, were used in this study [20,38]. Five isolates from canola fields of Western Canada, namely, CDS-13, DM96, DM118, DS103, and umavr7, harboring AvrLm5-6-7-LepR1, AvrLm2-3-6-S, AvrLm3-6-S, AvrLm5-6-7, and AvrLm5-6, respectively, were included as well. A L. biglobosa isolate, which is the non-aggressive or avirulent form of Leptosphaeria spp. to the canola plant, was used as a control in this study.

4.2. Plant Cotyledon Inoculation and CO2 Treatment

The Leptosphaeria spp. isolate inocula were harvested by flooding eleven-day-old cultures from a single pycnidiospore using distilled water. The single pycnidiospore was picked from culture of a stocked paper disc of each isolate [38,39]. The final concentration of inoculum of each isolate was adjusted to 2 × 10⁷ spores/mL for the later cotyledon inoculation test. The seven B. napus varieties and lines with or without different R genes were seeded into 96-well flats (53 × 27× 7 cm as length, width and height) filled with commercialized soil (Pro-Mix BX, Premier Tech, Rivière-du-Loup, QC, Canada) and placed in a growth chamber at 16 °C (night) and 21 °C (day) with a 16 h photoperiod/day. The seven-day-old seedlings were used for inoculation and grown in different CO2 concentrations. The cotyledons were punctured and inoculated with a prepared 10 µL inoculum droplet at each of two wound sites per cotyledon [38]. Therefore, at least 24 wound sites from 6 plants were inoculated and rated at 14 days post-inoculation.
Four flats of each of the B. napus varieties and lines were inoculated with different Leptosphaeria isolates. After one or two hours drying, one flat of one B. napus variety or line was moved to the growth chamber with normal growth conditions after inoculation of Leptosphaeria isolates. To investigate the elevated and extremely high CO2 concentration effects on disease severity, the other three flats with each of the B. napus varieties and lines were placed into controlled-environment growth chambers with different CO2 concentrations of 400, 600, and 800 ppm, respectively, with a 16 °C/21 °C night/day and a 16 h photoperiod/day (Conviron, Winnipeg, MB, Canada). The CO2 concentration of each growth chamber was monitored by CO2/Temp./RH Data Logger (Professional Instruments, Huizhou, Guangdong, China). All the experiments were repeated once.

4.3. Disease Rating and Lesion Size Measurement

Based on the lesions, chlorosis, necrosis and signs of pycnidia, a rating scale from 0 to 9 was used to evaluate the disease severity at 14 days post-inoculation [38,39]. An average score was calculated from 24 inoculation sites of six plants (four wound sites per plant). Therefore, an average rating score ≤ 4.5 was considered as a resistant (R) reaction, 4.6 to 6.0 as an intermediate resistance (IR) reaction and 6.1 to 9.0 as a susceptible (S) reaction [38,49]. The lesion sizes of the infected cotyledons, under different CO2 concentrations for each variety or line with different isolates, were quantified at 14 dpi using Assess 2.0 image software (American Phytopathological Society, St. Paul, MN, USA).

4.4. Statistical Methodology

Statistical analysis of the lesion sizes caused by the different isolates under different CO2 concentrations, and the F measurement of distance between two repeats, were conducted using SAS version 9.4 (SAS Institute, Inc., Cary, NC, USA). The data were subjected to ANOVA and the mean lesion sizes were compared by Tukey’s HSD studentized range test at p < 0.05.

Author Contributions

Z.Z. and W.G.D.F. designed the experiments. Z.Z., F.L., and C.C. performed the experiments. Z.Z., F.L., and W.G.D.F. analyzed and interpreted the data. Z.Z. and W.G.D.F. wrote and revised the manuscript.

Funding

This research was funded by the National Science and Engineering Research Council of Canada’s (NSERC) Discovery Program, and Collaborative Research Development Program to W.G.D.F.

Conflicts of Interest

The authors declare no conflict of interest.

References

  1. Kerr, R.A. Global warming is changing the world. Science 2007, 316, 188–190. [Google Scholar] [CrossRef] [PubMed]
  2. IPCC. Climate Change 2007: Synthesis Report. Contribution of Working Groups I, II and III to the Fourth Assessment Report of the Intergovernmental Panel on Climate Change; Core Writing Team, Pachauri, R.K., Reisinger, A., Eds.; IPCC: Geneva, Switzerland, 2007; 104p. [Google Scholar]
  3. Meehl, G.A.; Washington, W.M.; Collins, W.D.; Arblaster, J.M.; Hu, A.X.; Buja, L.E.; Strand, W.G.; Teng, H.Y. How much more global warming and sea level rise? Science 2005, 307, 1769–1772. [Google Scholar] [CrossRef] [PubMed]
  4. Tubiello, F.N.; Donatelli, M.; Rosenzweig, C.; Stockle, C.O. Effects of climate change and elevated CO2 on cropping systems: Model predictions at two Italian locations. Eur. J. Agron. 2000, 13, 179–189. [Google Scholar] [CrossRef]
  5. Soares, A.S.; Driscoll, S.P.; Olmos, E.; Harbinson, J.; Arrabaca, M.C.; Foyer, C.H. Adaxial/abaxial specification in the regulation of photosynthesis and stomatal opening with respect to light orientation and growth with CO2 enrichment in the C4 species Paspalum dilatatum. New Phytol. 2008, 177, 186–198. [Google Scholar] [PubMed]
  6. Drake, B.G.; Gonzalez Meler, M.A.; Long, S.P. More efficient plants: A consequence of rising atmospheric CO2? Ann. Rev. Plant Physiol. Plant Mol. Biol. 1997, 48, 609–639. [Google Scholar] [CrossRef]
  7. Saxe, H.; Ellsworth, D.S.; Heath, J. Tree and forest functioning in an enriched CO2 atmosphere. New Phytol. 1998, 139, 395–436. [Google Scholar] [CrossRef]
  8. Faralli, M.; Grove, I.G.; Hare, M.C.; Kettlewell, P.S.; Fiorani, F. Rising CO2 from historical concentrations enhances the physiological performance of Brassica napus seedlings under optimal water supply but not under reduced water availability. Plant Cell Environ. 2017, 40, 317–325. [Google Scholar] [CrossRef]
  9. Li, X.; Zhang, L.; Ahammed, G.J.; Li, Z.; Wei, J.; Shen, C.; Yan, P.; Zhang, L.; Han, W. Stimulation in primary and secondary metabolism by elevated carbon dioxide alters green tea quality in Camellia sinensis L. Sci. Rep. 2017, 7, 7937. [Google Scholar] [CrossRef]
  10. Ainsworth, E.A.; Long, S.P. What have we learned from 15 years of free-air CO2 enrichment (FACE)? A meta-analytic review of the responses of photosynthesis, canopy properties and plant production to rising CO2. New Phytol. 2005, 165, 351–371. [Google Scholar] [CrossRef]
  11. Amthor, J.S. Terrestrial higher-plant response to increasing atmospheric CO2 in relation to the global carbon cycle. Glob. Chang. Biol. 1995, 1, 243–274. [Google Scholar] [CrossRef]
  12. Scholthof, K.B.G. The disease triangle: Pathogens, the environment society. Nat. Rev. Microbiol. 2007, 5, 152–156. [Google Scholar] [CrossRef] [PubMed]
  13. McElrone, A.J.; Reid, C.D.; Hoye, K.A.; Hart, E.; Jackson, R.B. Elevated CO2 reduces disease incidence and severity of a red maple fungal pathogen vis changes in host physiology and leaf chemistry. Glob. Chang. Biol. 2005, 11, 1828–1836. [Google Scholar] [CrossRef]
  14. Zhang, S.; Li, X.; Sun, Z.; Shao, S.; Hu, L.; Ye, M.; Zhou, Y.; Xia, X.; Yu, J.; Shi, K. Antagonism between phytohormone signaling underlies the variation in disease susceptibility of tomato plants under elevated CO2. J. Exp. Bot. 2015, 66, 1951–1963. [Google Scholar] [CrossRef] [PubMed]
  15. Ferrocino, I.; Chitarra, W.; Pugliese, M.; Gilardi, G.; Gullino, L.M.; Garibaldi, A. Effect of elevated atmospheric CO2 and temperature on disease severity of Fusarium oxysporum f. sp. lactucae on lettuce plants. Appl. Soil Ecol. 2013, 72, 1–6. [Google Scholar] [CrossRef]
  16. McElrone, A.J.; Hamilton, J.G.; Krafnick, A.J.; Aldea, M.; Knepp, R.G.; DeLucia, E.H. Combined effects of elevated CO2 and natural climatic variation on leaf spot diseases of redbud and sweetgum trees. Environ. Pollut. 2010, 158, 108–114. [Google Scholar] [CrossRef]
  17. Mitchell, C.E.; Reich, P.B.; Tilman, D.; Groth, J.V. Effects of elevated CO2, nitrogen deposition, and decreased species diversity on foliar fungal plant disease. Glob. Chang. Biol. 2003, 9, 438–451. [Google Scholar] [CrossRef]
  18. Chitarra, W.; Siciliano, I.; Ferrocino, I.; Gullino, M.L.; Garibaldi, A. Effect of elevated atmospheric CO2 and temperature on disease severity of rocket plants caused by Fusarium wilt under phytotron conditions. PLoS ONE 2015, 10, e0140769. [Google Scholar] [CrossRef]
  19. Fitt, B.D.L.; Brun, H.; Barbetti, M.J.; Rimmer, S.R. World-wide importance of Phoma stem canker (Leptosphaeria maculans and L. biglobosa) on oilseed rape (Brassica napus). Eur. J. Plant Pathol. 2006, 114, 3–15. [Google Scholar] [CrossRef]
  20. Fernando, W.G.D.; Zhang, X.; Selin, C.; Zou, Z.; Liban, S.H.; McLaren, D.L.; Kubinec, A.; Parks, P.S.; Rashid, M.H.; Padmathilake, K.R.; et al. A six-year investigation of the dynamics of Avirulence allele profiles, blackleg incidence, and mating type alleles of Leptosphaeria maculans population associated with canola crops in Manitoba, Canada. Plant Dis. 2016, 102, 4. [Google Scholar] [CrossRef]
  21. Kutcher, H.R.; Balesdent, M.H.; Rimmer, S.R.; Rouxel, T.; Chèvre, A.M.; Delourme, R.; Brun, H. Frequency of avirulence genes in Leptosphaeria maculans in western Canada. Can. J. Plant Pathol. 2010, 32, 77–85. [Google Scholar] [CrossRef]
  22. Ansan-Melayah, D.; Balesden, M.H.; Delourme, R.; Pilet, M.L.; Renard, M.; Tanguy, X.; Renard, M.; Rouxel, T. Genes for race specific resistance against blackleg disease in Brassica napus L. Plant Breed. 1998, 117, 373–378. [Google Scholar] [CrossRef]
  23. Balesdent, M.H.; Attard, A.; Kuhn, M.L.; Rouxel, T. New avirulence genes in the phytopathogenic fungus Leptosphaeria maculans. Phytopathology 2002, 92, 1122–1133. [Google Scholar] [CrossRef] [PubMed]
  24. Gout, L.; Fudal, I.; Kuhn, M.L.; Blaise, F.; Eckert, M.; Cattolico, L.; Balesdent, M.H.; Rouxel, T. Lost in the middle of nowhere: The AvrLm1 avirulence gene of the Dothideomycete Leptosphaeria maculans. Mol. Microbiol. 2006, 60, 67–80. [Google Scholar] [CrossRef] [PubMed]
  25. Hayward, A.; McLanders, J.; Campbell, E.; Edwards, D.; Batley, J. Genomic advances will herald new insights into the Brassica: Leptosphaeria maculans pathosystem. Plant Biol. 2012, 14, S1–S10. [Google Scholar] [CrossRef]
  26. Van de Wouw, A.P.; Lowe, R.G.T.; Elliott, C.E.; Dubois, D.J.; Howlett, B.J. An avirulence gene, AvrLmJ1, from the blackleg fungus, Leptosphaeria maculans, confers avirulence to Brassica juncea varieties. Mol. Plant Pathol. 2014, 15, 523–530. [Google Scholar] [CrossRef]
  27. Ghanbarnia, K.; Fudal, I.; Larkan, N.J.; Links, M.G.; Balesdent, M.H.; Profotova, B.; Fernando, W.G.D.; Borhan, M.H. Rapid identification of the Leptosphaeria maculans avirulence gene AvrLm2 using an intraspecific comparative genomics approach. Mol. Plant Pathol. 2015, 16, 699–709. [Google Scholar] [CrossRef]
  28. Plissonneau, C.; Daverdin, G.; Ollivier, B.; Blaise, F.; Degrave, A.; Fudal, I.; Rouxel, T.; Balesdent, M.H. A game of hide and seek between avirulence genes AvrLm4-7 and AvrLm3 in Leptosphaeria maculans. New Phytol. 2016, 209, 1613–1624. [Google Scholar] [CrossRef]
  29. Rimmer, S.R. Resistance genes to Leptosphaeria maculans in Brassica napus. Can. J. Plant Pathol. 2006, 28, S288–S297. [Google Scholar] [CrossRef]
  30. Van de Wouw, A.P.; Marcroft, S.J.; Barbetti, M.J.; Hua, L.; Salisbury, P.A.; Gout, L.; Rouxel, T.; Howlett, B.J.; Balesdent, M.H. Dual control of avirulence in Leptosphaeria maculans towards a Brassica napus cultivar with “sylvestris-derived” resistance suggests involvement of two resistance genes. Plant Pathol. 2009, 58, 305–313. [Google Scholar] [CrossRef]
  31. Eber, F.; Lourgant, K.; Brun, H. Analysis of Brassica nigra chromosomes allows identification of a new effective Leptosphaeria maculans resistance gene introgressed in Brassica napus. In Proceedings of the 13th International Rapeseed Congress, Prague, Czech Republic, 5–9 June 2011; pp. 5–9. [Google Scholar]
  32. Long, Y.; Wang, Z.; Sun, Z.; Fernando, W.G.D.; McVetty, B.E.P.; Li, G. Identification of two blackleg resistance genes and fine mapping of one of these two genes in a Brassica napus canola variety ‘Surpass 400’. Theor. Appl. Genet. 2011, 122, 1223–1231. [Google Scholar] [CrossRef]
  33. Balesdent, M.H.; Fudal, I.; Ollivier, B.; Bally, P.; Grandaubert, J.; Eber, F.; Chèvre, A.M.; Leflon, M.; Rouxel, T. The dispensable chromosome of Leptosphaeria maculans shelters an effector gene conferring avirulence towards Brassica rapa. New Phytol. 2013, 198, 887–898. [Google Scholar] [CrossRef] [PubMed]
  34. Hubbard, M.; Peng, G. Quantitative resistance against an isolate of Leptosphaeria maculans (blackleg) in selected Canadian canola cultivars remains effective under increased temperatures. Plant Pathol. 2018, 67, 1329–1338. [Google Scholar] [CrossRef]
  35. Kimball, B.A.; Kobayashi, K.; Bindi, M. Responses of agricultural crops to free-air CO2 enrichment. Adv. Agron. 2002, 77, 293–368. [Google Scholar]
  36. West, J.S.; Townsend, J.A.; Stevens, M.; Fitt, B.D.L. Comparative biology of different plant pathogens to estimate effects of climate change on crop diseases in Europe. Eur. J. Plant Pathol. 2012, 133, 315–331. [Google Scholar] [CrossRef] [Green Version]
  37. Pongam, P.; Osborn, T.C.; Williams, P.H. Genetic analysis and identification of amplified fragment length polymorphism markers linked to the alm1 avirulence gene of Leptosphaeria maculans. Phytopathology 1998, 88, 1068–1072. [Google Scholar] [CrossRef]
  38. Zhang, X.; Peng, G.; Kutcher, H.R.; Balesdent, M.H.; Delourme, R.; Fernando, W.G.D. Breakdown of Rlm3 resistance in the Brassica napus–Leptosphaeria maculans pathosystem in western Canada. Eur. J. Plant Pathol. 2016, 145, 659–674. [Google Scholar] [CrossRef]
  39. Zhang, X.; Peng, G.; Parks, P.; Hu, B.; Li, Q.; Jiang, L.; Niu, Y.; Huang, S.; Fernando, W.G.D. Identifying seedling and adult plant resistance of Chinese Brassica napus germplasm to Leptosphaeria maculans. Plant Pathol. 2017, 66, 752–762. [Google Scholar] [CrossRef]
  40. Atkinson, N.J.; Urwin, P.E. The interaction of plant biotic and abiotic stresses: From genes to the field. J. Exp. Bot. 2012, 63, 3523–3543. [Google Scholar] [CrossRef]
  41. Pangga, I.B.; Chakraborty, S.; Yates, D. Canopy size and induced resistance in Stylosanthes scabra determine anthracnose severity at high CO2. Phytopathology 2004, 94, 221–227. [Google Scholar] [CrossRef]
  42. Eastburn, D.; Degennaro, M.; DeLucia, E.H.; Dermody, O.; McElrone, A.J. Elevated atmospheric CO2 and ozone alter soybean diseases at SoyFACE. Glob. Chang. Biol. 2010, 16, 320–330. [Google Scholar] [CrossRef]
  43. Thompson, G.B.; Brown, J.K.M.; Woodward, F.I. The effects of host carbon dioxide, nitrogen and water supply on the infection of wheat by powdery mildew and aphids. Plant Cell Environ. 1993, 16, 687–694. [Google Scholar] [CrossRef]
  44. Thompson, G.B.; Drake, B.G. Insects and fungi on a C3 sedge and a C4 grass exposed to elevated atmospheric CO2 concentrations in open-top chambers in the field. Plant Cell Environ. 1994, 17, 1161–1167. [Google Scholar] [CrossRef]
  45. Kobayashi, T.; Ishiguro, K.; Nakajima, T.; Kim, H.Y.; Okada, M.; Kobayashi, K. Effects of elevated atmospheric CO2 concentration on the infection of rice blast and sheath blight. Phytopathology 2006, 96, 425–431. [Google Scholar] [CrossRef] [PubMed]
  46. Chakraborty, S.; Tiedemann, A.V.; Teng, P.S. Climate change: Potential impact on plant diseases. Environ. Pollut. 2000, 108, 317–326. [Google Scholar] [CrossRef]
  47. Coakley, S.M.; Scherm, H.; Chakraborty, S. Climate change and plant disease management. Ann. Rev. Phytopathol. 1999, 37, 399–426. [Google Scholar] [CrossRef]
  48. Hibberd, J.M.; Whitbread, R.; Farrar, J.F. Effect of elevated concentrations of CO2 on infection of barley by Erysiphe graminis. Physiol. Mol. Plant Pathol. 1996, 48, 37–53. [Google Scholar] [CrossRef]
  49. Williams, P.H.; Delwiche, P.A. Screening for resistance to blackleg of crucifers in the seedling stage. In Proceedings of the A Eucarpia-Conference on the Breeding of Cruciferous Crops, Wageningen, The Netherlands, 1–3 October 1979; pp. 164–170. [Google Scholar]
Figure 1. Pathogenicity assessment of seven Leptosphaeria maculans isolates inoculated onto Brassica napus variety Westar under different CO2 concentrations (NE, normal environment; CO2-400, 400 ppm; CO2-600, 600 ppm; CO2-800, 800 ppm). A less virulent or non-aggressive isolate Leptosphaeria biglobosa was included as a control. The lesion sizes were quantified at 14 days post-inoculation (dpi) for each treatment using Assess 2.0 (American Phytopathological Society, St. Paul, MN, USA). Statistical analysis was performed using SAS version 9.4 (SAS Institute, Inc., Cary, NC, USA) for analysis of variance (ANOVA). Each bar indicates the mean and standard deviation of the lesion size for a particular isolate at different CO2 concentrations. Different letters over the bars represent the significant differences (p < 0.05) in the lesion sizes caused by a specific isolate under four different CO2 environments.
Plants 08 00484 g001
Figure 2. (A) Pathogenicity assessment of one virulent Leptosphaeria maculans isolate umavr7 carrying none of the corresponding Avr genes, showing compatible interaction with all Brassica napus varieties and lines under different CO2 concentrations (NE, normal environment; CO2-400, 400 ppm; CO2-600, 600 ppm; CO2-800, 800 ppm). (B) Pathogenicity assessment of one avirulent or non-aggressive Leptosphaeria biglobosa isolate inoculated onto all B. napus varieties and lines, showing incompatible reaction under different CO2 concentrations. The lesion sizes were quantified at 14 days post-inoculation (dpi) for each treatment using Assess 2.0 (American Phytopathological Society, St. Paul, MN, USA). Statistical analysis was performed using SAS version 9.4 (SAS Institute, Inc., Cary, NC, USA) for analysis of variance (ANOVA). Each bar indicates the mean and standard deviation of the lesion size for a particular isolate in different CO2 concentrations. Different letters over the bars represent the significant differences (p < 0.05) in the lesion sizes caused by a specific isolate under four different CO2 environments.
Plants 08 00484 g002
Figure 3. Pathogenicity assessment of virulent Leptosphaeria maculans isolates carrying different Avr gene profiles and showing compatible and incompatible reactions on corresponding Brassica napus varieties and lines under different CO2 concentrations (NE, normal environment; CO2-400, 400 ppm; CO2-600, 600 ppm; CO2-800, 800 ppm). The L. maculans isolates used in this study were as follows: (A) CDS-13; (B) D5; (C) D10; (D) DM96; (E) DM118; and (F) DS103. The lesion sizes were assessed at 14 days post-inoculation (dpi) for each treatment using Assess 2.0 (American Phytopathological Society, St. Paul, MN, USA). Statistical analysis was performed using SAS version 9.4 (SAS Institute, Inc., Cary, NC, USA) for analysis of variance (ANOVA). Each bar indicates the mean and standard deviation of the lesion size for a particular isolate in different CO2 concentrations. Different letters over the bars represent the significant differences (p < 0.05) of the lesion sizes caused by a specific isolate under four different CO2 environments.
Plants 08 00484 g003
Table 1. Mean rating scores and their inferred disease resistance for seedlings of Brassica napus varieties and lines in response to different Leptosphaeria spp. isolates under different CO2 concentrations.
Disease Rating
B. napus Varieties and LinesCO2CDS-13 dD5 dD10 d DM96 dDM118 dDS103 dumavr7 dLB e
Westar/No R gene aNE b7.25 (S) c7.33 (S)7.50 (S)8.00 (S)7.00 (S)9.00 (S)8.33 (S)3.50 (R)
4008.33 (S)7.50 (S)9.00 (S)7.25 (S)8.33 (S)7.55 (S)9.00 (S)2.67 (R)
6008.00 (S)8.00 (S)8.33 (S)7.00 (S)9.00 (S)8.00 (S)7.50 (S)3.33 (R)
8007.50 (S)8.33 (S)6.25 (S)6.83 (S)6.15 (S)7.00 (S)6.83 (S)2.33 (R)
1065/LepR1 aNE8.00 (S)4.25 (R)7.87 (S)3.33 (R)5.85 (IR)7.50 (S)8.33 (S)4.87 (IR)
4008.33 (S)6.00 (S)7.50 (S)3.00 (R)5.25 (IR)6.83 (S)5.25 (IR)4.50 (R)
6007.50 (S)4.60 (R)7.50 (S)2.87 (R)6.00 (S)7.15 (S)6.67 (S)3.87 (R)
8007.50 (S)5.00 (IR)6.67 (S)2.87 (R)5.00 (IR)5.25 (IR)8.00 (S)3.00 (R)
1135/LepR2 aNE8.33 (S)6.67 (S)7.00 (S)8.13 (S)7.00 (S)8.33 (S)7.50 (S)5.25 (IR)
4007.50 (S)6.50 (S)6.50 (S)7.50 (S)6.83 (S)9.00 (S)8.00 (S)4.50 (R)
6006.67 (S)7.00 (S)6.67 (S)7.87 (S)8.33 (S)8.00 (S)6.87 (S)5.00 (IR)
8007.00 (S)6.50 (S)5.65 (IR)6.87 (S)7.00 (S)6.25 (S)7.33 (S)3.87 (R)
02-22-2-1/Rlm3 aNE8.33 (S)7.50 (S)6.67 (S)4.00 (R)2.67 (R)8.33 (S)8.33 (S)5.00 (IR)
4008.00 (S)6.00 (S)7.33 (S)2.33 (R)1.67 (R)7.86 (S)7.50 (S)4.50 (R)
6008.00 (S)6.67 (S)9.00 (S)3.67 (R)1.33 (R)7.50 (S)5.75 (IR)3.33 (R)
8006.83 (S)6.00 (S)5.33 (IR)3.00 (R)1.33 (R)6.83 (S)5.00 (IR)3.00 (R)
01-23-2-1/Rlm7 aNE1.33 (R)2.13 (R)6.50 (S)7.50 (S)7.25 (S)1.50 (R)6.25 (S)2.67 (R)
4002.67 (R)2.50 (R)6.67 (S)7.13 (S)8.00 (S)2.33 (R)7.00 (S)3.00 (R)
6002.67 (R)3.00 (R)7.00 (S)7.00 (S)6.87 (S)3.00 (R)9.00 (S)3.00 (R)
8002.33 (R) 1.67 (R)6.33 (S)6.87 (S)6.25 (S)2.33 (R)8.15 (S)3.00 (R)
Jet Neuf/Rlm4 aNE7.50 (S)1.67 (R)8.15 (S)8.15 (S)8.25 (S)8.33 (S)8.33 (S)4.00 (R)
4006.87 (S)1.33 (R)8.00 (S)7.50 (S)6.87 (S)8.00 (S)6.67 (S)3.50 (R)
6006.00 (S)2.50 (R)7.50 (S)7.50 (S)7.50 (S)7.86 (S)7.15 (S)3.00 (R)
8006.50 (S)2.00 (R)6.00 (S)7.00 (S)7.86 (S)6.83 (S)7.50 (S)2.33 (R)
Goé Land/Rlm9 aNE7.50 (S)8.15 (S)2.50 (R)8.33 (S)8.33 (S)7.86 (S)8.15 (S)5.00 (IR)
4007.33 (S)7.50 (S)3.50 (R)6.87 (S)7.00 (S)7.00 (S)7.33 (S)4.13 (R)
6008.33 (S)7.00 (S)2.13 (R)6.50 (S)8.33 (S)6.83 (S)7.00 (S)3.50 (R)
8007.00 (S)6.67 (S)1.87 (R)6.00 (S)6.67 (S)6.33 (S)6.83 (S)3.00 (R)
aBrassica napus varieties and lines carrying different resistance genes used in this study. b The seedlings were grown in four different controlled environments, namely, NE means normal environment and 400, 600, 800 ppm indicate the CO2 concentration of the growth chambers, respectively. c R, IR, S = Brassica napus varieties and lines that displayed by averaged rating scores as resistant (≤ 4.5), intermediate resistance (4.6 to 6.0) and susceptible (6.1 to 9.0), respectively, to different Leptosphaeria isolates under different CO2 concentrations. d indicates L. maculans isolates. e LB indicates L. biglobosa isolate.

