
Effect of Biostimulant, Manure Stabilizer, and Manure on Soil Physical Properties and Vegetation Status

Abstract
:1. Introduction
2. Results
Soil Physical Characteristics
3. Discussion
4. Materials and Methods
4.1. Biostimulant NeOsol
4.2. Stabilizer Z’fix
4.3. Site and Crop Management
4.4. Data Acquisition and Processing
4.5. Crop Status
5. Conclusions
Supplementary Materials
Author Contributions
Funding
Data Availability Statement
Acknowledgments
Conflicts of Interest
References
- United Nations. World Population Prospects: The 2017 Revision, Key Findings and Advance Tables; United Nations: New York, NY, USA, 2017. Available online: https://population.un.org/wpp/Publications/Files/WPP2017_KeyFindings.pdf (accessed on 1 January 2024).
- FAO. How to Feed the World in 2050; FAO: Rome, Italy, 2009; Available online: https://www.fao.org/fileadmin/templates/wsfs/Summit/WSFS_Issues_papers/WSFS_feeding_E.pdf (accessed on 1 January 2024).
- Jongeneel, R.; Silvis, H.; Martinez, A.G.; Jager, J. The Green Deal: An Assessment of Impacts of the Farm to Fork and Biodiversity Strategies on the EU Livestock Sector; Wageningen Economic Research: Wageningen, The Netherlands, 2021. [Google Scholar]
- Cai, A.; Xu, M.; Wang, B.; Zhang, W.; Liang, G.; Hou, E.; Luo, Y. Manure Acts as a Better Fertilizer for Increasing Crop Yields than Synthetic Fertilizer Does by Improving Soil Fertility. Soil Tillage Res. 2019, 189, 168–175. [Google Scholar] [CrossRef]
- Weisser, M.; Mattner, S.W.; Southam-Rogers, L.; Hepworth, G.; Arioli, T. Effect of a Fortified Biostimulant Extract on Tomato Plant Productivity, Physiology, and Growing Media Properties. Plants 2023, 13, 4. [Google Scholar] [CrossRef] [PubMed]
- Soares, C.R.F.S.; Hernández, A.G.; da Silva, E.P.; de Souza, J.E.A.; Bonfim, D.F.; Zabot, G.L.; Ferreira, P.A.A.; Brunetto, G. Applications and Market of Micro-Organism-Based and Plant-Based Inputs in Brazilian Agriculture. Plants 2023, 12, 3844. [Google Scholar] [CrossRef]
- Bourgougnon, N.; Burlot, A.S.; Jacquin, A.G. Algae for Global Sustainability? 1st ed.; Elsevier Ltd.: Amsterdam, The Netherlands, 2021; Volume 100, ISBN 9780128216927. [Google Scholar]
- Findura, P.; Šindelková, I.; Rusinek, R.; Karami, H.; Gancarz, M.; Bartoš, P. Determination of the Influence of Biostimulants on Soil Properties and Field Crop Yields. Int. Agrophysics 2022, 36, 351–359. [Google Scholar] [CrossRef]
- Šindelková, I.; Badalíková, B.; Kubíková, Z. The Soil Biostimulant Usage Effect on Soil Properties in Dry Area. In Proceedings of the International Multidisciplinary Scientific GeoConference Surveying Geology and Mining Ecology Management; SGEM, 2019; Volume 19, pp. 561–568. Available online: https://www.sgem.org/index.php/elibrary-research-areas?view=publication&task=show&id=5766 (accessed on 1 January 2024).
- Šindelková, I.; Badalíková, B. Use of the Biostimulants in a Dry Area within South Moravia. Zahrad. Vědecká Příloha 2019, XVIII, 103–113. [Google Scholar]
- Rumeur, B. Le Trace Elements and Seaweeds Extracts, Tools for a Sustainable Management of Soil Functions and Plat Production. In Proceedings of the Agriculture in Nature and Environment Protection, Osijek, Republic of Croatia, 7–9 September 2020; Available online: https://www.hdpot.hr/images/files/Vukovar%20zbornici/Zbornik%20Agro%202020.pdf (accessed on 1 January 2024).
- Tuba, G.; Kovács, G.; Sinka, L.; Nagy, P.; Rivera-Garcia, A.; Bajusová, Z.; Findura, P.; Zsembeli, J. Effect of Soil Conditioning on Soil Penetration Resistance and Traction Power Demand of Ploughing. Agriculture 2021, 67, 113–123. [Google Scholar] [CrossRef]
- Spychalski, W.; Sulewska, H.; Ratajczak, K.; Kaczmarek, T. Composition of Soil Solution after 10 Years of PRP SOL Fertilization Based on the Selected Chemical Properties. J. Res. Appl. Agric. Eng. 2017, 62, 139–143. [Google Scholar]
- Swędrzyńska, D.; Zielewicz, W.; Swędrzyński, A. Comparison of Soil Bioconditioners and Standard Fertilization in Terms of the Impact on Yield and Vitality of Lolium Perenne and Soil Biological Properties. Open Life Sci. 2019, 14, 666–680. [Google Scholar] [CrossRef] [PubMed]
- Jukić, G.; Sunjić, K.; Varnica, I.; Gašo, D.; Labudović, B. Effect of different kinds of fertilizer on soybean yield. In Proceedings of the 8th International Scientific/Professional Conference, Agriculture in Nature and Environment Protection, Vukovar, Croatia, 1–3 June 2015; pp. 110–114. [Google Scholar]
- Sulewska, H.; Niewiadomska, A.; Majchrzak, L.; Panasiewicz, K. Potatoes Reaction on PRP SOL Fertilisation. J. Res. Appl. Agric. Eng. 2012, 57, 116–121. [Google Scholar]
- Ratajczak, K.; Sulewska, H.; Szymańska, G.; Wolna-Maruwka, A.; Faligowska, A. The Effect of Soil Type and Soil Additives on the Selected Growth Parameters and Yield of Flowerheads of Calendula officinalis L. Herba Pol. 2016, 62, 17–30. [Google Scholar] [CrossRef]
- Novák, V.; Šařec, P.; Křížová, K.; Novák, P.; Látal, O. Soil Physical Properties and Crop Status under Cattle Manure and Z’Fix in Haplic Chernozem. Plant Soil Environ. 2021, 67, 390–398. [Google Scholar] [CrossRef]
- Mozdzer, E.; Chudecka, J. Impact of Natural Fertilization Using PRP Fix on Some Soil Fertility Indicators. J. Ecol. Eng. 2017, 18, 137–144. [Google Scholar] [CrossRef]
- Látal, O.; Sedláčková, I.; Pozdíšek, J.; Farmyard Manure Quality Optimisation by Using the Z`fix Activator Application in Cattle Farms. Obilnářské Listy 2022. Available online: https://www.vukrom.cz/userfiles/files/obilnarske_listy/2022/obil_listy_3-4_2022.pdf (accessed on 1 January 2024).
- Sedláčková, I.; Látal, O.; Hambálková, M.; Polišenská, I.; Spring Barley Quality in Kroměříž Biological Transformed Organic Matter Trial. Obilnářské Listy 2021, 77–81. Available online: https://www.vukrom.cz/userfiles/files/obilnarske_listy/2021/Obil_listy_3_2021.pdf.pdf (accessed on 1 January 2024).
- Calvo, P.; Nelson, L.; Kloepper, J.W. Agricultural Uses of Plant Biostimulants. Plant Soil 2014, 383, 3–41. [Google Scholar] [CrossRef]
- Dhaliwal, S.S.; Naresh, R.K.; Mandal, A.; Walia, M.K.; Gupta, R.K.; Singh, R.; Dhaliwal, M.K. Effect of Manures and Fertilizers on Soil Physical Properties, Build-up of Macro and Micronutrients and Uptake in Soil under Different Cropping Systems: A Review. J. Plant Nutr. 2019, 42, 2873–2900. [Google Scholar] [CrossRef]
- Rayne, N.; Aula, L. Livestock Manure and the Impacts on Soil Health: A Review. Soil Syst. 2020, 4, 64. [Google Scholar] [CrossRef]
- Chen, X.; Xi, K.; Yang, Z.; Lu, J.; Zhang, Q.; Wang, B.; Wang, K.; Shi, J. Long-Term Increases in Continuous Cotton Yield and Soil Fertility Following the Application of Cotton Straw and Organic Manure. Agronomy 2023, 13, 2133. [Google Scholar] [CrossRef]
- Dudka, O.; Tanchyk, S.; Pavlov, O. Bulk Density of Soil Depending on the Farming Systems and Soil Tillage for Growing Spring Wheat in the Right Bank Forest-Steppe of Ukraine. Tech. Rom. J. Appl. Sci. Technol. 2022, 4, 31–37. [Google Scholar] [CrossRef]
- United States Department of Agriculture. Soil Bulk Density/Moisture/Aeration; United States Department of Agriculture: Washington, DC, USA, 2019. Available online: https://www.nrcs.usda.gov/sites/default/files/2022-10/Soil%20Bulk%20Density%20Moisture%20Aeration.pdf (accessed on 1 January 2024).
- Yu, F.; Zhao, S.; Zhao, Y.; Wang, Y.; Zhai, C.; Zhong, R.; Zhang, J.; Meng, Q. Long-Term Cattle Manure Application to Saline-Sodic Soil Increases Maize Yield by Decreasing Key Obstacle Factors in the Black Soil Region of Northeastern China. Int. J. Agric. Biol. Eng. 2023, 16, 176–183. [Google Scholar] [CrossRef]
- Čermáková, N.; Šařec, P.; Látal, O. Impact of Manure and Selected Conditionners on Physical Properties of Clay Soil. In Proceedings of the TAE 2019—Proceeding of 7th International Conference on Trends in Agricultural Engineering 2019, Prague, Czech Republic, 17–20 September 2019; Czech University of Life Sciences Prague: Prague, Czech Republic, 2019; pp. 93–98. [Google Scholar]
- Fu, Y.; De Jonge, L.W.; Moldrup, P.; Paradelo, M.; Arthur, E. Geoderma Improvements in Soil Physical Properties after Long-Term Manure Addition Depend on Soil and Crop Type. Geoderma 2022, 425, 116062. [Google Scholar] [CrossRef]
- Forgó, Z.; Tolvaly-Rosca, F.; Pásztor, J.; Kovari, A. Energy Consumption Evaluation of Active Tillage Machines Using Dynamic Modelling. Appl. Sci. 2021, 11, 6240. [Google Scholar] [CrossRef]
- Choudhary, S.; Upadhyay, G.; Patel, B.; Naresh; Jain, M. Energy Requirements and Tillage Performance Under Different Active Tillage Treatments in Sandy Loam Soil. J. Biosyst. Eng. 2021, 46, 353–364. [Google Scholar] [CrossRef]
- Urbanovičová, O.; Krištof, K.; Findura, P.; Mráz, M.; Jobbágy, J.; Križan, M. The Effect of Soil Conditioner on the Spatial Variability of Soil Environment. Agron. Res. 2018, 16, 2197–2210. [Google Scholar] [CrossRef]
- Šařec, P.; Látal, O.; Novák, P.; Holátko, J.; Novák, V.; Dokulilová, T.; Brtnický, M. Changes in Soil Properties and Possibilities of Reducing Environmental Risks Due to the Application of Biological Activators in Conditions of Very Heavy Soils. Agron. Res. 2020, 18, 2581–2591. [Google Scholar] [CrossRef]
- Mclaughlin, N.B.; Gregorich, E.G.; Dwyer, L.M.; Ma, B.L. Effect of Organic and Inorganic Soil Nitrogen Amendments on Mouldboard Plow Draft. Soil Tillage Res. 2002, 64, 211–219. [Google Scholar] [CrossRef]
- Liang, A.; Mclaughlin, N.B.; Ma, B.L.; Gregorich, E.G.; Morrison, M.J.; Burtt, S.D.; Patterson, B.S.; Evenson, L.I. Changes in Mouldboard Plough Draught and Tractor Fuel Consumption on Continuous Corn after 18 Years of Organic and Inorganic N Amendments. Energy 2013, 52, 89–98. [Google Scholar] [CrossRef]
- Rusu, T. Energy Efficiency and Soil Conservation in Conventional, Minimum Tillage and No-Tillage. Int. Soil Water Conserv. Res. 2014, 2, 42–49. [Google Scholar] [CrossRef]
- Moradi, E.; Miranda-Moreno, L. Vehicular Fuel Consumption Estimation Using Real-World Measures through Cascaded Machine Learning Modeling. Transp. Res. Part D Transp. Environ. 2020, 88, 102576. [Google Scholar] [CrossRef]
- Wilson, D.L.; Talancon, D.R.; Winslow, R.L.; Linares, X.; Gadgil, A.J. Avoided Emissions of a Fuel-Efficient Biomass Cookstove Dwarf Embodied Emissions. Dev. Eng. 2016, 1, 45–52. [Google Scholar] [CrossRef]
- Martelli, A.; Cachiba, S. Mitigating Measures Carried out by the Environment Secretariat of the Municipality of Itapira-SP in Relation to Greenhouse Gases. South Fla. J. Dev. 2020, 1, 11–20. [Google Scholar] [CrossRef]
- Mühlbachová, G.; Kusá, H.; Růžek, P.; Vavera, R. CO2 Emissions in a Soil under Different Tillage Practices. Plant Soil Environ. 2022, 68, 253–261. [Google Scholar] [CrossRef]
- Jiang, Q.; Cao, M.; Wang, Y.; Wang, J. Estimating Soil Penetration Resistance of Paddy Soils in the Plastic State Using Physical Properties. Agronomy 2020, 10, 1914. [Google Scholar] [CrossRef]
- Pardo, A.; Amato, M.; Chiarandà, F.Q. Relationships between Soil Structure, Root Distribution and Water Uptake of Chickpea (Cicer arietinum L.). Plant Growth and Water Distribution. Eur. J. Agron. 2000, 13, 39–45. [Google Scholar] [CrossRef]
- Otto, R.; Silva, A.P.; Franco, H.C.J.; Oliveira, E.C.A.; Trivelin, P.C.O. High Soil Penetration Resistance Reduces Sugarcane Root System Development. Soil Tillage Res. 2011, 117, 201–210. [Google Scholar] [CrossRef]
- Bengough, A.G.; McKenzie, B.M.; Hallett, P.D.; Valentine, T.A. Root Elongation, Water Stress, and Mechanical Impedance: A Review of Limiting Stresses and Beneficial Root Tip Traits. J. Exp. Bot. 2011, 62, 59–68. [Google Scholar] [CrossRef]
- Kuhwald, M.; Hamer, W.B.; Brunotte, J.; Duttmann, R. Soil Penetration Resistance after One-Time Inversion Tillage: A Spatio-Temporal Analysis at the Field Scale. Land 2020, 9, 482. [Google Scholar] [CrossRef]
- Celik, I.; Gunal, H.; Budak, M.; Akpinar, C. Effects of Long-Term Organic and Mineral Fertilizers on Bulk Density and Penetration Resistance in Semi-Arid Mediterranean Soil Conditions. Geoderma 2010, 160, 236–243. [Google Scholar] [CrossRef]
- Zeleke, T.B.; Si, B.C. Scaling Relationships between Saturated Hydraulic Conductivity and Soil Physical Properties. Soil Sci. Soc. Am. J. 2005, 69, 1691–1702. [Google Scholar] [CrossRef]
- Chyba, J.; Kroulik, M.; Kristof, K.; Misiewicz, P.A. The Influence of Agricultural Traffic on Soil Infiltration Rates. Agron. Res. 2017, 15, 664–673. [Google Scholar]
- Jadczyszyn, J.; Niedźwiecki, J. Relation of Saturated Hydraulic Conductivity to Soil Losses. Pol. J. Environ. Stud. 2005, 14, 431–435. [Google Scholar]
- Panagos, P.; Ballabio, C.; Himics, M.; Scarpa, S.; Matthews, F.; Bogonos, M.; Poesen, J.; Borrelli, P. Projections of Soil Loss by Water Erosion in Europe by 2050. Environ. Sci. Policy 2021, 124, 380–392. [Google Scholar] [CrossRef]
- The Ministry of Agriculture of the Czech Republic. Water Erosion. Available online: https://eagri.cz/public/portal/en/mze/soil (accessed on 1 January 2024).
- Bagarello, V.; Baiamonte, G.; Caia, C. Variability of Near-Surface Saturated Hydraulic Conductivity for the Clay Soils of a Small Sicilian Basin. Geoderma 2019, 340, 133–145. [Google Scholar] [CrossRef]
- Miller, J.J.; Sweetland, N.J.; Chang, C. Hydrological Properties of a Clay Loam Soil after Long-Term Cattle Manure Application. J. Environ. Qual. 2002, 31, 989–996. [Google Scholar] [CrossRef] [PubMed]
- Novák, V.; Šařec, P.; Křížová, K.; Novák, P.; Látal, O. Potential Impact of Biostimulator NeOsol and Three Different Manure Types on Physical Soil Properties and Crop Status in Heavy Soils Conditions. Sustainability 2021, 14, 438. [Google Scholar] [CrossRef]
- Pandey, P.C.; Pandey, M. Highlighting the Role of Agriculture and Geospatial Technology in Food Security and Sustainable Development Goals. Sustain. Dev. 2023, 31, 3175–3195. [Google Scholar] [CrossRef]
- Hernandez, T.; Berlanga, J.G.; Tormos, I.; Garcia, C. Organic versus Inorganic Fertilizers: Response of Soil Properties and Crop Yield. AIMS Geosci. 2021, 7, 415–439. [Google Scholar] [CrossRef]
- Krasilnikov, P.; Taboada, M.A. Amanullah Fertilizer Use, Soil Health and Agricultural Sustainability. Agriculture 2022, 12, 462. [Google Scholar] [CrossRef]
- Sulewska, H.; Szymańska, G.; Śmiatacz, K.; Koziara, W.; Niewiadomska, A. Effect of Prp Sol Application in Maize Grown for Grain. J. Res. Appl. Agric. Eng. 2013, 58, 161–166. [Google Scholar]
- Šařec, P.; Novák, V.; Křížová, K. Effect of organic fertilizers, biochar and other conditioners on modal luvisol. In Proceedings of the 7th International Conference on Trends in Agricultural Engineering, Prague, Czech Republic, 17–20 September 2019; pp. 494–499. [Google Scholar]
- Shynkaruk, L.; Lykhochvor, V. Influence of Fertilization and Foliar Feeding on Maize Grain Qualitative Indicators. Ukr. J. Ecol. 2021, 11, 113–116. [Google Scholar]
- Da Silva, P.R.F.; Strieder, M.L.; Coser, R.P.S.; Rambo, L.; Sangoi, L.; Argenta, G.; Forsthofer, E.L.; Silva, A.A. Grain Yield and Kernel Crude Protein Content Increases of Maize Hybrids with Late Nitrogen Side-Dressing. Sci. Agric. 2005, 62, 487–492. [Google Scholar] [CrossRef]
- Wang, H.; Zhang, X.; Zhang, G.; Fang, Y.; Hou, H.; Lei, K.; Ma, Y. Regulation of Density and Fertilization on Crude Protein Synthesis in Forage Maize in a Semiarid Rain-Fed Area. Agriculture 2023, 13, 715. [Google Scholar] [CrossRef]
- Litke, L.; Gaile, Z.; Ruža, A. Effect of Nitrogen Fertilization on Winter Wheat Yield and Yield Quality. Agron. Res. 2018, 16, 500–509. [Google Scholar] [CrossRef]
- Tsvey, Y.; Ivanina, R.; Ivanina, V.; Senchuk, S. Yield and Quality of Winter Wheat (Triticum aestivum L.) Grain in Relation to Nitrogen Fertilization. Rev. Fac. Nac. De Agron. Medellín 2021, 74, 9413–9422. [Google Scholar] [CrossRef]
- Klem, K.; Křen, J.; Šimor, J.; Kováč, D.; Holub, P.; Míša, P.; Svobodová, I.; Lukas, V.; Lukeš, P.; Findurová, H.; et al. Improving Nitrogen Status Estimation in Malting Barley Based on Hyperspectral Reflectance and Artificial Neural Networks. Agronomy 2021, 11, 2592. [Google Scholar] [CrossRef]
- Groth, D.A.; Sokólski, M.; Jankowski, K.J. A Multi-Criteria Evaluation of the Effectiveness of Nitrogen and Sulfur Fertilization in Different Cultivars of Winter Rapeseed—Productivity, Economic and Energy Balance. Energies 2020, 13, 4654. [Google Scholar] [CrossRef]
- Sulewska, H.; Ratajczak, K.; Niewiadomska, A.; Panasiewicz, K. Impact of Four-Year Period Application of Prp Sol and Prp Ebv on the Yield and Quality of Winter Oil Seed Rape. J. Res. Appl. Agric. Eng. 2016, 61, 176–181. [Google Scholar]
- Zielewicz, W.; Wróbel, B.; Stopa, W.; Paszkiewicz-Jasińska, A.; Szulc, P.; Klarzyńska, A. Effect of Soil Biostimulant Application on Protein and Carbohydrate Content in Per-Ennial Ryegrass (Lolium perenne L.). J. Res. Appl. Agric. Eng. 2023, 68, 36–48. [Google Scholar] [CrossRef]
- Możdżer, E.; Meller, E.; Sammel, A. The effect of organic fertilisation of liquid manure and the prp fix preparation on the yield and chemical composition of winter rape seeds and spring wheat grain. J. Ecol. Eng. 2017, 18, 139–146. [Google Scholar] [CrossRef]
- Borowiak, K.; Niewiadomska, A.; Sulewska, H.; Szymanska, G.; Gluchowska, K.; Wolna-Maruwka, A. Effect of PRP SOL and PRP EBV Nutrition on Yield, Photosynthesis Activity and Soil Microbial Activity of Three Cereal Species. Fresenius Environ. Bull. 2016, 25, 2026–2035. [Google Scholar]
- Šařec, P.; Novák, P.; Kumhálová, J. Impact of Activators of Organic Matter on Soil and Crop Stand Properties in Conditions of Very Heavy Soils. In Proceedings of the Engineering for Rural Development, Jelgava, Latvia, 24 May 2017; Volume 16, pp. 486–491. [Google Scholar]
- CSN EN ISO 17892-2; Geotechnický Průzkum a Zkoušení—Laboratorní Zkoušky Zemin—Část 2: Stanovení Objemové Hmotnosti. Available online: https://www.technicke-normy-csn.cz/csn-en-iso-17892-2-721007-218314.html (accessed on 1 January 2024).
- Elrick, D.E.; Reynolds, W.D.; Tan, K.A. Hydraulic Conductivity Measurements in the Unsaturated Zone Using Improved Well Analyses. Groundw. Monit. Remediat. 1989, 9, 184–193. [Google Scholar] [CrossRef]
- Darra, N.; Espejo-Garcia, B.; Kasimati, A.; Kriezi, O.; Psomiadis, E.; Fountas, S. Can Satellites Predict Yield? Ensemble Machine Learning and Statistical Analysis of Sentinel-2 Imagery for Processing Tomato Yield Prediction. Sensors 2023, 23, 2586. [Google Scholar] [CrossRef]
- Rouse, R.W.H.; Haas, J.A.W.; Deering, D.W. Monitoring Vegetation Systems in the Great Plains with ERTS. In Third Earth Resources Technology Satellite-1 Symposium- Volume I: Technical Presentations; NASA, 1974; pp. 309–317. Available online: https://ntrs.nasa.gov/citations/19740022614 (accessed on 1 January 2024).
- Huang, S.; Tang, L.; Hupy, J.P.; Wang, Y.; Shao, G. A Commentary Review on the Use of Normalized Difference Vegetation Index (NDVI) in the Era of Popular Remote Sensing. J. For. Res. 2021, 32, 1–6. [Google Scholar] [CrossRef]
- McVeagh, P.; Yule, I.; Grafton, M. Pasture Yield Mapping from Your Groundspread Truck. In Proceedings of the Advanced Nutrient Management: Gains from the Past—Goals for the Future; 2012; pp. 1–5. Available online: http://tur-www1.massey.ac.nz/~flrc/workshops/12/Manuscripts/McVeagh_2012.pdf (accessed on 1 January 2024).
- Tunca, E.; Köksal, E.S.; Taner, S.Ç. Silage Maize Yield Estimation by Using Planetscope, Sentinel-2A and Landsat 8 OLI Satellite Images. Smart Agric. Technol. 2023, 4, 100165. [Google Scholar] [CrossRef]
- HUNTJR, E.; ROCK, B. Detection of Changes in Leaf Water Content Using Near- and Middle-Infrared Reflectances. Remote Sens. Environ. 1989, 30, 43–54. [Google Scholar] [CrossRef]
- Welikhe, P.; Quansah, J.E.; Fall, S.; McElhenney, W. Estimation of Soil Moisture Percentage Using LANDSAT-Based Moisture Stress Index. J. Remote Sens. GIS 2017, 6, 1–5. [Google Scholar] [CrossRef]
- Gitelson, A.A.; Vina, A.; Arkebauer, T.J.; Rundquist, D.C.; Keydan, G.; Leavitt, B. Remote Estimation of Leaf Area Index and Green Leaf Biomass in Maize Canopies. Geophys. Res. Lett. 2003, 30, 4–7. [Google Scholar] [CrossRef]
- Kumar, V.; Sharma, A.; Bhardwaj, R.; Thukral, A.K. Comparison of Different Reflectance Indices for Vegetation Analysis Using Landsat-TM Data. Remote Sens. Appl. Soc. Environ. 2018, 12, 70–77. [Google Scholar] [CrossRef]


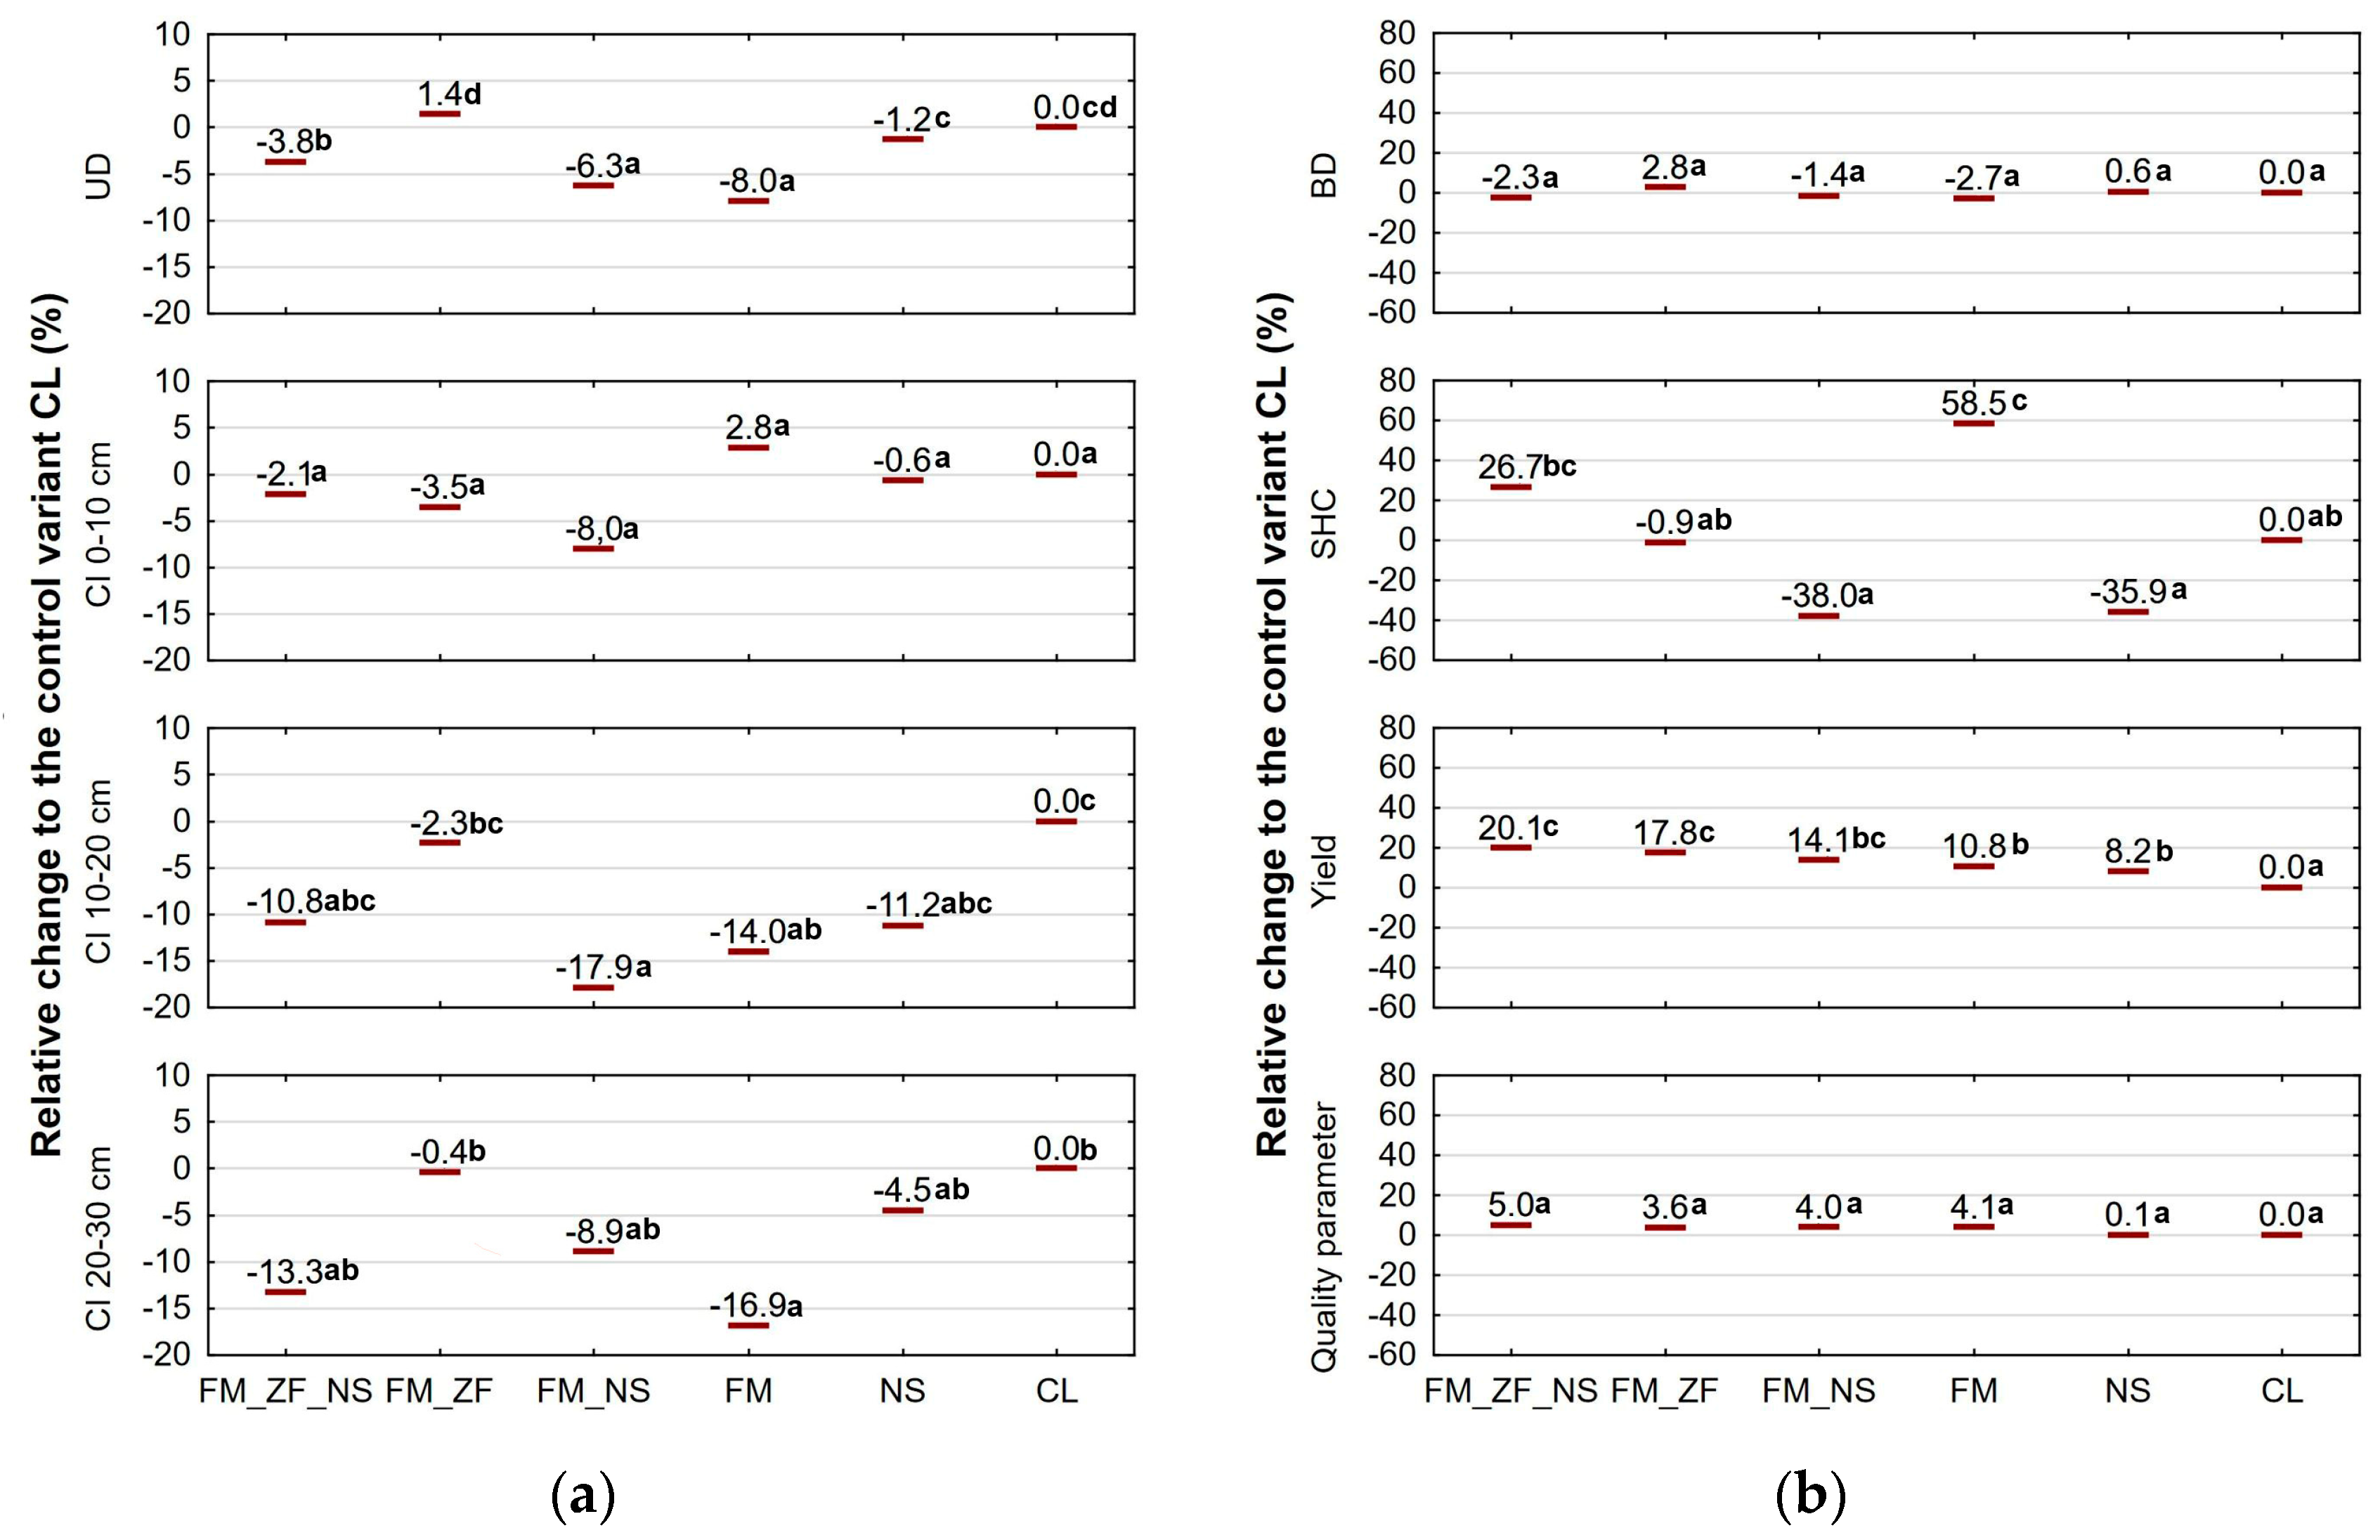
| Variable | Variant | Term I | Term II | Term III |
|---|---|---|---|---|
| Bulk density (g·cm−3) | FM_ZF_NS | 1.517 ab ± 0.025 | 1.285 a ± 0.011 | 1.298 a ± 0.126 |
| FM_ZF | 1.553 b ± 0.035 | 1.374 a ± 0.011 | 1.382 a ± 0.053 | |
| FM_NS | 1.483 ab ± 0.042 | 1.327 a ± 0.062 | 1.323 a ± 0.091 | |
| FM | 1.457 a ± 0.021 | 1.304 a ± 0.025 | 1.318 a ± 0.019 | |
| NS | 1.487 ab ± 0.012 | 1.349 a ± 0.069 | 1.381 a ± 0.020 | |
| CL | 1.450 a ± 0.026 | 1.327 a ± 0.024 | 1.415 a ± 0.026 | |
| Unit Draft (kN·m−2) | FM_ZF_NS | 95.1950 b ± 10.508 | 38.662 b ± 4.815 | 87.699 b ± 8.954 |
| FM_ZF | 105.784 c ± 7.377 | 36.538 a ± 3.337 | 93.372 c ± 10.549 | |
| FM_NS | 88.856 a ± 6.662 | 38.730 b ± 4.642 | 86.271 b ± 6.012 | |
| FM | 94.670 b ± 8.706 | 36.089 a ± 4.764 | 81.004 a ± 6.764 | |
| NS | 96.625 b ± 13.554 | 37.882 ab ± 2.809 | 94.208 c ± 7.613 | |
| CL | 97.755 b ± 7.852 | 38.773 b ± 3.607 | 94.812 c ± 6.999 | |
| Saturated hydraulic conductivity (mm·h−1) | FM_ZF_NS | 5.324 ab ± 3.481 | 72.178 b ± 35.344 | 18.816 a ± 21.883 |
| FM_ZF | 5.451 ab ± 2.829 | 25.238 a ± 17.725 | 25.033 a ± 20.985 | |
| FM_NS | 3.355 a ± 1.889 | 31.189 a ± 21.198 | 6.546 a ± 3.372 | |
| FM | 5.589 ab ± 2.848 | 52.283 ab ± 37.831 | 52.630 b ± 26.385 | |
| NS | 3.859 a ± 1.703 | 15.206 a ± 11.374 | 15.736 a ± 8.318 | |
| CL | 6.748 b ± 3.008 | 29.555 a ± 42.198 | 17.080 a ± 15.432 |
| Depth Zone | Variant | Cone Index (MPa) | ||
|---|---|---|---|---|
| Term I | Term II | Term III | ||
| 0–10 cm | FM_ZF_NS | 0.515 a ± 0.118 | 1.040 a ± 0.338 | 0.380 a ± 0.083 |
| FM_ZF | 0.590 a ± 0.168 | 0.950 a ± 0.228 | 0.345 a ± 0.110 | |
| FM_NS | 0.525 a ± 0.177 | 0.885 a ± 0.243 | 0.363 a ± 0.076 | |
| FM | 0.605 a ± 0.161 | 0.970 a ± 0.236 | 0.400 a ± 0.103 | |
| NS | 0.550 a ± 0.161 | 0.965 a ± 0.281 | 0.400 a ± 0.086 | |
| CL | 0.550 a ± 0.254 | 1.040 a ± 0.241 | 0.380 a ± 0.062 | |
| 10–20 cm | FM_ZF_NS | 1.043 a ± 0.358 | 1.403 b ± 0.289 | 0.727 ab ± 0.328 |
| FM_ZF | 1.437 b ± 0.466 | 1.270 ab ± 0.184 | 0.770 ab ± 0.518 | |
| FM_NS | 1.140 ab ± 0.358 | 1.197 a ± 0.248 | 0.593 a ± 0.319 | |
| FM | 1.237 ab ± 0.381 | 1.223 ab ± 0.290 | 0.627 ab ± 0.236 | |
| NS | 1.253 ab ± 0.436 | 1.303 ab ± 0.247 | 0.637 ab ± 0.346 | |
| CL | 1.280 ab ± 0.445 | 1.330 ab ± 0.260 | 0.903 b ± 0.495 | |
| 20–30 cm | FM_ZF_NS | 1.985 a ± 0.631 | 2.055 a ± 0.551 | 1.430 a ± 0.571 |
| FM_ZF | 2.575 b ± 0.588 | 1.875 a ± 0.430 | 1.860 a ± 0.737 | |
| FM_NS | 2.210 ab ± 0.412 | 1.930 a ± 0.542 | 1.611 a ± 0.768 | |
| FM | 2.185 ab ± 0.485 | 1.605 a ± 0.454 | 1.490 a ± 0.620 | |
| NS | 2.485 ab ± 0.712 | 1.915 a ± 0.382 | 1.665 a ± 0.595 | |
| CL | 2.445 ab ± 0.717 | 2.030 a ± 0.591 | 1.840 a ± 0.426 | |
| Year: | 2015 Term I | 2016 | 2017 Term II | 2018 | 2019 | 2020 Term III |
|---|---|---|---|---|---|---|
| Crop: | Silage maize | Winter wheat | Winter barley | Oilseed rape | Winter wheat | Winter wheat |
| Standard moisture (% DM): | 38.0 | 14.5 | 14.5 | 9.0 | 14.5 | 14.5 |
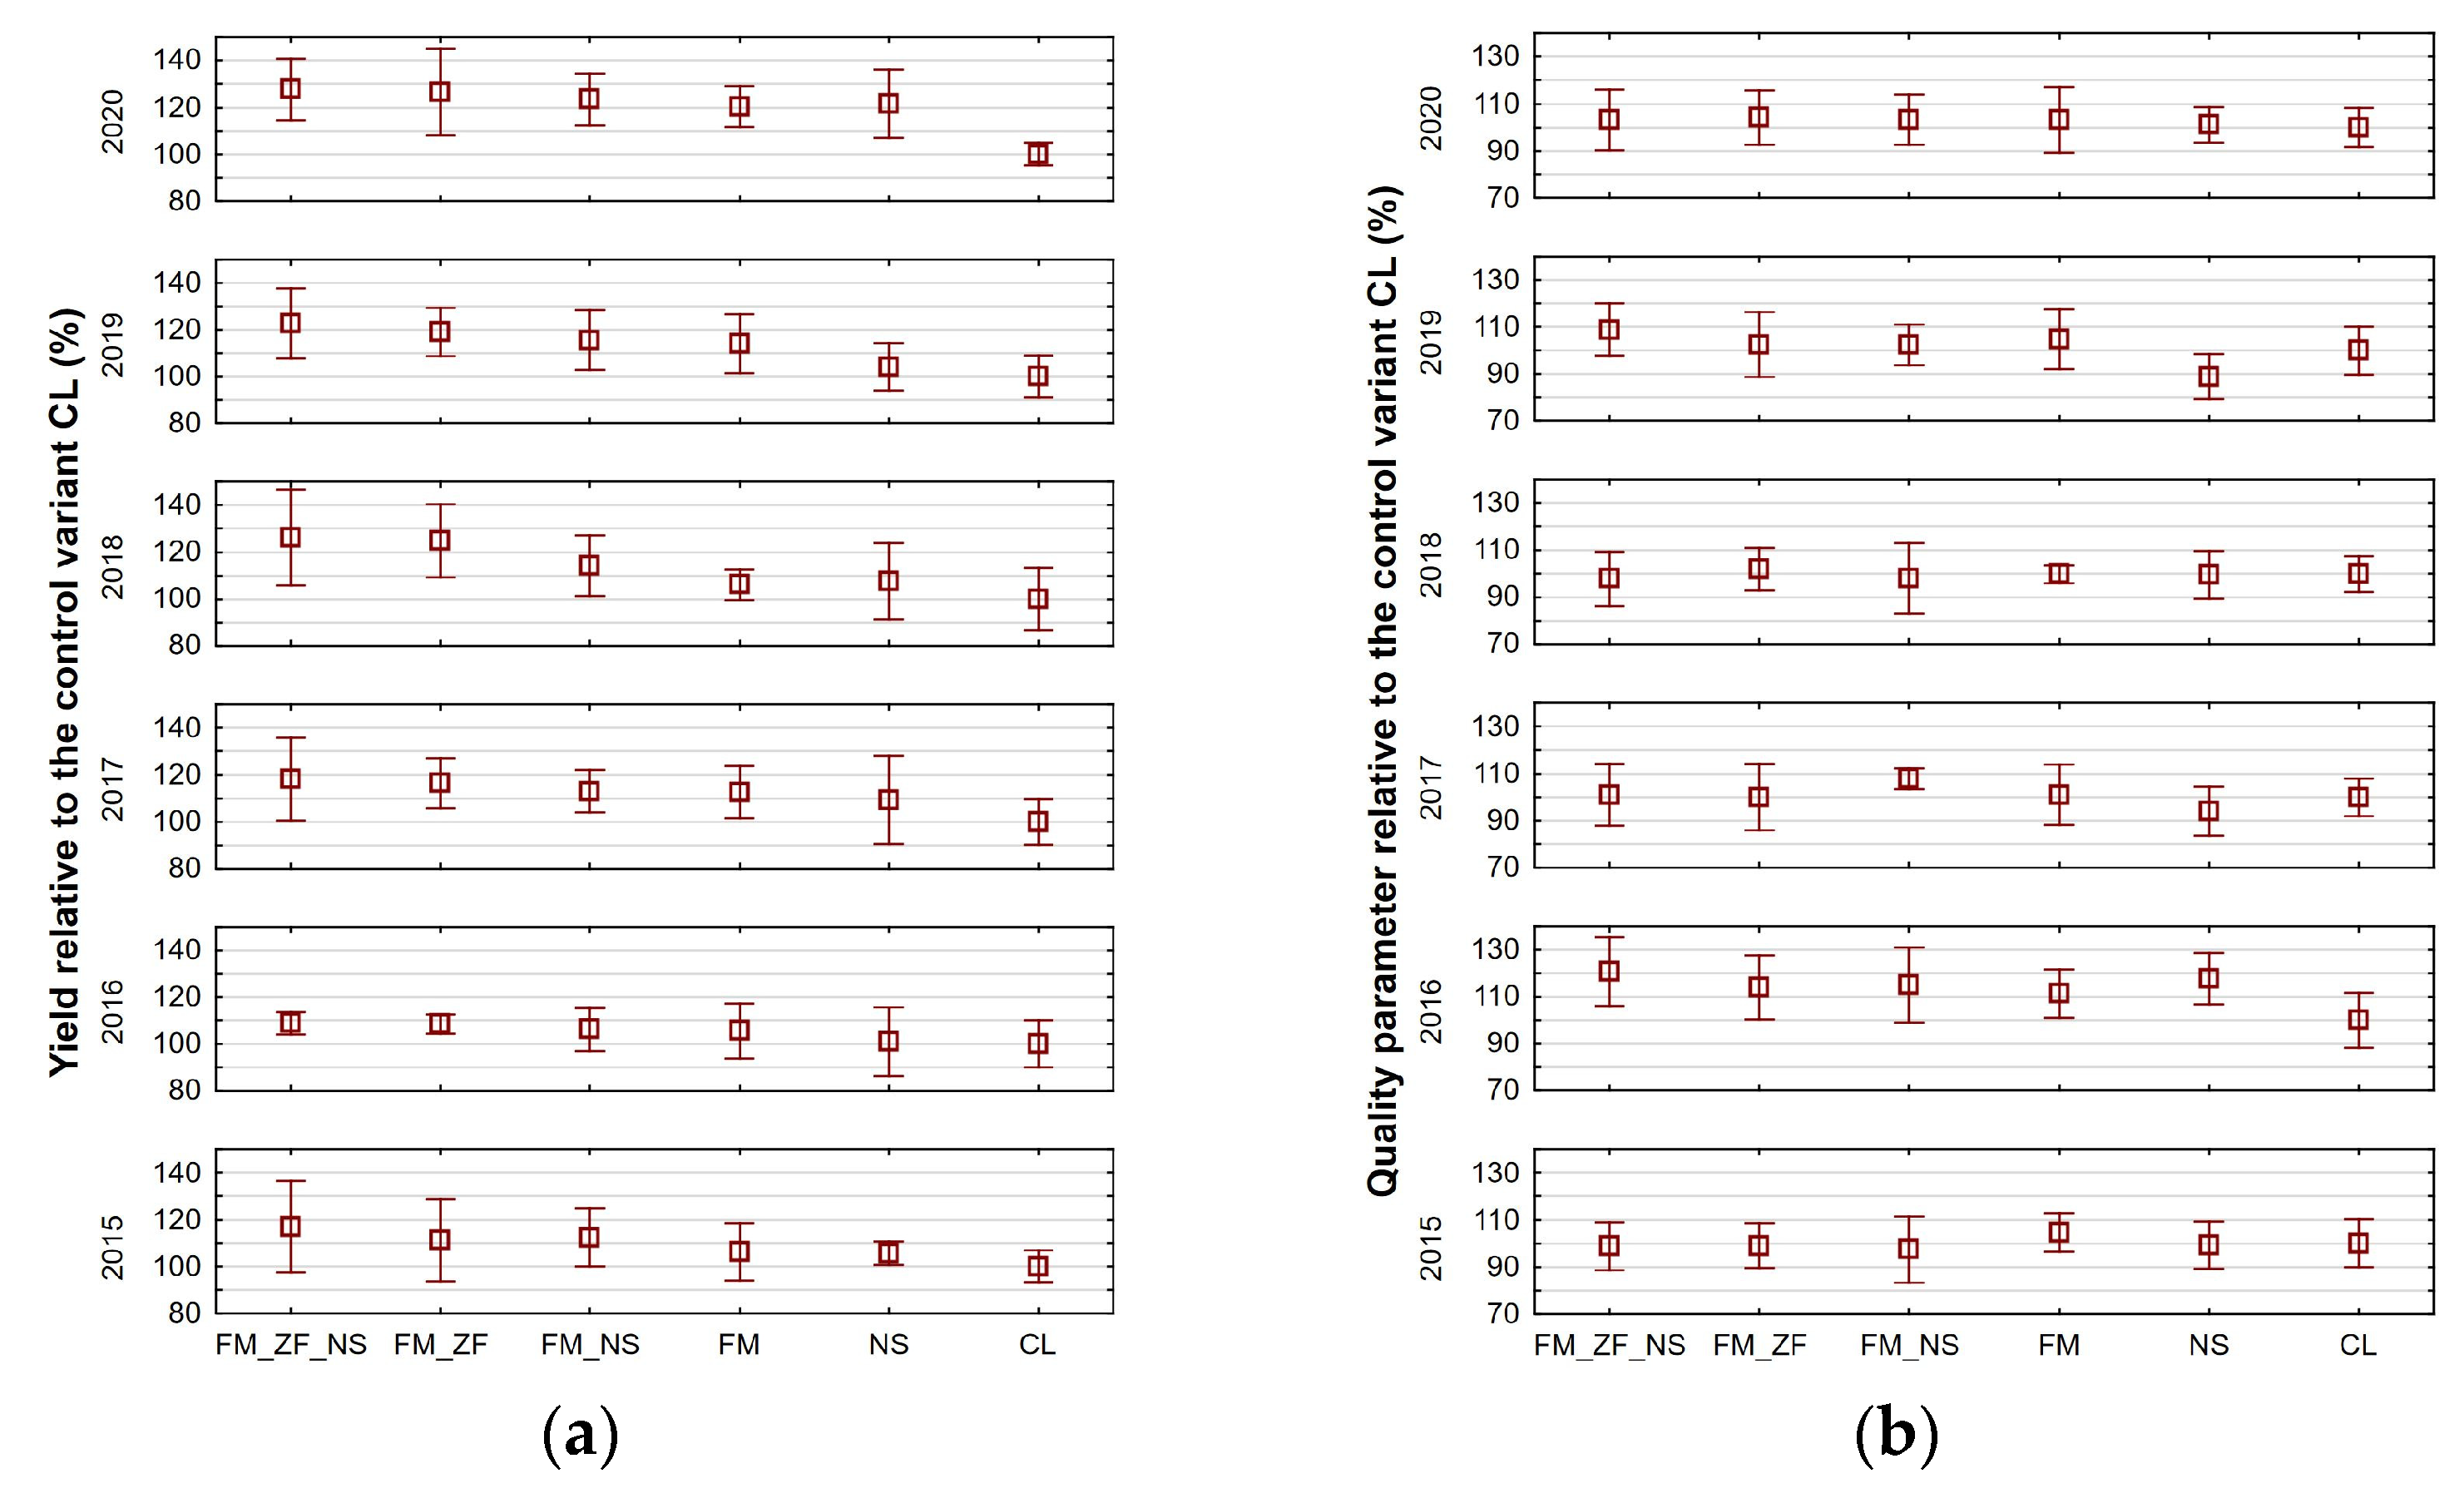
| Variant | Yield at standard moisture (t ha−1) | |||||
| FM_ZF_NS | 35.200 a ± 3.681 | 7.870 a ± 0.214 | 7.780 a ± 0.723 | 4.040 b ± 0.412 | 7.860 c ± 0.602 | 7.380 b ± 0.478 |
| FM_ZF | 33.500 a ± 3.341 | 7.850 a ± 0.188 | 7.660 a ± 0.440 | 3.990 b ± 0.314 | 7.620 bc ± 0.414 | 7.320 b ± 0.672 |
| FM_NS | 33.800 a ± 2.356 | 7.680 a ± 0.415 | 7.440 a ± 0.381 | 3.660 ab ± 0.259 | 7.390 abc ± 0.517 | 7.130 b ± 0.406 |
| FM | 32.000 a ± 2.314 | 7.630 a ± 0.540 | 7.410 a ± 0.458 | 3.400 ab ± 0.130 | 7.300 abc ± 0.509 | 6.950 b ± 0.319 |
| NS | 31.800 a ± 0.935 | 7.310 a ± 0.666 | 7.200 a ± 0.776 | 3.440 ab ± 0.326 | 6.660 ab ± 0.410 | 7.020 b ± 0.533 |
| CL | 30.100 a ± 1.289 | 7.230 a ± 0.456 | 6.580 a ± 0.403 | 3.200 a ± 0.264 | 6.400 a ± 0.363 | 5.780 a ± 0.174 |
| Qualitative parameter and its value (% DM) | ||||||
| Crude protein | Crude protein | Crude protein | Crude fat | Crude protein | Crude protein | |
| FM_ZF_NS | 8.472 a ± 0.548 | 12.900 b ± 0.987 | 10.200 a ± 0.829 | 43.000 a ± 3.178 | 13.600 b ± 0.876 | 9.700 a ± 0.769 |
| FM_ZF | 8.493 a ± 0.510 | 12.200 ab ± 0.912 | 10.100 a ± 0.896 | 44.830 a ± 2.480 | 12.800 ab ± 1.087 | 9.800 a ± 0.685 |
| FM_NS | 8.361 a ± 0.763 | 12.300 ab ± 1.082 | 10.900 a ± 0.273 | 43.120 a ± 4.146 | 12.800 ab ± 0.675 | 9.700 a ± 0.628 |
| FM | 8.976 a ± 0.438 | 11.900 ab ± 0.697 | 10.200 a ± 0.809 | 43.920 a ± 1.067 | 13.100 b ± 1.005 | 9.700 a ± 0.823 |
| NS | 8.509 a ± 0.542 | 12.600 ab ± 0.737 | 9.500 a ± 0.671 | 43.770 a ± 2.771 | 11.100 a ± 0.752 | 9.500 a ± 0.747 |
| CL | 8.575 a ± 0.545 | 10.700 a ± 0.782 | 10.100 a ± 0.512 | 43.990 a ± 2.103 | 12.500 ab ± 0.798 | 9.400 a ± 0.494 |
| BD | UD | SHC | CI at | Yield | Quality | |||
|---|---|---|---|---|---|---|---|---|
| 0–10 cm | 10–20 cm | 0–30 cm | Parameter | |||||
| BD | r = 0.6008 * | r = −0.4802 * | r = −0.0700 | r = 0.6366 * | r = 0.4597 | r = −0.5221 * | r = −0.4951 * | |
| p = 0.0084 | p = 0.0437 | p = 0.783 | p = 0.0045 | p = 0.0549 | p = 0.0263 | p = 0.0367 | ||
| UD | r = 0.6008 * | r = −0.3177 | r = 0.1233 | r = 0.6863 * | r = 0.7554 * | r = −0.4133 | r = −0.1499 | |
| p = 0.0084 | p = 0.1989 | p = 0.6260 | p = 0.0017 | p = 0.0003 | p = 0.0882 | p = 0.5527 | ||
| SHC | r = −0.4802 * | r = −0.3177 | r = 0.1612 | r = −0.1181 | r = −0.1903 | r = 0.2672 | r = 0.3161 | |
| p = 0.0437 | p = 0.1989 | p = 0.5229 | p = 0.6407 | p = 0.4495 | p = 0.2837 | p = 0.2013 | ||
| CI at | r = −0.0700 | r = 0.1233 | r = 0.1612 | r = 0.0899 | r = 0.0637 | r = −0.1855 | r = −0.0579 | |
| 0–10 cm | p = 0.783 | p = 0.6260 | p = 0.5229 | p = 0.7227 | p = 0.8018 | p = 0.4612 | p = 0.8196 | |
| 10–20 cm | r = 0.6366 * | r = 0.6863 * | r = −0.1181 | r = 0.0899 | r = 0.6730 * | r = −0.6607 * | r = −0.3527 | |
| p = 0.0045 | p = 0.0017 | p = 0.6407 | p = 0.7227 | p = 0.0022 | p = 0.0028 | p = 0.1512 | ||
| 20–30 cm | r = 0.4597 | r = 0.7554 * | r = −0.1903 | r = 0.0637 | r = 0.6730 * | r = −0.4737 * | r = −0.1719 | |
| p = 0.0549 | p = 0.0003 | p = 0.4495 | p = 0.8018 | p = 0.0022 | p = 0.0470 | p = 0.4952 | ||
| Yield | r = −0.5221 * | r = −0.4133 | r = 0.2672 | r = −0.1855 | r = −0.6607 * | r = −0.4737 * | r = 0.3516 | |
| p = 0.0263 | p = 0.0882 | p = 0.2837 | p = 0.4612 | p = 0.0028 | p = 0.0470 | p = 0.1525 | ||
| Quality | r = −0.4951 * | r = −0.1499 | r = 0.3161 | r = −0.0579 | r = −0.3527 | r = −0.1719 | r = 0.3516 | |
| parameter | p = 0.0367 | p = 0.5527 | p = 0.2013 | p = 0.8196 | p = 0.1512 | p = 0.4952 | p = 0.1525 | |
| Variant | Dry Matter % | N kg t−1 | C:N | P2O5 | K2O | CaO | MgO | pH |
|---|---|---|---|---|---|---|---|---|
| FM_ZF | 23 | 7.1 | 15.1:1 | 4.2 | 7.9 | 6.44 | 1.99 | 9.5 |
| FM | 23 | 5.9 | 22.3:1 | 3.5 | 6.3 | 4.90 | 1.60 | 8.9 |
| Soil Profile Depth (m) | Unit | ||
|---|---|---|---|
| 0.00–0.30 | 0.30–0.65 | ||
| Clay (<0.002 mm) | 15 | 21 | % w/w |
| Silt (0.002–0.05 mm) | 66 | 67 | % w/w |
| Very fine sand (0.05–0.10 mm) | 3 | 1 | % w/w |
| Fine sand (0.10–0.25 mm) | 16 | 11 | % w/w |
| Bulk density | 1.56 | 1.52 | g·cm−3 |
| Porosity | 41.97 | 42.64 | % w/w |
| Hummus content | 1.81 | 0.58 | % w/w |
| Cation exchange capacity | 110 | 120 | mmol·kg−1 |
| Volumetric moisture | 31.5 | 23.7 | % v/v |
| pH (KCl) | 4.99 | 5.09 | |
| Season | Crop | Variety | Sowing Date | Harvest Date | Farmyard Manure (t ha−1) | NeOsol (kg ha−1) |
|---|---|---|---|---|---|---|
| 2014 | Winter wheat | - | - | - | 50 | 200 |
| 2015 Term I | Maize | SY Kairo | 27 April 2015 | 9 September 2015 | - | 200 |
| 2016 | Winter wheat | Turandot | 7 October 2015 | 17 August 2016 | 30 | 200 |
| 2017 Term II | Barley | Titus | 20 October 2016 | 19 July 2017 | - | 150 |
| 2018 | Rape seed | Inspiration | 15 August 2017 | 16 July 2018 | - | 150 |
| 2019 | Winter wheat | Reform | 22 September 2018 | 9 August 2019 | 30 | 150 |
| 2020 Term III | Winter wheat | Reform | 24 September 2019 | 9 August 2020 | - | 150 |
Disclaimer/Publisher’s Note: The statements, opinions and data contained in all publications are solely those of the individual author(s) and contributor(s) and not of MDPI and/or the editor(s). MDPI and/or the editor(s) disclaim responsibility for any injury to people or property resulting from any ideas, methods, instructions or products referred to in the content. |
© 2024 by the authors. Licensee MDPI, Basel, Switzerland. This article is an open access article distributed under the terms and conditions of the Creative Commons Attribution (CC BY) license (https://creativecommons.org/licenses/by/4.0/).
Share and Cite
Novák, V.; Šařec, P.; Látal, O. Effect of Biostimulant, Manure Stabilizer, and Manure on Soil Physical Properties and Vegetation Status. Plants 2024, 13, 920. https://doi.org/10.3390/plants13070920
Novák V, Šařec P, Látal O. Effect of Biostimulant, Manure Stabilizer, and Manure on Soil Physical Properties and Vegetation Status. Plants. 2024; 13(7):920. https://doi.org/10.3390/plants13070920
Chicago/Turabian StyleNovák, Václav, Petr Šařec, and Oldřich Látal. 2024. "Effect of Biostimulant, Manure Stabilizer, and Manure on Soil Physical Properties and Vegetation Status" Plants 13, no. 7: 920. https://doi.org/10.3390/plants13070920