
Which Has a Greater Impact on Plant Functional Traits: Plant Source or Environment?
 , ,
, , 
Abstract
:1. Introduction
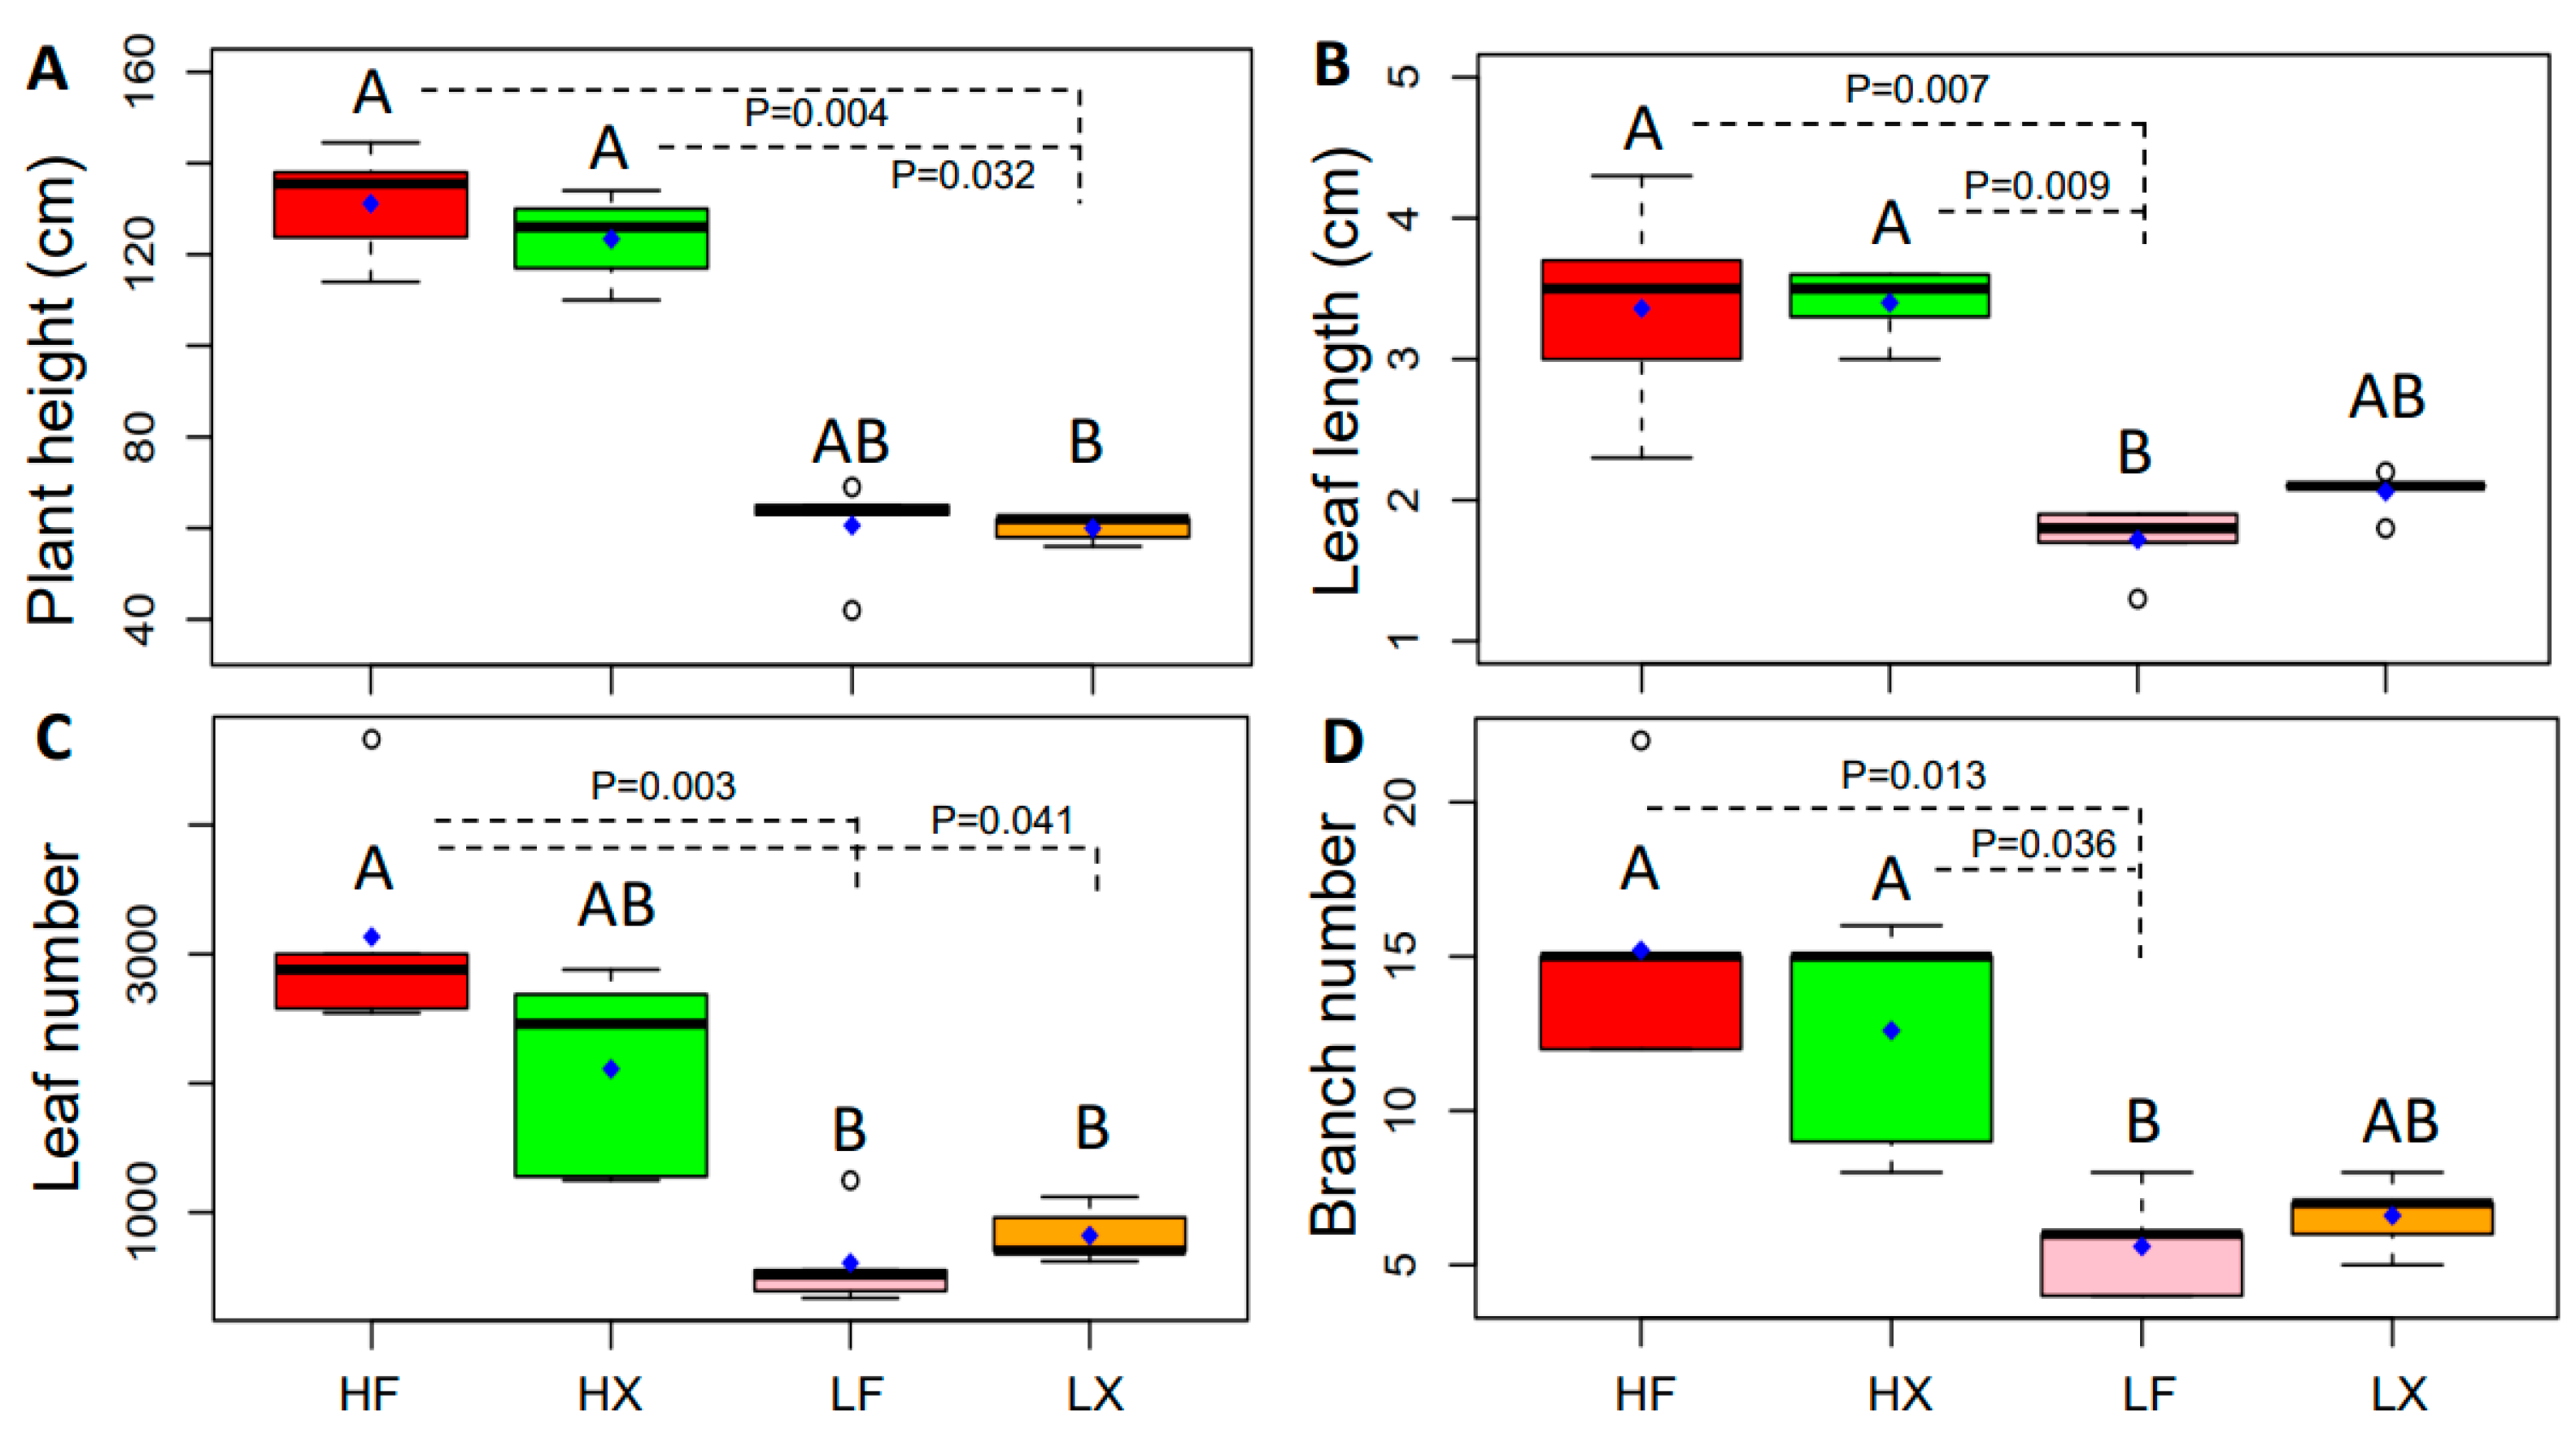
2. Results
2.1. Overall Topological Structure of Network
2.2. Correlation Analyses of Plant Traits with Environmental Factors
2.3. Changes in Plant Phenotypic Plasticity
3. Material and Methods
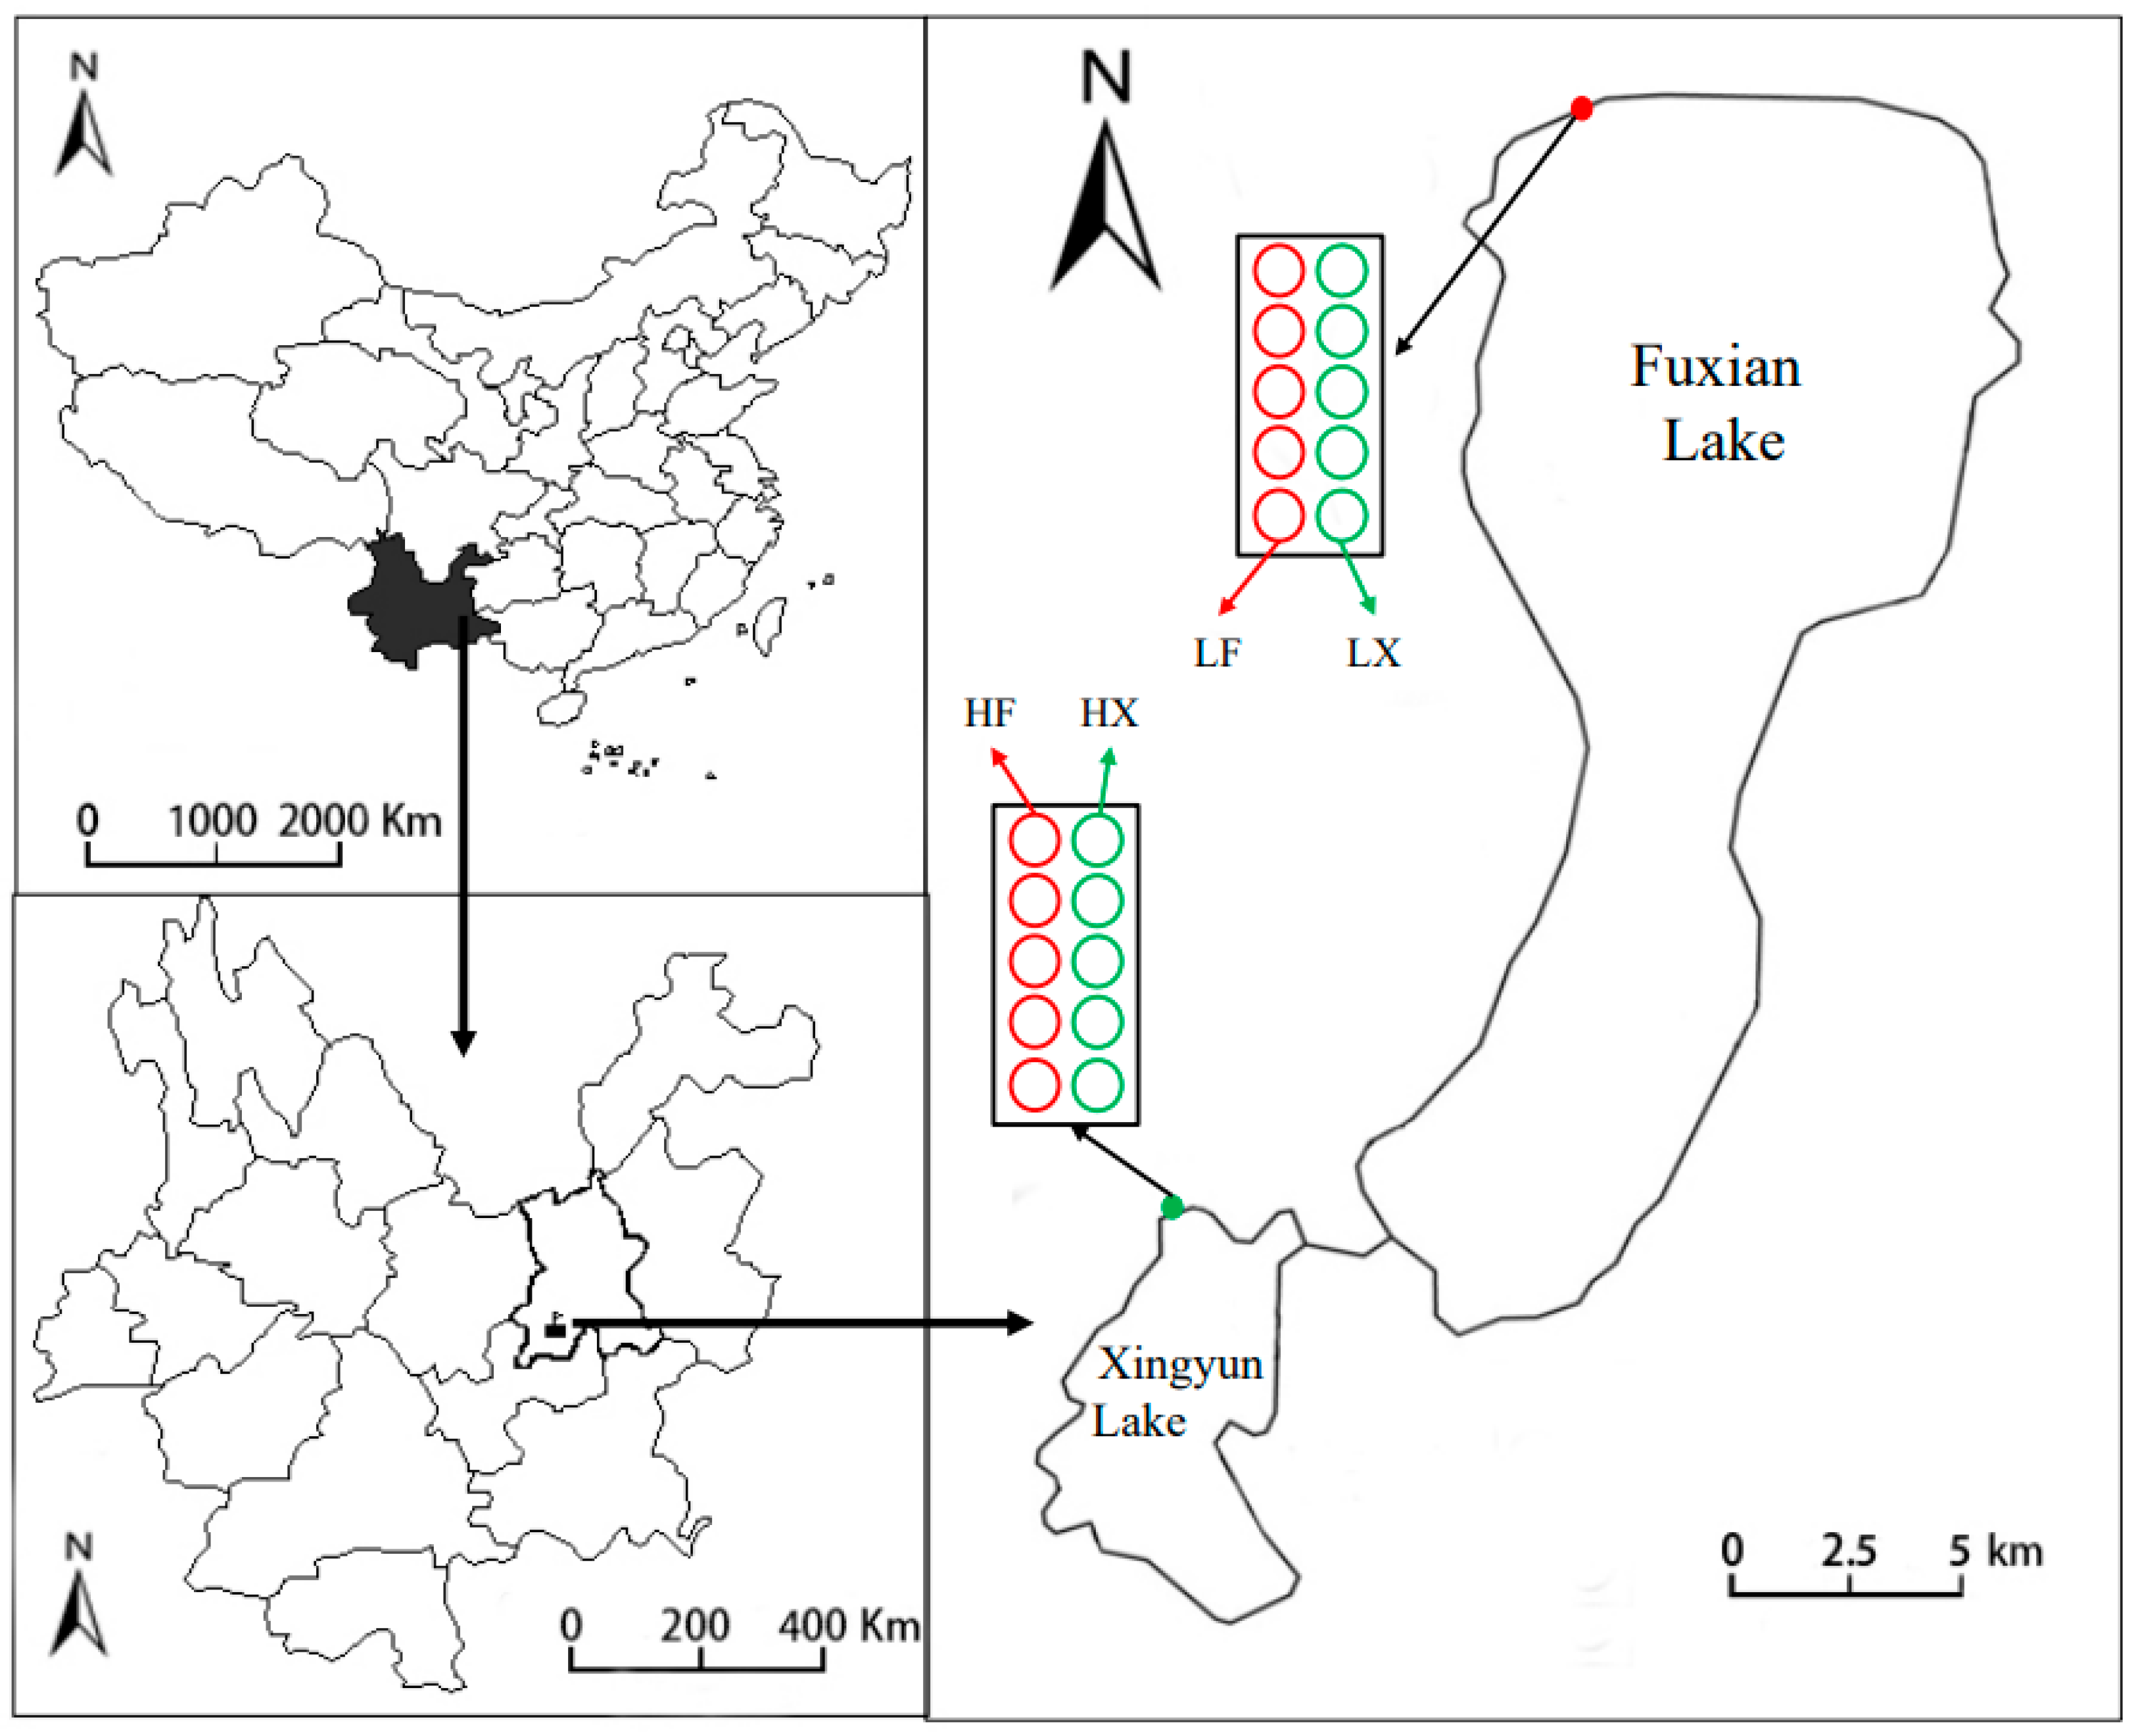
3.1. Experimental Site and Plant Material
3.2. Plant Cultivation
3.3. Estimation of Water Quality and Plant Traits
3.4. Plant Trait Network Analysis
3.5. Statistical Analysis
4. Discussion
4.1. The Topological Structure of the Trait Network
4.2. Characteristics of Plant Functional Traits in Different Treatments
4.3. Adaptation Strategies of Myriophyllum spicatum
5. Conclusions
Author Contributions
Funding
Data Availability Statement
Acknowledgments
Conflicts of Interest
References
- Carpenter, S.R.; Mooney, H.A.; Agard, J.; Capistrano, D.; DeFries, R.S.; Díaz, S.; Dietz, T.; Duraiappah, A.K.; Oteng-Yeboah, A.; Pereira, H.M.; et al. Science for managing ecosystem services: Beyond the millennium ecosystem assessment. Proc. Natl. Acad. Sci. USA 2009, 106, 1305–1312. [Google Scholar] [CrossRef]
- Venter, O.; Sanderson, E.W.; Magrach, A.; Allan, J.R.; Beher, J.; Jones, K.R.; Possingham, H.P.; Laurance, W.F.; Wood, P.; Fekete, B.M.; et al. Sixteen years of change in the global terrestrial human footprint and implications for biodiversity conservation. Nat. Commun. 2016, 7, 12558. [Google Scholar] [CrossRef]
- Cao, T.; Ni, L.; Xie, P.; Xu, J.; Zhang, M. Effects of moderate ammonium enrichment on three submersed macrophytes under contrasting light availability. Freshw. Biol. 2011, 56, 1620–1629. [Google Scholar] [CrossRef]
- Mooney, R.J.; Stanley, E.H.; Rosenthal, W.C.; Esselman, P.C.; Kendall, A.D.; McIntyre, P.B. Outsized nutrient contributions from small tributaries to a Great Lake. Proc. Natl. Acad. Sci. USA 2020, 117, 28175–28182. [Google Scholar] [CrossRef] [PubMed]
- Engelhardt, K.A.M.; Ritchie, M.E. The effect of aquatic plant speciesrichness on wetland ecosystem processes. Ecology 2002, 83, 2911–2924. [Google Scholar] [CrossRef]
- Phillips, G.; Willby, N.; Moss, B. Submerged macrophyte decline in shallow lakes: What have we learnt in the last forty years? Aquat. Bot. 2016, 135, 37–45. [Google Scholar] [CrossRef]
- Yuan, G.; Tan, X.; Guo, P.; Xing, K.; Chen, Z.; Li, D.; Yu, S.; Peng, H.; Li, W.; Fu, H.; et al. Linking trait network to growth performance of submerged macrophytes in response to ammonium pulse. Water Res. 2023, 229, 119403. [Google Scholar] [CrossRef] [PubMed]
- Jeppesen, E.; Peder Jensen, J.; Søndergaard, M.; Lauridsen, T.; Junge Pedersen, L.; Jensen, L. Top-down control in freshwater lakes: The role of nutrient state, submerged macrophytes and water depth. In Shallow Lakes ’95; Kufel, L., Prejs, A., Rybak, J.I., Eds.; Springer: Dordrecht, The Netherlands, 1997; pp. 151–164. [Google Scholar]
- Cao, T.; Ni, L.; Xie, P. Acute biochemical responses of a submersed macrophyte, Potamogeton crispus L., to high ammonium in an aquarium experiment. J. Freshw. Ecol. 2004, 19, 279–284. [Google Scholar] [CrossRef]
- Cao, X.; Zhong, C.; Zhu, C.; Zhu, L.; Zhang, J.; Wu, L.; Jin, Q. Ammonium uptake and metabolism alleviate PEG-induced water stress in rice seedlings. Plant Physiol. Biochem. 2018, 132, 128–137. [Google Scholar] [CrossRef] [PubMed]
- Diaz, S.; Kattge, J.; Cornelissen, J.H.C.; Wright, I.J.; Lavorel, S.; Dray, S.; Reu, B.; Kleyer, M.; Wirth, C.; Prentice, I.C.; et al. The global spectrum of plant form and function. Nature 2016, 529, 167–171. [Google Scholar] [CrossRef]
- Poorter, H.; Niinemets, Ü.; Ntagkas, N.; Siebenkäs, A.; Mäenpää, M.; Matsubara, S.; Pons, T.L. A meta-analysis of plant responses to light intensity for 70 traits ranging from molecules to whole plant performance. New Phytol. 2019, 223, 1073–1105. [Google Scholar] [CrossRef] [PubMed]
- Pérez-Harguindeguy, N.; Díaz, S.; Garnier, E.; Lavorel, S.; Poorter, H.; Jaureguiberry, P.; Bret-Harte, M.S.; Cornwell, W.K.; Craine, J.M.; Gurvich, D.E.; et al. New handbook for standardised measurement of plant functional traits worldwide. Aust. J. Bot. 2013, 61, 167. [Google Scholar] [CrossRef]
- Franklin, K.A.; Whitelam, G.C. Phytochromes and shade-avoidance responses in plants. Ann. Bot. 2005, 96, 169–175. [Google Scholar] [CrossRef] [PubMed]
- Lavorel, S.; Garnier, E. Predicting changes in community composition and ecosystem functioning from plant traits: Revisiting the Holy Grail. Funct. Ecol. 2002, 83, 2911–2924. [Google Scholar] [CrossRef]
- Kosová, V.; Latzel, V.; Hadincová, V.; Münzbergová, Z. Effect of DNA methylation, modified by 5-azaC, on ecophysiological responses of a clonal plant to changing climate. Sci. Rep. 2022, 12, 17262. [Google Scholar] [CrossRef] [PubMed]
- Meyerson, L.A.; Cronin, J.T.; Bhattarai, G.P.; Brix, H.; Lambertini, C.; Lučanová, M.; Rinehart, S.; Suda, J.; Pyšek, P. Do ploidy level and nuclear genome size and latitude of origin modify the expression of Phragmites australis traits and interactions with herbivores? Biol. Invasions 2016, 18, 2531–2549. [Google Scholar] [CrossRef]
- Wang, X.; Ji, M.; Zhang, Y.; Zhang, L.; Akram, M.A.; Dong, L.; Hu, W.; Xiong, J.; Sun, Y.; Li, H.; et al. Plant trait networks reveal adaptation strategies in the drylands of China. BMC Plant Biol. 2023, 23, 266. [Google Scholar] [CrossRef] [PubMed]
- Rao, Q.; Su, H.; Ruan, L.; Xia, W.; Deng, X.; Wang, L.; Xu, P.; Shen, H.; Chen, J.; Xie, P. Phosphorus enrichment affects trait network topologies and the growth of submerged macrophytes. Environ. Pollut. 2022, 292, 118331. [Google Scholar] [CrossRef]
- Anneberg, T.J.; Segraves, K.A. Neopolyploidy causes increased nutrient requirements and a shift in plant growth strategy in Heuchera cylindrica. Ecology 2023, 104, e4054. [Google Scholar] [CrossRef]
- Reich, P.; Walters, M.; Ellsworth, D. From tropics to tundra: Global convergence in plant functioning. Proc. Natl. Acad. Sci. USA 1997, 94, 13730–13734. [Google Scholar] [CrossRef]
- Cheng, X.; Ping, T.; Li, Z.; Wang, T.; Han, H.; Epstein, H.E. Effects of environmental factors on plant functional traits across different plant life forms in a temperate forest ecosystem. New For. 2022, 53, 125–142. [Google Scholar] [CrossRef]
- Wei, B.; Zhang, D.; Wang, G.; Liu, Y.; Li, Q.; Zheng, Z.; Yang, G.; Peng, Y.; Niu, K.; Yang, Y. Experimental warming altered plant functional traits and their coordination in a permafrost ecosystem. New Phytol. 2023, 240, 1802–1816. [Google Scholar] [CrossRef]
- Donnelly, R.C.; Wedel, E.R.; Taylor, J.H.; Nippert, J.B.; Helliker, B.R.; Riley, W.J.; Still, C.J.; Griffith, D.M. Evolutionary lineage explains trait variation among 75 coexisting grass species. New Phytol. 2023, 239, 875–887. [Google Scholar] [CrossRef]
- Abernethy, V.J.; Sabbatini, M.R.; Murphy, K.J. Response of Elodea canadensis Michx. and Myriophyllum spicatum L. to shade, cutting and competition in experimental culture. Hydrobiologia 1996, 340, 219–224. [Google Scholar] [CrossRef]
- Zhang, L.; Wang, S.; Jiao, L.; Zhao, H.; Zhang, Y.; Li, Y. Physiological response of a submerged plant (Myriophyllum spicatum) to different NH4Cl concentrations in sediments. Ecol. Eng. 2013, 58, 91–98. [Google Scholar] [CrossRef]
- Apudo, A.A.; Cao, Y.; Wakibia, J.; Li, W.; Liu, F. Physiological plastic responses to acute NH4+–N toxicity in Myriophyllum spicatum L. cultured in high and low nutrient conditions. Environ. Exp. Bot. 2016, 130, 79–85. [Google Scholar] [CrossRef]
- Xian, L.; Zhang, Y.; Cao, Y.; Wan, T.; Gong, Y.; Dai, C.; Ochieng, W.A.; Nasimiyu, A.T.; Li, W.; Liu, F. Glutamate dehydrogenase plays an important role in ammonium detoxification by submerged macrophytes. Sci. Total Environ. 2020, 722, 137859. [Google Scholar] [CrossRef] [PubMed]
- Xian, L.; Wan, T.; Cao, Y.; Sun, J.; Wu, T.; Apudo, A.A.; Li, W.; Liu, F. Structural Variability and Functional Prediction in the Epiphytic Bacteria Assemblies of Myriophyllum spicatum. Curr. Microbiol. 2020, 77, 3582–3594. [Google Scholar] [CrossRef]
- Huang, J.; Kankanamge, N.R.; Chow, C.; Welsh, D.T.; Li, T.; Teasdale, P.R. Removing ammonium from water and wastewater using cost-effective adsorbents: A review. J. Environ. Sci. 2018, 63, 174–197. [Google Scholar] [CrossRef]
- Maberly, S.C.; Spence, D.H.N. Photosynthetic inorganic carbon use by freshwater plants. Br. Ecol. Soc. 1983, 705–724. [Google Scholar] [CrossRef]
- Kleyer, M.; Trinogga, J.; Cebrián-Piqueras, M.A.; Trenkamp, A.; Fløjgaard, C.; Ejrnæs, R.; Bouma, T.J.; Minden, V.; Maier, M.; Mantilla-Contreras, J.; et al. Trait correlation network analysis identifies biomass allocation traits and stem specific length as hub traits in herbaceous perennial plants. J. Ecol. 2019, 107, 829–842. [Google Scholar] [CrossRef]
- Rao, Q.; Su, H.; Ruan, L.; Deng, X.; Wang, L.; Rao, X.; Liu, J.; Xia, W.; Xu, P.; Shen, H.; et al. Stoichiometric and physiological mechanisms that link hub traits of submerged macrophytes with ecosystem structure and functioning. Water Res. 2021, 850, 117392. [Google Scholar] [CrossRef] [PubMed]
- Li, Y.; Liu, C.; Sack, L.; Xu, L.; Li, M.; Zhang, J.; He, N. Leaf trait network architecture shifts with species-richness and climate across forests at continental scale. Ecol. Lett. 2022, 25, 1442–1457. [Google Scholar] [CrossRef] [PubMed]
- He, N.; Li, Y.; Liu, C.; Xu, L.; Li, M.; Zhang, J.; He, J.; Tang, Z.; Han, X.; Ye, Q.; et al. Plant trait networks: Improved resolution of the dimensionality of adaptation. Trends Ecol. Evol. 2020, 35, 908–918. [Google Scholar] [CrossRef]
- Wang, L.; Rao, Q.; Su, H.; Ruan, L.; Deng, X.; Liu, J.; Chen, J.; Xie, P. Linking the network topology of plant traits with community structure, functioning, and adaptive strategies of submerged macrophytes. Sci. Total Environ. 2022, 850, 158092. [Google Scholar] [CrossRef]
- Fleischmann, R.D.; Adams, M.D.; White, O.; Clayton, R.A.; Kirkness, E.F.; Kerlavage, A.R.; Bult, C.J.; Tomb, J.F.; Dougherty, B.A.; Merrick, J.M.; et al. Whole-genome random sequencing and assembly of Haemophilus influenzae Rd. Science 1995, 269, 496–512. [Google Scholar] [CrossRef]
- Barabási, A.-L.; Oltvai, Z.N. Network biology: Understanding the cell’s functional organization. Nat. Rev. Genet. 2004, 5, 101–113. [Google Scholar] [CrossRef]
- Shannon, P.; Markiel, A.; Ozier, O.; Baliga, N.S.; Wang, J.T.; Ramage, D.; Amin, N.; Schwikowski, B.; Ideker, T. Cytoscape: A software environment for integrated models of biomolecular interaction networks. Genome Res. 2003, 13, 2498–2504. [Google Scholar] [CrossRef] [PubMed]
- Proulx, S.; Promislow, D.; Phillips, P. Network thinking in ecology and evolution. Trends Ecol. Evol. 2005, 20, 345–353. [Google Scholar] [CrossRef]
- Wang, S.; Wang, X.; Han, X.; Deng, Y. Higher precipitation strengthens the microbial interactions in semi-arid grassland soils. Glob. Ecol. Biogeogr. 2018, 27, 570–580. [Google Scholar] [CrossRef]
- Wang, C.; Wang, J. Spatial pattern of the global shipping network and its hub-and-spoke system. Res. Transp. Econ. 2011, 32, 54–63. [Google Scholar] [CrossRef]
- Wang, J.; Mo, H.; Wang, F.; Jin, F. Exploring the network structure and nodal centrality of China’s air transport network: A complex network approach. J. Transp. Geogr. 2011, 19, 712–721. [Google Scholar] [CrossRef]
- Flores-Moreno, H.; Fazayeli, F.; Banerjee, A.; Datta, A.; Kattge, J.; Butler, E.E.; Atkin, O.K.; Wythers, K.; Chen, M.; Anand, M.; et al. Robustness of trait connections across environmental gradients and growth forms. Glob. Ecol. Biogeogr. 2019, 28, 1806–1826. [Google Scholar] [CrossRef]
- Xu, X.; Lu, R.; Yan, L.; Xia, J. Plant NE: A global database of plant biomass from nitrogen-addition experiments. Ecology 2019, 100, e02840. [Google Scholar] [CrossRef]
- Chotikarn, P.; Kaewchana, P.; Roekngandee, P.; Pramneechote, P.; Prathep, A.; Sinutok, S. Combined effects of warming and shanding on growth and photosynthetic pereormance of submerged macrophytes from songkhla lagoon, thailand. Appl. Ecol. Environ. Res. 2021, 19, 2575–2592. [Google Scholar] [CrossRef]
- Niinemets, Ü. A review of light interception in plant stands from leaf to canopy in different plant functional types and in species with varying shade tolerance. Ecol. Res. 2010, 25, 693–714. [Google Scholar] [CrossRef]
- Gałczyńska, M.; Bednarz, K. Influence of water contamination on the accumulation of some metals in Hydrocharis morsus-ranae L. J. Elem. 2012, 17, 31–41. [Google Scholar] [CrossRef]
- Dumont, E.R.; Larue, C.; Michel, H.C.; Gryta, H.; Liné, C.; Baqué, D.; Gross, E.M.; Elger, A. Genotypes of the aquatic plant Myriophyllum spicatum with different growth strategies show contrasting sensitivities to copper contamination. Chemosphere 2020, 245, 125552. [Google Scholar] [CrossRef]
- He, L.; Wang, R.; Zhang, H.; Zhang, M.; Liu, Y.; Zhu, G.; Cao, T.; Ni, L.; Ge, G. Growth and anchorage of Myriophyllum spicatum L. in relation to water depth and the content of organic matter in sediment. Front. Environ. Sci. 2021, 9, 766413. [Google Scholar] [CrossRef]
- Lemoine, D.G.; Mermillod-Blondin, F.; Barrat-Segretain, M.-H.; Massé, C.; Malet, E. The ability of aquatic macrophytes to increase root porosity and radial oxygen loss determines their resistance to sediment anoxia. Aquat. Ecol. 2012, 46, 191–200. [Google Scholar] [CrossRef]
- Atapaththu, K.S.S.; Parveen, M.; Asaeda, T.; Rashid, M.H. Growth and oxidative stress response of aquatic macrophyte Myriophyllum spicatum to sediment anoxia. Fundam. Appl. Limnol. 2018, 191, 289–298. [Google Scholar] [CrossRef]


| Treatment | Date | T (°C) | C (μS/cm) | TDS (mg/L) | SAL (ppt) | pH | ORP (mV) | TN (mg/L) | TP (mg/L) | ||||||||
|---|---|---|---|---|---|---|---|---|---|---|---|---|---|---|---|---|---|
| ave | sd | ave | sd | ave | sd | ave | sd | ave | sd | ave | sd | ave | sd | ave | sd | ||
| LF | August 2014 | 25.30 | 1.407 | 340.10 | 16.214 | 220.09 | 11.624 | 0.15 | 0.034 | 9.01 | 0.183 | 89.08 | 3.426 | 0.30 | 0.039 | 0.01 | 0.003 |
| LX | August 2014 | 26.54 | 0.378 | 323.63 | 6.963 | 204.40 | 4.463 | 0.11 | 0.017 | 9.22 | 0.072 | 88.38 | 1.308 | 0.22 | 0.073 | 0.01 | 0.004 |
| HF | August 2014 | 24.62 | 0.377 | 747.80 | 10.616 | 486.20 | 5.438 | 0.37 | 0.005 | 9.16 | 0.130 | 67.34 | 4.423 | 3.71 | 1.609 | 0.42 | 0.125 |
| HX | August 2014 | 24.30 | 0.245 | 747.80 | 7.727 | 491.40 | 3.560 | 0.37 | 0.004 | 9.18 | 0.044 | 56.98 | 6.184 | 6.14 | 1.458 | 0.67 | 0.136 |
| LF | August 2015 | 21.40 | 0.173 | 290.76 | 12.153 | 202.93 | 8.492 | 0.15 | 0.008 | 9.43 | 0.123 | 80.76 | 2.736 | 0.49 | 0.168 | 0.05 | 0.005 |
| LX | August 2015 | 21.50 | 0.224 | 286.36 | 15.483 | 199.55 | 10.164 | 0.15 | 0.009 | 9.44 | 0.063 | 74.34 | 4.649 | 0.35 | 0.104 | 0.06 | 0.006 |
| HF | August 2015 | 22.60 | 0.587 | 726.60 | 14.100 | 495.30 | 11.628 | 0.37 | 0.008 | 9.54 | 0.166 | 71.44 | 7.491 | 1.79 | 0.303 | 0.22 | 0.036 |
| HX | August 2015 | 22.62 | 0.769 | 697.80 | 32.874 | 477.10 | 16.315 | 0.35 | 0.011 | 9.99 | 0.193 | 77.20 | 3.738 | 1.23 | 0.707 | 0.17 | 0.076 |
Disclaimer/Publisher’s Note: The statements, opinions and data contained in all publications are solely those of the individual author(s) and contributor(s) and not of MDPI and/or the editor(s). MDPI and/or the editor(s) disclaim responsibility for any injury to people or property resulting from any ideas, methods, instructions or products referred to in the content. |
© 2024 by the authors. Licensee MDPI, Basel, Switzerland. This article is an open access article distributed under the terms and conditions of the Creative Commons Attribution (CC BY) license (https://creativecommons.org/licenses/by/4.0/).
Share and Cite
Xian, L.; Yang, J.; Muthui, S.W.; Ochieng, W.A.; Linda, E.L.; Yu, J. Which Has a Greater Impact on Plant Functional Traits: Plant Source or Environment? Plants 2024, 13, 903. https://doi.org/10.3390/plants13060903
Xian L, Yang J, Muthui SW, Ochieng WA, Linda EL, Yu J. Which Has a Greater Impact on Plant Functional Traits: Plant Source or Environment? Plants. 2024; 13(6):903. https://doi.org/10.3390/plants13060903
Chicago/Turabian StyleXian, Ling, Jiao Yang, Samuel Wamburu Muthui, Wyckliffe Ayoma Ochieng, Elive Limunga Linda, and Junshuang Yu. 2024. "Which Has a Greater Impact on Plant Functional Traits: Plant Source or Environment?" Plants 13, no. 6: 903. https://doi.org/10.3390/plants13060903