
Tracking Phenological Changes over 183 Years in Endemic Species of a Mediterranean Mountain (Sierra Nevada, SE Spain) Using Herbarium Specimens


Abstract
:1. Introduction
2. Methods
2.1. Study Area
2.2. Phenological Data
2.3. Statistical Analyses
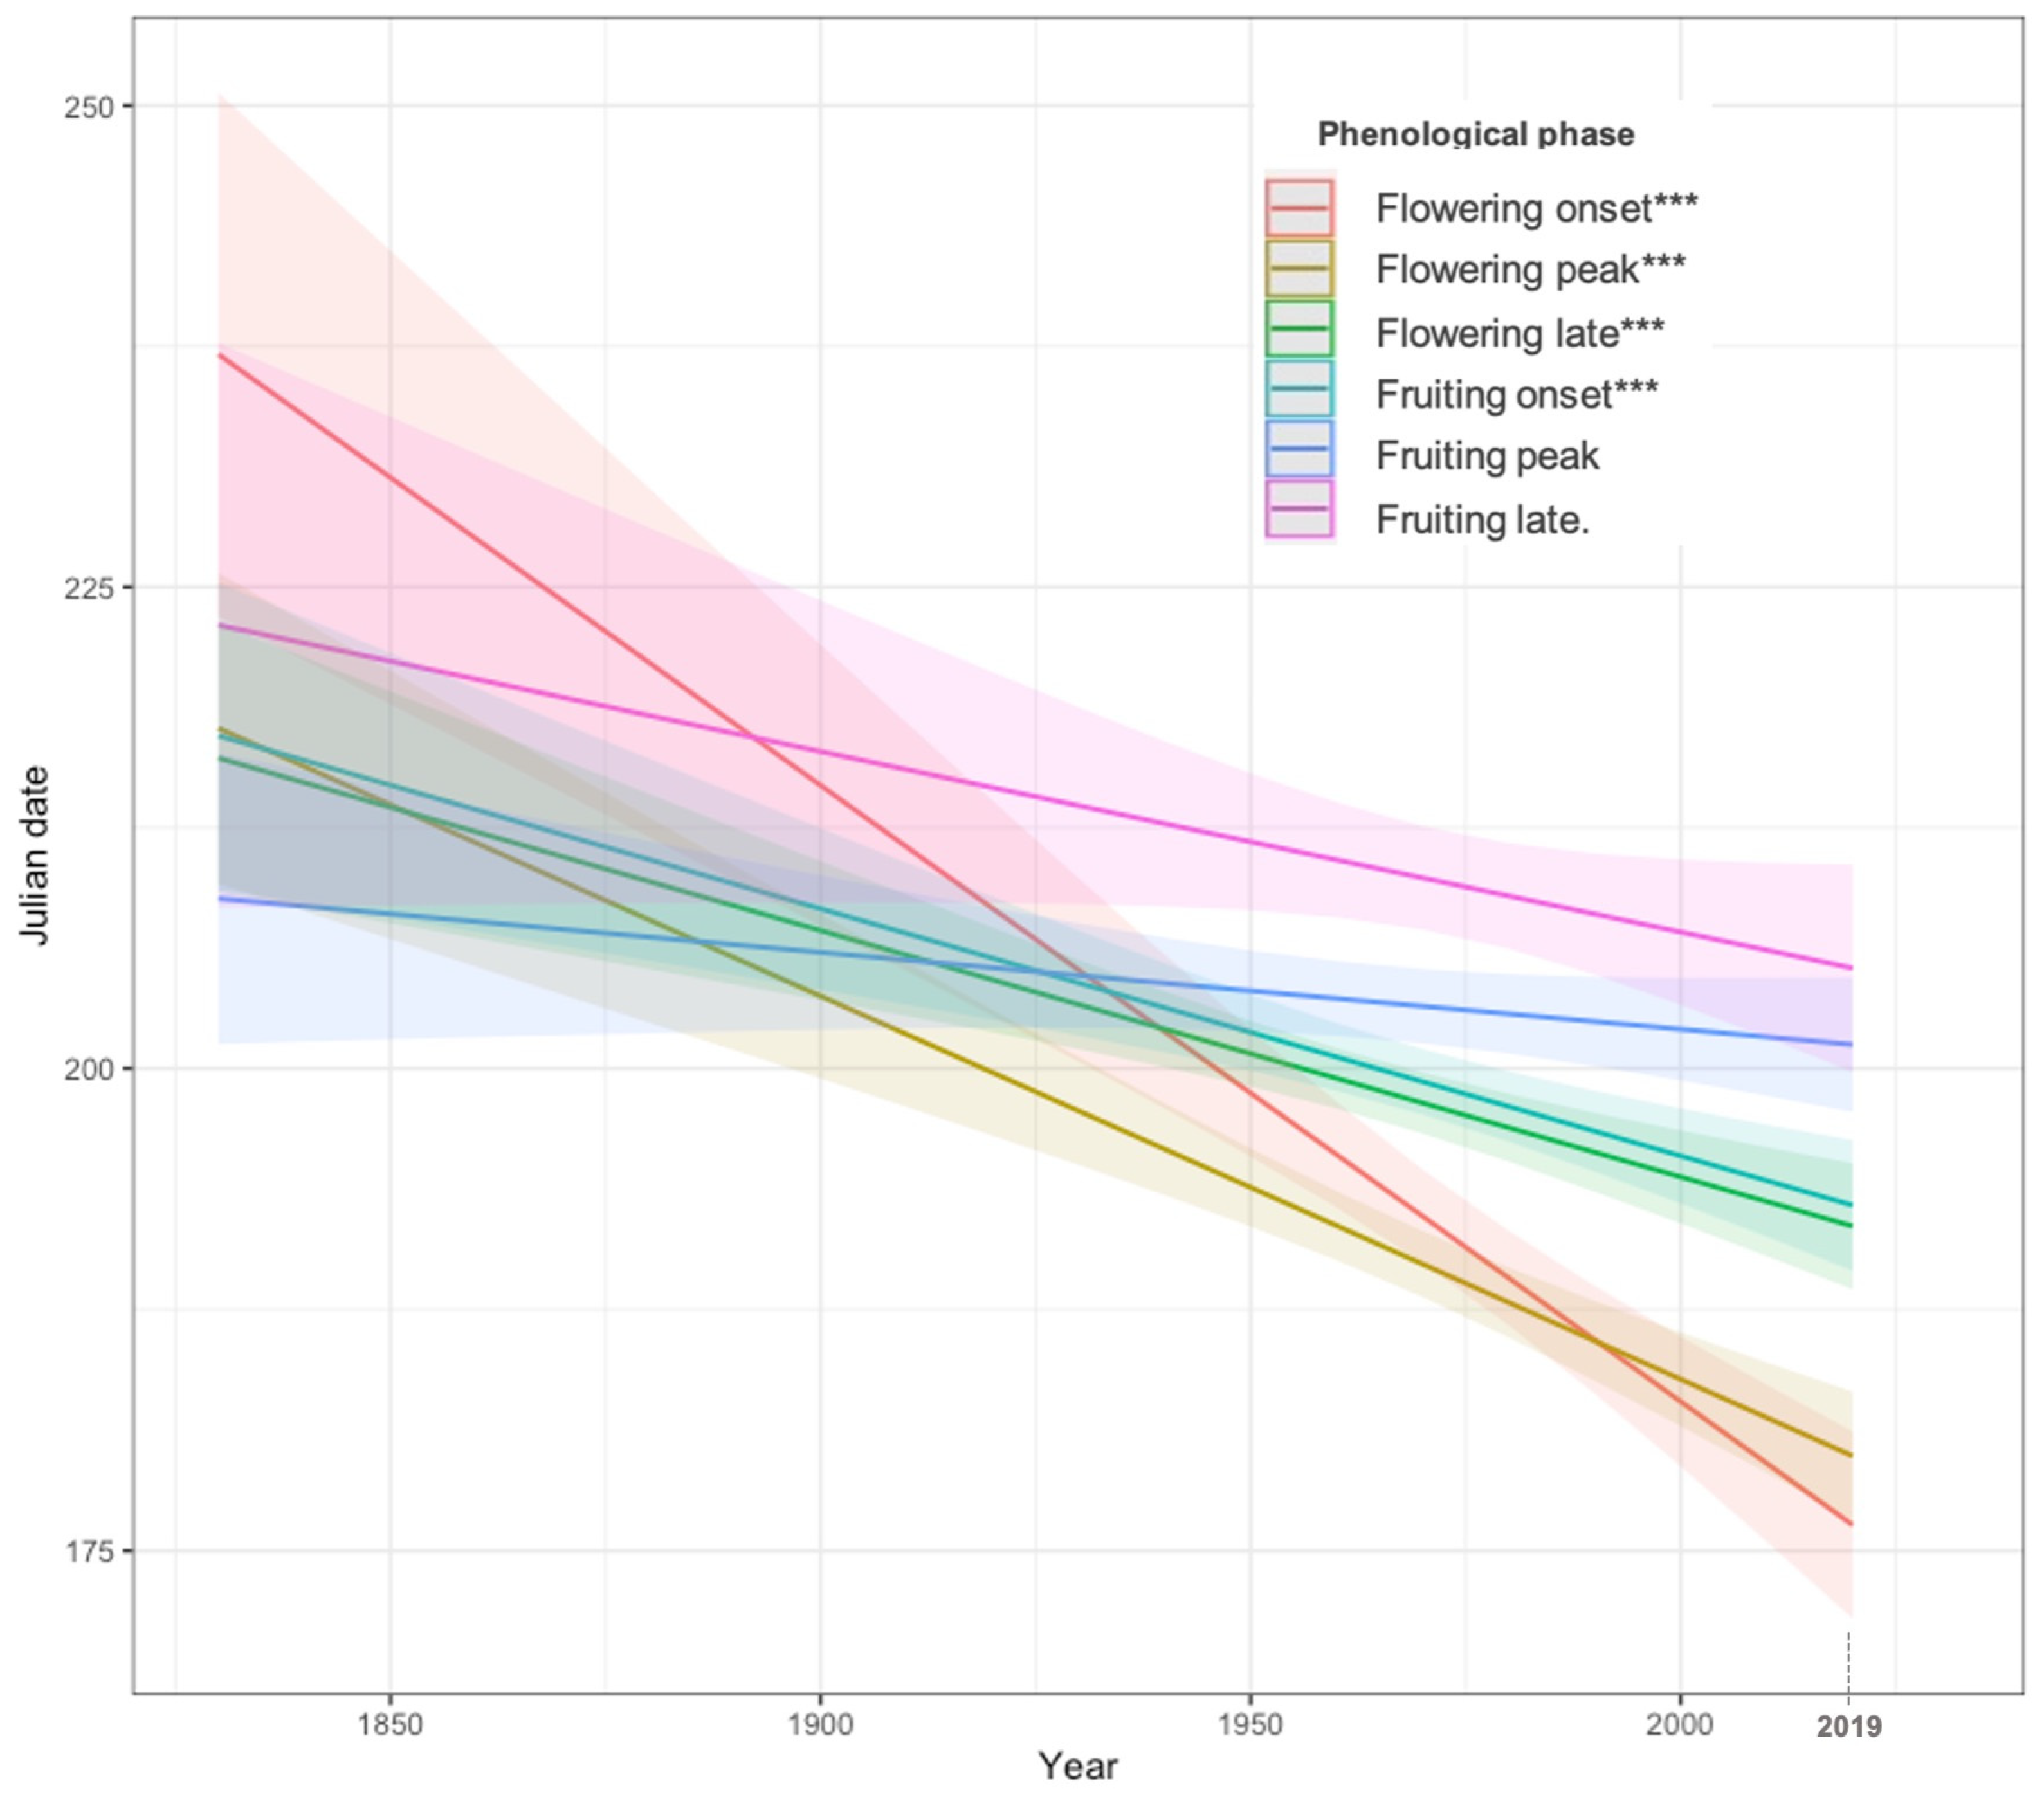
3. Results
3.1. Phenological Trends at Massif Scale
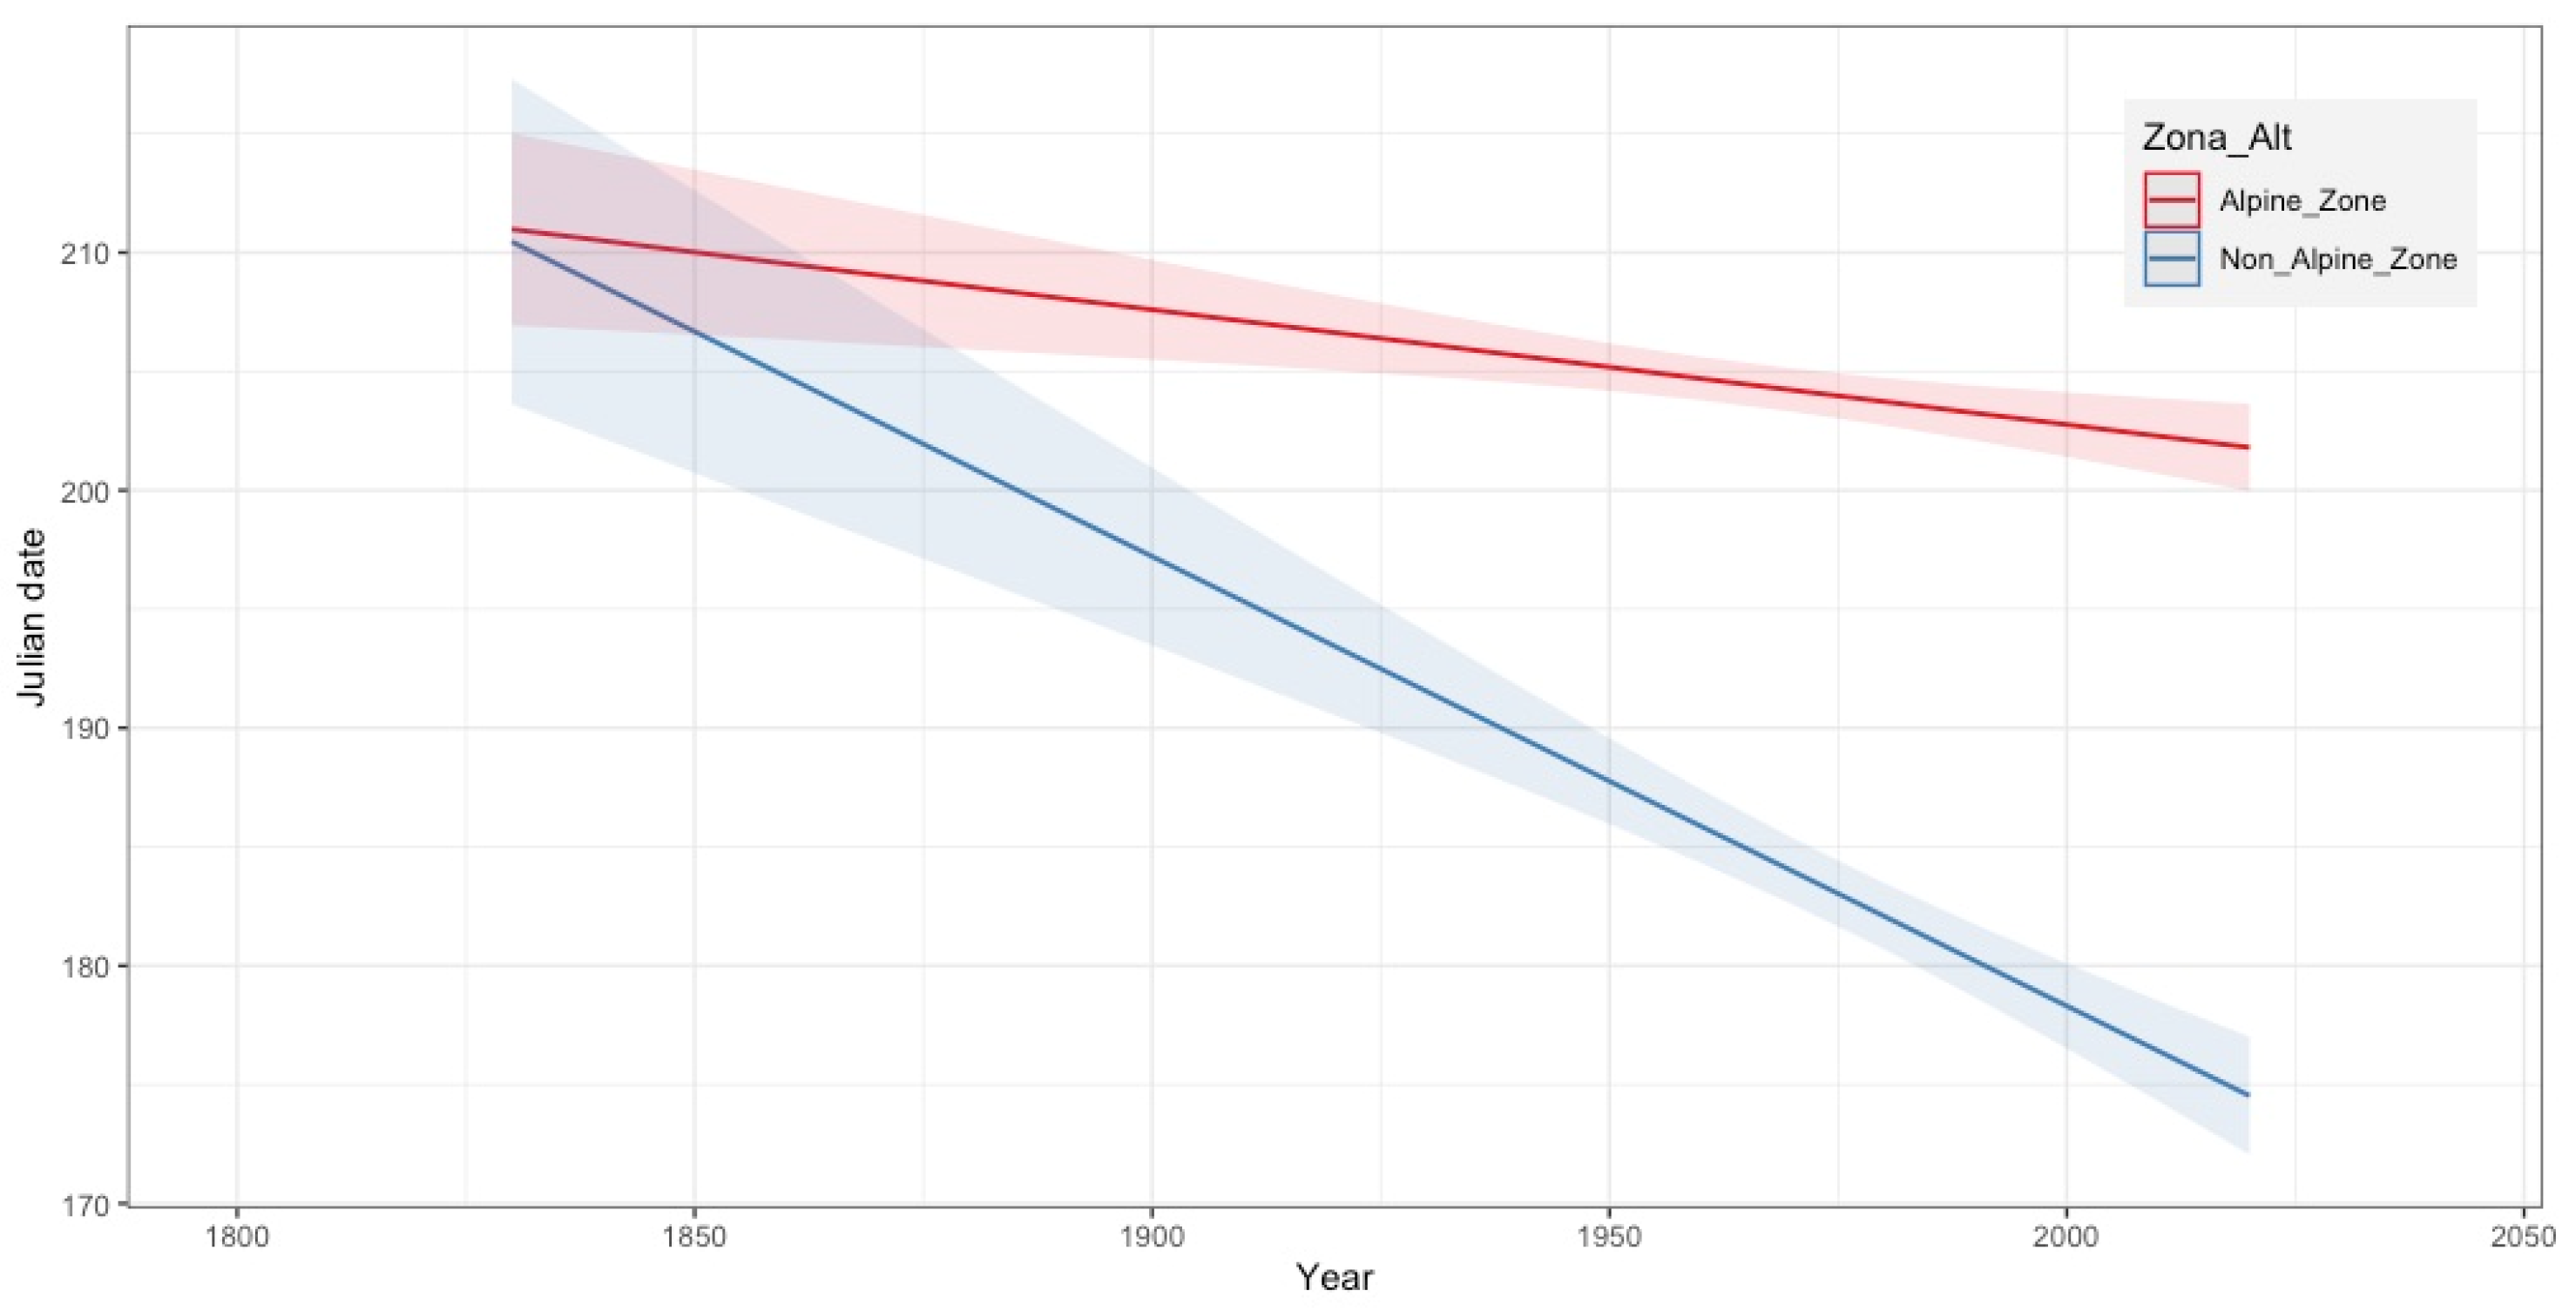
3.2. Phenological Trends by Altitudinal Range
3.3. Phenological Trends by Species
4. Discussion
Author Contributions
Funding
Data Availability Statement
Acknowledgments
Conflicts of Interest
Appendix A
| Taxa | n | Distribution Range | Conservation Status | |
| 1 | Ranunculus acetosellifolius Boiss. | 321 | endemic | NT |
| 2 | Scorzoneroides microcephala (Boiss.) Holub | 294 | endemic | VU |
| 3 | Ranunculus angustifolius subsp. alismoides (Bory) Malag. | 284 | endemic | NT |
| 4 | Erigeron frigidus Boiss. | 268 | endemic | No_th |
| 5 | Plantago nivalis Boiss. | 261 | endemic | No_th |
| 6 | Lepidium stylatum Lag. & Rodr. | 220 | endemic | No_th |
| 7 | Leontodon boryi DC. | 212 | Iberian Peninsula endemic | NT |
| 8 | Armeria splendens (Lag. & Rodr.) Webb | 163 | endemic | VU |
| 9 | Biscutella glacialis (Boiss. & Reut.) Jord. | 162 | Iberian Peninsula endemic | NT |
| 10 | Sagina saginoides subsp. nevadensis (Boiss. & Reut.) Greuter & Burdet | 160 | endemic | No_th |
| 11 | Sideritis glacialis Boiss. subsp. glacialis | 128 | Iberian Peninsula endemic | No_th |
| 12 | Viola crassiuscula Bory | 128 | endemic | NT |
| 13 | Potentilla nevadensis Boiss. | 121 | subendemic | No_th |
| 14 | Jasione amethystina Lag. & Rodr. | 112 | endemic | No_th |
| 15 | Eryngium glaciale Boiss. | 109 | Iberian_North African | No_th |
| 16 | Nevadensia purpurea (Lag. & Rodr.) Rivas Mart. | 97 | endemic | VU |
| 17 | Arenaria pungens subsp. pungens Clemente ex Lag. | 88 | Iberian Peninsula endemic | No_th |
| 18 | Erodium boissieri Coss. | 81 | endemic | VU |
| 19 | Draba hispanica subsp. laderoi Rivas Mart., M.E.García & Penas | 80 | endemic | No_th |
| 20 | Pinguicula nevadensis (H. Lindb.) Casper | 80 | endemic | VU |
| 21 | Reseda complicata Bory | 78 | endemic | VU |
| 22 | Lomelosia pulsatilloides (Boiss.) Greuter & Burdet | 70 | endemic | No_th |
| 23 | Coincya monensis subsp. nevadensis (Willk.) Leadlay | 66 | subendemic | NT |
| 24 | Rothmaleria granatensis (DC.) Font Quer | 65 | Iberian Peninsula endemic | VU |
| 25 | Centranthus nevadensis Boiss. | 64 | Iberian_North African | VU |
| 26 | Erysimum baeticum (Heywood) Polatschek | 63 | endemic | No_th |
| 27 | Genista versicolor Boiss. | 63 | subendemic | No_th |
| 28 | Leucanthemopsis pectinata (L.) G.López & C.E.Jarvis | 62 | endemic | No_th |
| 29 | Thlaspi nevadense Boiss. & Reut. | 61 | endemic | VU |
| 30 | Scorzoneroides carpetana subsp. nevadensis (Lange) Izuzq. | 60 | subendemic | No_th |
| 31 | Sarcocapnos speciosa Boiss. | 56 | endemic | VU |
| 32 | Androsace vitaliana subsp. nevadensis (Chiarugi) Luceño | 54 | endemic | VU |
| 33 | Carex camposii Boiss. & Reut. | 54 | subendemic | NT |
| 34 | Linaria glacialis Boiss. | 54 | endemic | VU |
| 35 | Thymus serpylloides Bory subsp. serpylloides | 54 | endemic | No_th |
| 36 | Primula elatior (L.) L. subsp. lofthousei (Hesl.-Harr.) W.W. Sm. & H.R. Fletcher | 53 | Iberian Peninsula endemic | VU |
| 37 | Sempervivum minutum (Willk.) Pau | 53 | subendemic | No_th |
| 38 | Arenaria tetraquetra subsp. amabilis (Bory) H.Lindb. | 45 | endemic | No_th |
| 39 | Linaria aeruginea subsp. nevadensis (Boiss.) Malag. | 44 | endemic | No_th |
| 40 | Helianthemum pannosum Boiss. | 41 | endemic | VU |
| 41 | Pimpinella procumbens (Boiss.) H.Wolff. | 40 | endemic | VU |
| 42 | Centaurea pulvinata (Blanca) Blanca | 39 | subendemic | VU |
| 43 | Arenaria nevadensis Boiss. & Reut. | 37 | endemic | CR |
| 44 | Carduus carlinoides subsp. hispanicus (Kazmi) Franco | 35 | endemic | NT |
| 45 | Gentiana pneumonanthe subsp. depressa (Boiss.) Malag. | 35 | endemic | VU |
| 46 | Gentiana sierrae Briq. | 34 | subendemic | VU |
| 47 | Nepeta × boissieri Willk. (= N. nepetella subsp. laciniata × N. granatensis) | 32 | endemic | No_th |
| 48 | Erodium astragaloides Boiss. & Reut. | 30 | endemic | CR |
| 49 | Erodium rupicola Boiss. | 28 | subendemic | VU |
| 50 | Erysimum nevadense Reut. | 25 | endemic | No_th |
| 51 | Senecio nevadensis Boiss. & Reut. | 23 | endemic | VU |
| 52 | Armeria filicaulis subsp. nevadensis Nieto Fel., Rosselló & Fuertes | 22 | endemic | VU |
| 53 | Herniaria boissieri J.Gay | 22 | subendemic | NT |
| 54 | Verbascum nevadense Boiss. | 21 | subendemic | NT |
| 55 | Alyssum nevadense P.W.Ball & T.R Dudley | 19 | endemic | VU |
| 56 | Arabis margaritae Talavera | 19 | endemic | CR |
| 57 | Artemisia granatensis Boiss. | 18 | endemic | No_th |
| 58 | Iberis carnosa subsp. embergeri (Serve) Moreno | 17 | endemic | EN |
| 59 | Thymus granatensis subsp. granatensis Boiss. | 17 | Iberian Peninsula endemic | No_th |
| 60 | Campanula rotundifolia subsp. willkommii (Witasek.) Blanca | 15 | endemic | No_th |
| 61 | Cerastium alpinum subsp. nevadense (Pau) Mart.Parras & Molero Mesa | 14 | endemic | No_th |
| 62 | Chamaespartium undulatum (Ern) Talavera & L.Sáez | 14 | subendemic | VU |
| 63 | Pedicularis verticillata subsp. caespitosa (Webb) I.Soriano | 14 | endemic | VU |
| 64 | Chaenorhinum glareosum (Boiss.) Willk. | 13 | endemic | No_th |
| 65 | Laserpitium latifolium subsp. nevadense Mart.-Lirola, Molero Mesa & Blanca | 12 | endemic | No_th |
| 66 | Artemisia alba Turra subsp. nevadensis (Willk.) Blanca & Morales | 10 | Iberian Peninsula endemic | VU |
| 67 | Vaccinium uliginosum subsp. nanum (Boiss.) Rivas Mart., Asensi, Molero Mesa & F.Valle | 10 | endemic | No_th |
| 68 | Odontites viscosus subsp. granatensis (Boiss.) Bolliger | 9 | endemic | CR |
| 69 | Taraxacum nevadense H.Lindb. | 9 | subendemic | No_th |
| 70 | Alchemilla fontqueri Rothm. | 8 | endemic | CR |
| 71 | Cytisus galianoi Talavera & Gibbs | 8 | subendemic | NT |
| 72 | Helianthemum appeninum subsp. estevei (Peinado & Mart.Parras) G.López | 8 | endemic | VU |
| 73 | Moehringia fontqueri Pau | 8 | endemic | EN |
| 74 | Nepeta nepetella subsp. laciniata (Willk.) Aedo | 8 | endemic | No_th |
| 75 | Ranunculus cherubicus subsp. girelae. Fern.-Prieto et al. | 8 | endemic | DD |
| 76 | Thymus × pseudogranatensis Vizoso, F.B.Navarro & Lorite (= Th. granatensis subsp. granatensis × Th. zygis subsp. Gracilis | 7 | endemic | No_th |
| 77 | Laserpitium longiradium Boiss. | 6 | endemic | No_th |
| 78 | Hippocrepis nevadensis (Hrabetová) Talavera & E.Domínguez | 5 | endemic | VU |
| 79 | Cerastium alpinum subsp. aquaticum (Boiss.) Mart.Parras & Molero Mesa | 4 | endemic | No_th |
| 80 | Narcissus nevadensis Pugsley subsp. nevadensis | 4 | subendemic | CR |
| 81 | Pedicularis comosa subsp. nevadensis (Pau) A.M.Romo | 4 | endemic | VU |
| 82 | Centaurea bombycina subsp. xeranthemoides (Lange) Blanca, Cueto & M.C.Quesada | 3 | endemic | VU |
| 83 | Cirsium x nevadense Willk. | 3 | Iberian Peninsula endemic (hybrid) | No_th |
| 84 | Hippocrepis prostrata Boiss. | 3 | endemic | CR |
| 85 | Linaria saturejoides subsp. angustealata (Willmott) Malag. | 3 | subendemic | No_th |
| 86 | Salix hastata subsp. sierrae-nevadae Rech.f. | 3 | endemic | CR |
| 87 | Tephroseris elodes (Boiss.) Holub subsp. elodes | 3 | endemic | EN |
| 88 | Armeria filicaulis subsp. trevenqueana Nieto Fel. | 2 | endemic | EN |
| 89 | Artemisia × fragosoana Font Quer (= A. granatensis × A. umbelliformis) | 2 | endemic | No_th |
Appendix B
| Year | Frequency |
| 1837 | 5 |
| 1851 | 125 |
| 1852 | 27 |
| 1853 | 2 |
| 1858 | 1 |
| 1871 | 1 |
| 1879 | 1 |
| 1891 | 11 |
| 1895 | 2 |
| 1898 | 5 |
| 1901 | 1 |
| 1902 | 1 |
| 1906 | 1 |
| 1907 | 9 |
| 1908 | 26 |
| 1921 | 21 |
| 1923 | 366 |
| 1925 | 1 |
| 1928 | 1 |
| 1929 | 8 |
| 1930 | 174 |
| 1931 | 1 |
| 1933 | 1 |
| 1934 | 11 |
| 1935 | 99 |
| 1941 | 4 |
| 1942 | 1 |
| 1943 | 1 |
| 1944 | 39 |
| 1946 | 21 |
| 1947 | 59 |
| 1950 | 3 |
| 1951 | 41 |
| 1953 | 79 |
| 1954 | 26 |
| 1955 | 10 |
| 1957 | 3 |
| 1958 | 14 |
| 1959 | 7 |
| 1960 | 8 |
| 1963 | 3 |
| 1964 | 34 |
| 1965 | 4 |
| 1966 | 13 |
| 1967 | 122 |
| 1968 | 100 |
| 1969 | 64 |
| 1970 | 137 |
| 1971 | 127 |
| 1972 | 93 |
| 1973 | 133 |
| 1974 | 85 |
| 1975 | 75 |
| 1976 | 259 |
| 1977 | 59 |
| 1978 | 304 |
| 1979 | 104 |
| 1980 | 296 |
| 1981 | 198 |
| 1982 | 141 |
| 1983 | 223 |
| 1984 | 231 |
| 1985 | 83 |
| 1986 | 72 |
| 1987 | 125 |
| 1988 | 205 |
| 1989 | 62 |
| 1990 | 125 |
| 1991 | 17 |
| 1992 | 20 |
| 1993 | 28 |
| 1994 | 16 |
| 1995 | 29 |
| 1996 | 118 |
| 1997 | 44 |
| 1998 | 51 |
| 1999 | 20 |
| 2000 | 13 |
| 2001 | 3 |
| 2002 | 12 |
| 2003 | 21 |
| 2004 | 4 |
| 2006 | 1 |
| 2007 | 7 |
| 2008 | 3 |
| 2009 | 6 |
| 2010 | 54 |
| 2011 | 24 |
| 2012 | 9 |
| 2013 | 13 |
| 2014 | 30 |
| 2015 | 2 |
| 2016 | 1 |
| 2017 | 18 |
| 2019 | 4 |
Appendix C
| Altitudinal Zone | Phenological Phase | Period (Years) | (n) | Mean_Day | n_Days | Trends |
| No Alpine (<2400 m) | Flowering early | ≤1969 | 30 | 194 | −22 ± 2.39 | Advanced |
| ≥1970 | 170 | 172 | ||||
| Flowering peak | ≤1969 | 48 | 185 | −18 ± 1.98 | Advanced | |
| ≥1970 | 283 | 167 | ||||
| Flowering late | ≤1969 | 70 | 182 | −1 ± 1.81 | Advanced | |
| ≥1970 | 223 | 181 | ||||
| Fruiting early | ≤1969 | 65 | 187 | −1 ± 1.82 | Advanced | |
| ≥1970 | 236 | 186 | ||||
| Fruiting peak | ≤1969 | 50 | 191 | 4 ± 1.91 | Delayed | |
| ≥1970 | 213 | 195 | ||||
| Fruiting late | ≤1969 | 14 | 195 | −1 ± 2.36 | Advanced | |
| ≥1970 | 140 | 194 | ||||
| Alpine (>2400 m) | Flowering early | ≤1969 | 99 | 202 | −3 ± 1.51 | Advanced |
| ≥1970 | 237 | 199 | ||||
| Flowering peak | ≤1969 | 236 | 202 | −5 ± 0.85 | Advanced | |
| ≥1970 | 469 | 197 | ||||
| Flowering late | ≤1969 | 412 | 204 | −1 ± 0.78 | Advanced | |
| ≥1970 | 562 | 203 | ||||
| Fruiting early | ≤1969 | 250 | 206 | −3 ± 0.84 | Advanced | |
| ≥1970 | 513 | 203 | ||||
| Fruiting peak | ≤1969 | 178 | 206 | 2 ± 0.99 | Delayed | |
| ≥1970 | 387 | 208 | ||||
| Fruiting late | ≤1969 | 59 | 212 | 7 ± 1.75 | Delayed | |
| ≥1970 | 212 | 219 |
References
- Lieth, H. (Ed.) Purposes of a Phenology Book; Springer: Berlin/Heidelberg, Germany, 1974; pp. 3–19. ISBN 978-3-642-51863-8. [Google Scholar]
- Morellato, L.P.C.; Alberton, B.; Alvarado, S.T.; Borges, B.; Buisson, E.; Camargo, M.G.G.; Cancian, L.F.; Carstensen, D.W.; Escobar, D.F.E.; Leite, P.T.P.; et al. Linking Plant Phenology to Conservation Biology. Biol. Conserv. 2016, 195, 60–72. [Google Scholar] [CrossRef]
- Scheffers, B.R.; De Meester, L.; Bridge, T.C.L.; Hoffmann, A.A.; Pandolfi, J.M.; Corlett, R.T.; Butchart, S.H.M.; Pearce-Kelly, P.; Kovacs, K.M.; Dudgeon, D.; et al. The Broad Footprint of Climate Change from Genes to Biomes to People. Science (1979) 2016, 354, aaf7671. [Google Scholar] [CrossRef]
- Chuine, I.; Régnière, J. Process-Based Models of Phenology for Plants and Animals. Annu. Rev. Ecol. Evol. Syst. 2017, 48, 159–182. [Google Scholar] [CrossRef]
- Parmesan, C.; Yohe, G. A Globally Coherent Fingerprint of Climate Change Impacts across Natural Systems. Nature 2003, 421, 37–42. [Google Scholar] [CrossRef] [PubMed]
- Bucher, S.F.; König, P.; Menzel, A.; Migliavacca, M.; Ewald, J.; Römermann, C. Traits and Climate Are Associated with First Flowering Day in Herbaceous Species along Elevational Gradients. Ecol. Evol. 2018, 8, 1147–1158. [Google Scholar] [CrossRef] [PubMed]
- Rosbakh, S.; Hartig, F.; Sandanov, D.V.; Bukharova, E.V.; Miller, T.K.; Primack, R.B. Siberian Plants Shift Their Phenology in Response to Climate Change. Glob. Change Biol. 2021, 27, 4435–4448. [Google Scholar] [CrossRef] [PubMed]
- Menzel, A.; Yuan, Y.; Matiu, M.; Sparks, T.; Scheifinger, H.; Gehrig, R.; Estrella, N. Climate Change Fingerprints in Recent European Plant Phenology. Glob. Change Biol. 2020, 26, 2599–2612. [Google Scholar] [CrossRef] [PubMed]
- Hua, X.; Wiens, J.J. How Does Climate Influence Speciation? Am. Nat. 2013, 182, 1–12. [Google Scholar] [CrossRef] [PubMed]
- Menzel, A.; Sparks, T.H.; Estrella, N.; Koch, E.; Aasa, A.; Ahas, R.; Alm-Kübler, K.; Bissolli, P.; Braslavská, O.; Briede, A. European Phenological Response to Climate Change Matches the Warming Pattern. Glob. Change Biol. 2006, 12, 1969–1976. [Google Scholar] [CrossRef]
- Parmesan, C. Influences of Species, Latitudes and Methodologies on Estimates of Phenological Response to Global Warming. Glob. Change Biol. 2007, 13, 1860–1872. [Google Scholar] [CrossRef]
- Hegland, S.J.; Nielsen, A.; Lázaro, A.; Bjerknes, A.; Totland, Ø. How Does Climate Warming Affect Plant-pollinator Interactions? Ecol. Lett. 2009, 12, 184–195. [Google Scholar] [CrossRef]
- CaraDonna, P.J.; Iler, A.M.; Inouye, D.W. Shifts in Flowering Phenology Reshape a Subalpine Plant Community. Proc. Natl. Acad. Sci. USA 2014, 111, 4916–4921. [Google Scholar] [CrossRef]
- Cruz-Neto, O.; Machado, I.C.; Duarte, J.A.; Lopes, A.V. Synchronous Phenology of Hawkmoths (Sphingidae) and Inga Species (Fabaceae–Mimosoideae): Implications for the Restoration of the Atlantic Forest of Northeastern Brazil. Biodivers. Conserv. 2011, 20, 751–765. [Google Scholar] [CrossRef]
- Garibaldi, L.A.; Steffan-Dewenter, I.; Winfree, R.; Aizen, M.A.; Bommarco, R.; Cunningham, S.A.; Kremen, C.; Carvalheiro, L.G.; Harder, L.D.; Afik, O.; et al. Wild Pollinators Enhance Fruit Set of Crops Regardless of Honey Bee Abundance. Science (1979) 2013, 339, 1608–1611. [Google Scholar] [CrossRef] [PubMed]
- Peñuelas, J.; Filella, I. Responses to a Warming World. Science (1979) 2001, 294, 793–795. [Google Scholar] [CrossRef] [PubMed]
- Giorgi, F.; Lionello, P. Climate Change Projections for the Mediterranean Region. Glob. Planet. Change 2008, 63, 90–104. [Google Scholar] [CrossRef]
- Lionello, P.; Scarascia, L. The Relation between Climate Change in the Mediterranean Region and Global Warming. Reg. Environ. Change 2018, 18, 1481–1493. [Google Scholar] [CrossRef]
- Peñuelas, J.; Sabaté, S.; Filella, I.; Gracia, C. Efectos Del Cambio Climático Sobre Los Ecosistemas Terrestres: Observación, Experimentación y Simulación. In Ecología del Bosque Mediterráneo en un Mundo Cambiante; EGRAF: Madrid, Spain, 2004; pp. 425–460. [Google Scholar]
- Peñuelas, J.; Filella, I.; Comas, P. Changed Plant and Animal Life Cycles from 1952 to 2000 in the Mediterranean Region. Glob. Change Biol. 2002, 8, 531–544. [Google Scholar] [CrossRef]
- Jiménez-Alfaro, B.; Gavilán, R.G.; Escudero, A.; Iriondo, J.M.; Fernández-González, F. Decline of Dry Grassland Specialists in M Editerranean High-mountain Communities Influenced by Recent Climate Warming. J. Veg. Sci. 2014, 25, 1394–1404. [Google Scholar] [CrossRef]
- Cañadas, E.M.; Fenu, G.; Peñas, J.; Lorite, J.; Mattana, E.; Bacchetta, G. Hotspots within Hotspots: Endemic Plant Richness, Environmental Drivers, and Implications for Conservation. Biol. Conserv. 2014, 170, 282–291. [Google Scholar] [CrossRef]
- Pauli, H.; Gottfried, M.; Dullinger, S.; Abdaladze, O.; Akhalkatsi, M.; Alonso, J.L.B.; Coldea, G.; Dick, J.; Erschbamer, B.; Calzado, R.F. Recent Plant Diversity Changes on Europe’s Mountain Summits. Science (1979) 2012, 336, 353–355. [Google Scholar] [CrossRef]
- La Sorte, F.A.; Jetz, W. Projected Range Contractions of Montane Biodiversity under Global Warming. Proc. R. Soc. B: Biol. Sci. 2010, 277, 3401–3410. [Google Scholar] [CrossRef]
- Le Roux, P.C.; McGeoch, M.A. Rapid Range Expansion and Community Reorganization in Response to Warming. Glob. Change Biol. 2008, 14, 2950–2962. [Google Scholar] [CrossRef]
- Giménez-Benavides, L.; García-Camacho, R.; Iriondo, J.M.; Escudero, A. Selection on Flowering Time in Mediterranean High-Mountain Plants under Global Warming. Evol. Ecol. 2011, 25, 777–794. [Google Scholar] [CrossRef]
- Lara-Romero, C.; Robledo-Arnuncio, J.J.; Garcia-Fernandez, A.; Iriondo, J.M. Assessing Intraspecific Variation in Effective Dispersal along an Altitudinal Gradient: A Test in Two Mediterranean High-Mountain Plants. PLoS ONE 2014, 9, e87189. [Google Scholar] [CrossRef] [PubMed]
- Denney, D.A.; Anderson, J.T. Natural History Collections Document Biological Responses to Climate Change: A Commentary on DeLeo et al. (2019), Effects of Two Centuries of Global Environmental Variation on Phenology and Physiology of Arabidopsis Thaliana. Glob. Change Biol. 2020, 26, 340–342. [Google Scholar] [CrossRef]
- Ramirez-Parada, T.H.; Park, I.W.; Mazer, S.J. Herbarium Specimens Provide Reliable Estimates of Phenological Responses to Climate at Unparalleled Taxonomic and Spatiotemporal Scales. Ecography 2022, 2022, e06173. [Google Scholar] [CrossRef]
- Davis, C.C.; Willis, C.G.; Connolly, B.; Kelly, C.; Ellison, A.M. Herbarium Records Are Reliable Sources of Phenological Change Driven by Climate and Provide Novel Insights into Species’ Phenological Cueing Mechanisms. Am. J. Bot. 2015, 102, 1599–1609. [Google Scholar] [CrossRef] [PubMed]
- Hufft, R.A.; DePrenger-Levin, M.E.; Levy, R.A.; Islam, M.B. Using Herbarium Specimens to Select Indicator Species for Climate Change Monitoring. Biodivers. Conserv. 2018, 27, 1487–1501. [Google Scholar] [CrossRef]
- Matthews, E.R.; Mazer, S.J. Historical Changes in Flowering Phenology Are Governed by Temperature × Precipitation Interactions in a Widespread Perennial Herb in Western North America. New Phytol. 2016, 210, 157–167. [Google Scholar] [CrossRef] [PubMed]
- Gaira, K.S.; Dhar, U.; Belwal, O.K. Potential of Herbarium Records to Sequence Phenological Pattern: A Case Study of Aconitum Heterophyllum in the Himalaya. Biodivers. Conserv. 2011, 20, 2201–2210. [Google Scholar] [CrossRef]
- Primack, D.; Imbres, C.; Primack, R.B.; Miller-Rushing, A.J.; Del Tredici, P. Herbarium Specimens Demonstrate Earlier Flowering Times in Response to Warming in Boston. Am. J. Bot. 2004, 91, 1260–1264. [Google Scholar] [CrossRef]
- Willems, F.M.; Scheepens, J.F.; Bossdorf, O. Forest Wildflowers Bloom Earlier as Europe Warms: Lessons from Herbaria and Spatial Modelling. New Phytol. 2022, 235, 52–65. [Google Scholar] [CrossRef] [PubMed]
- Médail, F.; Diadema, K. Glacial Refugia Influence Plant Diversity Patterns in the Mediterranean Basin. J. Biogeogr. 2009, 36, 1333–1345. [Google Scholar] [CrossRef]
- Benito, B.; Lorite, J.; Peñas, J. Simulating Potential Effects of Climatic Warming on Altitudinal Patterns of Key Species in Mediterranean-Alpine Ecosystems. Clim. Change 2011, 108, 471–483. [Google Scholar] [CrossRef]
- Lamprecht, A.; Pauli, H.; Fernández Calzado, M.R.; Lorite, J.; Molero Mesa, J.; Steinbauer, K.; Winkler, M. Changes in Plant Diversity in a Water-Limited and Isolated High-Mountain Range (Sierra Nevada, Spain). Alp. Bot. 2021, 131, 27–39. [Google Scholar] [CrossRef]
- Lorite, J. An Updated Checklist of the Vascular Flora of Sierra Nevada (SE Spain). Phytotaxa 2016, 261, 1–57. [Google Scholar] [CrossRef]
- Titos Martínez, M. Sierra Nevada: Una Gran Historia; Universidad de Granada: Granada, Spain, 1997; Volume 1. [Google Scholar]
- Martín Garcia, J.M.; Delgado, R.; Delgado, G.; Márquez, R.; Calero, J.; Aranda, V.; Sánchez Marañón, M.; Abad, I. Elementos Traza En El Cuarzo de La Arena Fina de Orthents de Sierra Nevada (España). 2008. Available online: https://sge.usal.es/archivos/geogacetas/Geo44/Art57.pdf (accessed on 1 October 2023).
- Lorite, J.; Lamprecht, A.; Peñas, J.; Rondinel-Mendoza, K.; Fernandez-Calzado, R.; Benito, B.; Cañadas, E. Altitudinal Patterns and Changes in the Composition of High Mountain Plant Communities. In The Landscape of the Sierra Nevada: A Unique Laboratory of Global Processes in Spain; Springer: Cham, Switzerland, 2022; pp. 171–191. [Google Scholar]
- Blanca, G.; Cueto, M.; Martínez-Lirola, M.J.; Molero-Mesa, J. Threatened Vascular Flora of Sierra Nevada (Southern Spain). Biol. Conserv. 1998, 85, 269–285. [Google Scholar] [CrossRef]
- Peñas, J.; Lorite Moreno, J. Biología de La Conservación de Plantas En Sierra Nevada: Principios y Retos Para Su Preservación. In Biología de la Conservación de Plantas en Sierra Nevada; Universidad de Granada: Granada, Spain, 2019; 456p. [Google Scholar]
- Lorite, J.; Ros-Candeira, A.; Alcaraz-Segura, D.; Salazar-Mendias, C. FloraSNevada: A Trait Database of the Vascular Flora of Sierra Nevada, Southeast Spain. Ecology 2020, 101, e03091. [Google Scholar] [CrossRef] [PubMed]
- Thiers, B. Index Herbariorum: A Global Directory of Public Herbaria and Associated Staff. New York Botanical Garden’s Virtual Herbarium 2024. Available online: https://sweetgum.nybg.org/science/ih/ (accessed on 1 December 2023).
- Nagelkerke, N.J.D. A Note on a General Definition of the Coefficient of Determination. Biometrika 1991, 78, 691–692. [Google Scholar] [CrossRef]
- Gordo, O.; Sanz, J.J. Phenology and Climate Change: A Long-Term Study in a Mediterranean Locality. Oecologia 2005, 146, 484–495. [Google Scholar] [CrossRef] [PubMed]
- Wheeler, B.; Torchiano, M.; Torchiano, M.M. Package ‘Lmperm’. R. Package Version 2016, 2, 1–24. [Google Scholar]
- Menzel, A.; von Vopelius, J.; Estrella, N.; Schleip, C.; Dose, V. Farmers’ Annual Activities Are Not Tracking the Speed of Climate Change. Clim. Res. 2006, 32, 201–207. [Google Scholar]
- Gordo, O.; Sanz, J.J. Long-Term Temporal Changes of Plant Phenology in the Western Mediterranean. Glob. Change Biol. 2009, 15, 1930–1948. [Google Scholar] [CrossRef]
- Templ, B.; Templ, M.; Filzmoser, P.; Lehoczky, A.; Bakšienè, E.; Fleck, S.; Gregow, H.; Hodzic, S.; Kalvane, G.; Kubin, E.; et al. Phenological Patterns of Flowering across Biogeographical Regions of Europe. Int. J. Biometeorol. 2017, 61, 1347–1358. [Google Scholar] [CrossRef]
- Vogel, J. Drivers of Phenological Changes in Southern Europe. Int. J. Biometeorol. 2022, 66, 1903–1914. [Google Scholar] [CrossRef] [PubMed]
- Forrest, J.; Miller-Rushing, A.J. Toward a Synthetic Understanding of the Role of Phenology in Ecology and Evolution. Philos. Trans. R. Soc. B Biol. Sci. 2010, 365, 3101–3112. [Google Scholar] [CrossRef] [PubMed]
- Parmesan, C.; Hanley, M.E. Plants and Climate Change: Complexities and Surprises. Ann. Bot. 2015, 116, 849–864. [Google Scholar] [CrossRef]
- Liu, Q.; Piao, S.; Fu, Y.H.; Gao, M.; Peñuelas, J.; Janssens, I.A. Climatic Warming Increases Spatial Synchrony in Spring Vegetation Phenology Across the Northern Hemisphere. Geophys. Res. Lett. 2019, 46, 1641–1650. [Google Scholar] [CrossRef]
- Hopkins, A.D. The Bioclimatic Law. J. Wash. Acad. Sci. 1920, 10, 34–40. [Google Scholar]
- Vitasse, Y.; Rebetez, M.; Filippa, G.; Cremonese, E.; Klein, G.; Rixen, C. ‘Hearing’ Alpine Plants Growing after Snowmelt: Ultrasonic Snow Sensors Provide Long-Term Series of Alpine Plant Phenology. Int. J. Biometeorol. 2017, 61, 349–361. [Google Scholar] [CrossRef] [PubMed]
- Piao, S.; Liu, Q.; Chen, A.; Janssens, I.A.; Fu, Y.; Dai, J.; Liu, L.; Lian, X.; Shen, M.; Zhu, X. Plant Phenology and Global Climate Change: Current Progresses and Challenges. Glob. Change Biol. 2019, 25, 1922–1940. [Google Scholar] [CrossRef] [PubMed]
- Stuble, K.L.; Bennion, L.D.; Kuebbing, S.E. Plant Phenological Responses to Experimental Warming—A Synthesis. Glob. Change Biol. 2021, 27, 4110–4124. [Google Scholar] [CrossRef] [PubMed]


| Phenological Phase | Intercept | Estimated Coefficient (Year) | ±SE | p-Value | R-sq. adj | |
|---|---|---|---|---|---|---|
| Flowering | Onset | 822.14222 | −0.31971 | ±0.05225 | 1.81 × 10⁻⁹ *** | 0.06461 |
| Peak | 581.28464 | −0.1987 | ±0.03029 | 8.42 × 10⁻¹¹ *** | 0.03901 | |
| Late | 450.2716 | −0.12795 | ±0.02491 | 3.24 × 10⁻⁷ *** | 0.02007 | |
| Fruiting | Onset | 452.16529 | −0.12836 | ±0.02695 | 2.17 × 10⁻⁶ *** | 0.02059 |
| Peak | 285.75619 | −0.04201 | ±0.02704 | 0.13 | 0.002705 | |
| Late | 394.65227 | −0.09379 | ±0.05584 | 0.093780 | 0.006428 | |
| Phenological Phase | Period | n | Mean Day | Change | p-Value | R2 adj |
|---|---|---|---|---|---|---|
| Flowering onset | ≤1969 | 132 | 199 | −11 ± 1.39 | 1.81 × 10⁻⁹ *** | 0.06461 |
| ≥1970 | 412 | 188 | ||||
| Flowering peak | ≤1969 | 295 | 199 | −13 ± 0.93 | 8.42 × 10⁻¹¹ *** | 0.03901 |
| ≥1970 | 767 | 186 | ||||
| Flowering late | ≤1969 | 491 | 202 | −5 ± 0.76 | 3.24 × 10⁻⁷ *** | 0.02007 |
| ≥1970 | 799 | 197 | ||||
| Fruiting onset | ≤1969 | 323 | 202 | −4 ± 0.81 | 2.17 × 10⁻⁶ *** | 0.02059 |
| ≥1970 | 758 | 198 | ||||
| Fruiting peak | ≤1969 | 236 | 204 | −1 ± 0.94 | 0.13 | 0.002705 |
| ≥1970 | 611 | 203 | ||||
| Fruiting late | ≤1969 | 80 | 210 | −1 ± 1.48 | 0.093780 | 0.006428 |
| ≥1970 | 358 | 209 |
| Altitudinal Zone | Phenological Phases | Intercept | Estimated Coefficient (Year) | ±Std. Error | p-Value | R-sq. adj | Days | |
|---|---|---|---|---|---|---|---|---|
| Alpine Zone (>2400 m) | Flowering | Onset | 527.92939 | −0.16624 | ±0.05684 | 0.00368 ** | 0.02497 | −3 ± 1.51 |
| Peak | 307.82898 | −0.05525 | ±0.02558 | 0.0312 * | 0.00659 | −5 ± 0.85 | ||
| Late | 312.36614 | −0.05523 | ±0.02593 | 0.0334 * | 0.00464 | −1 ± 0.78 | ||
| Fruiting | Onset | 387.65284 | −0.09317 | ±0.03025 | 0.00214 ** | 0.01228 | −3 ± 0.84 | |
| Peak | 204.57463 | 0.00135 | ±0.02961 | 0.854327 | 5.993 × 10⁻⁵ | +2 ± 0.99 | ||
| Late | 170.56605 | 0.02419 | ±0.06676 | 0.362 | 0.0004877 | +7 ± 1.75 | ||
| Non-Alpine Zone (<2400 m) | Flowering | Onset | 985.66581 | −0.40963 | ±0.09499 | 2.55 × 10⁻⁵ *** | 0.08586 | −22 ± 2.39 |
| Peak | 940.34585 | −0.38911 | ±0.08866 | 1.54 × 10⁻⁵ *** | 0.0553 | −18 ± 1.98 | ||
| Late | 495.47307 | −0.15866 | ±0.05931 | 0.0079 ** | 0.02416 | −1 ± 1.81 | ||
| Fruiting | Onset | 459.91797 | −0.13807 | ±0.05064 | 0.00678 ** | 0.02442 | −1 ± 1.82 | |
| Peak | 288.22068 | −0.04785 | ±0.05380 | 0.37459 | 0.003022 | +4 ± 1.91 | ||
| Late | 354.59352 | −0.08099 | ±0.09089 | 0.3743 | 0.005197 | −1 ± 2.36 | ||
| Taxa | Period | n | Mean_Day | Days (adv-del) | p-Value | |
|---|---|---|---|---|---|---|
| 1 | Armeria splendens (Lag. and Rodr.) Webb | ≤1969 | 7 | 215 | −13 ± 3.82 | 0.08729 |
| ≥1970 | 21 | 202 | ||||
| 2 | Biscutella glacialis (Boiss. and Reut.) Jord. | ≤1969 | 5 | 202 | −13 ± 2.23 | 0.05053 |
| ≥1970 | 29 | 189 | ||||
| 3 | Centranthus nevadensis Boiss. | ≤1969 | 6 | 208 | −6 ± 3.69 | 0.6863 |
| ≥1970 | 6 | 202 | ||||
| 4 | Erigeron frigidus Boiss. | ≤1969 | 24 | 197 | 4 ± 2.08 | 0.2319 |
| ≥1970 | 29 | 201 | ||||
| 5 | Jasione amethystine Lag. and Rodr. | ≤1969 | 6 | 204 | −11 ± 5.2 | 0.1343 |
| ≥1970 | 7 | 193 | ||||
| 6 | Lepidium stylatum Lag. and Rodr. | ≤1969 | 37 | 209 | −12 ± 5.0 | 0.0076 ** |
| ≥1970 | 20 | 197 | ||||
| 7 | Leontodon boryi DC. | ≤1969 | 10 | 207 | −9 ± 3.51 | 0.1221 |
| ≥1970 | 13 | 198 | ||||
| 8 | Lomelosia pulsatilloides (Boiss.) Greuter & Burdet | ≤1969 | 9 | 216 | −19 ± 3.55 | <2.2 × 10⁻¹⁶ *** |
| ≥1970 | 10 | 197 | ||||
| 9 | Nevadensia purpurea (Lag. and Rodr.) Rivas Mart. | ≤1969 | 5 | 190 | 1 ± 2.61 | 0.2859 |
| ≥1970 | 17 | 191 | ||||
| 10 | Pinguicula nevadensis (H. Lindb.) Casper | ≤1969 | 5 | 214 | −25 ± 1.33 | < 2.2 × 10⁻¹⁶ *** |
| ≥1970 | 37 | 189 | ||||
| 11 | Potentilla nevadensis Boiss. | ≤1969 | 8 | 199 | 8 ± 4.3 | 0.1287 |
| ≥1970 | 8 | 207 | ||||
| 12 | Ranunculus acetosellifolius Boiss. | ≤1969 | 25 | 184 | −20 ± 4.59 | 0.02086 * |
| ≥1970 | 41 | 164 | ||||
| 13 | Ranunculus angustifolius subsp. alismoides (Bory) Malag. | ≤1969 | 10 | 218 | −27 ± 1.84 | <2.2 × 10⁻¹⁶ *** |
| ≥1970 | 30 | 191 | ||||
| 14 | Reseda complicata (Bory) | ≤1969 | 7 | 196 | −2 ± 9.18 | 0.9804 |
| ≥1970 | 21 | 194 | ||||
| 15 | Scorzoneroides microcephala (Boiss.) Holub | ≤1969 | 23 | 194 | 20 ± 3.93 | 6 × 10⁻⁴ *** |
| ≥1970 | 40 | 214 | ||||
| 16 | Sideritis glacialis Boiss. subsp. glacialis | ≤1969 | 18 | 201 | 6 ± 4.2 | 0.5811 |
| ≥1970 | 27 | 207 | ||||
| 17 | Viola crassiuscula Bory | ≤1969 | 14 | 199 | −4 ± 2.91 | 0.7843 |
| ≥1970 | 35 | 195 |
| Taxa | Period | n | Mean_Day | Days (adv-del) | p-Value | |
|---|---|---|---|---|---|---|
| 1 | Arenaria pungens subsp. Pungens Clemente ex Lag. | ≤1969 | 16 | 207 | 11 ± 6.4 | 0.3043 |
| ≥1970 | 19 | 218 | ||||
| 2 | Biscutella glacialis (Boiss. and Reut.) Jord. | ≤1969 | 8 | 220 | −30 ± 3.33 | <2.2 × 10⁻¹⁶ *** |
| ≥1970 | 33 | 190 | ||||
| 3 | Erigeron frigidus Boiss. | ≤1969 | 15 | 204 | 6 ± 3.13 | 0.4082 |
| ≥1970 | 19 | 210 | ||||
| 4 | Erodium boissieri Coss. | ≤1969 | 5 | 204 | −21 ± 9.76 | 0.1797 |
| ≥1970 | 19 | 183 | ||||
| 5 | Eryngium glaciale Boiss. | ≤1969 | 7 | 218 | −10 ± 16.73 | 0.3706 |
| ≥1970 | 7 | 208 | ||||
| 6 | Leontodon boryi DC. | ≤1969 | 22 | 199 | 4 ± 3.80 | 0.5402 |
| ≥1970 | 24 | 203 | ||||
| 7 | Lepidium stylatum Lag. and Rodr. | ≤1969 | 9 | 212 | −13 ± 5.93 | 0.1747 |
| ≥1970 | 18 | 199 | ||||
| 8 | Plantago nivalis Boiss. | ≤1969 | 30 | 204 | −1 ± 2.93 | 0.623 |
| ≥1970 | 53 | 203 | ||||
| 9 | Ranunculus angustifolius subsp. alismoides (Bory) Malag. | ≤1969 | 7 | 199 | 12 ± 1.30 | <2.2 × 10⁻¹⁶ *** |
| ≥1970 | 21 | 187 | ||||
| 10 | Reseda complicata (Bory) | ≤1969 | 5 | 219 | 17 ± 9.5 | 0.1628 |
| ≥1970 | 7 | 236 | ||||
| 11 | Ranunculus acetosellifolius Boiss. | ≤1969 | 16 | 170 | −14 ± 2.64 | 0.0056 ** |
| ≥1970 | 43 | 184 | ||||
| 12 | Scorzoneroides microcephala (Boiss.) Holub | ≤1969 | 17 | 213 | 21 ± 5.91 | 0.0184 * |
| ≥1970 | 21 | 234 |
Disclaimer/Publisher’s Note: The statements, opinions and data contained in all publications are solely those of the individual author(s) and contributor(s) and not of MDPI and/or the editor(s). MDPI and/or the editor(s) disclaim responsibility for any injury to people or property resulting from any ideas, methods, instructions or products referred to in the content. |
© 2024 by the authors. Licensee MDPI, Basel, Switzerland. This article is an open access article distributed under the terms and conditions of the Creative Commons Attribution (CC BY) license (https://creativecommons.org/licenses/by/4.0/).
Share and Cite
Rondinel-Mendoza, K.V.; Lorite, J.; Marín-Rodulfo, M.; Cañadas, E.M. Tracking Phenological Changes over 183 Years in Endemic Species of a Mediterranean Mountain (Sierra Nevada, SE Spain) Using Herbarium Specimens. Plants 2024, 13, 522. https://doi.org/10.3390/plants13040522
Rondinel-Mendoza KV, Lorite J, Marín-Rodulfo M, Cañadas EM. Tracking Phenological Changes over 183 Years in Endemic Species of a Mediterranean Mountain (Sierra Nevada, SE Spain) Using Herbarium Specimens. Plants. 2024; 13(4):522. https://doi.org/10.3390/plants13040522
Chicago/Turabian StyleRondinel-Mendoza, Katy V., Juan Lorite, Macarena Marín-Rodulfo, and Eva M. Cañadas. 2024. "Tracking Phenological Changes over 183 Years in Endemic Species of a Mediterranean Mountain (Sierra Nevada, SE Spain) Using Herbarium Specimens" Plants 13, no. 4: 522. https://doi.org/10.3390/plants13040522