Article

Overexpression of the Phosphoserine Phosphatase-Encoding Gene (AtPSP1) Promotes Starch Accumulation in Lemna turionifera 5511 under Sulfur Deficiency

1
College of Life Science, Nankai University, Tianjin 300071, China
2
Tianjin Academy of Agricultural Sciences, Tianjin 300192, China
*
Authors to whom correspondence should be addressed.
Plants 2023, 12(5), 1012; https://doi.org/10.3390/plants12051012
Submission received: 30 November 2022 / Revised: 18 February 2023 / Accepted: 20 February 2023 / Published: 23 February 2023
(This article belongs to the Special Issue Duckweed: Research Meets Applications)

Abstract

:
Duckweeds are well known for their high accumulation of starch under stress conditions, along with inhibited growth. The phosphorylation pathway of serine biosynthesis (PPSB) was reported as playing a vital role in linking the carbon, nitrogen, and sulfur metabolism in this plant. The overexpression of AtPSP1, the last key enzyme of the PPSB pathway in duckweed, was found to stimulate the accumulation of starch under sulfur-deficient conditions. The growth- and photosynthesis-related parameters were higher in the AtPSP1 transgenic plants than in the WT. The transcriptional analysis showed that the expression of several genes in starch synthesis, TCA, and sulfur absorption, transportation, and assimilation was significantly up- or downregulated. The study suggests that PSP engineering could improve starch accumulation in Lemna turionifera 5511 by coordinating the carbon metabolism and sulfur assimilation under sulfur-deficient conditions.

1. Introduction

Duckweeds are the smallest flowering plant known to date and have severely reduced anatomies [1]. They are widely distributed all over the world, except in the Antarctic and Arctic regions [2]. There are 5 genera of duckweeds, namely Spirodela, Landoltia, Lemna, Wolffiella, and Wolffia, with a total of 36 species [3]. The biomass accumulation in duckweeds is much higher than the corn in dry weight (DW)/ha/year due to its asexual propagation and rapid growth [2]. The growth rate is attuned to the richness of the growth medium. It has been reported that duckweed can be converted into four different forms of energy, namely bio-oil, natural gas, bioethanol, and high-value-added industrial precursors, through different conversion technologies [4]. This makes duckweed a promising source of starch and a potential feedstock for the production of bioethanol and other biofuels [5]. The starch is mainly synthesized in the fronds of duckweeds, and 3–60% of dry weight can be accumulated when duckweeds are treated by growth regulators, heavy metals, nutrient deficiency, and salt stress [6,7,8,9,10,11,12,13,14,15,16,17,18,19]. However, these treatments always inhibit the growth of duckweed. The starch accumulation resulted from the decrease in duckweed biomass, while the sulfur deficiency was found to improve starch yields in duckweed without affecting its growth or biomass accumulation. Sulfur deprivation resulted in the highest starch yield, which was higher than the nitrogen or phosphorus limitation conditions. Previous research suggested that the cultivation of sulfur limitations is a potential strategy to prompt starch accumulation in duckweed [20].
In plants, three biosynthesis pathways of serine (Ser) have been described, which complicate the understanding of their metabolic regulation. One is the ethanoic acid pathway associated with photorespiration, and the other two alternative non-photorespiratory pathways of serine biosynthesis are the phosphorylation pathway and the glyceric acid pathway [21,22,23]. In most organisms, serine is synthesized via the phosphorylation pathway of serine biosynthesis (PPSB). Three enzymes are involved in the phosphorylation pathway of serine biosynthesis. First, 3PGA is oxidized to 3-phosphate hydroxypyruvate (3PHP) by 3-phosphoglycerate dehydrogenase (PGDH); then, 3PHP is converted to 3-phosphoserine via 3-phosphoserine aminotransferase (PSAT). Finally, 3-phosphoserine is dephosphorized to serine by 3-phosphoserine phosphatase (PSP) [24]. PSP was reported to be inhibited by high concentrations of serine; mutants lacking PSP in Arabidopsis are embryonically lethal, with altered pollen and chorion development, and PSP overexpression leads to increased nitrate reductase activity and photorespiration in leaves under light [25,26,27,28]. Metabolomic studies of PSP1 overexpression and knockdown demonstrate that subtle changes in PPSB activity can modulate the glycolytic flux, affecting the TCA cycle and amino acid biosynthesis, which, in turn, affects glucose metabolism. These reports demonstrated that PSP plays a crucial role in plant metabolism and development, affecting glycolysis, amino acid synthesis, and the TCA cycle [28]. However, there are few studies on the relationship between PSP and starch biosynthesis in duckweed.
The sulfur element is an indispensable macronutrient to maintain normal growth in the plant. Sulfate is absorbed into root cells, transported to the plastids, and activated to form 5′-adenylylsulfate (APS) by ATP sulfurylase (ATPS); then, APS is reduced by APS reductase (APR) and sulfite reductase to sulfide; finally, sulfide and O-acetyl-L-serine (OAS) synthesize cysteine (Cys). Cys is the primary product of sulfur assimilation; its synthesis is dependent on the serine used to provide the carbon and nitrogen skeleton. Firstly, Ser is used with acetyl coenzyme A for the synthesis of O-acetyl serine (OAS) via serine acetyltransferase (SERAT). Then, O-acetyl serine (thiol) lyase (OAS-TL) replaces the activated acetyl portion of OAS with sulfide and releases cysteine [29,30]. Thus, Cys synthesis requires crosstalk between carbon and nitrogen metabolism and sulfur assimilation in the plant [31], while Ser is essential for the assimilation of sulfur.
PPSB synthesizes Ser in plastids from 3-phosphoglyceric acid (3-PGA). In duckweed, more 3-PGA was found to transfer to glucose and was used for starch biosynthesis after sulfur-deficiency treatment [20]. We are interested in whether there is a link between the phosphorylation pathway of serine (PPSB) and starch accumulation in duckweed. In this work, AtPSP1, encoding the key enzyme of PPSB in Arabidopsis, was overexpressed in duckweed when studying the effect on starch accumulation and growth under sulfur deficiency. The possible mechanism of starch accumulation was investigated in duckweed overexpressing AtPSP1 under sulfur-deficient conditions.

2. Results

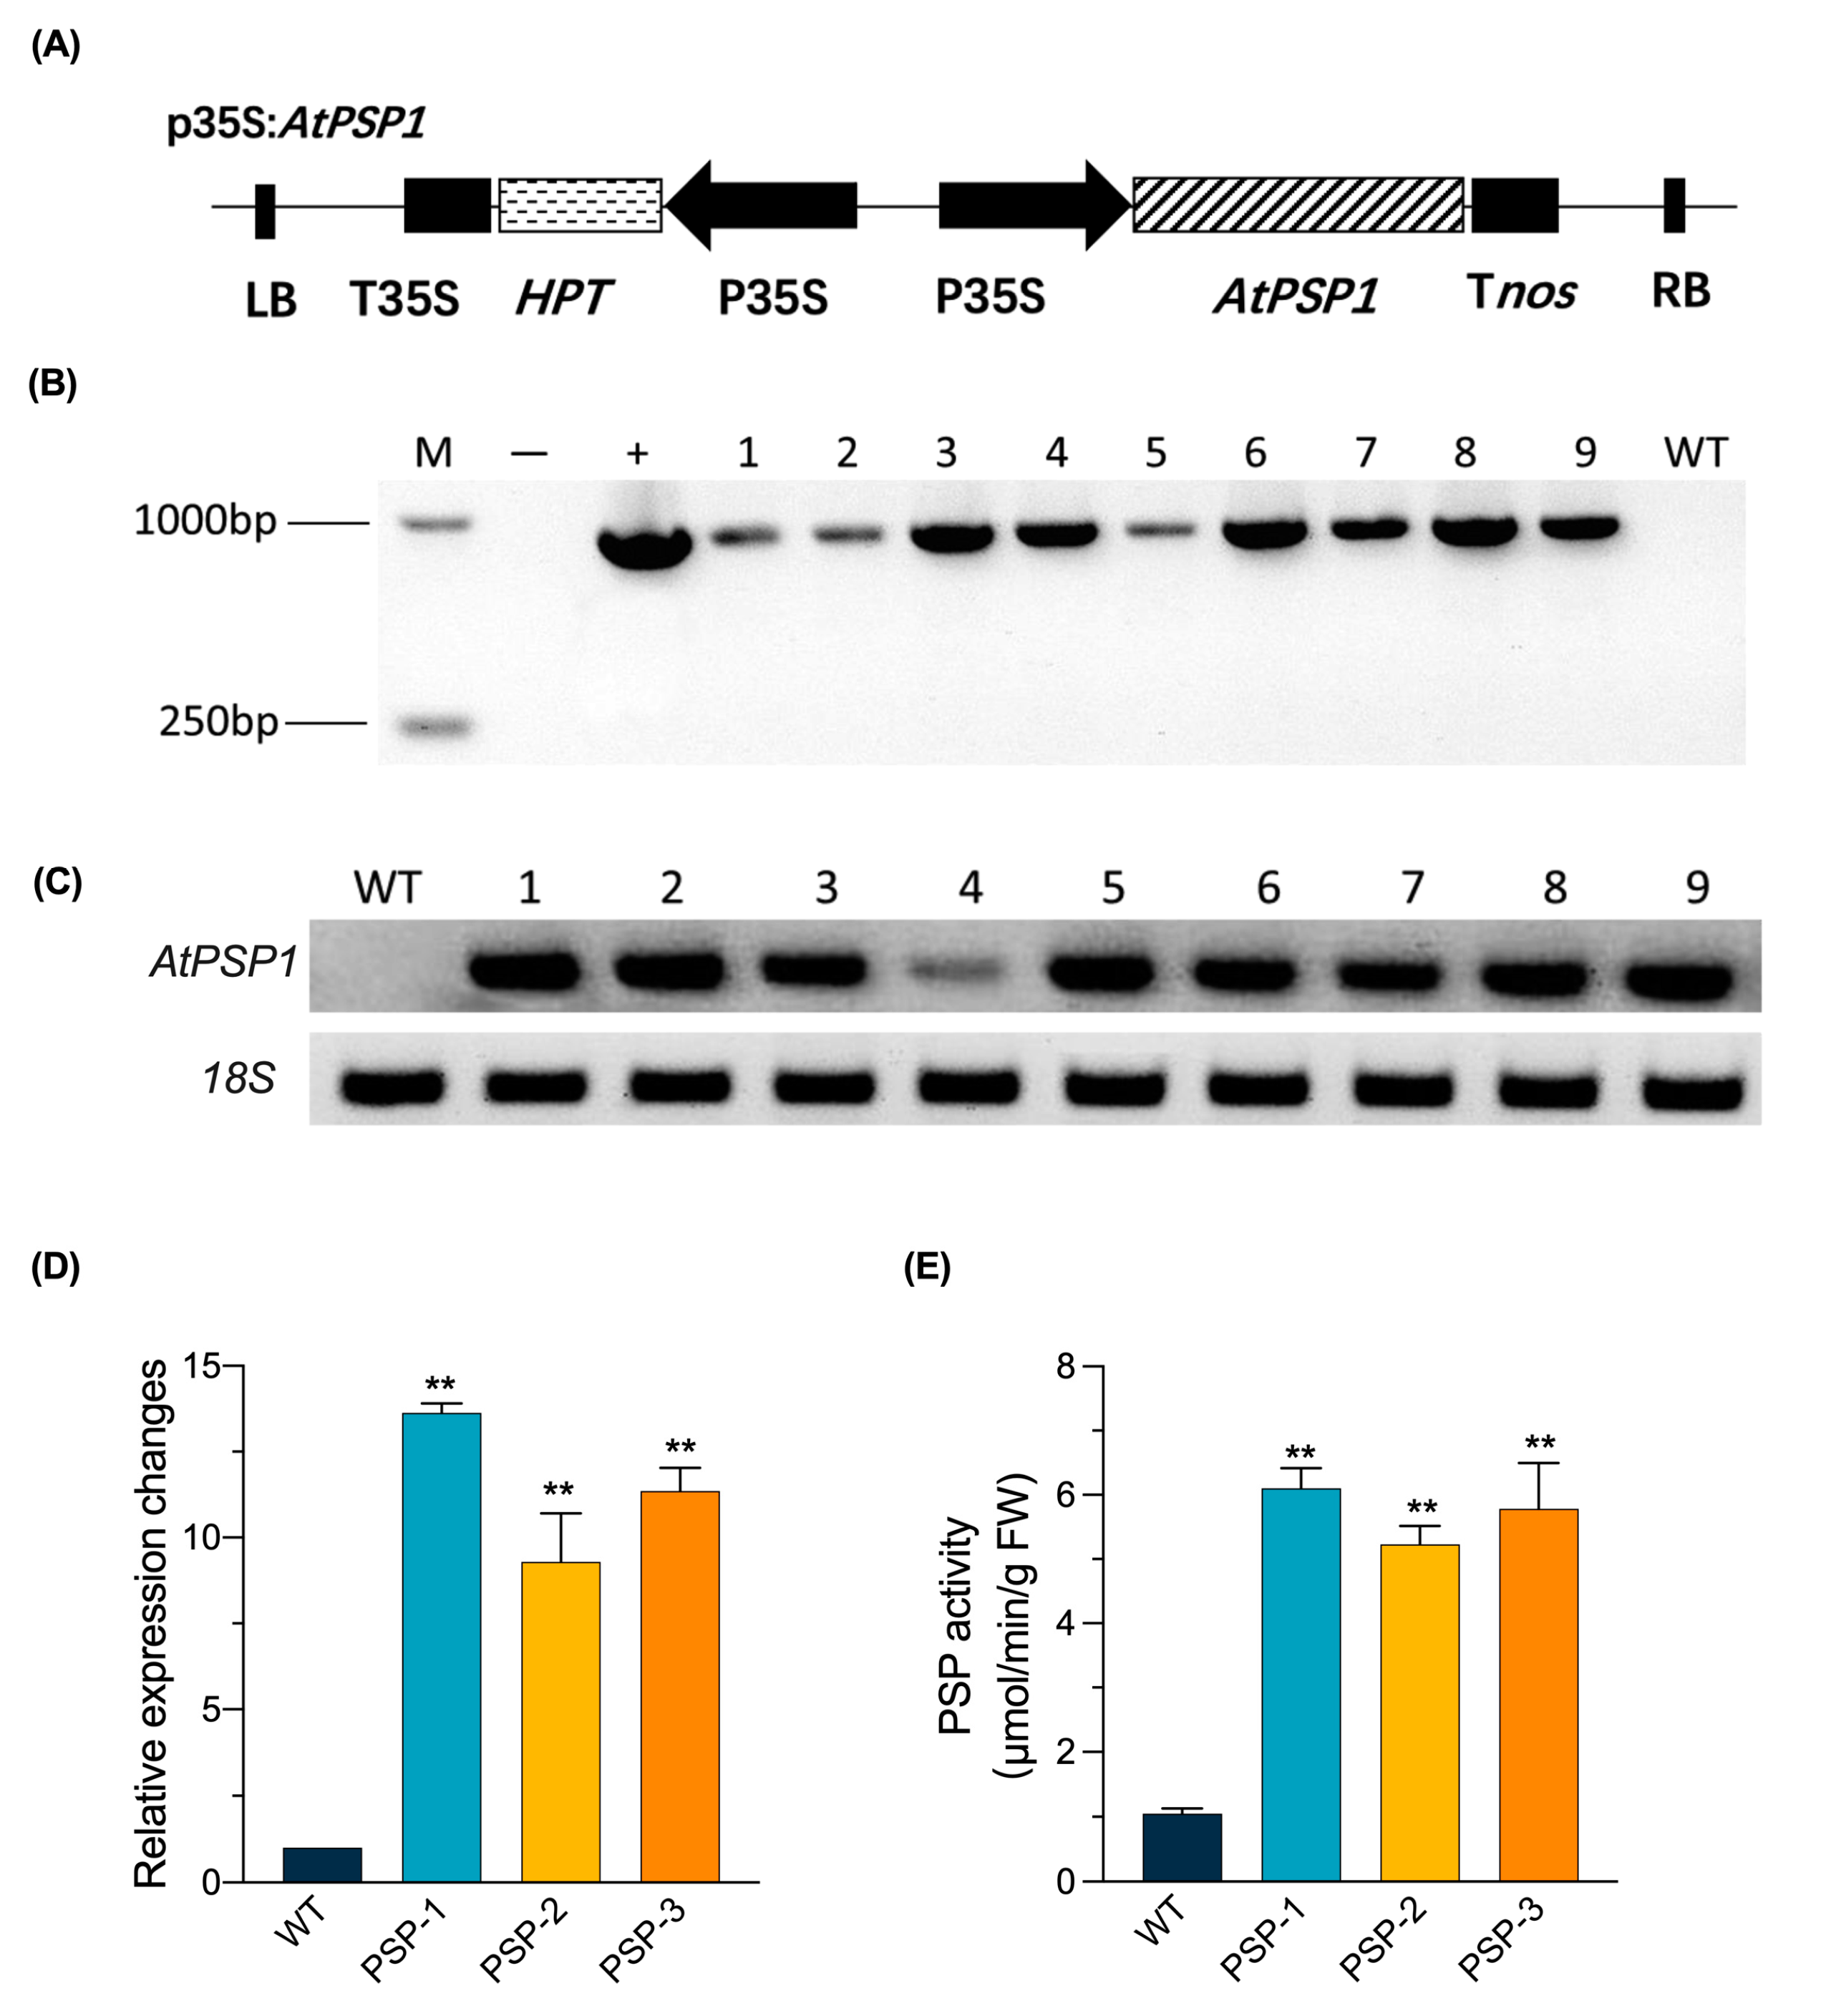
2.1. Generation of AtPSP1 Overexpressing Transgenic Lines

To explore the role that this pathway plays in starch accumulation and the interaction between PPSB and sulfur deficiency in duckweed, we constructed an AtPSP1 overexpression vector based on pCAMBIA 1301, replacing the GUS coding sequence with the full-length CDS sequence (888 bp) of AtPSP1 from Arabidopsis (Figure 1A). The vector was transformed into Lemna turionifera 5511 using Agrobacterium tumefaciens EHA105. The regenerated plants were screened with hygromycin to obtain resistant, transgenic plants. Nine transgenic lines with AtPSP1 overexpression were confirmed via the PCR amplification of AtPSP1 CDs (Figure 1B). Furthermore, all these lines were analyzed for semi-quantitative RT-PCR of the AtPSP1 gene (Figure 1C), and three differentially expressed plants (Line 1/2/3, named PSP-1/PSP-2/PSP-3, respectively) were selected for quantitative RT-PCR assays; higher PSP enzyme activity was found in transgenic lines (Figure 1D,E).

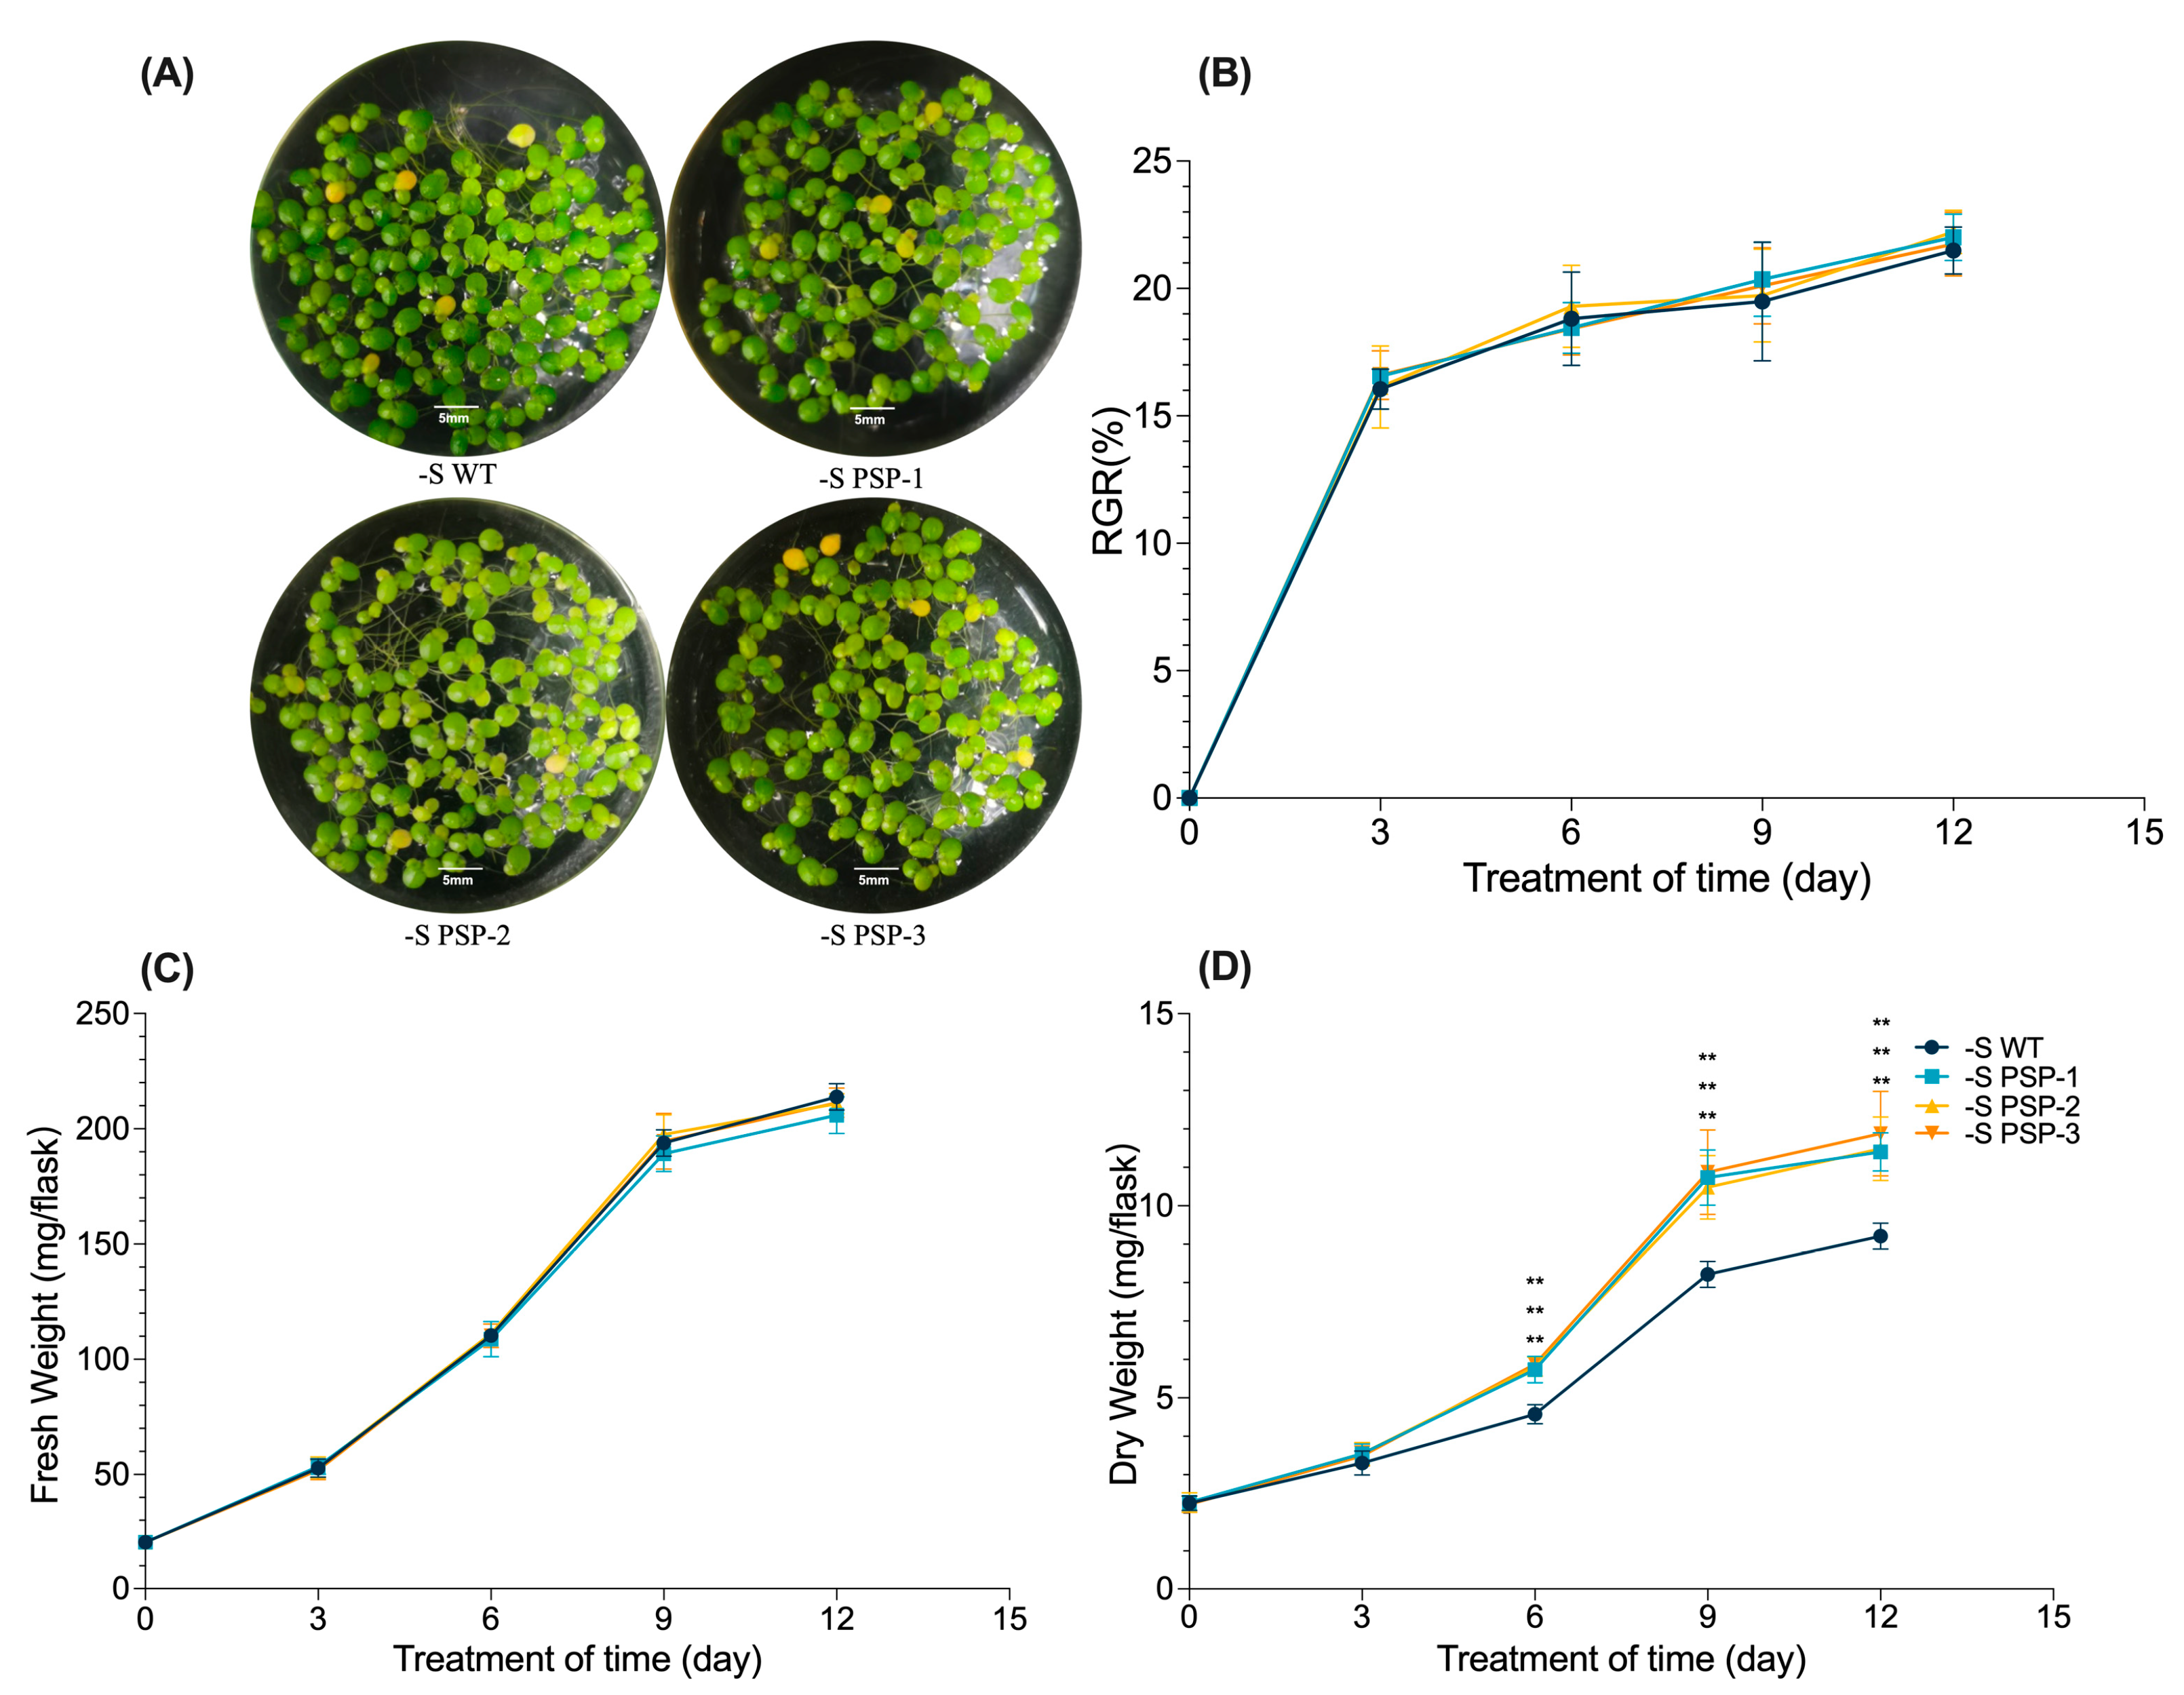
2.2. Overexpression of AtPSP1 Increased Dry Weight under Sulfur Deficiency

Ten duckweed plants with similar growth conditions were selected from the wild-type or three transgenic lines under normal growth conditions, then cultured in a Datko (medium with the total nutrition) and sulfur-deficient medium. The phenotype of duckweed was observed and photos were taken on day 9. The results showed that there were no morphological differences between the transgenic lines and WT (Figures S1 and S2A–D). The statistical results of relative growth rate, fresh weight, and dry weight at 3d, 6d, 9d, 12d, and 15d also indicate that the overexpression of AtPSP1 did not show any significant differences compared with the WT in the Datko medium (Figure S2E–G).
The fronds of duckweed only showed the etiolation phenotype after the duckweed was cultured under sulfur-deficient conditions, but there was no significant difference between the transgenic lines and WT (Figure 2A and Figure S3). Although the relative growth rate (RGR) and fresh weight of duckweed gradually increased with treatment, the transgenic lines and WT showed the same growth trend (Figure 2B,C). The dry weight of the transgenic lines was progressively higher than that of the WT after 3 days and significantly higher than the WT at 9d and 12d (Figure 2D). The overexpression of AtPSP1 in duckweed increased the dry weight under sulfur-deficient conditions.

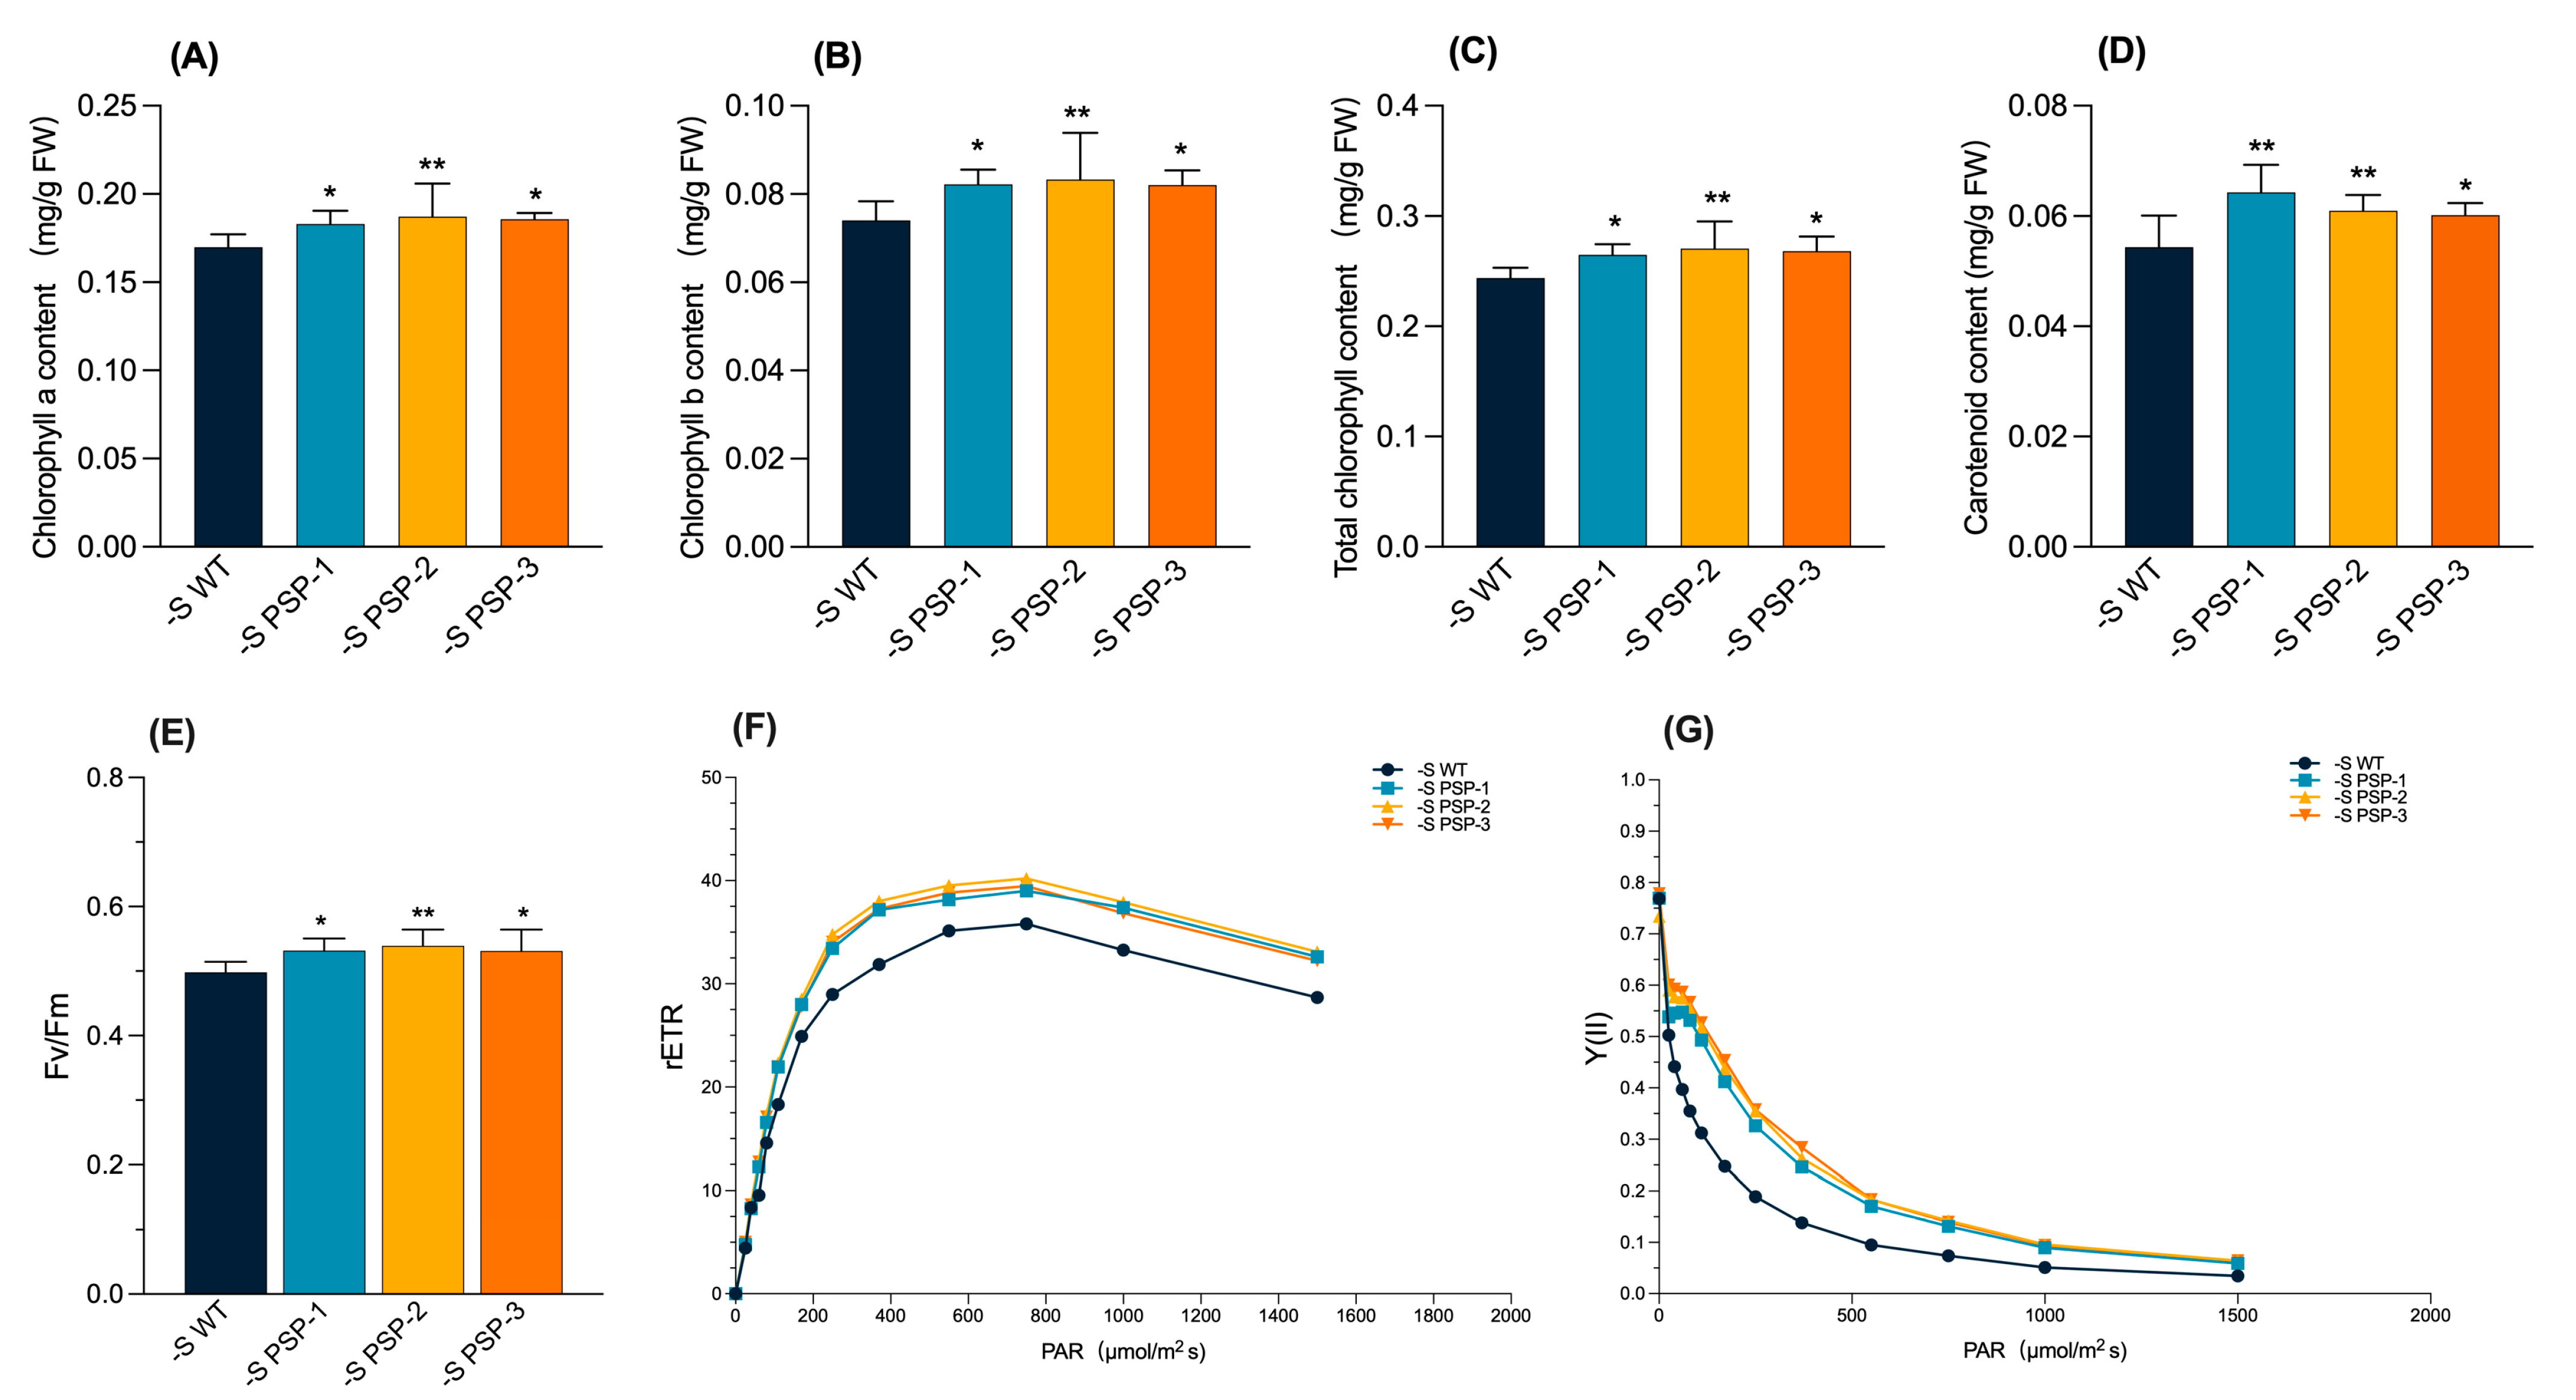
2.3. The Effect of the Overexpression of AtPSP1 on Photosynthetic Pigment and Chlorophyll Fluorescence Parameters under Sulfur Deficiency

The comparison of photosynthetic pigment content (chlorophyll a, chlorophyll b, total chlorophyll, and carotenoid) at 9d under Datko cultivation showed that there was no significant difference between the transgenic lines and WT (Figure S4A–D). The chlorophyll fluorescence parameters, after 6 days of cultivation in Datko, showed that Fv/Fm (PSII maximum light quantum production), the relative electron transfer rate (rETR), and Y(II) (actual photosynthetic efficiency of PS II) also had no significant differences (Figure S4E–G). Under sulfur-deficient conditions, the content of the photosynthetic pigment after 9 days of treatment and the chlorophyll fluorescence parameters after 6 days of treatment showed different trends in transgenic lines compared with WT (Figure 3). The photosynthetic pigment content (chlorophyll a, chlorophyll b, and total chlorophyll content) of the transgenic lines was significantly higher than that of the WT after 9 days of sulfur-deficient treatment, particularly PSP-2 (Figure 3A–C). The carotenoid content of the transgenic lines was also significantly higher than that of the WT, particularly PSP-1 and PSP-2 (Figure 3D). The value of Fv/Fm was significantly higher in the transgenic lines than in the WT. The value of Fv/Fm was the highest in PSP-2 (Figure 3E). rETR and Y(II) of the transgenic lines were also significantly higher than those of the WT with the increase in light intensity (Figure 3F,G). The results indicated that the photosynthetic performance of the transgenic lines was significantly higher than that of the WT under sulfur-deficient conditions.

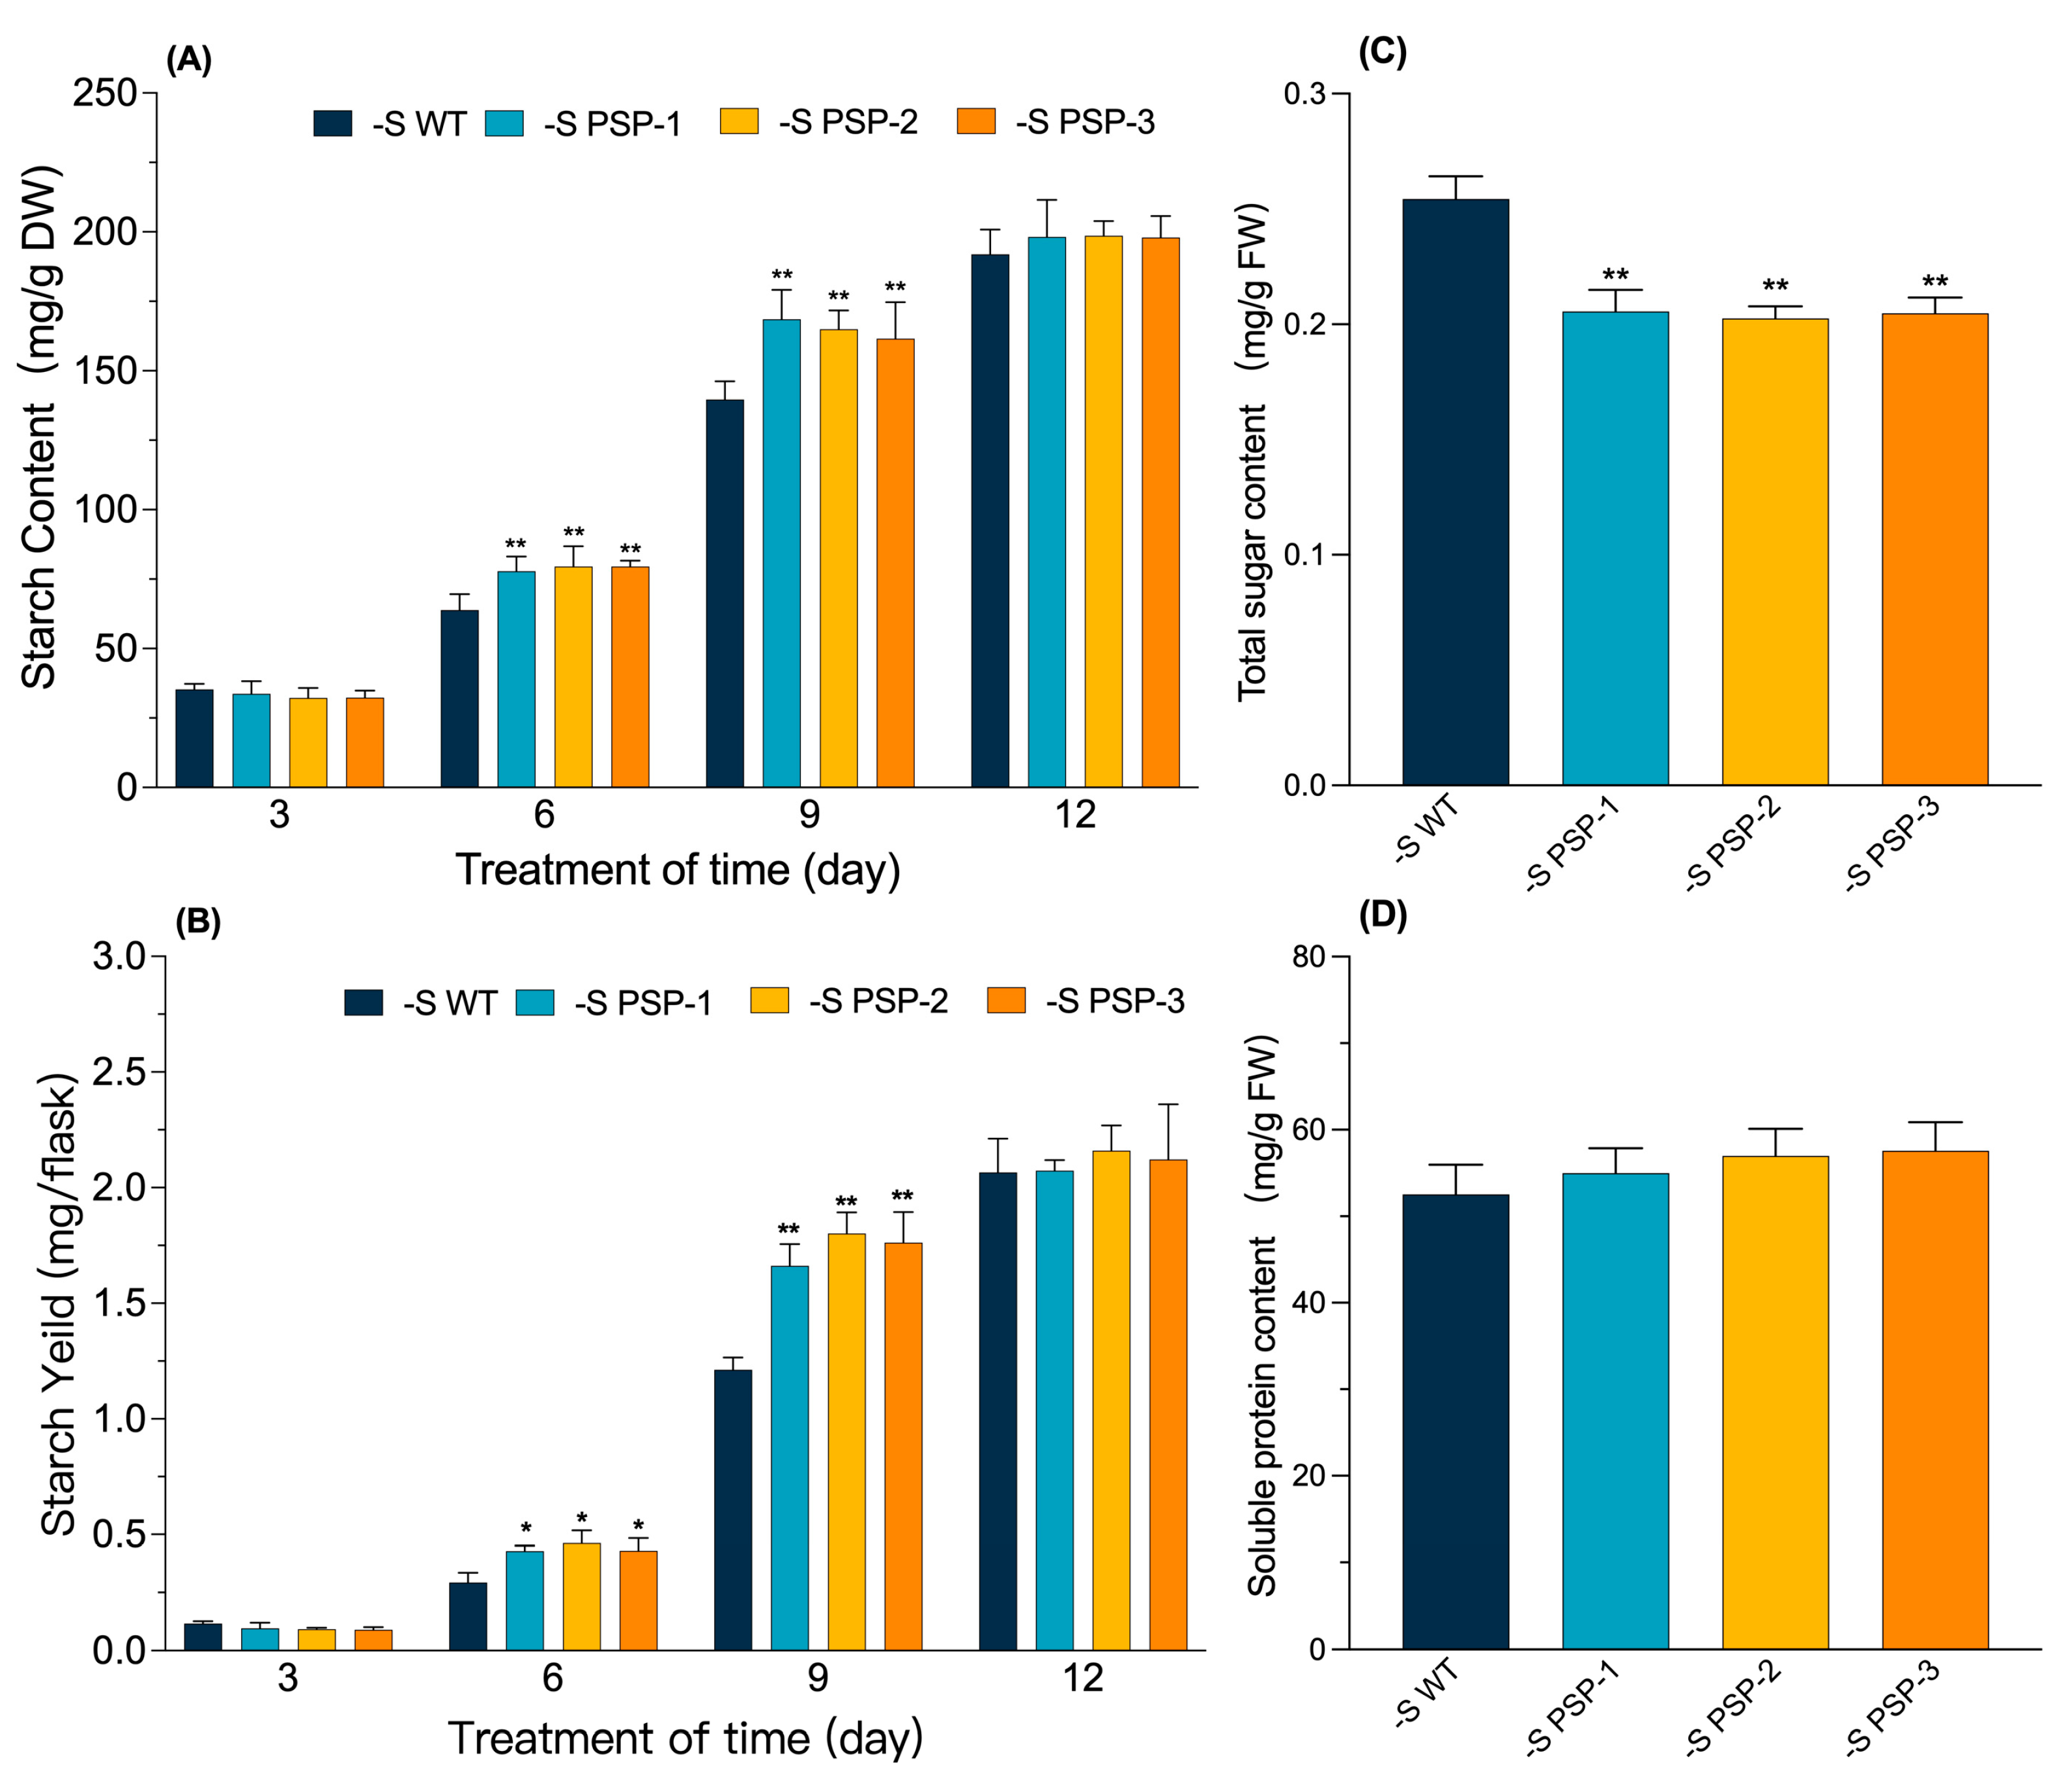
2.4. The Effect of the Overexpression of AtPSP1 on Starch, Sugar and Soluble Protein Contents under Sulfur Deficiency

The starch content was measured after treatment for 3, 6, 9, and 12 days in the transgenic lines and WT under Datko medium and sulfur-deficient conditions. The starch content of the duckweed gradually increased with treatment, from about 25 mg/g DW at 3d to 45 mg/g DW at 12d (Figure S5A); the starch yield also gradually increased, from about 0.05 mg/flask at 3d to about 0.65 mg/flask at 12d in the Datko medium (Figure S5B). Both the starch content and yield showed no significant difference between the transgenic lines and WT.
The starch content was compared after the samples were treated for 3, 6, 9, and 12 days under sulfur-deficient conditions. The results showed that the starch content increased from about 35 mg/g DW at 3d to about 200 mg/g DW at 12d, which was significantly higher in the transgenic lines than that of the WT at 6d and 9d in Figure 4A. The starch yield also increased from about 0.1 mg/flask at 3d to more than 2.0 mg/flask at 12d, and the starch yield in the transgenic lines was significantly higher than that of the WT at both 6d and 9d (Figure 4B).
The content of the total sugar and soluble protein was determined after 9 days under sulfur-deficient cultivations. The total sugar content was found to be 0.25 mg/g in the WT and 0.2 mg/g in the transgenic lines. The content of total sugar in the transgenic lines was significantly lower than that of the WT (Figure 4C). The soluble protein content was not significantly different between the transgenic lines and WT, with both ranging from 52 to 58 mg/g (Figure 4D). Starch accumulation was increased in the transgenic lines under sulfur-deficient conditions, while the total sugar content was reduced, possibly due to the conversion of sugars to starch.

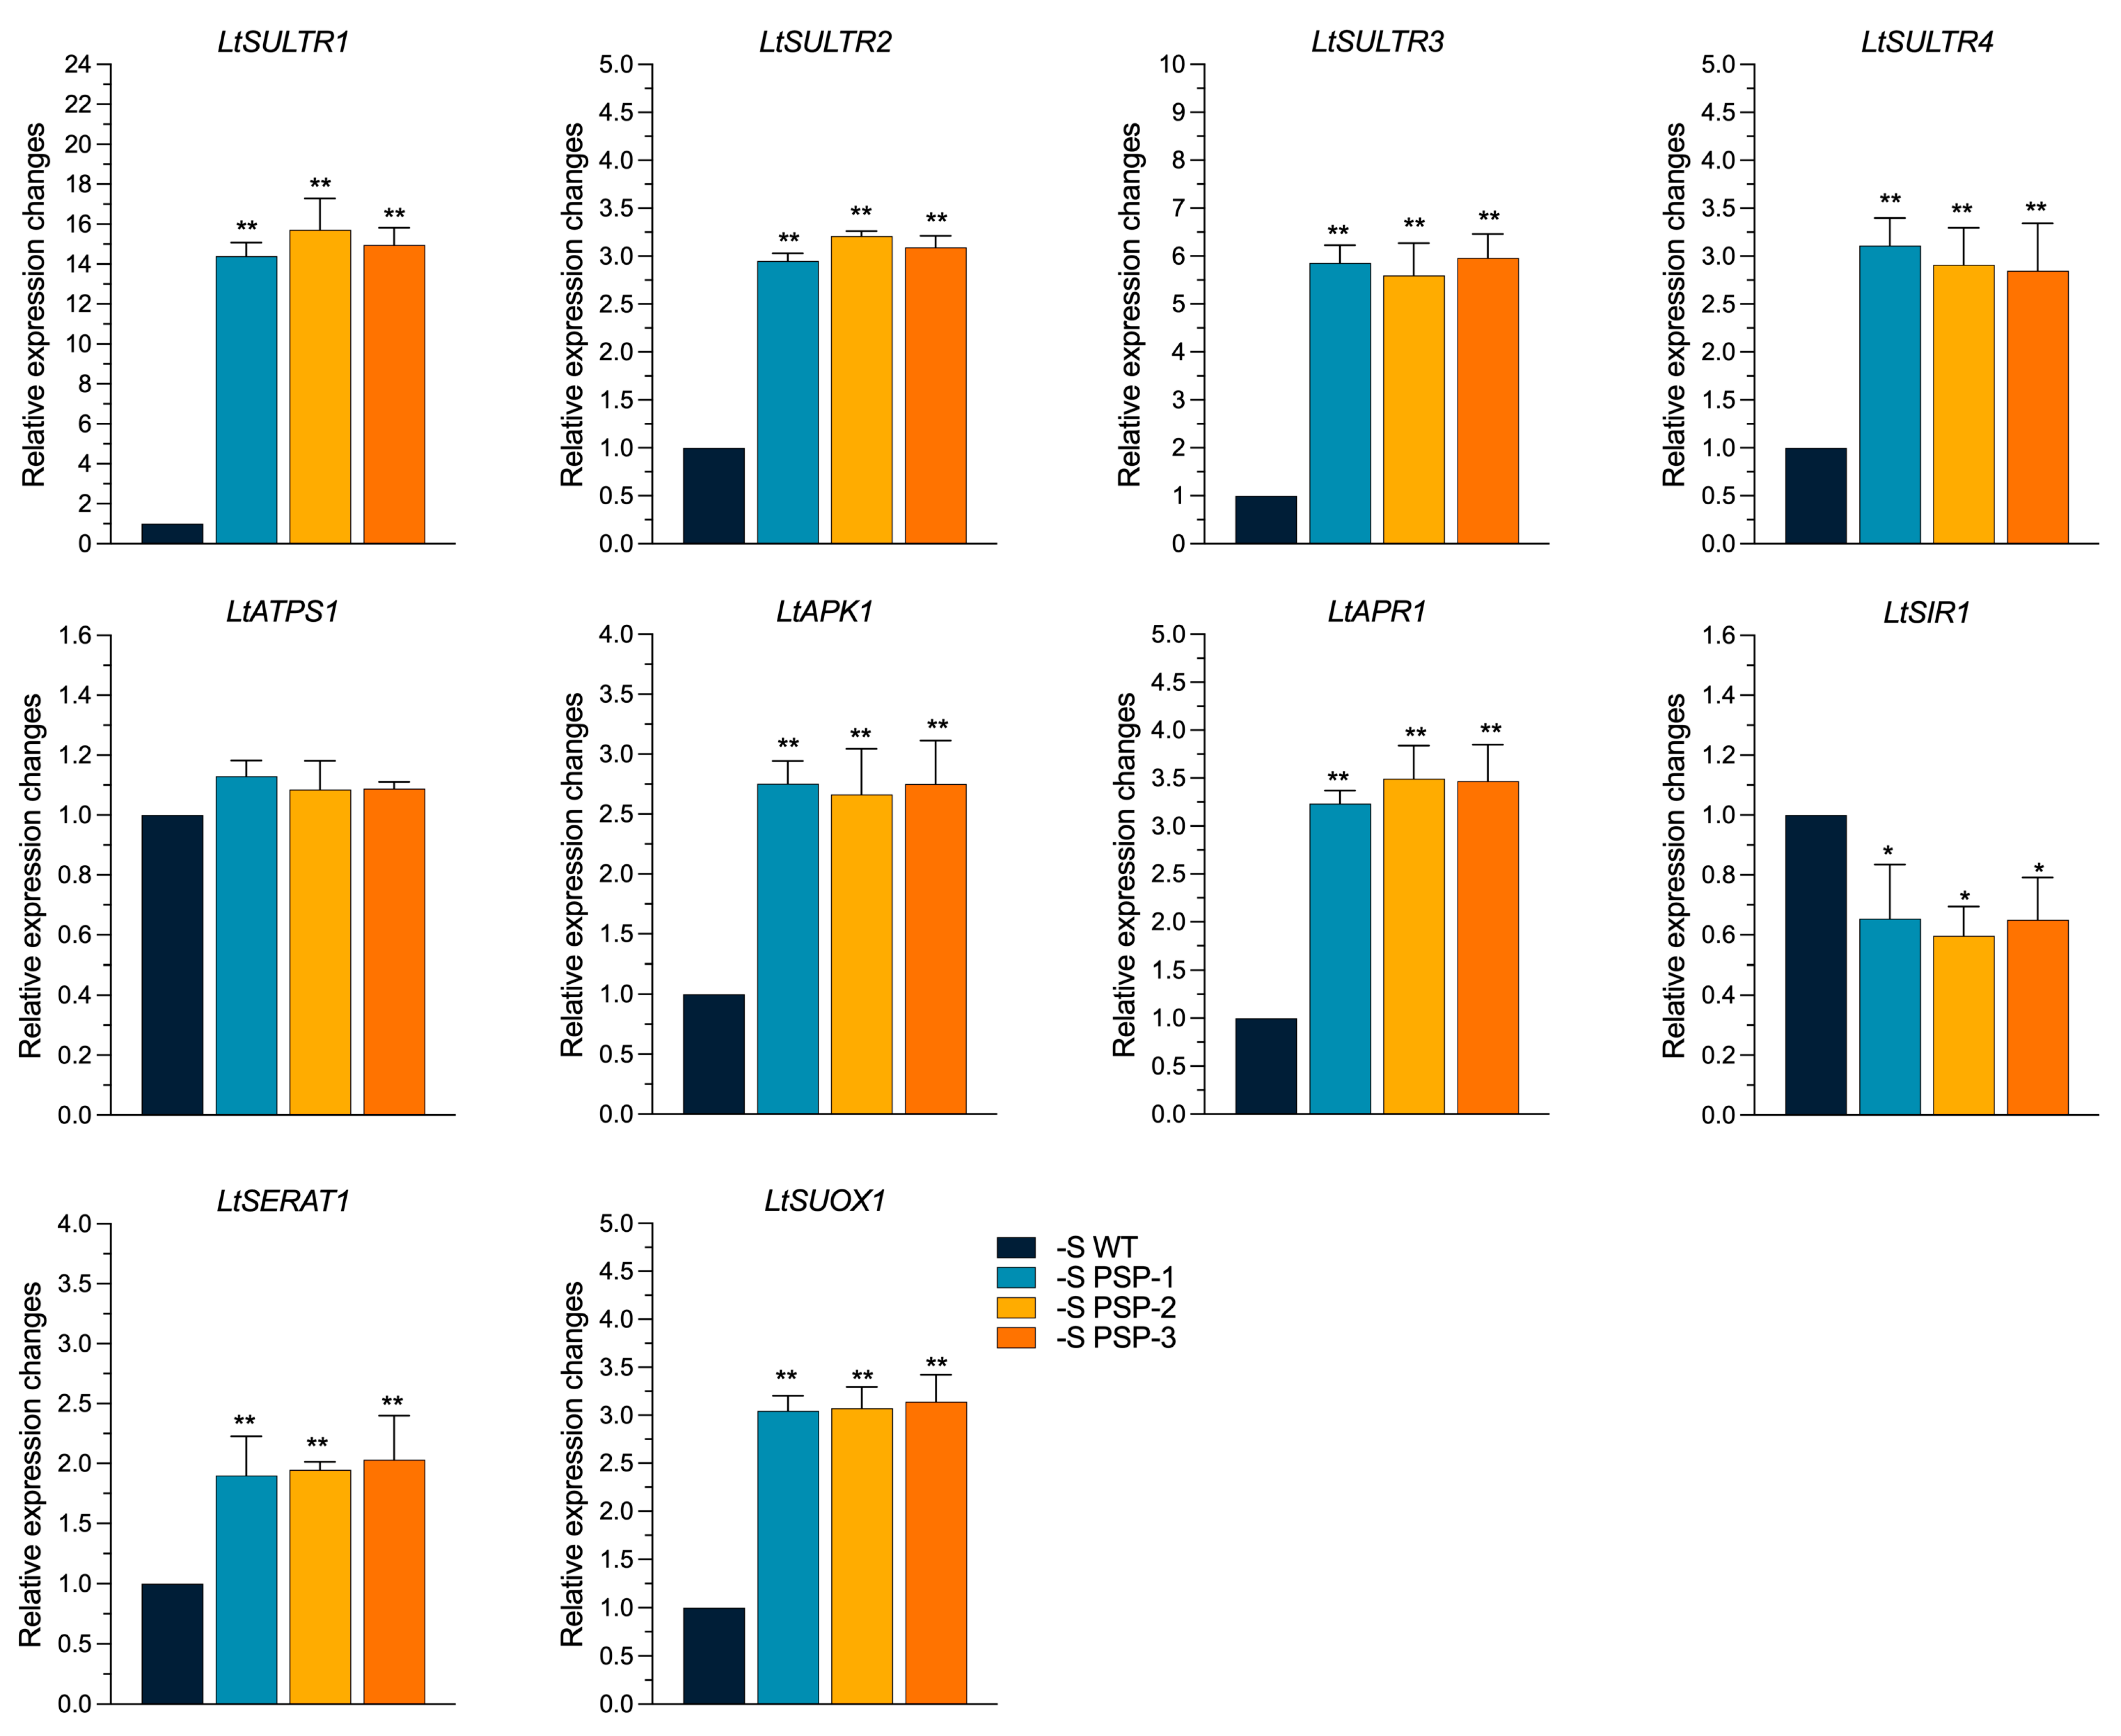
2.5. The Effect of the Overexpression of AtPSP1 on the Expression of Sulfur Assimilation-Related Genes under Sulfur Deficiency

There are four SULTRs in Arabidopsis: SULTR1 is responsible for the uptaking of sulfate from the rhizosphere, LtSULTR2 and LtSULTR3 play the role of a transition sulfate from root to shoot, and LtSULTR4 is responsible for the transport of vascular sulfate [29,30,31]. Four genes were found to encode the sulfate transporter in duckweed: LtSULTR1, LtSULTR2, LtSULTR3, and LtSULTR4. The expression of LtSULTR1, LtSULTR2, LtSULTR3, and LtSULTR4 in the transgenic lines was, on average, 14.5-, 3.2-, 5.65-, and 2.85-fold higher than that of the WT using qRT-PCR, respectively (Figure 5). The expression of LtAPK1 (adenylyl sulfate kinase) was significantly upregulated 2.6–2.75-fold compared with the WT. The expression of LtAPR1 (adenylyl sulfate reductase) was significantly higher than that of the WT, by about 3.35-fold; LtSERAT1 (serine acetyltransferase coding gene) was also significantly upregulated in the transgenic lines, by 1.75–2.0-fold, compared with the WT. The expression of LtSUOX1 (sulfite oxidase) was significantly upregulated by about 3.0-fold in all three transgenic lines compared with the WT. However, the expression of LtSIR1 (sulfite reductase) was significantly lower than that of the WT, by about 0.3–0.4-fold; only the expression of LtATPS1 (ATP sulfurylase) did not significantly differ between the transgenic lines and WT. The sulfur metabolic pathway was shown to be more active in the transgenic lines under sulfur-deficient conditions compared with normal growth conditions (Datko cultured condition).

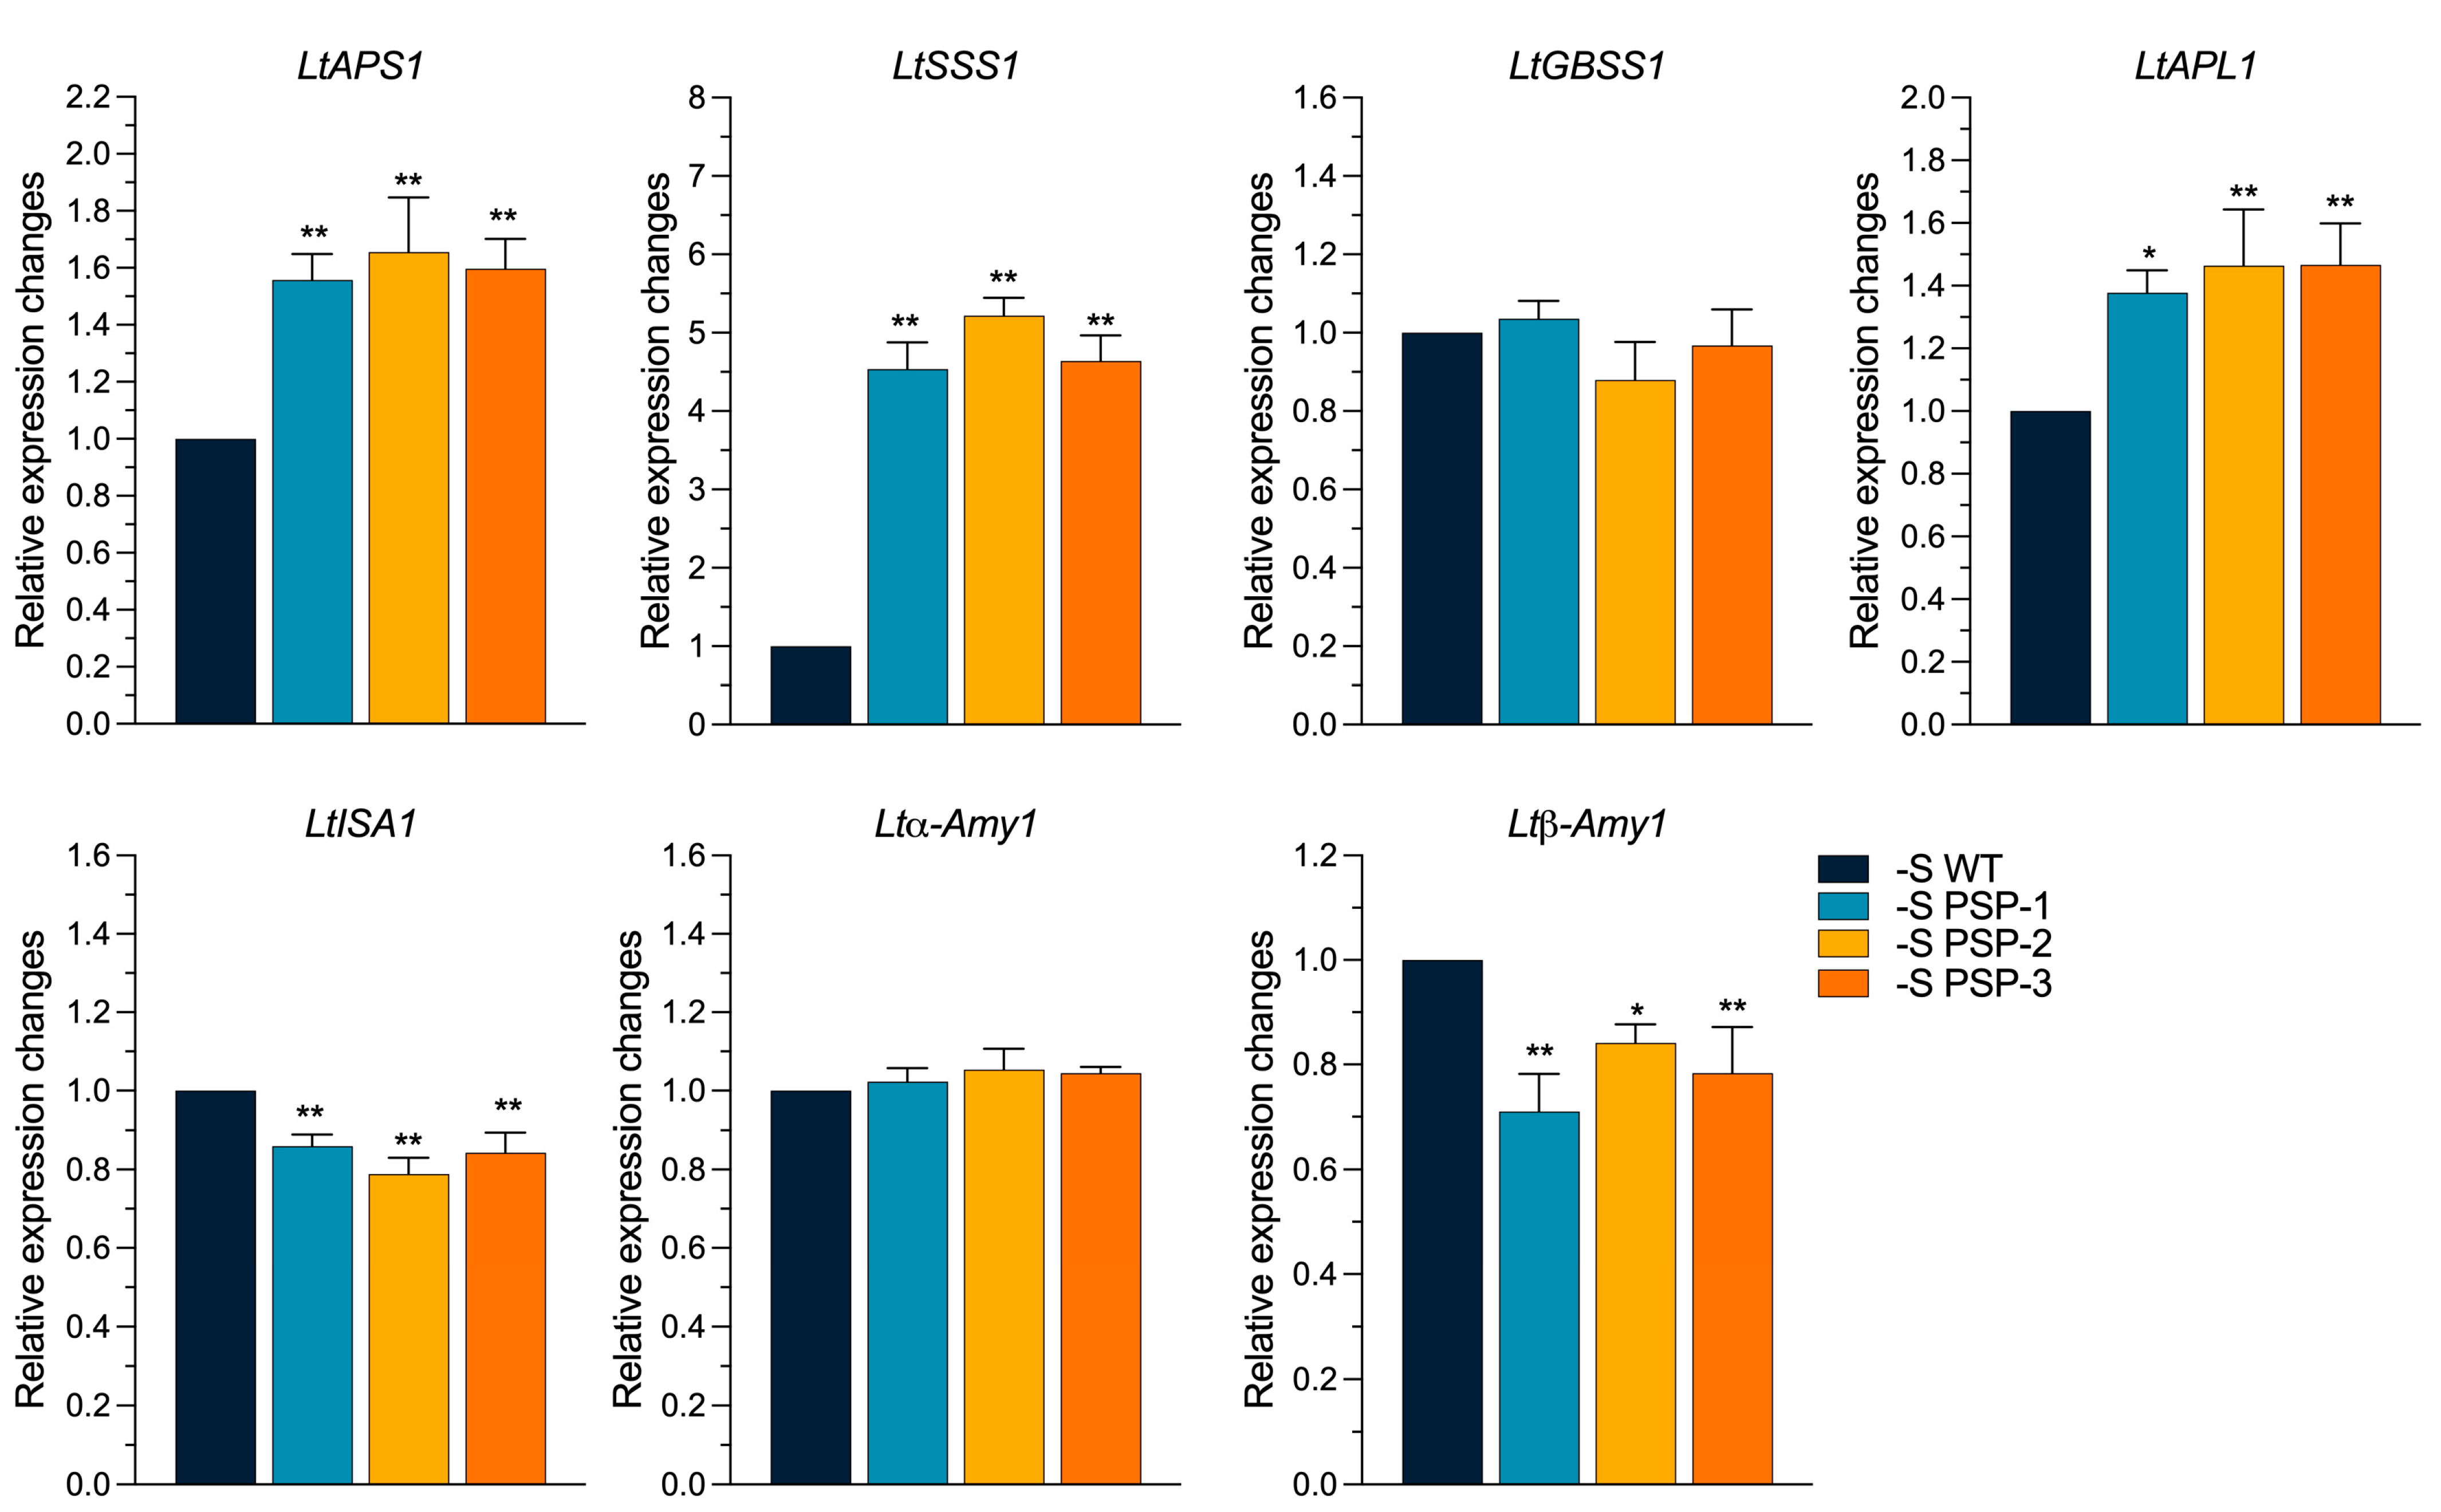
2.6. The Effect of the Overexpression of AtPSP1 on the Expression of Starch Metabolism-Related Genes under Sulfur Deficiency

The overexpression of AtPSP1 promoted starch accumulation in duckweed under sulfur-deficient conditions. To study the expression of the genes related to starch metabolism, the transcriptional level of the genes was analyzed using qRT-PCR after sulfur-deficiency treatment for 6 days. The results showed that the expression of the two genes encoding ADP-glucose pyrophosphorylase, LtAPS1 and LtAPL1, was significantly higher than that of the WT, by about 1.65-fold and 1.4-fold, respectively. The expression of LtSSS1 (soluble starch synthase) was significantly higher in the three transgenic lines than in the WT, by about 4.5-, 5.2-, and 4.6-fold. The expression of LtGBSS1, the gene-encoded granule-bound starch synthase, was not significantly different compared with the WT, while the genes involved in the regulation of amylolytic metabolism showed different expression patterns. The expression of LtISA1 (isoamylase) was significantly lower than that of the WT, by about 0.15-fold; the expression of Ltα-Amy1(α-amylase) was not significantly different compared with the WT; and Ltβ-Amy1(β-amylase) showed different expression patterns in the three transgenic lines—they were 0.7-fold, 0.85-fold, and 0.8-fold higher in the PSP-1, PSP-2, and PSP-3 lines, respectively, than in the WT (Figure 6). The results showed that the expression of the genes involved in the starch synthesis pathway was upregulated, and the expression of the genes involved in the starch degradation pathway was downregulated.

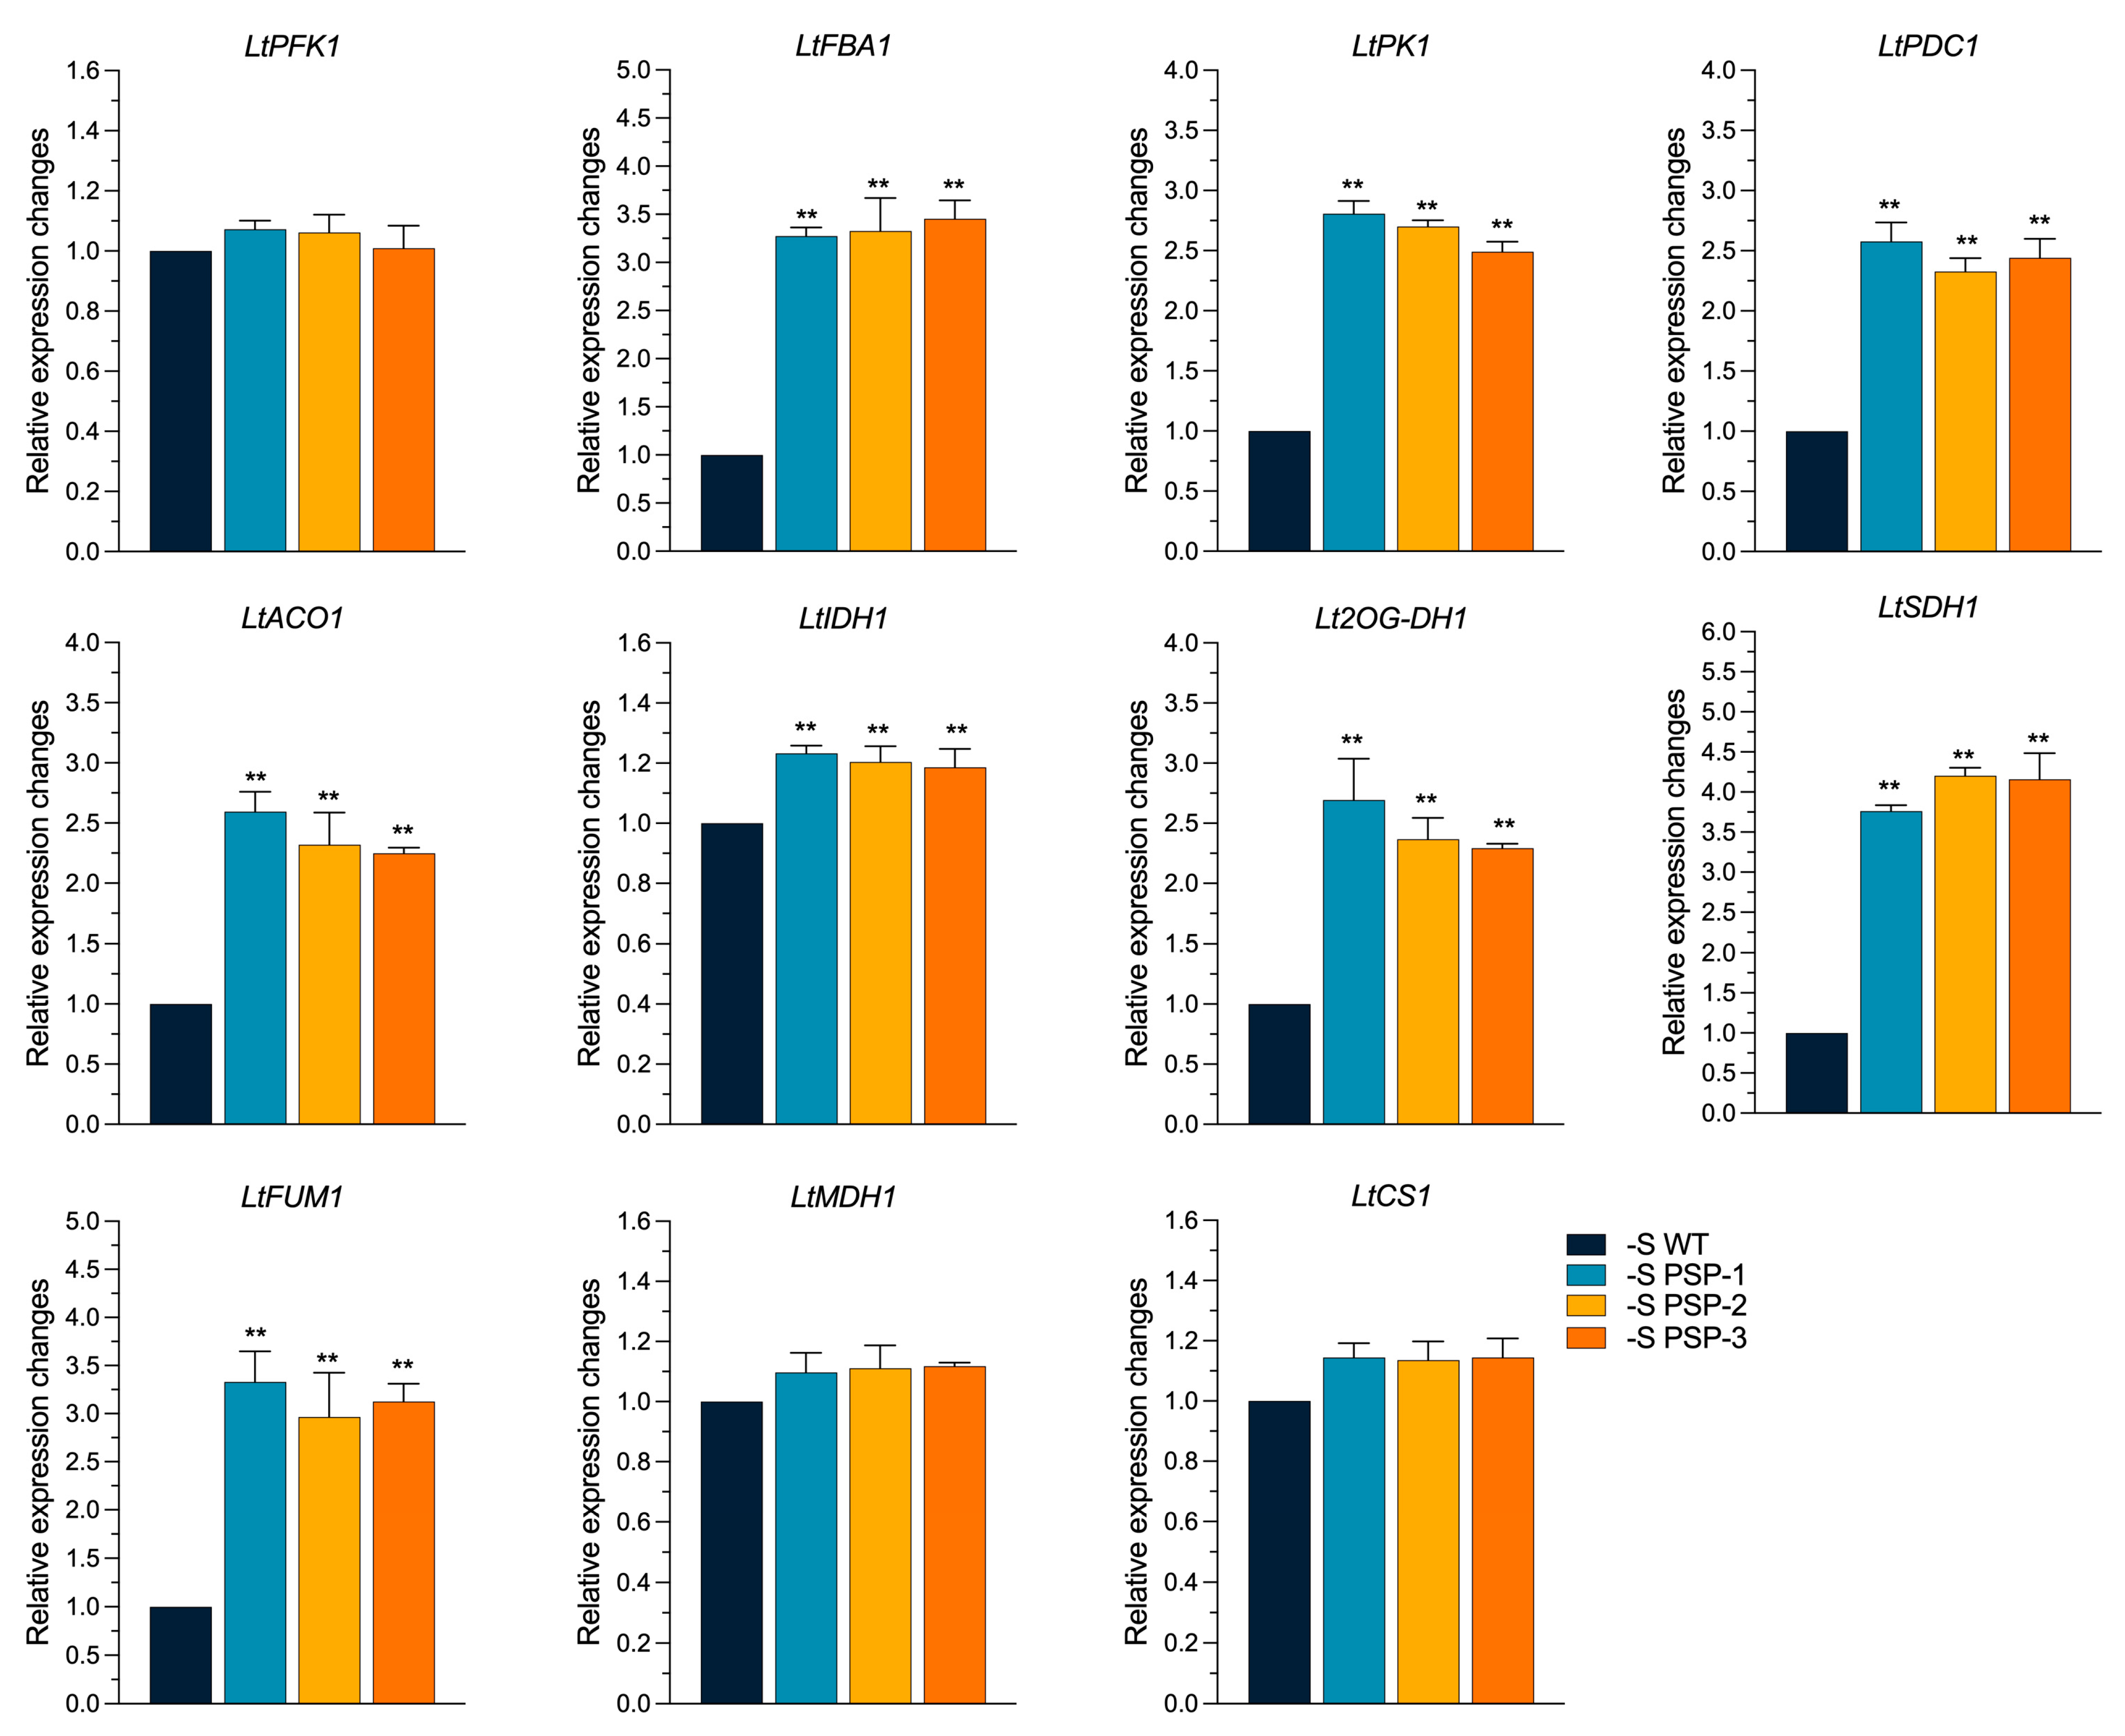
2.7. The Effect of the Overexpression of AtPSP1 on the Expression of Carbon Metabolism-Related Genes under Sulfur Deficiency

The synthesis and degradation of plant starch are closely linked to carbon metabolism [32,33,34]; we examined the expression of the genes related to carbon metabolism in duckweed after 6 days of treatment under sulfur deficiency. According to the qRT-PCR results shown in Figure 7, the expression of LtPFK1 (phosphofructokinase) in the glycolytic pathway was not significantly different between the transgenic lines and WT. In contrast, the expression of LtFBA1 (fructose-diphosphate aldolase), LtPK1 (pyruvate kinase encoding gene), and LtPDC1 (pyruvate dehydrogenase complex) was significantly upregulated, by about 3.3-fold, 2.6-fold, and 2.4-fold, respectively, compared with WT. The expression patterns of the genes in the TCA cycle also differed. The expression of LtACO1 (aconitase) was significantly upregulated in the transgenic lines, by about 2.4 times. The expression of LtIDH1 (isocitrate dehydrogenase) was significantly higher than the WT, by about 1.2-fold. The expression of Lt2OG-DH1 (2-OG dehydrogenase) was significantly higher in the three transgenic lines than in the WT, by about 2.6-fold, 2.25-fold, and 2.3-fold, respectively. The expression of LtSDH1 (succinate dehydrogenase) in the three transgenic lines was, on average, 4.1-fold higher than in the WT. The expression of LtFUM1 (fumarate) was also significantly higher than that of the WT, by about 3.3-fold, 2.75-fold, and 3.0-fold, in PSP-1, PSP-2, and PSP-3, respectively. The expression of LtMDH1 (malate dehydrogenase) and LtCS1 (citrate synthase) was upregulated compared with the WT but did not reach a significant difference. This indicated that the overexpression of AtPSP1 increased the expression of carbon metabolism-related genes under sulfur-deficient conditions.

3. Discussion

3.1. The Overexpression of AtPSP1 Prompts Growth and Starch Accumulation in Duckweed under Sulfur Deficiency

Duckweed is rich in starch under normal growth conditions and can accumulate more starch when its growth is inhibited due to nutrient limitation, hormone treatments, etc. [6,7,8,9,10,11,12,13,14,15,35]. In recent years, much progress has been made regarding the mechanisms of starch accumulation in duckweed under nutrition stress conditions. It is believed that there is a tradeoff between starch accumulation and an increase in biomass or dry weight. In this work, the sulfur-deficient incubation did not cause morphological changes in the WT and AtPSP1 expression lines. There was a reduction in the relative growth rate (RGR), fresh weight, and dry weight, as well as the content of chlorophyll and chlorophyll fluorescence parameters, in both the WT and transgenic duckweed, compared with normal growth conditions (Datko cultivation) (Figure 2 and Figure S2). The above results indicated that sulfur deficiency affected the growth of the duckweed. The results are in accordance with former reports on the morphological observations and growth parameters after duckweed is cultivated under nutrient limitations [20,35,36,37].
Interestingly, although there were no significant differences in RGR and fresh weight between the transgenic lines and WT, the dry weight was significantly higher than that of the WT after 6 days under sulfur-deficient cultivation. The photosynthetic pigment content was also significantly higher than that of the WT, as well as the chlorophyll fluorescence parameters, indicating that the photosynthetic function was better in the transgenic lines than in the WT. This explains the accumulation of more dry matter, which is similar to the report on Spirodela polyrhiza under sulfur-deficient conditions [35]. Sulfur-deficient cultivation promoted starch accumulation in duckweed when compared to Datko cultivation (Figure 4A,B and Figure S5), and the starch content was significantly higher in the transgenic lines than in the WT, indicating that the overexpression of AtPSP1 could promote starch accumulation under sulfur-deficient conditions. The sugar content was lower than that of the WT in the transgenic duckweed, and there was almost no difference in protein content in both the transgenic duckweed and WT under sulfur limitation (Figure 4). There was a lower content of lipids and cellulose in duckweed. These results demonstrated that the dry weight increase was mainly caused by starch accumulation, which also suggested that there was no tradeoff between the accumulation of starch and dry weight under sulfur deficiency [20].

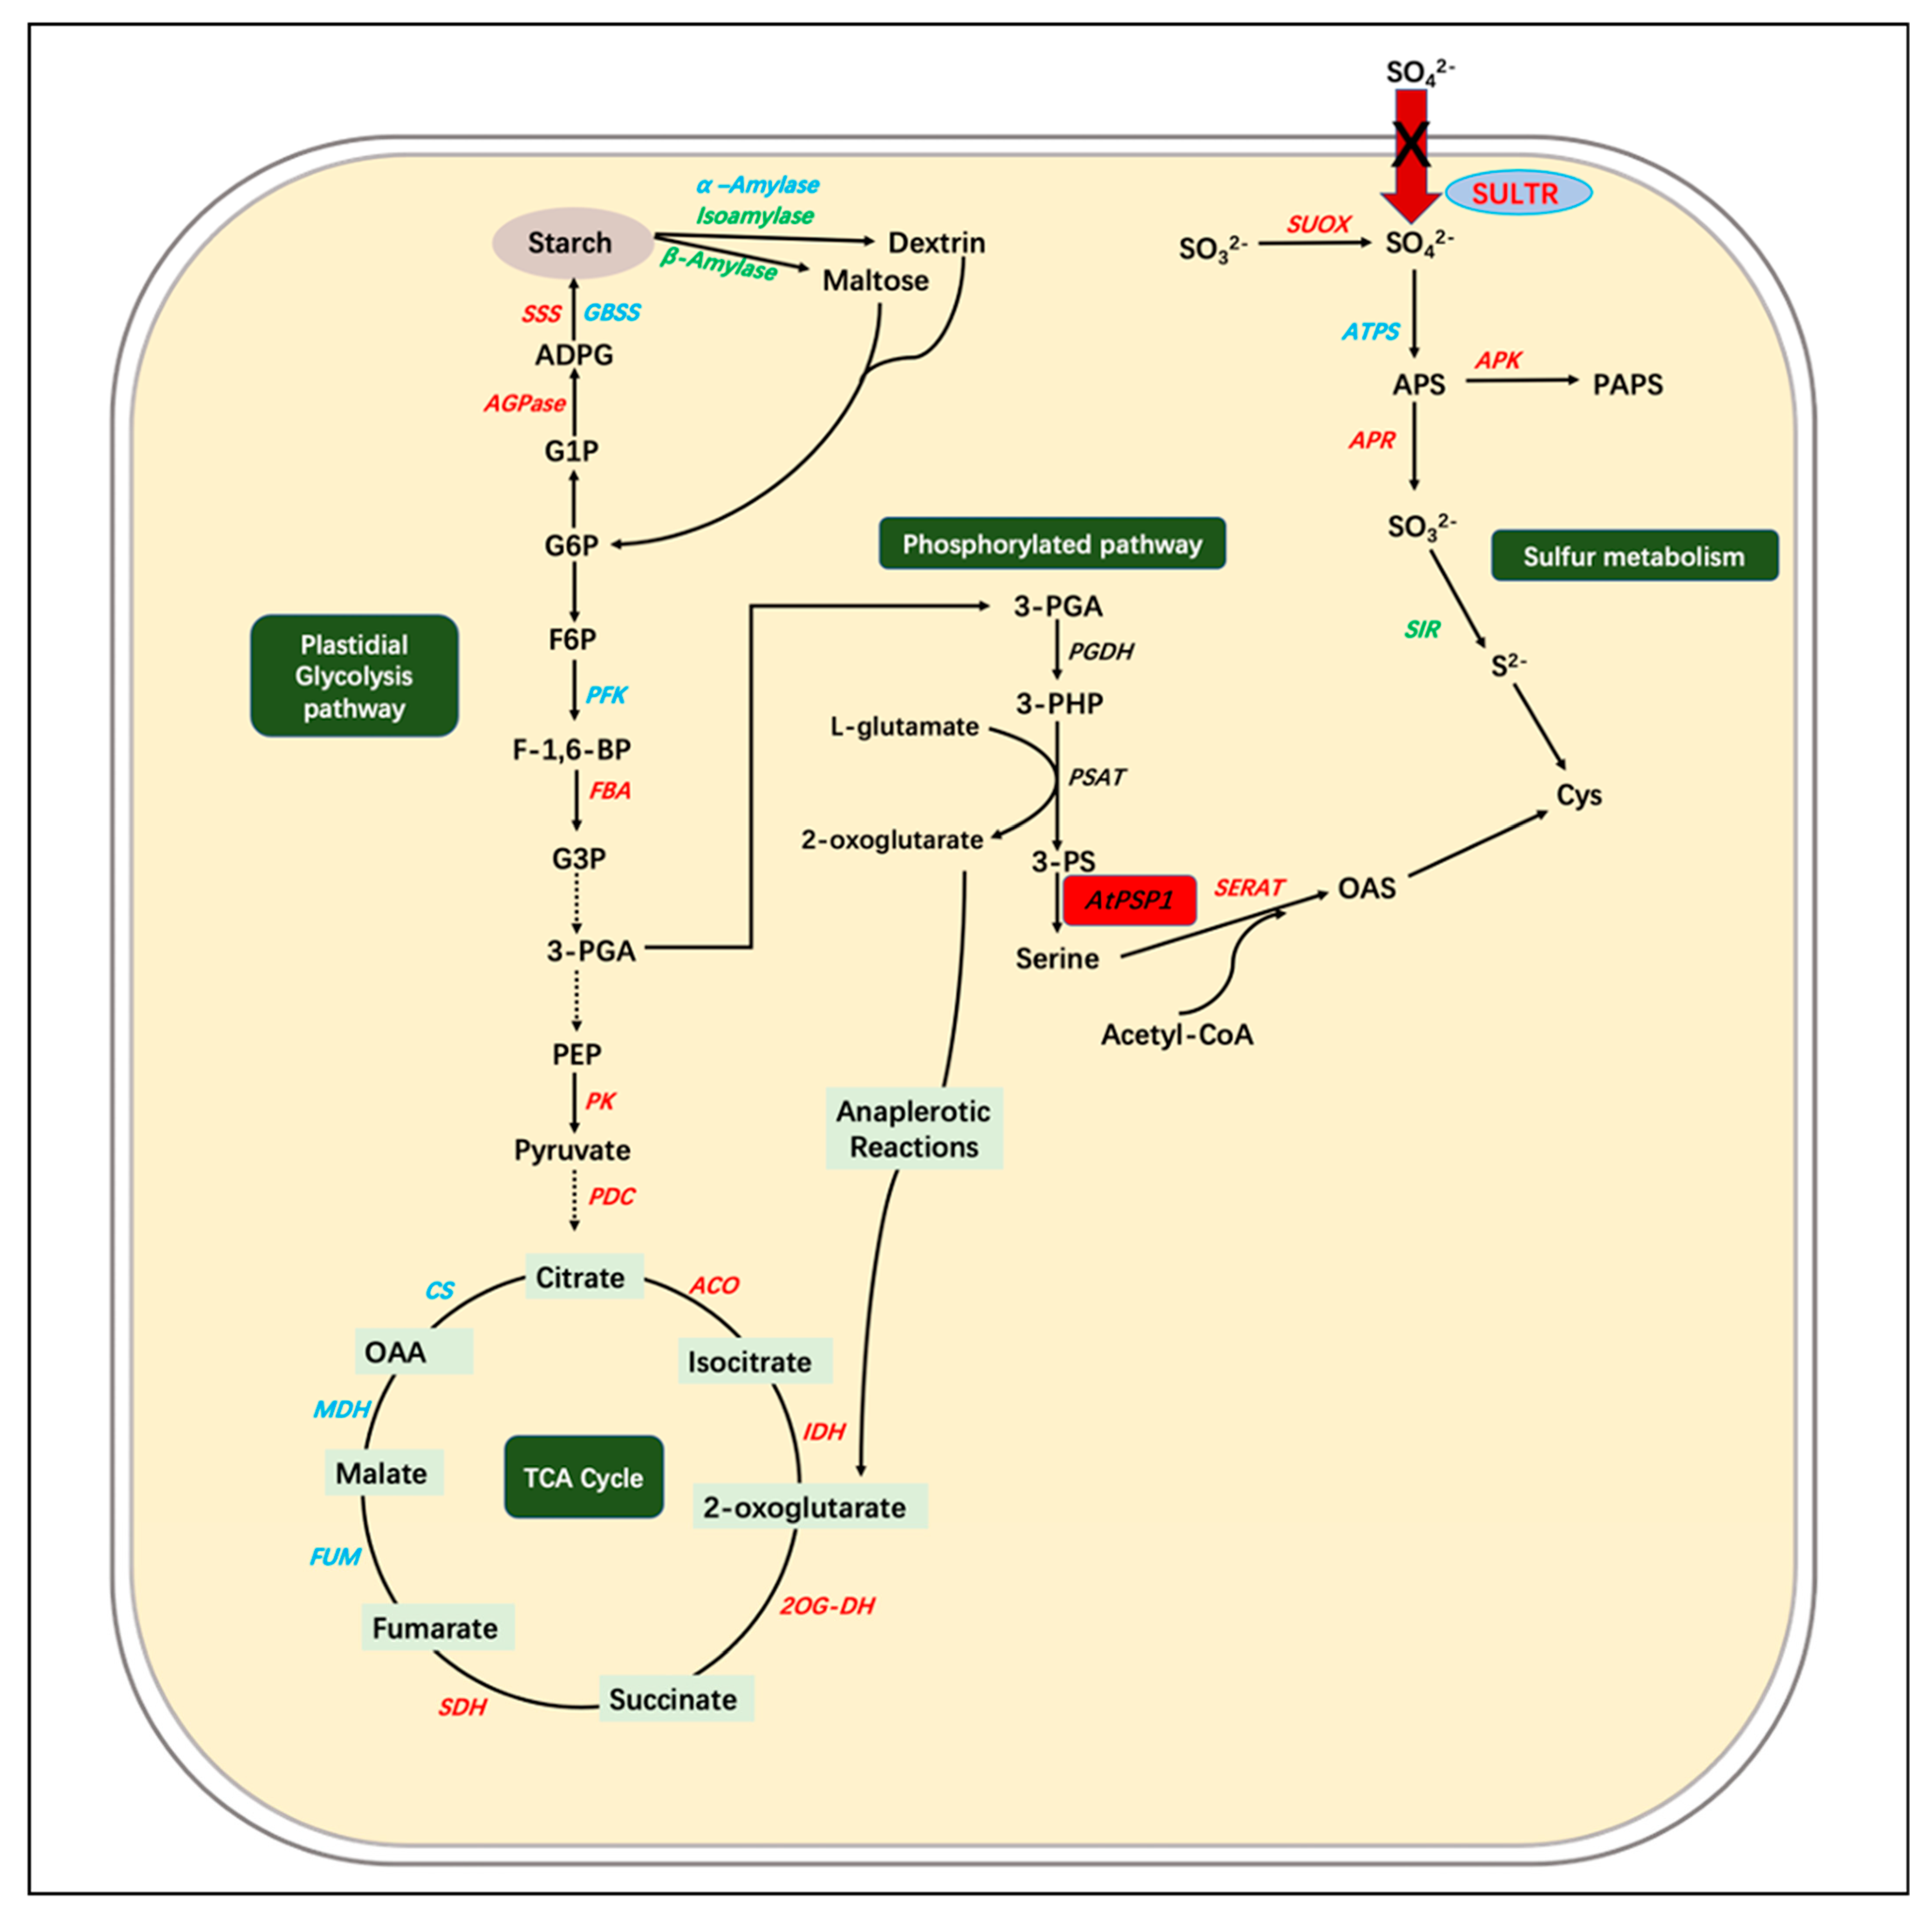
3.2. The Overexpression of AtPSP1 Coordinates Sulfur Assimilation, Starch Synthesis, and Carbon Metabolism under Sulfur Deficiency

How does the AtPSP1 transgenic plant prompt starch accumulation under sulfur-deficient conditions? The transcriptional analysis of the genes related to sulfur assimilation showed that the overexpression of AtPSP1 increased the expression of the genes involved in the process of sulfur assimilation, including the absorption, activation, and reduction of sulfur (Figure 5). The expression of four genes encoding the sulfate transporter, LtSULTR1, LtSULTR2, LtSULTR3, and LtSULTR4, was significantly upregulated. It has been reported that the plant could activate sulfate absorption from the rhizosphere by inducing the gene expression of high-affinity sulfate transporters (SULTR1) under sulfur limitations. Meanwhile, the plant could retrieve the sulfate stored in the vacuole by inducing the expression of SULTR4 and activate the translocation of sulfate from root to shoot by inducing the expression of SULTR2 and SULTR3 under sulfur limitation [31,35]. Our results indicated that the transgenic lines accelerated sulfate mobilization in duckweed to maintain the sulfur required for its growth. In addition to this, the increased expression of LtSUOX1 could probably enhance the oxidation of endogenous sulfite to sulfate in the transgenic lines; the upregulation of the LtAPR1 expression may increase the run-up of adenosine sulfate (APS) to sulfite; and the upregulation of LtAPK1 expression presumably prompted the run-up of APS to PAPS (adenosine-5′-phosphoryl sulfate 3′-phosphate). With serine serving as a precursor of Cys biosynthesis, the increased expression of LtSEART1 accelerated the conversion of serine to Cys (Figure 8). The expression mode of LtSULTR1 and LtSULTR4 is similar to the work on Spirodela polyrhiza under sulfur deficiency, as they were all upregulated [20], while the expression of the other genes involved in sulfur assimilation was between Spirodela polyrhiza and transgenic AtPSP1 lines. Methionine (Met) and cysteine (Cys), which all contain sulfur, serve as essential compounds for plant growth and reproduction [38]. Serine is a precursor substance for their synthesis, and the mutation of AtPSP1 was found to alter the sulfur metabolism in Arabidopsis [39]. This suggested that the overexpression of AtPSP1 may play an important role in the prompting of sulfur assimilation, which could accelerate endogenous sulfur utilization to maintain duckweed growth.
The synthesis of starch is dependent on the genes involved in the starch synthesis pathway and degradation pathway. The expression of genes related to the starch synthesis and degradation pathway was examined under sulfur-deficient conditions (Figure 6). It was found that the expression of LtAPS1, LtSSS1, and LtAPL1 was significantly higher in the starch synthesis pathway in the transgenic lines than in the WT, and the expression of LtISA1 and Ltβ-Amy1, involved in the starch degradation pathway, was significantly lower than that of the WT. The expression pattern of the above genes is similar to the patterns found in Lemna turionifera 5511 under nitrogen starvation, which suggested that the accumulation of starch was probably a result of the upregulation of starch-synthesis-related genes and the downregulation of starch-degradation-related genes [15]. The synthesis of starch in plants is associated with the breakdown of substances such as sugars. The total sugar content in the transgenic lines was significantly lower than that of the WT under sulfur-deficient conditions (Figure 4C). This demonstrated that the increase in starch content was partly due to the conversion of sugars to starch, as previously found in Lemna turionifera 5511 under nitrogen starvation [15].
Plant starch biosynthesis is closely linked to carbon metabolic pathways, and the previous findings suggest that the process of starch accumulation affects the glycolytic and TCA cycle pathways [13]. The expression of the analyzed genes was involved in the glycolytic and TCA cycle pathways under sulfur deficiency (Figure 7). The glucose 6-phosphate is the main substance linking starch synthesis and the glycolytic pathway because the synthesis of starch requires the consumption of more glucose 6-phosphate. The expression of glycolysis-related genes, LtFBA1, LtPK1, and LtPDC1, was found to be significantly upregulated, which would increase the activity of the glycolytic pathway in the transgenic lines to maintain the balance of carbon metabolism in plants, including the accumulation of starch and the increase in the dry matter. The TCA cycle is one of the core pathways in plants; this is a downstream pathway linked to glycolysis and is closely related to the biosynthesis of many amino acids. In this work, the transcriptional level of TCA-cycle-related genes (mainly LtACO1, LtIDH1, LtOG-DH1, and LtSDH1) were significantly increased in AtPSP1-transformed duckweed under sulfur-deficient conditions, as observed in Arabidopsis when cultivated under a variety of stresses [40,41]. The results demonstrated that the AtPSP1 overexpression prompted the link between the TCA cycle, carbon metabolism, and sulfur assimilation under sulfur-deficient conditions.

4. Materials and Methods

4.1. Duckweed Culture and Sulfur-Deficiency Treatment

Lemna turionifera 5511 was grown in a sterile Datko medium, according to Yang [42]. Duckweed was cultured under long-day conditions (16 h light/8 h dark cycle) at 22 ± 2 °C and 100 μmol photons m−2·s−1 light intensity. Initially, fresh duckweed was grown in the Datko medium for 7 days. Then, 9 plants were transferred to the sulfur-deficient Datko medium and fresh Datko medium in 100 mL conical flasks. Plants were cultivated under the same long-day conditions and temperature, and the horizontal light intensity of the plants was 100 μmol photons m−2·s−1.

4.2. Vector Construction and Acquisition of Transgenic Duckweed

The known sequence of AtPSP1 (the only gene encoding 3-phosphoserine phosphatase) was obtained from Arabidopsis cDNA using PCR. The pCAMBIA1301 plasmid containing the hygromycin resistance gene was inserted, the 5′ end was modified with the CaMV-35S promoter, and the 3′ end was the nopaline synthase gene terminator. The plant binary expression vector pCAMBIA1301:35S:AtPSP1 was constructed. The vector was transformed into the Agrobacterium tumefaciens strain EHA105 using the freeze–thaw method. The AtPSP1 transgenic duckweed was obtained using the method of the callus transformation system described by Yang et al. [43]. DNA was isolated using the SDS method described by Yang et al. [43]. RNA was isolated using an Eastep Super Total RNA Extraction Kit (Promega, Shanghai, China) and reverse transcription to cDNA using a PrimeScriptTMRT reagent Kit with gDNA Eraser (TaKaRa, Beijing, China). The DNA and cDNA for Lt18s and AtPSP1 were amplified using PCR and RT-PCR with specific primers (provided in Supplementary Materials Table S1) to identify the transgenic duckweed.

4.3. Measurement of the PSP Enzyme Activity

PSP activity was determined by measuring the phosphate release of 3-phosphoserine at 25 °C in 0.2 mL reaction mixture containing 80 mM Tris-HCl (pH 7.5), 10 mM 3-phosphoserine, 3 mM MgCl2, and 160 μL of extract start the reaction. After 30 min, 0.25 mL of 15% trichloroacetic acid was added to stop the reaction. The concentration of free phosphate was determined, and one enzyme unit catalyzed the conversion of 1 mmol of substrate/min under specified conditions [27].

4.4. Biomass and Relative Growth Rate Determination

Ten duckweed lines were cultured in a 100 mL conical flask with the culture solution, and those treated for different growing days were pumped to dryness and weighed at fresh weight immediately, and then dried to constant weight in a hot-air-circulating oven at 80 °C and weighed as dry weight of the flask-cultured materials.
Duckweed’s relative growth rate was calculated from the changes in fresh weight, and the 10 duckweed lines were weighed at the beginning growth day (d0 = 0 d) and at the end (dx = 3, 6, 9, and 12 d) of the experimental period. The relative growth rate (RGR) was calculated according to Su [44].
RGR = (lnNj − lnNi)/Δt
ln represents the natural logarithm, Nj and Ni represent the fresh weight at time j and time i, respectively, and Δt is the growth day instead of dx − d0.

4.5. Determination of Photosynthetic Pigments and Chlorophyll Fluorescence Parameters

A total of 0.1 g of duckweed material was treated for 9 days in 1 mL of 95% ethanol and placed in an incubator at 28 °C until the duckweed turned completely white. After taking 200 μL of extract, the OD values at 663 nm, 645 nm, and 440 nm were measured under a plate reader, and the content of photosynthetic pigments was calculated according to the Arnon method [45]. Chlorophyll fluorescence parameters were determined using Mini-PAM-II (WALZ, Effeltrith, Germany). The values of Fv/Fm, rETR, and Y(II) of photosystem II were measured using the WALZ protocol.

4.6. Starch, Total Sugar, and Soluble Protein Determination

A starch extraction and measurement kit was used to extract and measure starch content according to the manufacturer’s protocol (BC0700, Solarbio Biological and Technology Co., Ltd., Beijing, China). The total sugar was extracted and measured using a total sugar extraction and measurement kit according to the manufacturer’s protocol (BC2715, Solarbio Biological and Technology Co., Ltd., Beijing, China). The soluble protein content extraction was measured by using 30 mM Tris-HCl (pH 7.0) according to the manufacturer’s protocol (P0006C, Beyotime Biotechnology Co., Ltd., Shanghai, China).

4.7. DNA and RNA Extraction and qRT-PCR

RNA was isolated using an Eastep Super Total RNA Extraction Kit (Promega, Shanghai, China). After reverse transcription, cDNAs for Lt18s, AtPSP1, starch metabolism genes, sulfur metabolism genes, and carbon metabolism genes were amplified using qRT-PCR and the specific primers designed from the duckweed genome sequence obtained through RNA-Seq (in Supplementary File Table S1). qRT-PCR was performed on an iCycler thermal cycler (Bio-Rad iQ5, Hercules, CA, USA) using TB Green Premix Ex TaqII (code RR420A: TB Green Premix Ex Taq TM, Dalian Bao, Dalian, China) according to the manufacturer’s protocol. The reaction mixture was heated to 95 °C for 30 s, and then 40 PCR cycles were carried out, at 95 °C for 5 s, 58 °C for 30 s, and 72 °C for 30 s. After normalizing the data to Lt18s, differences in the relative expression levels of the detected genes were calculated using the 2−ΔΔCT method. All values are shown as the mean ± standard error of the mean using at least three biological replicates.

4.8. Data Analysis

All data were measured in at least three biological replicates, and the experiments were repeated at least three times independently. Data were organized using Excel, statistically analyzed using SPSS 22.0 (IBM, Chicago, IL, USA), analyzed for significance using one-way ANOVA (* p < 0.05 and ** p < 0.01), and graphed using GraphPad 9.2 software (GraphPad Software, San Diego, CA, USA).

5. Conclusions

Duckweed is a promising feedstock for bioenergy. We found that the overexpression of AtPSP1, the last key enzyme of PPSB, can increase the dry weight and starch accumulation in duckweed, accompanied by a higher photosynthetic capacity under sulfur-deficient conditions. The transcriptional analysis demonstrated that better growth and starch accumulation resulted from coordinating the expression of the key enzymes involved in sulfur assimilation, starch synthesis, and metabolism, as well as the glycolytic pathways and TCA cycle in AtPSP1-overexpressing lines under sulfur deficiency. This study provides a prospective pathway for starch accumulation through genetic engineering and sheds light on the potential mechanism of PPSB-promoting starch accumulation under sulfur-deficient conditions.

Supplementary Materials

The following supporting information can be downloaded at: https://www.mdpi.com/article/10.3390/plants12051012/s1, Figure S1. Phenotype of WT and three AtPSP1 transgenic lines. The photos were taken after WT and AtPSP1 transgenic lines were cultivated after full-nutrition condition (Datko) for 9 days; Figure S2. Analysis of phenotype, relative growth rate (RGR), fresh weight, and dry weight in WT and three AtPSP1 transgenic lines under Datko condition; Figure S3. Phenotype of WT and three AtPSP1 transgenic lines under sulfur-deficient conditions; Figure S4. The analysis of photosynthetic pigment and chlorophyll fluorescence parameters in duckweed under full-nutrition condition (Datko); Figure S5. The content of starch, yield, and soluble protein in WT and three AtPSP1 transgenic lines under full-nutrition condition in different treatment times; Table S1. The primer sequences in the study.

Author Contributions

L.W. performed most of the experiments and analyzed the data; Y.K., S.Z., Y.T., Y.Z. and Y.W. were involved in the experiments; Y.W. and Y.Z. designed the experiments; L.W. wrote the manuscript. All authors have read and agreed to the published version of the manuscript.

Funding

This work was supported by the Natural Science Foundation of China (NSFC, No. 31970365) and Tianjin Academy of Agricultural Sciences Youth Science and Technology Innovation General Project (No.2022006).

Institutional Review Board Statement

Not applicable.

Informed Consent Statement

Not applicable.

Data Availability Statement

Not applicable.

Acknowledgments

The authors would like to thank Xue-Qin Shi from Nankai University College of Life Science for providing technical support in Chlorophyll Fluorometer (Mini-PAM-II) acquisition.

Conflicts of Interest

The authors declare no conflict of interest.

References

  1. Les, D.H.; Crawford, D.J.; Landolt, E.; Gabel, J.D.; Rettig, J.H. Phylogeny and Systematics of Lemnaceae, the Duckweed Family. Syst. Bot. 2002, 27, 221–240. [Google Scholar] [CrossRef]
  2. Stomp, A.M. The duckweeds: A valuable plant for biomanufacturing. Biotechnol. Annu. Rev. 2005, 11, 69–99. [Google Scholar] [CrossRef]
  3. Bog, M.; Appenroth, K.J.; Sree, K.S. Key to the determination of taxa of Lemnaceae: An update. Nord. J. Bot. 2020, 38. [Google Scholar] [CrossRef]
  4. Chen, G.; Zhao, K.; Li, W.; Yan, B.; Yu, Y.; Li, J.; Zhang, Y.; Xia, S.; Cheng, Z.; Lin, F.; et al. A review on bioenergy production from duckweed. Biomass Bioenergy 2022, 161, 1064–1068. [Google Scholar] [CrossRef]
  5. Cui, W.; Cheng, J.J.; Appenroth, K. Growing duckweed for biofuel production: A review. Plant Biol. 2015, 17, 16–23. [Google Scholar] [CrossRef]
  6. Zhu, Y.; Li, X.; Gao, X.; Sun, J.; Ji, X.; Feng, G.; Shen, G.; Xiang, B.; Wang, Y. Molecular mechanism underlying the effect of maleic hydrazide treatment on starch accumulation in S. polyrrhiza 7498 fronds. Biotechnol. Biofuels 2021, 14, 99. [Google Scholar] [CrossRef]
  7. Wang, X.; Cui, W.; Hu, W.; Feng, C. Abscisic acid-enhanced starch accumulation of bioenergy crop duckweed (Spirodela polyrrhiza). RSC Adv. 2020, 10, 10394–10401. [Google Scholar] [CrossRef] [Green Version]
  8. Faizal, A.; Putra, R. Uniconazole increases starch content in duckweed (Lemna aequinoctialis Welw). 3bio J. Biol. Sci. Technol. Manag. 2019, 1, 1. [Google Scholar] [CrossRef]
  9. Kurepa, J.; Shull, T.E.; Smalle, J.A. Cytokinin-induced growth in the duckweeds Lemna gibba and Spirodela polyrhiza. Plant Growth Regul. 2018, 86, 477–486. [Google Scholar] [CrossRef]
  10. de Morais, M.B.; Barbosa-Neto, A.G.; Willadino, L.; Ulisses, C.; Calsa Junior, T. Salt Stress Induces Increase in Starch Accumulation in Duckweed (Lemna aequinoctialis, Lemnaceae): Biochemical and Physiological Aspects. J. Plant Growth Regul. 2019, 38, 683–700. [Google Scholar] [CrossRef]
  11. Chen, D.; Zhang, H.; Wang, Q.; Shao, M.; Li, X.; Chen, D.; Zeng, R.; Song, Y. Intraspecific variations in cadmium tolerance and phytoaccumulation in giant duckweed (Spirodela polyrhiza). J. Hazard. Mater. 2020, 395, 122672. [Google Scholar] [CrossRef]
  12. Shao, J.; Liu, Z.; Ding, Y.; Wang, J.; Li, X.; Yang, Y. Biosynthesis of the starch is improved by the supplement of nickel (Ni2+) in duckweed (Landoltia punctata). J. Plant Res. 2020, 133, 587–596. [Google Scholar] [CrossRef]
  13. Yu, C.; Xiaowen, Z.; Qi, G.; Bai, Z.; Wang, Y.; Wang, S.; Ma, Y.; Liu, Q.; Hu, R.; Zhou, G. Integrated analysis of transcriptome and metabolites reveals an essential role of metabolic flux in starch accumulation under nitrogen starvation in duckweed. Biotechnol. Biofuels 2017, 10, 167. [Google Scholar] [CrossRef] [Green Version]
  14. Guo, L.; Jin, Y.; Xiao, Y.; Tan, L.; Xueping, T.; Ding, Y.; He, K.-Z.; Du, A.; Li, J.; Yi, Z.; et al. Energy-efficient and environmentally friendly production of starch-rich duckweed biomass using nitrogen-limited cultivation. J. Clean. Prod. 2019, 251, 119726. [Google Scholar] [CrossRef]
  15. Wang, L.; Li, S.; Sun, L.; Tong, Y.; Yang, L.; Zhu, Y.; Wang, Y. Over-Expression of Phosphoserine Aminotransferase-Encoding Gene (AtPSAT1) Prompts Starch Accumulation in L. turionifera under Nitrogen Starvation. Int. J. Mol. Sci. 2022, 23, 11563. [Google Scholar] [CrossRef]
  16. Huang, M.; Fang, Y.; Liu, Y.; Jin, Y.; Sun, J.; Tao, X.; Ma, X.; He, K.; Zhao, H. Using proteomic analysis to investigate uniconazole-induced phytohormone variation and starch accumulation in duckweed (Landoltia punctata). BMC Biotechnol. 2015, 15, 81. [Google Scholar] [CrossRef] [Green Version]
  17. Sree, K.S.; Adelmann, K.; Garcia, C.; Lam, E.; Appenroth, K.-J. Natural variance in salt tolerance and induction of starch accumulation in duckweeds. Planta 2015, 241, 1395–1404. [Google Scholar] [CrossRef]
  18. Wang, W.; Messing, J. Analysis of ADP-glucose pyrophosphorylase expression during turion formation induced by abscisic acid in Spirodela polyrhiza (greater duckweed). BMC Plant Biol. 2012, 12, 5. [Google Scholar] [CrossRef] [Green Version]
  19. Guo, L.; Ding, Y.; Xu, Y.; Li, Z.; Jin, Y.; He, K.; Fang, Y.; Zhao, H. Responses of Landoltia punctata to cobalt and nickel: Removal, growth, photosynthesis, antioxidant system and starch metabolism. Aquat. Toxicol. 2017, 190, 87–93. [Google Scholar] [CrossRef]
  20. Sun, Z.; Guo, W.; Zhao, X.; Chen, Y.; Yang, J.; Xu, S.; Hou, H. Sulfur limitation boosts more starch accumulation than nitrogen or phosphorus limitation in duckweed (Spirodela polyrhiza). Ind. Crops Prod. 2022, 185, 115098. [Google Scholar] [CrossRef]
  21. Bauwe, H.; Hagemann, M.; Fernie, A. Photorespiration: Players, partners and origin. Trends Plant Sci. 2010, 15, 330–336. [Google Scholar] [CrossRef]
  22. Douce, R.; Bourguignon, J.; Neuburger, M.; Rébeillé, F. The glycine decarboxylase system: A fascinating complex. Trends Plant Sci. 2001, 6, 167–176. [Google Scholar] [CrossRef]
  23. Kleczkowski, L.; Givan, C. Serine Formation in Leaves by Mechanisms other than the Glycolate Pathway. J. Plant Physiol. 1988, 132, 641–652. [Google Scholar] [CrossRef]
  24. Ros, R.; Muñoz-Bertomeu, J.; Krueger, S. Serine in plants: Biosynthesis, metabolism, and functions. Trends Plant Sci. 2014, 19, 564–569. [Google Scholar] [CrossRef]
  25. Benstein, R.; Ludewig, K.; Wulfert, S.; Wittek, S.; Gigolashvili, T.; Frerigmann, H.; Gierth, M.; Flügge, U.-I.; Krueger, S. Arabidopsis Phosphoglycerate Dehydrogenase1 of the Phosphoserine Pathway Is Essential for Development and Required for Ammonium Assimilation and Tryptophan Biosynthesis. Plant Cell 2013, 25, 5011–5029. [Google Scholar] [CrossRef] [Green Version]
  26. Flores-Tornero, M.; Anoman, A.; Rosa Téllez, S.; Ros, R. Lack of phosphoserine phosphatase activity alters pollen and tapetum development in Arabidopsis thaliana. Plant Sci. 2015, 235, 81–88. [Google Scholar] [CrossRef]
  27. Han, X.; Peng, K.; Wu, H.; Song, S.; Zhu, Y.; Bai, Y.; Wang, Y. Overexpression of PSP1 enhances growth of transgenic Arabidopsis plants under ambient air conditions. Plant Mol. Biol. 2017, 94, 419–431. [Google Scholar] [CrossRef]
  28. Ros, R.; Cascales-Miñana, B.; Segura, J.; Anoman, A.; Toujani, W.; Flores-Tornero, M.; Rosa Téllez, S.; Muñoz-Bertomeu, J. Serine biosynthesis by photorespiratory and non-photorespiratory pathways: An interesting interplay with unknown regulatory networks. Plant Biol. 2012, 15, 707–712. [Google Scholar] [CrossRef]
  29. Takahashi, H.; Kopriva, S.; Giordano, M.; Saito, K.; Hell, R. Sulfur Assimilation in Photosynthetic Organisms: Molecular Functions and Regulations of Transporters and Assimilatory Enzymes. Annu. Rev. Plant Biol. 2010, 62, 157–184. [Google Scholar] [CrossRef]
  30. Rennenberg, H.; Herschbach, P.D.C. A detailed view on sulphur metabolism at the cellular and whole-plant level illustrates challenges in metabolite flux analyses. J. Exp. Bot. 2014, 65, 5711–5724. [Google Scholar] [CrossRef] [Green Version]
  31. Kopriva, S.; Rennenberg, H. Control of sulphate assimilation and glutathione synthesis: Interaction with N and C metabolism. J. Exp. Bot. 2004, 55, 1831–1842. [Google Scholar] [CrossRef]
  32. Smith, A.M.; Zeeman, S.C. Starch: A Flexible, Adaptable Carbon Store Coupled to Plant Growth. Annu. Rev. Plant Biol. 2020, 71, 217–245. [Google Scholar] [CrossRef] [Green Version]
  33. Streb, S.; Zeeman, S. Starch Metabolism in Arabidopsis. Arab. Book Am. Soc. Plant Biol. 2012, 10, e0160. [Google Scholar] [CrossRef] [Green Version]
  34. Smith, A.M. Starch in the Arabidopsis plant. Starch—Stärke 2012, 64, 421–434. [Google Scholar] [CrossRef]
  35. Sun, Z.; Guo, W.; Zhao, X.; Yang, J.; Duan, P.; Xu, S.; Hou, H. Sulfur limitation increases duckweed starch accumulation without compromising growth. bioRxiv 2021, 185, 115098. [Google Scholar] [CrossRef]
  36. Tao, X.; Fang, Y.; Xiao, Y.; Jin, Y.-L.; Ma, X.-R.; Zhao, Y.; He, K.-Z.; Zhao, H.; Wang, H.-Y. Comparative transcriptome analysis to investigate the high starch accumulation of duckweed (Landoltia punctata) under nutrient starvation. Biotechnol. Biofuels 2013, 6, 72. [Google Scholar] [CrossRef] [Green Version]
  37. Liu, Y.; Wang, X.; Fang, Y.; Huang, M.; Chen, X.; Zhang, Y.; Zhao, H. The effects of photoperiod and nutrition on duckweed (Landoltia punctata) growth and starch accumulation. Ind. Crops Prod. 2018, 115, 243–249. [Google Scholar] [CrossRef]
  38. Maruyama-Nakashita, A. Metabolic changes sustain the plant life in low-sulfur environments. Curr. Opin. Plant Biol. 2017, 39, 144–151. [Google Scholar] [CrossRef]
  39. Samuilov, S.; Rademacher, N.; Brilhaus, D.; Kurz, S.; Arab, L.; Kopriva, S.; Weber, A.; Mettler-Altmann, T.; Rennenberg, H. Knock-Down of the Phosphoserine Phosphatase Gene Effects Rather N- Than S-Metabolism in Arabidopsis thaliana. Front. Plant Sci. 2018, 9, 1830. [Google Scholar] [CrossRef]
  40. Niehaus, T.D. Phosphatases are involved in modulating the TCA cycle in plants. Mol. Plant 2021, 14, 1036–1037. [Google Scholar] [CrossRef]
  41. Lehmann, M.; Schwarzländer, M.; Obata, T.; Sirikantaramas, S.; Burow, M.; Olsen, C.E.; Tohge, T.; Fricker, M.D.; Møller, B.L.; Fernie, A.R.; et al. The Metabolic Response of Arabidopsis Roots to Oxidative Stress is Distinct from that of Heterotrophic Cells in Culture and Highlights a Complex Relationship between the Levels of Transcripts, Metabolites, and Flux. Mol. Plant 2009, 2, 390–406. [Google Scholar] [CrossRef] [Green Version]
  42. Yang, L.; Han, Y.; Wu, D.; Yong, W.; Liu, M.; Wang, S.; Liu, W.; Lu, M.; Wei, Y.; Sun, J. Salt and cadmium stress tolerance caused by overexpression of the Glycine Max Na+/H+ Antiporter (GmNHX1) gene in duckweed (Lemna turionifera 5511). Aquat. Toxicol. 2017, 192, 127–135. [Google Scholar] [CrossRef]
  43. Yang, L.; Han, H.; Liu, M.; Zuo, Z.; Zhou, K.; Lü, J.; Zhu, Y.; Bai, Y.; Wang, Y. Overexpression of the Arabidopsis photorespiratory pathway gene, serine: Glyoxylate aminotransferase (AtAGT1), leads to salt stress tolerance in transgenic duckweed (Lemna minor). Plant Cell Tissue Organ Cult. (PCTOC) 2013, 113, 407–416. [Google Scholar] [CrossRef]
  44. Su, C.; Jiang, Y.; Yang, Y.; Zhang, W.; Xu, Q. Responses of duckweed (Lemna minor L.) to aluminum stress: Physiological and proteomics analyses. Ecotoxicol. Environ. Saf. 2019, 170, 127–140. [Google Scholar] [CrossRef]
  45. Arnon, D.I. Copper Enzymes in Isolated Chloroplasts. Polyphenoloxidase in Beta Vulgaris. Plant Physiol. 1949, 24, 1–15. [Google Scholar] [CrossRef] [Green Version]
Figure 1. Construction of pCAMBIA1301-AtPSP1 vector and identified the AtPSP1 overexpressors lines: (A) T-DNA constructs designed for the overexpression of AtPSP1. LB, left border; HPT, encoding hygromycin-resistant gene; T35S and P35S, terminator and promoter of CaMV35S, respectively; Tnos, terminator of NOS; RB, right border; (B) DNA-PCR identification of AtPSP1 transformation, AtPSP1 CDs was 888bp; (C) semi-quantitative RT-PCR analysis of AtPSP1 transcripts with 18S as reference gene; 18S is 18S ribosomal RNA of Lemna turionifera 5511; (D) real-time quantitative PCR analysis of AtPSP1 transcript with 18S as reference gene; (E) analysis of PSP enzyme activity. “M”, DL15000 DNA ladder; “−”, water as the PCR temple of negative control; “+”, plastid as PCR temple of positive control; WT, wild-type; PSP-1, PSP-2, and PSP-3, the three different AtPSP1 overexpressing lines. Values given in (D,E) are the means ± standard error of 3 independent experiments with 3 repeats. The double asterisks (**) indicate significant differences (p < 0.01) from controls based on one-way ANOVA.
Plants 12 01012 g001
Figure 2. Analysis of phenotype, relative growth rate, fresh weight, and dry weight under sulfur-deficient conditions: (A) phenotypes of WT and three AtPSP1 overexpressors; photos were taken after WT and AtPSP1 transgenic plants were cultivated under sulfur-deficient conditions for 9 days; (B) analysis of relative growth rate (RGR); (C) comparison of fresh weight between WT and three AtPSP1 overexpressors; (D) comparison of dry weight between WT and three AtPSP1 overexpressors. The samples were harvested to analyze the growth rate, fresh weight, and dry weight after WT and AtPSP1 transgenic plants were cultivated under sulfur-deficient conditions for 3, 6, 9, and 12 days, respectively. Each statistic is the mean ± standard error (n = 9, from 3 independent experiments with 3 repeats of each). The double asterisk symbol (**) indicates that the difference (p < 0.01), compared with the control, was significant, based on one-way ANOVA.
Plants 12 01012 g002
Figure 3. Analysis of photosynthetic pigment and chlorophyll fluorescence parameters in AtPSP1-transformed duckweed lines under sulfur-deficient cultivation: (A) chlorophyll a content; (B) chlorophyll b content; (C) total chlorophyll content; (D) carotenoid content. The photosynthetic pigment contents were measured after the samples were cultivated under sulfur deficiency for 9 days. (E), Fv/Fm; (F) rETR; (G) Y(II). Chlorophyll fluorescence parameters were measured after the samples were cultivated under sulfur deficiency for 6 days. Each statistic is the mean ± standard error (n = 9, from 3 independent experiments with 3 repeats of each, no average values in (F,G)). The asterisk symbol (*) represents statistically significant differences (p < 0.05); the double asterisk symbol (**) indicates that the difference (p < 0.01), compared with the control, was significant, based on one-way ANOVA.
Plants 12 01012 g003
Figure 4. Effect on starch, total sugars, and soluble protein content of AtPSP1-transformed duckweed lines under sulfur deficiency, cultured for 9 days: (A) the starch content per gram dry weight; (B) the starch yield; (C) total sugar content; (D) soluble protein content. Each statistic is the mean ± standard error (n = 9, from 3 independent experiments with 3 repeats of each). The asterisk symbol (*) represents statistically significant differences (p < 0.05); the double asterisk symbol (**) indicates that the difference (p < 0.01), compared with the control, was significant based on one-way ANOVA.
Plants 12 01012 g004
Figure 5. Effect on the expression of sulfur-assimilation-related genes in AtPSP1-transformed duckweed lines under sulfur-deficient conditions for 6 days. The relative expression level of the WT was normalized to 1. Each statistic is the mean ± standard error (n = 9, from 3 independent experiments with 3 repeats of each). The asterisk symbol (*) represents statistically significant differences (p < 0.05); the double asterisk symbol (**) indicates that the difference (p < 0.01), compared with the control, was significant, based on one-way ANOVA.
Plants 12 01012 g005
Figure 6. Effect on the expression of starch metabolism-related genes in AtPSP1-transformed duckweed lines under sulfur deficiency, cultured for 6 days. The relative expression level of the WT was normalized to 1. Each statistic is the mean ± standard error (n = 9, from three independent experiments with three repeats of each). The asterisk symbol (*) represents statistically significant differences (p < 0.05); the double asterisk symbol (**) indicates that the difference (p < 0.01), compared with the control, was significant based on one-way ANOVA.
Plants 12 01012 g006
Figure 7. Effect on the expression of carbon metabolism-related genes in AtPSP1-transformed duckweed lines under sulfur deficiency, cultured for 6 days. The relative expression level of the WT was normalized to 1. Each statistic is the mean ± standard error (n = 9, from 3 independent experiments with 3 repeats of each). The asterisk symbol (*) represents statistically significant differences (p < 0.05); the double asterisk symbol (**) indicates that the difference (p < 0.01), compared with the control, was significant based on one-way ANOVA.
Plants 12 01012 g007
Figure 8. Expression pattern of genes involved in serine phosphorylated synthesis pathway, carbon metabolism, starch metabolism, and sulfur assimilation under sulfur deficiency in transgenic duckweed. The arrows indicate the directions of catalytic reactions or transportations. Red indicates upregulated expression, green indicates downregulated expression, and blue indicates no significant change. Dotted black arrows indicate omitted steps. AGPase, ADP−glucose pyrophosphorylase; ADPG, adenosine-5−diphosphoglucose; GBSS, granule−bound starch synthase; SSS, soluble starch synthase; G1P, glucose 1−phosphate; G6P, glucose 6−phosphate; F−1,6−BP, fructose1,6−bisphosphatase; F6P, fructose 6−phosphate; PFK, phosphofructokinase; FBA, fructose−bisphosphate aldolase; G3P, glyceraldehyde 3−phosphate; 3−PGA, 3−phosphate glycerate; PEP, phosphoenolpyruvate; PK, pyruvate kinase; PDC, pyruvate dehydrogenase complex; OAA, oxaloacetate; 2OG−DH, 2−OG dehydrogenase; ACO, aconitase; CS, citrate synthase; FUM, fumarase; IDH, isocitrate dehydrogenase; MDH, malate dehydrogenase; SDH, succinate dehydrogenase; TCA, tricarboxylic acid; 3−PHP, 3−phosphohydroxypyruvate; 3−PS, 3−phosphoserine; PGDH, 3−phosphoglycerate dehydrogenase; PSAT, 3−phosphoserine aminotransferase; AtPSP1, the gene encoding the Arabidopsis 3−phosphoserine phosphatase (PSP); APK, APS kinase; ATPS, ATP sulfurylase; SIR, sulfite reductase; SULTR, sulfate transporter; SUOX, sulfite oxidase; APR, adenylyl−sulfate reductase; SERAT, serine acetyltransferase; OAS, O−acetyl Ser; Cys, Cysteine.
Plants 12 01012 g008
Disclaimer/Publisher’s Note: The statements, opinions and data contained in all publications are solely those of the individual author(s) and contributor(s) and not of MDPI and/or the editor(s). MDPI and/or the editor(s) disclaim responsibility for any injury to people or property resulting from any ideas, methods, instructions or products referred to in the content.

