Article

Biochar with Inorganic Nitrogen Fertilizer Reduces Direct Greenhouse Gas Emission Flux from Soil

1
Institute of Agriculture, Lithuanian Research Centre for Agriculture and Forestry, Instituto al. 1, Akademija, LT-58344 Kėdainiai, Lithuania
2
Institute of Environmental Protection, Vilnius Gediminas Technical University, LT-10223 Vilnius, Lithuania
*
Author to whom correspondence should be addressed.
Plants 2023, 12(5), 1002; https://doi.org/10.3390/plants12051002
Submission received: 9 February 2023 / Revised: 20 February 2023 / Accepted: 21 February 2023 / Published: 22 February 2023

Abstract

:
Agricultural waste can have a catastrophic impact on climate change, as it contributes significantly to greenhouse gas (GHG) emissions if not managed sustainably. Swine-digestate-manure-derived biochar may be one sustainable way to manage waste and tackle GHG emissions in temperate climatic conditions. The purpose of this study was to ascertain how such biochar could be used to reduce soil GHG emissions. Spring barley (Hordeum vulgare L.) and pea crops in 2020 and 2021, respectively, were treated with 25 t ha−1 of swine-digestate-manure-derived biochar (B1) and 120 kg ha−1 (N1) and 160 kg ha−1 (N2) of synthetic nitrogen fertilizer (ammonium nitrate). Biochar with or without nitrogen fertilizer substantially lowered GHG emissions compared to the control treatment (without any treatment) or treatments without biochar application. Carbon dioxide (CO2), nitrous oxide (N2O), and methane (CH4) emissions were directly measured using static chamber technology. Cumulative emissions and global warming potential (GWP) followed the same trend and were significantly lowered in biochar-treated soils. The influences of soil and environmental parameters on GHG emissions were, therefore, investigated. A positive correlation was found between both moisture and temperature and GHG emissions. Thus, biochar made from swine digestate manure may be an effective organic amendment to reduce GHG emissions and address climate change challenges.

1. Introduction

In recent decades, the increase in human population has caused serious challenges to the agriculture sector and to the agronomist in ensuring food security, causing minimum soil and environmental pollution [1]. Inorganic nitrogen fertilizer consumption in the agricultural sector of the European Union has increased by around 2% over the past ten years to 10.2 million tons [2]. This considerable share of synthesized fertilizer application is due to inefficient use, which causes financial harm, environmental damage, and health risks [3,4,5]. Inorganic fertilizer amendment and soil tillage practices have increased greenhouse gas (GHG) emissions [6,7,8]. By 2030, it is anticipated that the agricultural sector’s nitric oxide (N2O) emissions may rise by 35–60%. This increase is linked to higher nitrogen content due to fertilizer use and higher production of animal waste [9,10]. Moreover, the increase in the number of livestock is directly proportional to methane (CH4) emissions that, between 1990 and 2030, are anticipated to increase by 60% [11]. The predicted rise in agrofarming emissions is 8–8.4%, with a mean increase of 8.3 Pg CO2-eq by 2030, assuming the aforesaid rates of rising emissions (10–15%) for the 2020–2030 period. Anthropogenic emissions of GHGs (CO2, CH4, and N2O), have become a substantial contributor to global climate change [12,13]. GHG emissions are highly dependent on soil temperature and moisture, which are instantaneously affected by biochar application [14,15,16]. The use of biochar is a farming method that improves soil temperature and moisture retention. There are two ways to best manage increase in soil moisture: (1) to increase the amount of organic matter in the soil (because the stability and porosity of aggregates are improved by the direct addition of biochar [17,18]) and (2) to increase physical barriers on the surface, which reduces soil surface runoff and evaporation [19]. Thus, soil moisture and temperature improvements appear to balance the emission of GHGs. Biochar application enhances soil organic carbon and, consequently, results in carbon sequestration [20,21]. Biochar amendment boosts crop productivity and reduces the overuse of synthetic chemical fertilizers while simultaneously increasing soil organic carbon (SOC) stock, moisture retention, and temperature [22,23,24]. By reducing the usage of synthetic fertilizers, this strategy can enhance both environmental and human health [25,26].
One of the main economic drivers is agriculture, and according to EEA Report No. 17, the sector’s overall GHG emissions, which amount a 4.4 Mt CO2 equivalent, are slightly lower than those of the transportation sector [27]. According to the long-term commitment EU panel, which was initiated in 2014 by Fertilizers Europe, the EU mineral fertilizer industry promotes fertilizer use efficiency to improve agricultural production and a sustainable environment (EU Nitrogen Expert Panel). Moreover, the addition of biochar improves the efficiency of the bacteria involved in carbon and nitrogen metabolism, considerably enhancing CO2, CH4, and N2O outputs [28,29]. However, using biochar in conjunction with inorganic nitrogen fertilizer lowers GHG emissions without reducing crop output [30,31]. The impact of adding swine-digestate-derived biochar as an organic amendment with nitrogen fertilizer on GHG emissions from the soil in spring barley and pea cropping systems in the EU has not yet been reported. The use of biochar made from swine digestate is, therefore, hypothesized to minimize GHG emissions, either with or without using 70% of the recommended dose of synthetic nitrogen fertilizer. Therefore, two-year experiments on the mitigation of GHGs coupled with reduced synthetic nitrogen fertilizer are carried out at the research fields of the Lithuanian Research Center for Agriculture and Forestry, Lithuania. This study’s primary goals are to decrease the excessive use of inorganic synthetic nitrogen fertilizer, improve environmental quality by lowering GHG emissions, and evaluate the usage of biochar made from swine digestate as a potential substitute source of fertilizer.

2. Materials and Methods

2.1. Experimental Site

The experimental study was conducted during the growing seasons of 2020 and 2021 at the fields of the Lithuania Research Center for Agriculture and Forestry (55°40′ N, 23°87′ E). The chemical compositions at depths of 0–10, 0–20, and 0–60 cm for the Endocalcari-Epihypogleyic Cambisol soil used in the experimental fields is shown in Table 1. Biochar was prepared from swine manure digestate at 550 °C. Both biochar and N fertilizer were applied to the soil one week prior to sowing of the crop and were manually applied to each plot (1.5 m2). The experiment was carried out using the spring barley (Hordeum vulgare L.) “Luoke cultivar” and the pea (Pisum sativum) “Respect cultivar” in 2020 and 2021, respectively. The period of growth was from April to August 2020 for spring barley and from April to July 2021 for the pea crop. Data were recorded at each growth stage from seedling until maturity. Lithuanian Hydrometeorological Service-Dotnuva data under the Ministry of Environment data were used (http://www.meteo.lt/, accessed on 12 January 2020) (Figure 1). The chemical changes over two years in the fields studied are given in Table 1.

2.2. Soil Physicochemical Properties

Laboratory-based, standardized techniques were used to examine the physicochemical characteristics of both the soil and the biochar. A 1:5 (vol:vol−1) soil combination in 1 M KCl solution was used for the electrical conductivity and pH analysis of the soil and biochar [32,33], as well as an extract in distilled water [34]. Soil and biochar organic matter contents were measured using a spectrophotometer at a wave length of 590 nm [35]. A revised ammonium-acetate technique was used to measure cation exchange capacity [36]. Inductively coupled plasma atomic emission spectrometry (Perkin Elmer ICP-OES, Waltham, MA, USA) was used to assess the extractable Mg from DTPA [37]. Using a reference approach, total nitrogen (TN) and accessible phosphorus concentrations were determined [38]. A TGA provided information on biochar ash content, moisture, volatiles, and residual mass.

2.3. Experimental Design

The field study used a three-factorial randomized full-block design with six treatments and three replications. No biochar plus no nitrogen fertilizer (control), no biochar plus 160 kg ha−1 nitrogen fertilizer (N1), no biochar plus 120 kg ha−1 nitrogen fertilizer (N2), 25 t ha−1 biochar plus 160 kg ha−1 nitrogen fertilizer (N1B), 25 t ha−1 biochar plus 120 kg ha−1 nitrogen fertilizer (N2B), and 25 t ha−1 biochar plus no nitrogen fertilizer (N2B) were the experimental treatments (B).

2.4. Gas Sampling and Flux Calculation

Gas chromatography was used to measure the gas flux, and a static chamber gas [13,39] method was modified only slightly for the analysis. A U-shaped groove (50 mm wide and 50 mm deep) was present on the top edge of the chamber base box (frame) to retain a detachable chamber box. Stainless-steel frames were permanently buried 10 cm beneath the surface of the soil. A frame’s perimeter covered 0.36 m2. The chamber was sealed for 3 min before each flux measurement, and 20 mL of gas sample was drawn using a 20 cm3 syringe. To increase the consistency of gaseous flux estimates, the gas samples were collected between the hours of 9:00 and 10:00 in the morning. Glass vials with rubber tubing used as a lid were used to collect the gas samples. From the beginning of the cultivating season (one week before the application of biochar) to one month after harvest, the fluxes of CO2, N2O, and CH4 were measured at 2-week intervals. Three replicates of each treatment were used; thus, gas samples were collected from each plot. The samples were examined using a gas chromatograph (HP 6890 Series, GC System, Hewlett-Packard, Analytical system Management, Denver, USA) that had nickel catalysts for converting CO2 to CH4 and flame ionization and electron capture detectors. The corresponding temperatures were 70, 300, and 350 °C, respectively. The techniques for gas chromatography were explained by [40]. Equations (1) and (2) were used, respectively, to compute the cumulative and GHG flow rates and global warming potential for the growing seasons of 2020 and 2021 (from April to August). Based on the rate of change in GHG concentration within the chamber, which was determined as the slope of the linear regression between the GHG concentration and the gas-sampling time, the flow rate of each GHG was derived.
R a = [ R i + R i + 1 2 ] × n  
GWP   = ( CO 2 1 ) + ( N 2 O   298 ) + ( CH 4 25 )

2.5. Calculation of Cumulative Soil GHG Emissions

Between various growth stages, cumulative CO2, CH4, and N2O emissions for each treatment were estimated as indicated by [5,41].
The total cumulative emissions of soil CO2, CH4, and N2O (mgha−1h−1) are represented by the symbol Ra, where the initial emissions of soil CO2, CH4, and N2O are represented by Ri; the subsequent emissions of soil CO2, CH4, and N2O are represented by Ri + 1 after the subsequent time i; and n is the number of interval days for the emissions of soil CO2, CH4, and N2O.

2.6. Global Warming Potential (GWP)

The following equation was used to determine the global warming potential (GWP) of soils treated with biochar and N fertilizer in 2020–2021 (IPCC, 2007).

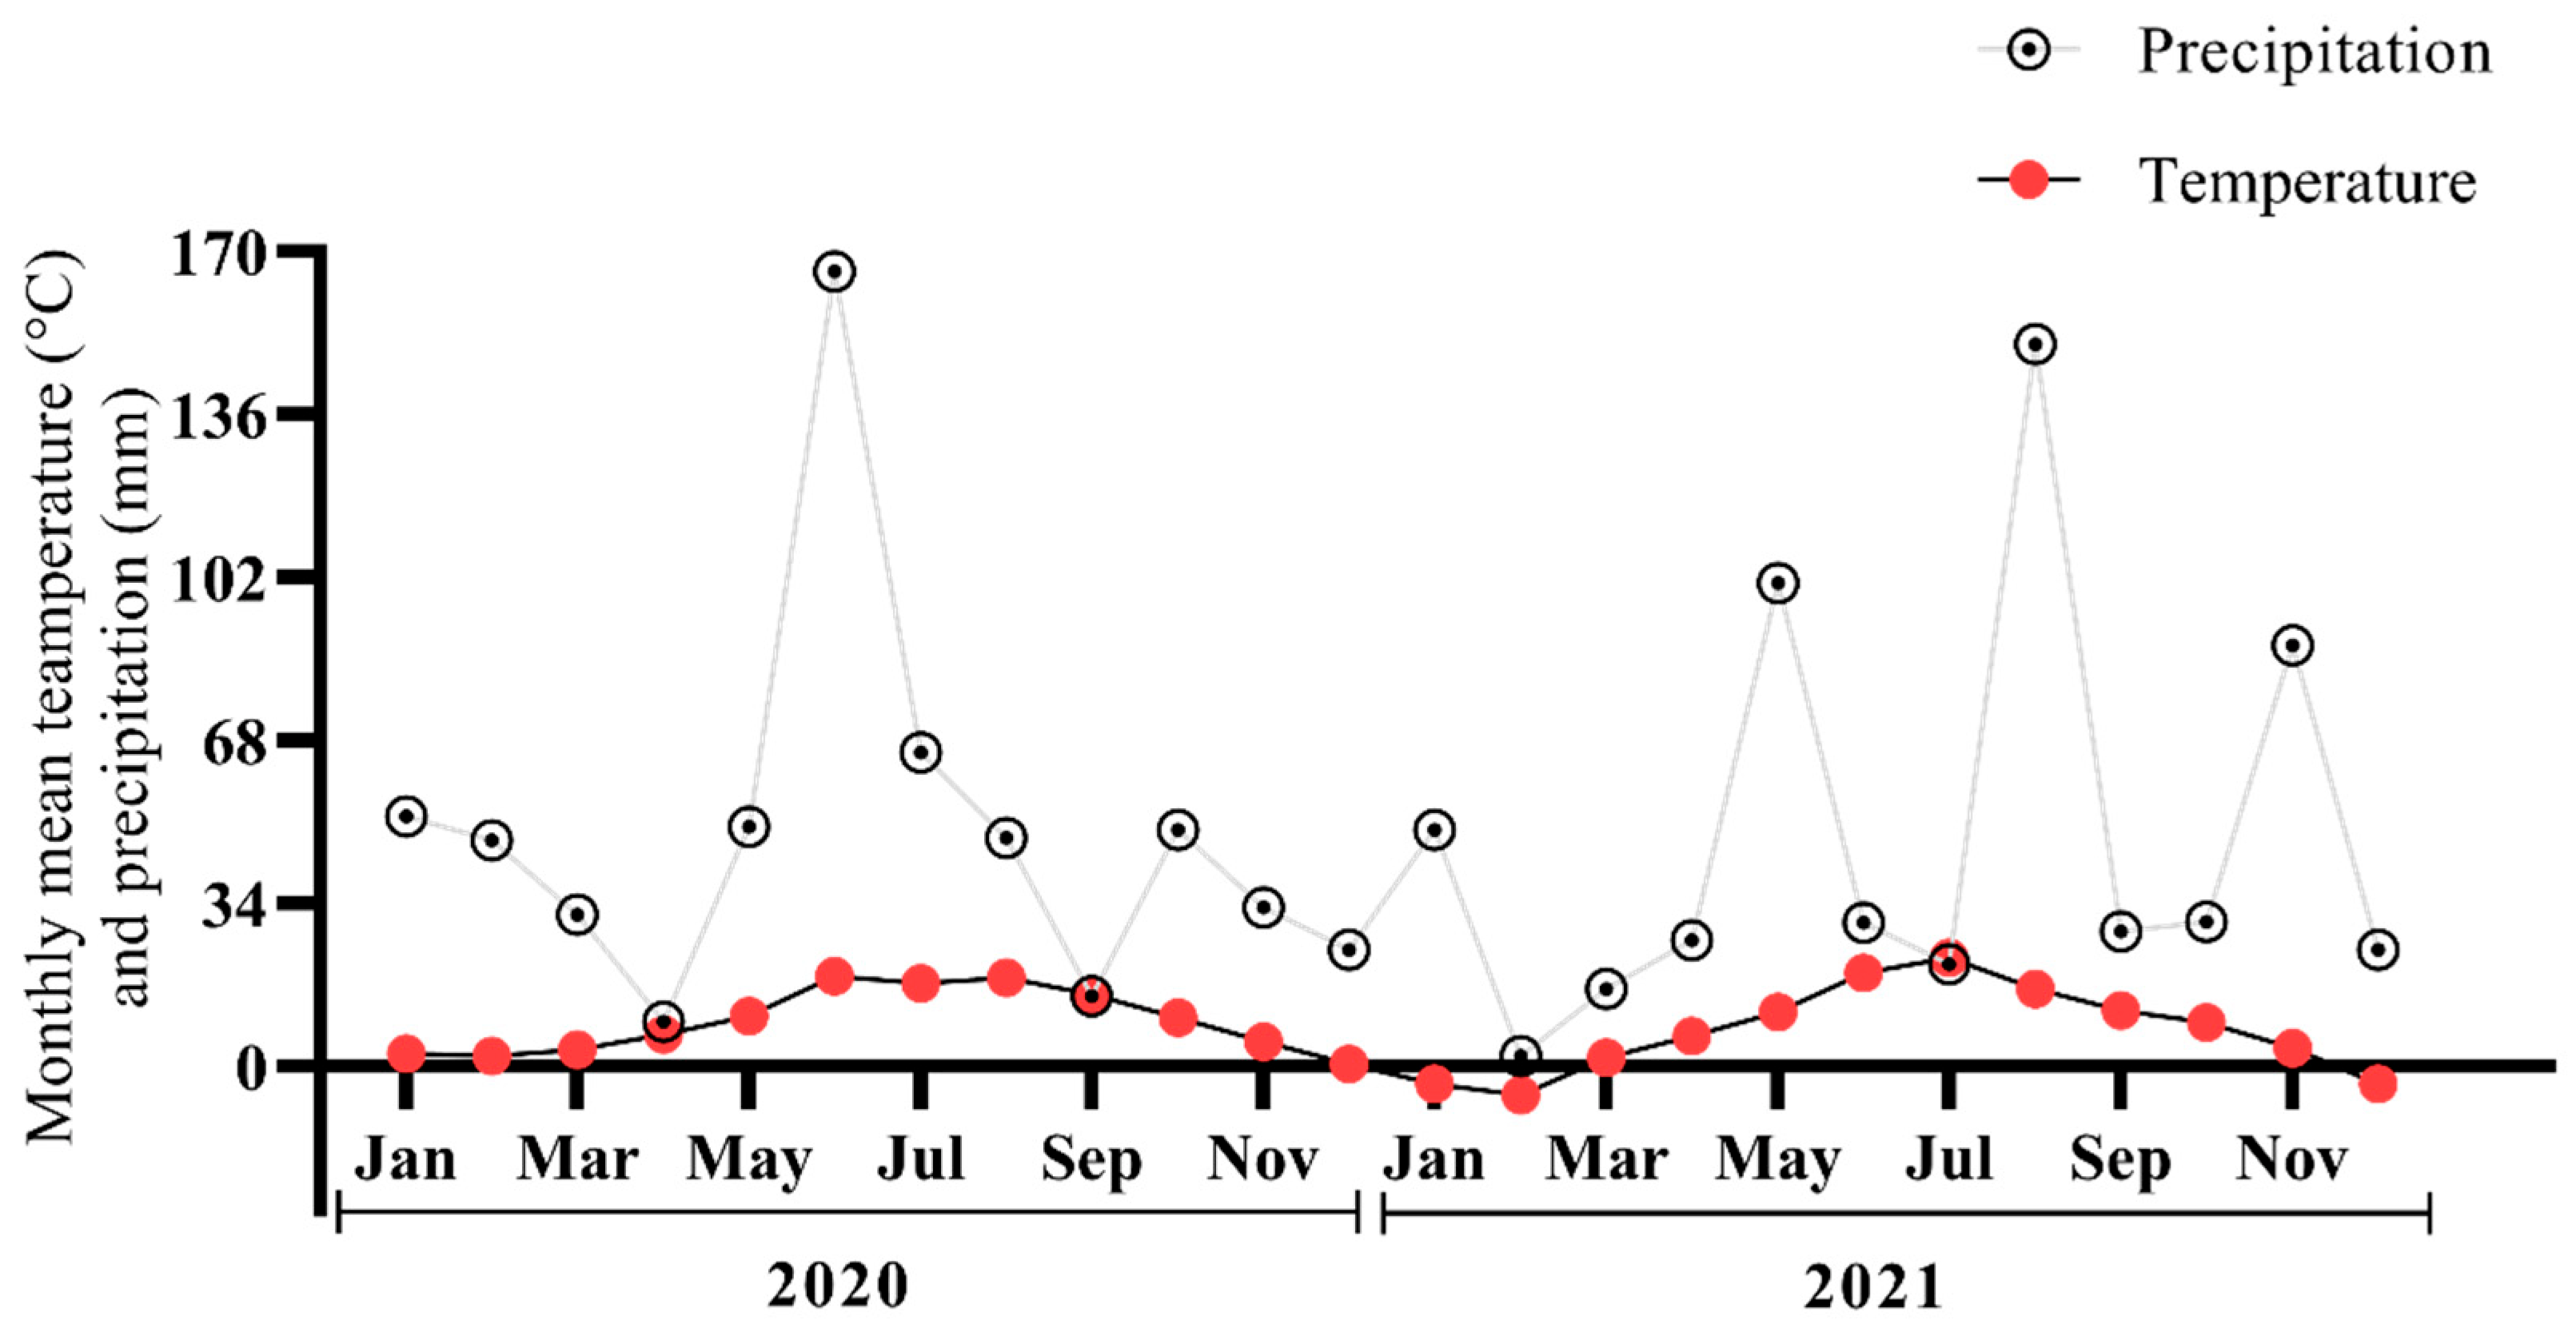
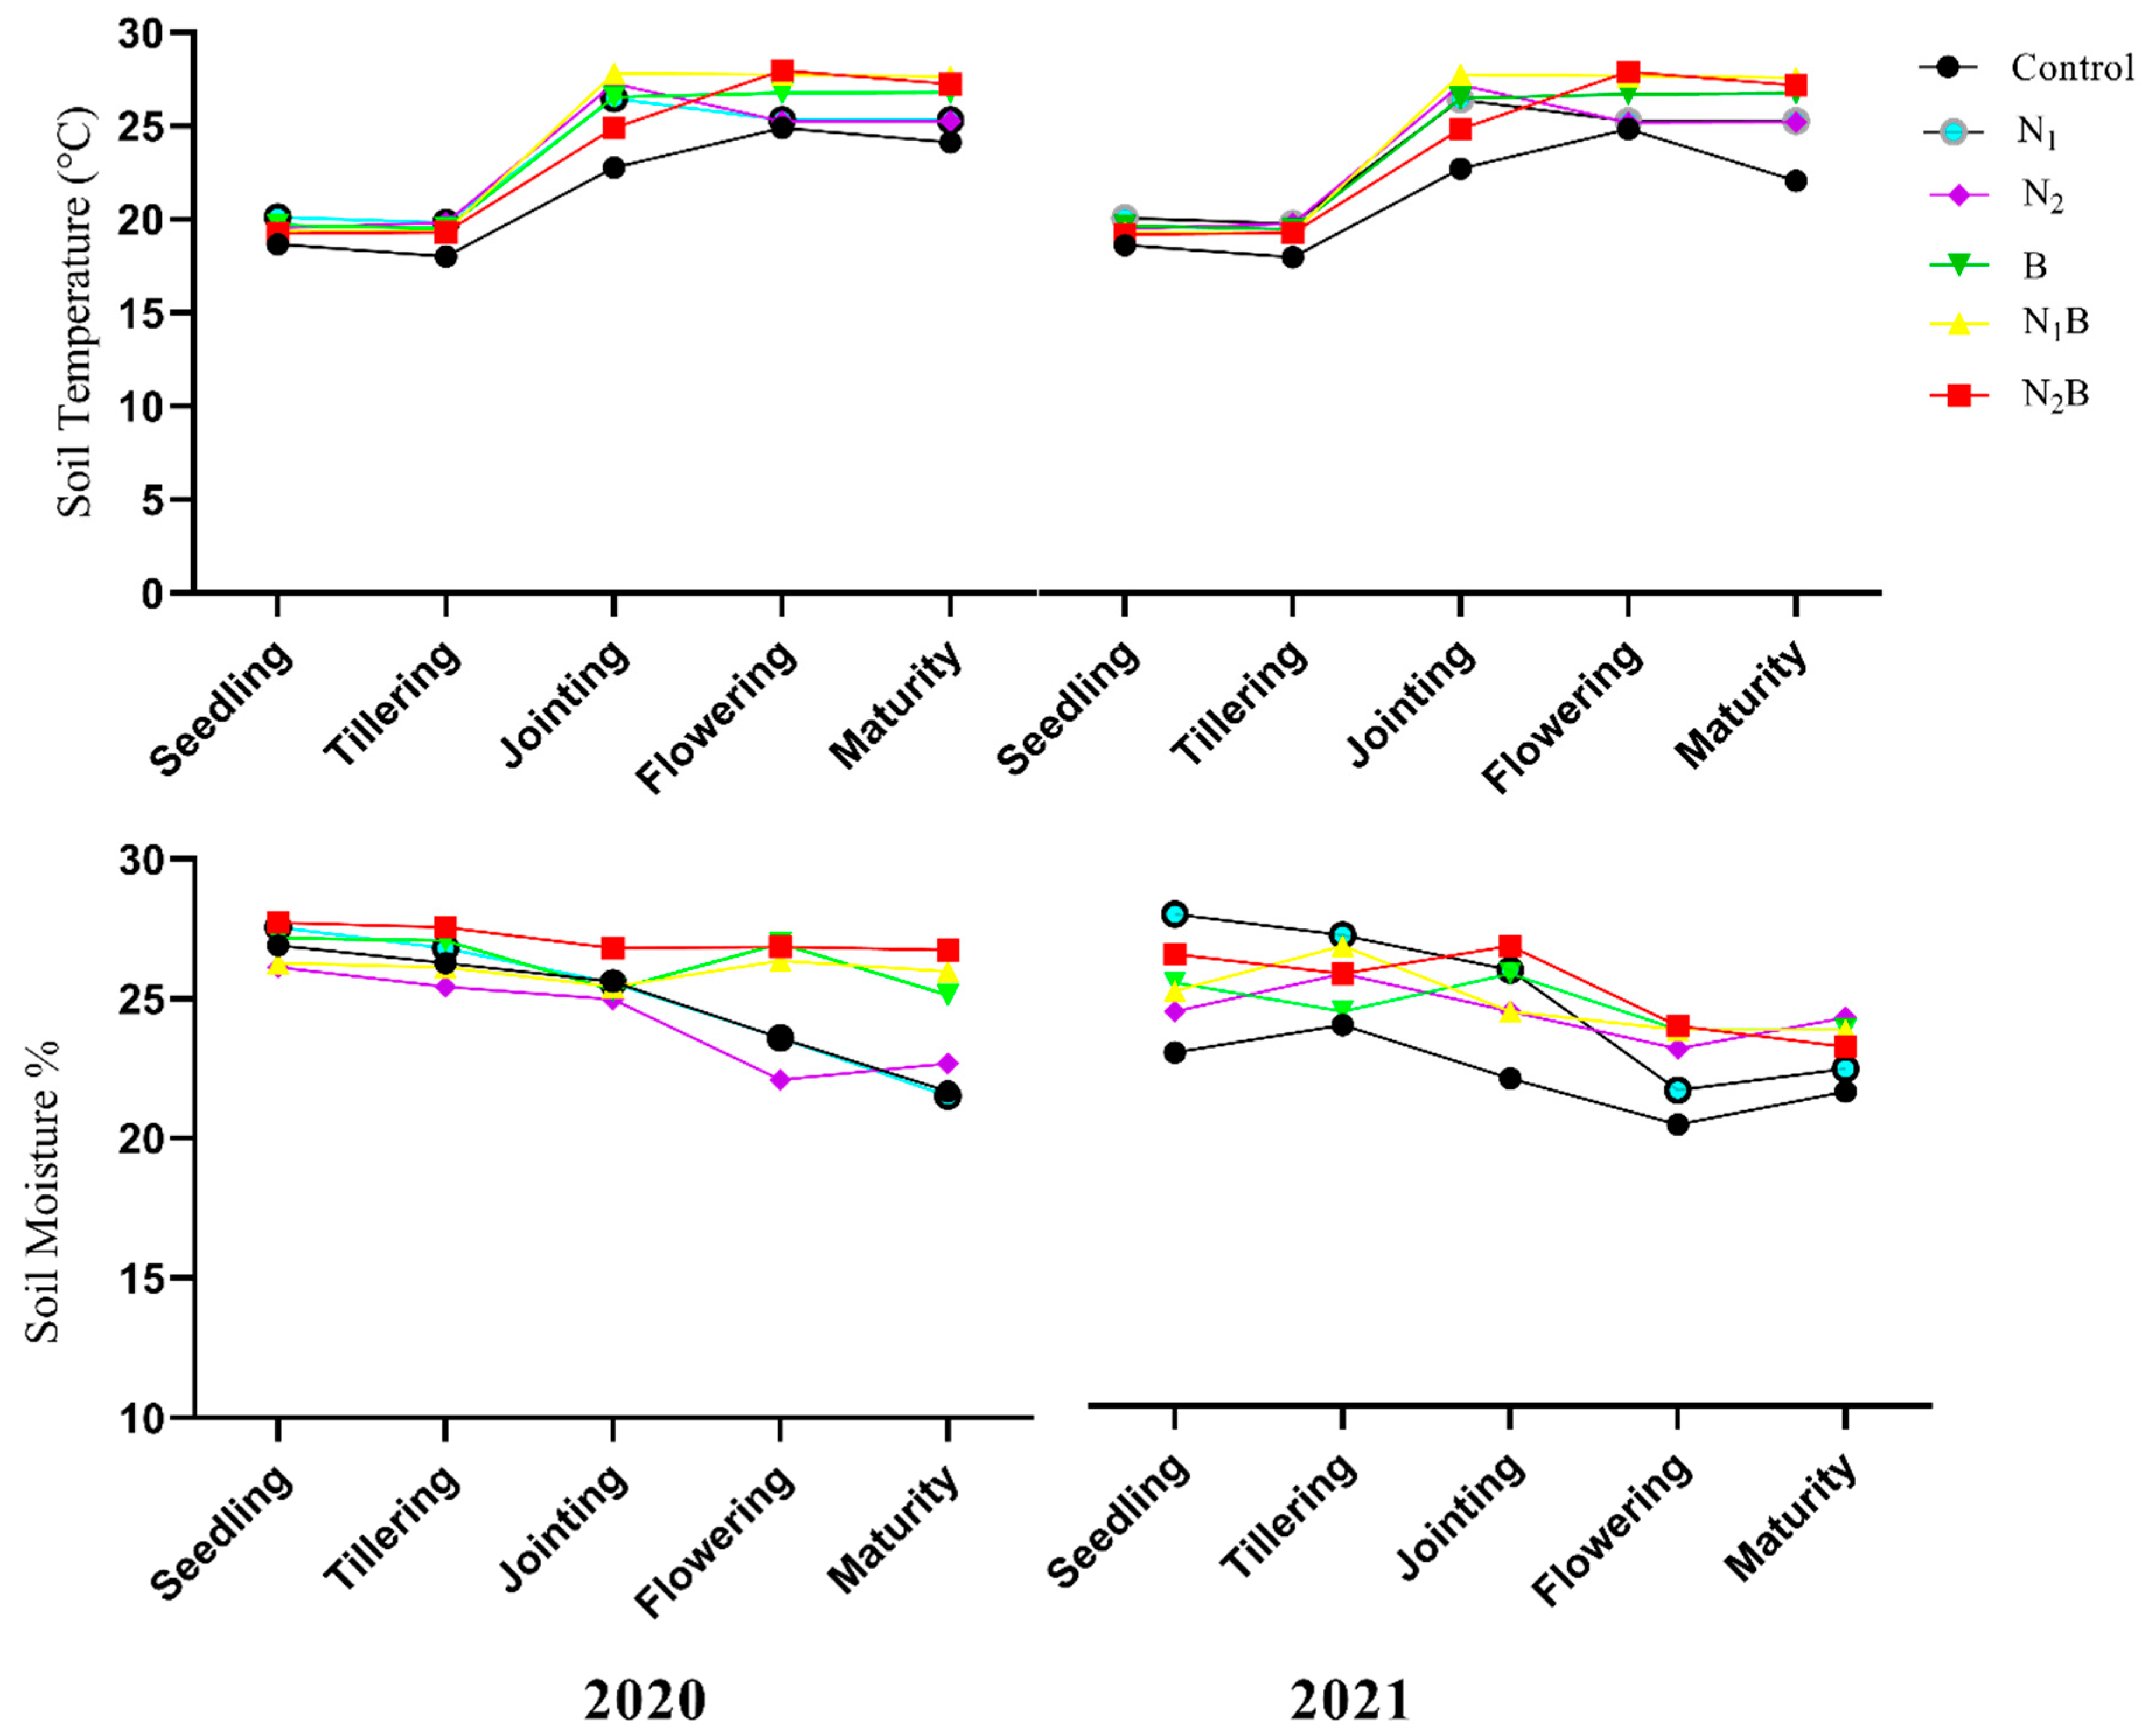
2.7. Soil Temperature and Moisture Measurements

In each growth stage, the soil temperature was measured using a squarely buried thermometer at a depth of 5 cm over the years 2020–21 [5]. Additionally, using an oven-drying method for 24 h at 105 °C, soil samples were taken from 0 to 10 cm deep using a soil auger in order to quantify soil moisture (in mass percent) at each growth stage. The link between soil temperature, moisture content, and CO2, N2O, and CH4 emissions was examined using a linear regression.

2.8. Statistical Analysis

An analysis of variance (ANOVA) was performed on annual data gathered for each parameter during the 2-year period. The statistical differences were examined using Statistix 8. The Tukey Test was used to assess mean values at a 0.05 probability level. GraphPad Prism 9 was used to plot the data.

3. Results

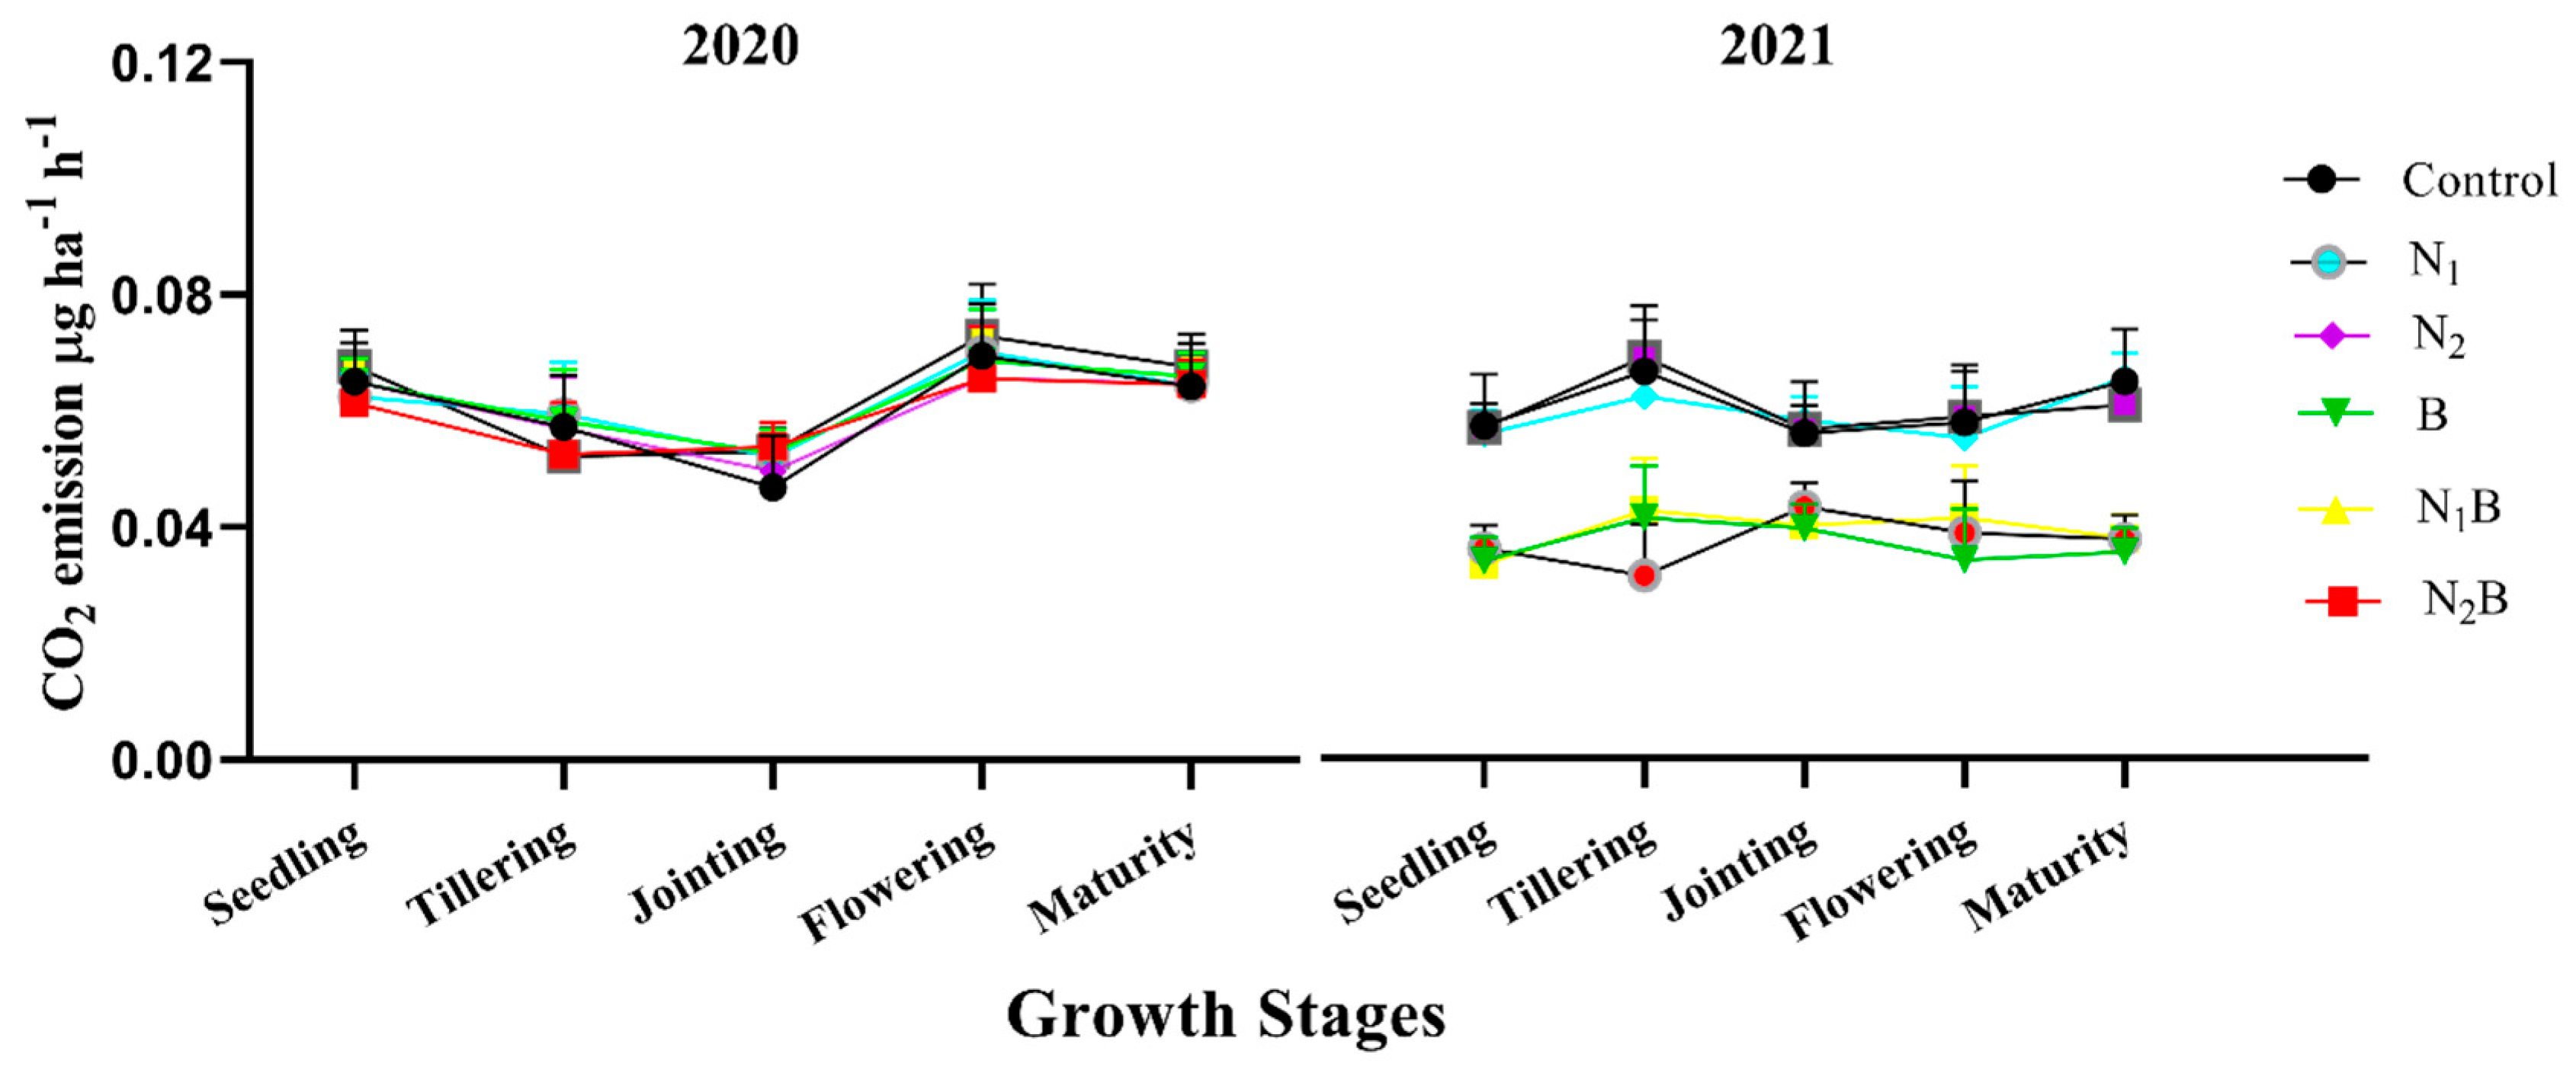
3.1. Soil CO2 Emission Flux

Periodic variation was recorded between the seasons of the spring barley crop of 2020 and the pea crop of 2021. The emission of CO2 during the 2020 spring barley crop was recorded as higher throughout the season, except during jointing stage. During 2021 of the pea crop season, CO2 emissions were found significantly (≤0.05) lowered under biochar-treated soils compares to the spring barley of 2020 (Figure 2). All biochar-treated soils showed substantially (≤0.05) lowered CO2 emissions (by 57%, 55%, and 59%, respectively, for B, N1B, and N2B) compared to non-biochar-treated soils during all stages of the pea crop. The N2B treatment significantly (≤0.05) lowered CO2 emissions during the tillering stage (by 58%) compared to the control treatment. Similarly, the B treatment substantially (≤0.05) lowered CO2 emissions during the jointing, flowering, and maturity stages by 50%, 51%, and 50%, respectively (Figure 2).

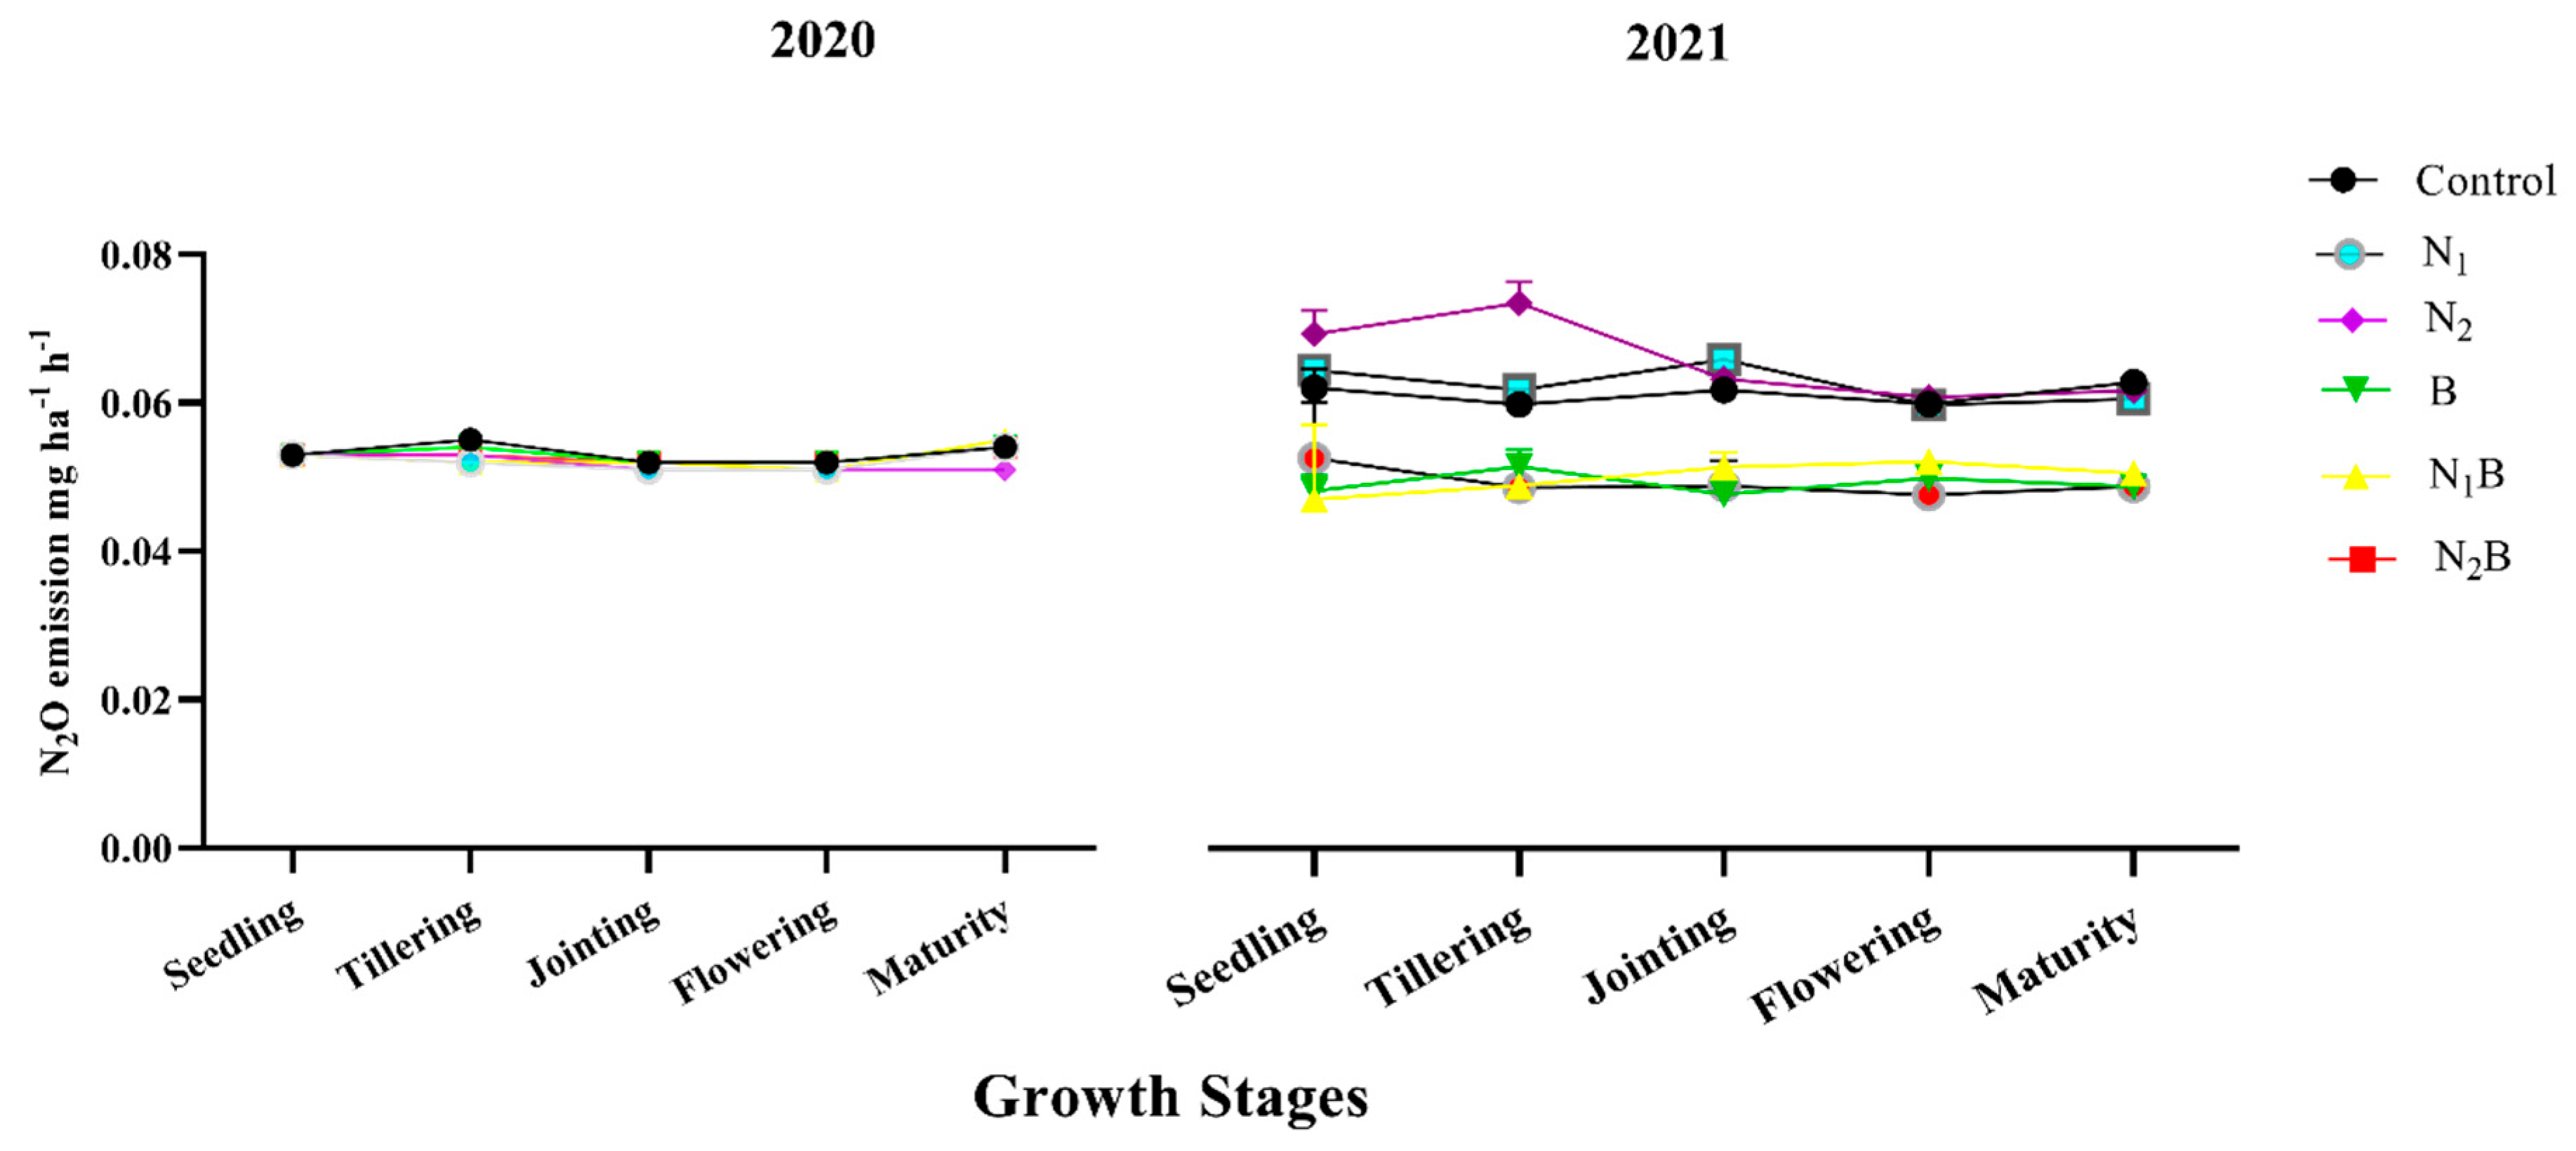
3.2. Soil N2O Emission Flux

Biochar treatments had no effect on N2O emissions during the spring barley crop of 2020 throughout all the growth stages. However, there was significant variation recorded during different growth stages of both cropping seasons regarding N2O emissions (Figure 3). Following the above trend, the biochar-treated soils of B, N1B, and N2B showed substantially (≤0.05) lowered N2O emissions by 48%, 49%, and 48%, respectively, throughout the growth stages of the pea crop compared to non-biochar treatments (Figure 3). In 2021, during the pea crop season, the N2 treatment (100% nitrogen fertilizer alone) tended to enhance N2O emission, specifically during the seedling and tillering stages.

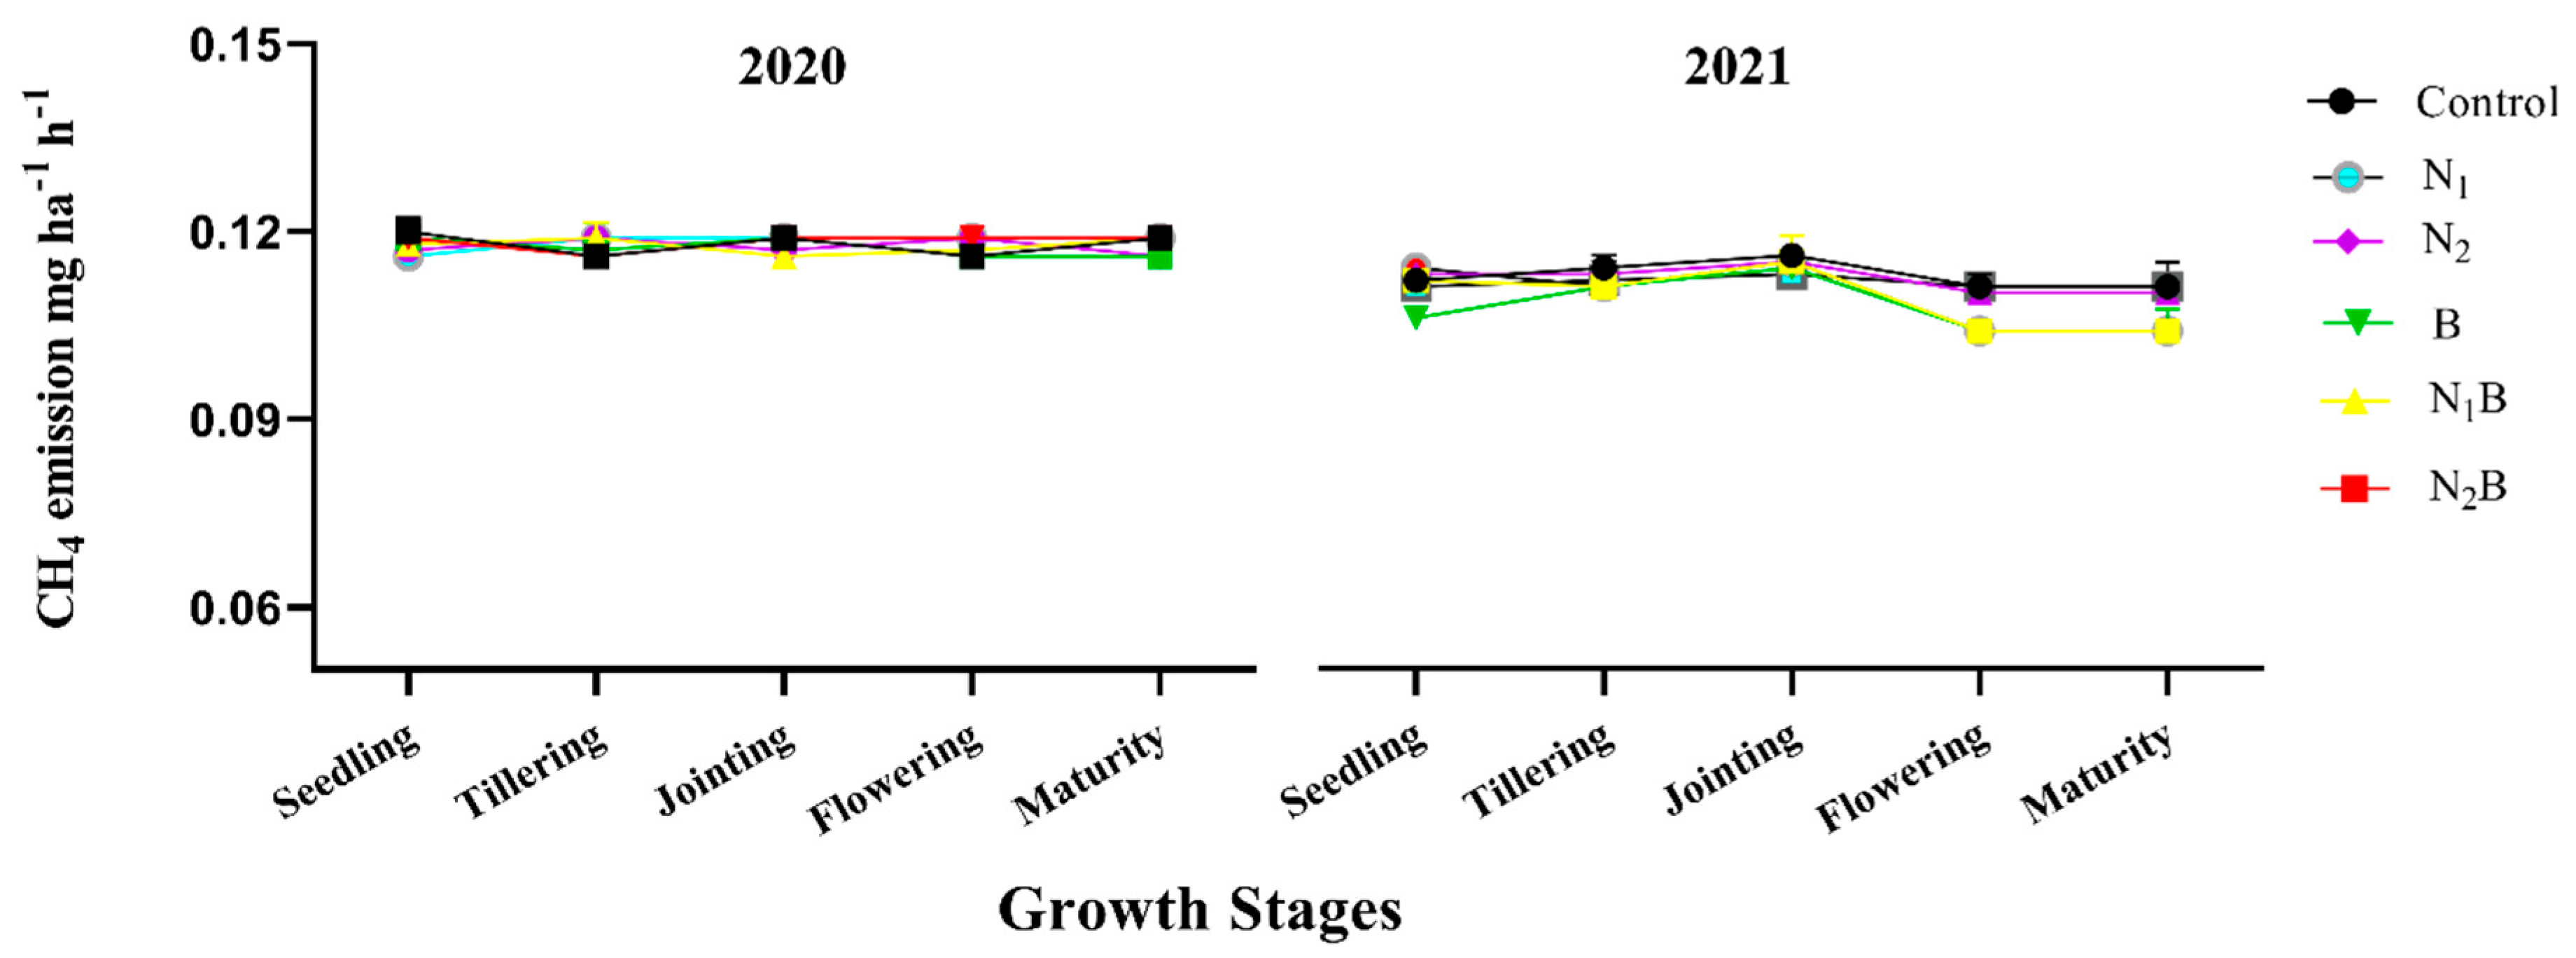
3.3. Soil CH4 Emission Flux

There was no substantial variation recorded for methane gas (CH4) emissions during the spring barley crop of 2020. However, the results indicated significant fluctuation in CH4 emissions during the pea crop growing stages of 2021 (Figure 4). The N1B treatment significantly (≤0.05) lowered CH4 emissions by 17%, and 19% during the flowering and maturity stages, respectively (Figure 4). However, biochar did not affect CH4 emissions the way it effected CO2 and N2O emissions.
Biochar application did not affect the cumulative emissions of CO2, N2O, and CH4 during the growth stages of the spring barley crop of 2020 (Table 1). However, there was big variation recorded during the growth stages of the pea crop of 2021. The biochar treatments of B, N1B, and N2B significantly (≤0.05) lowered cumulative CO2 emissions by 16%, 19%, and 17%, respectively, compared to the control treatment. However, the cumulative emission of N2O was significantly (≤0.05) lowered by 6% only in the B treatment compared to the control treatment (Table 2). Similarly, the cumulative emission of CH4 was significantly lowered by 7% in the B and N1B treatments compared to the control treatment (Table 2).
The global warming potential (GWP) of CO2, N2O, and CH4 emissions followed the same trend as that of cumulative emissions. There was no significant fluctuation recorded for GWP during the growth stages of spring barley in 2020. However, the GWP caused by CO2 was recorded as substantially (≤0.05) lower in the biochar treatments of B, N1B, and N2B by 39%, 35%, and 39%, respectively, compared to other treatments during the growth stages of the pea crop of 2021 (Table 3). The GWPs caused by CH4 and N2O were significantly lowered in treatment B by 19% and 34% compared to the control treatment, respectively (Table 3).
The substantial changes under biochar and N fertilizer rates for soil moisture and temperature are presented in (Figure 5). During 2020–2021, no significant effects of the treatments were recorded for lower soil temperature during the vegetative growth stages of both crops. Furthermore, soil moisture contents were 9.5%, 8.3%, and 7.6% higher in the N2B, N1B, and B treatments, respectively, during flowering and maturity stages of spring barley. A similar trend was recorded during different growth stages of the pea crop (Figure 5).

4. Discussion

4.1. CO2 Emission

The decomposition of organic materials is caused by CO2, N2O, and CH4 emissions [42,43]. Biochar provides additional environmental advantages since it improves soil fertility through decomposition [44,45]. Biochar is a significant source of carbon and helps in increasing SOC buildup [46,47] that, even at low soil temperatures, resulted in higher average CO2 emissions in biochar-amended soil compared to non-biochar treatments in 2020. This result showed that soil C has a greater potential for soil CO2 emission variability [48,49] and, hence, increases soil fertility. However, on the other hand, biochar has the potential to mitigate CO2 emission [50,51]. The seasonal changes in soil CO2 were dramatically impacted by biochar applications in 2021. Similar fluctuations in soil temperature and moisture were visible for the biochar treatments during the field trial. The agricultural fields′ consistent results demonstrate that biochar decomposition initially boosted soil CO2 emission and soil carbon and nitrogen availability [52,53]. However, there was also substantially lowered soil CO2 after biochar decomposition compared to non-biochar treatments. Unnecessary agronomic practices may influence soil moisture, which can affect soil CO2 emission [54,55]. For instance, it was reported that different tillage operations lead to GHG emissions [56]. According to the current study, the higher precipitation (Figure 1) in the first year (2020) compared with that of the second year (2021) could mean that, due to favorable conditions for the decomposition of biochar, the soil CO2 emission increased [57,58].

4.2. N2O Emission

The overusage of N fertilizer increases GHG emissions and has negative effects on the ecosystem [59,60]. The current findings showed that, during the growth seasons, the N fertilizer treatments of N1, N2, and N3 alone considerably boosted soil N2O emissions. (2021). Based on the N used and the emission variables, soil amendment with biochar and synthetic fertilizers can reduce N2O emissions [61]. It is challenging to anticipate the emission factors because of the complex chemical compositions of organic fertilizers [5,62]. It is known that N fertilization and mulching treatments together boost N2O flux by 71–123% [63,64,65].
Nevertheless, biochar on a field might help to reduce N2O emissions [66,67]. Additionally, it was determined from these outcomes that N application with biochar could decrease N2O emissions, as observed in the biochar-treated plots compares to non-biochar-treated plots. Moreover, it was also reported that N fertilization could influence degradable N and C, which resulted in improving the intricate microbial interaction between N and C, thus enhancing N2O emissions [68,69].
As a comparison to applying N fertilizer alone, using biochar with N fertilizer reduces N2O emissions by 25–35% [70,71]. Higher nitrogen fertilizer application rates result in higher GHG emissions, which has an immediate impact on soil N2O emissions [5,72,73]. The present study suggested that the N1, N2, and N3 treatments are more environmentally unfriendly due to N2O emissions, while the B treatment with N fertilizer is ecofriendly.

4.3. CH4 Emission

Compared to CO2 and N2O emissions, only the N1B treatment decreased CH4 emissions during 2021. It was reported that the organic piles’ structure was improved with biochar application anaerobically, and biochar could alter the oxidation–reduction potential by enhancing absorptivity, which lowered the mechanism of methanogens and increased that of methanotrophs to mitigate CH4 emissions [74]. Several of the literature findings have indicated that the interaction between applying biochar to soil and CH4 flux is not well-known [75,76]. The soil applications of biochar have been shown to enhance [77], lower [77,78,79], or have no substantial influence on CH4 emission flux [80]. It was reported that biochar addition to soil also promoted methanotrophic CH4 intake at the oxic–anoxic junction in anaerobic environments. Moreover, the addition of biochar improved the oxidation of CH4 by methanotrophic organisms at the oxic–anoxic root interface, which lowered the concentration of CH4 that could enter a plant′s aerenchyma and escape [79].

4.4. Global Warming Potential (GWP)

The overall impact of the main greenhouse gases (i.e., CO2, CH4, and N2O) is driven by GWP [81]. The plots with applied biochar had a much lower net GWP during 2021. However, no substantial difference was reported in 2020, which is in line with the following reports. The non-significant difference in GWP might be due to the non-decomposition of biochar in the first year [82]; however, the decomposition of biochar might be enhanced in the second year, which led to GWP reduction [51]. Overall, studies report that biochar application can significantly mitigate global warming. The biochar C:N ratio may be an important factor that drives GWP under biochar applications [83].

4.5. Soil Moisture and Temperature

The incorporation of biochar into soil is treated as sustainable waste. It was reported that the inappropriate management of different wastes (food, agriculture, etc.) creates a global environmental challenge [84]. Thus, biochar addition provides a multitude of advantages in terms of sustainable environment and agriculture aspects [85]. Furthermore, the current study reported that biochar applications significantly (p ≤ 0.05) elevated soil moisture content in the years of 2020–2021. Greater soil moisture content as a result of surface area and porous structure has been observed [22,86]. However, changes in soil temperature could be attributed to weather conditions.

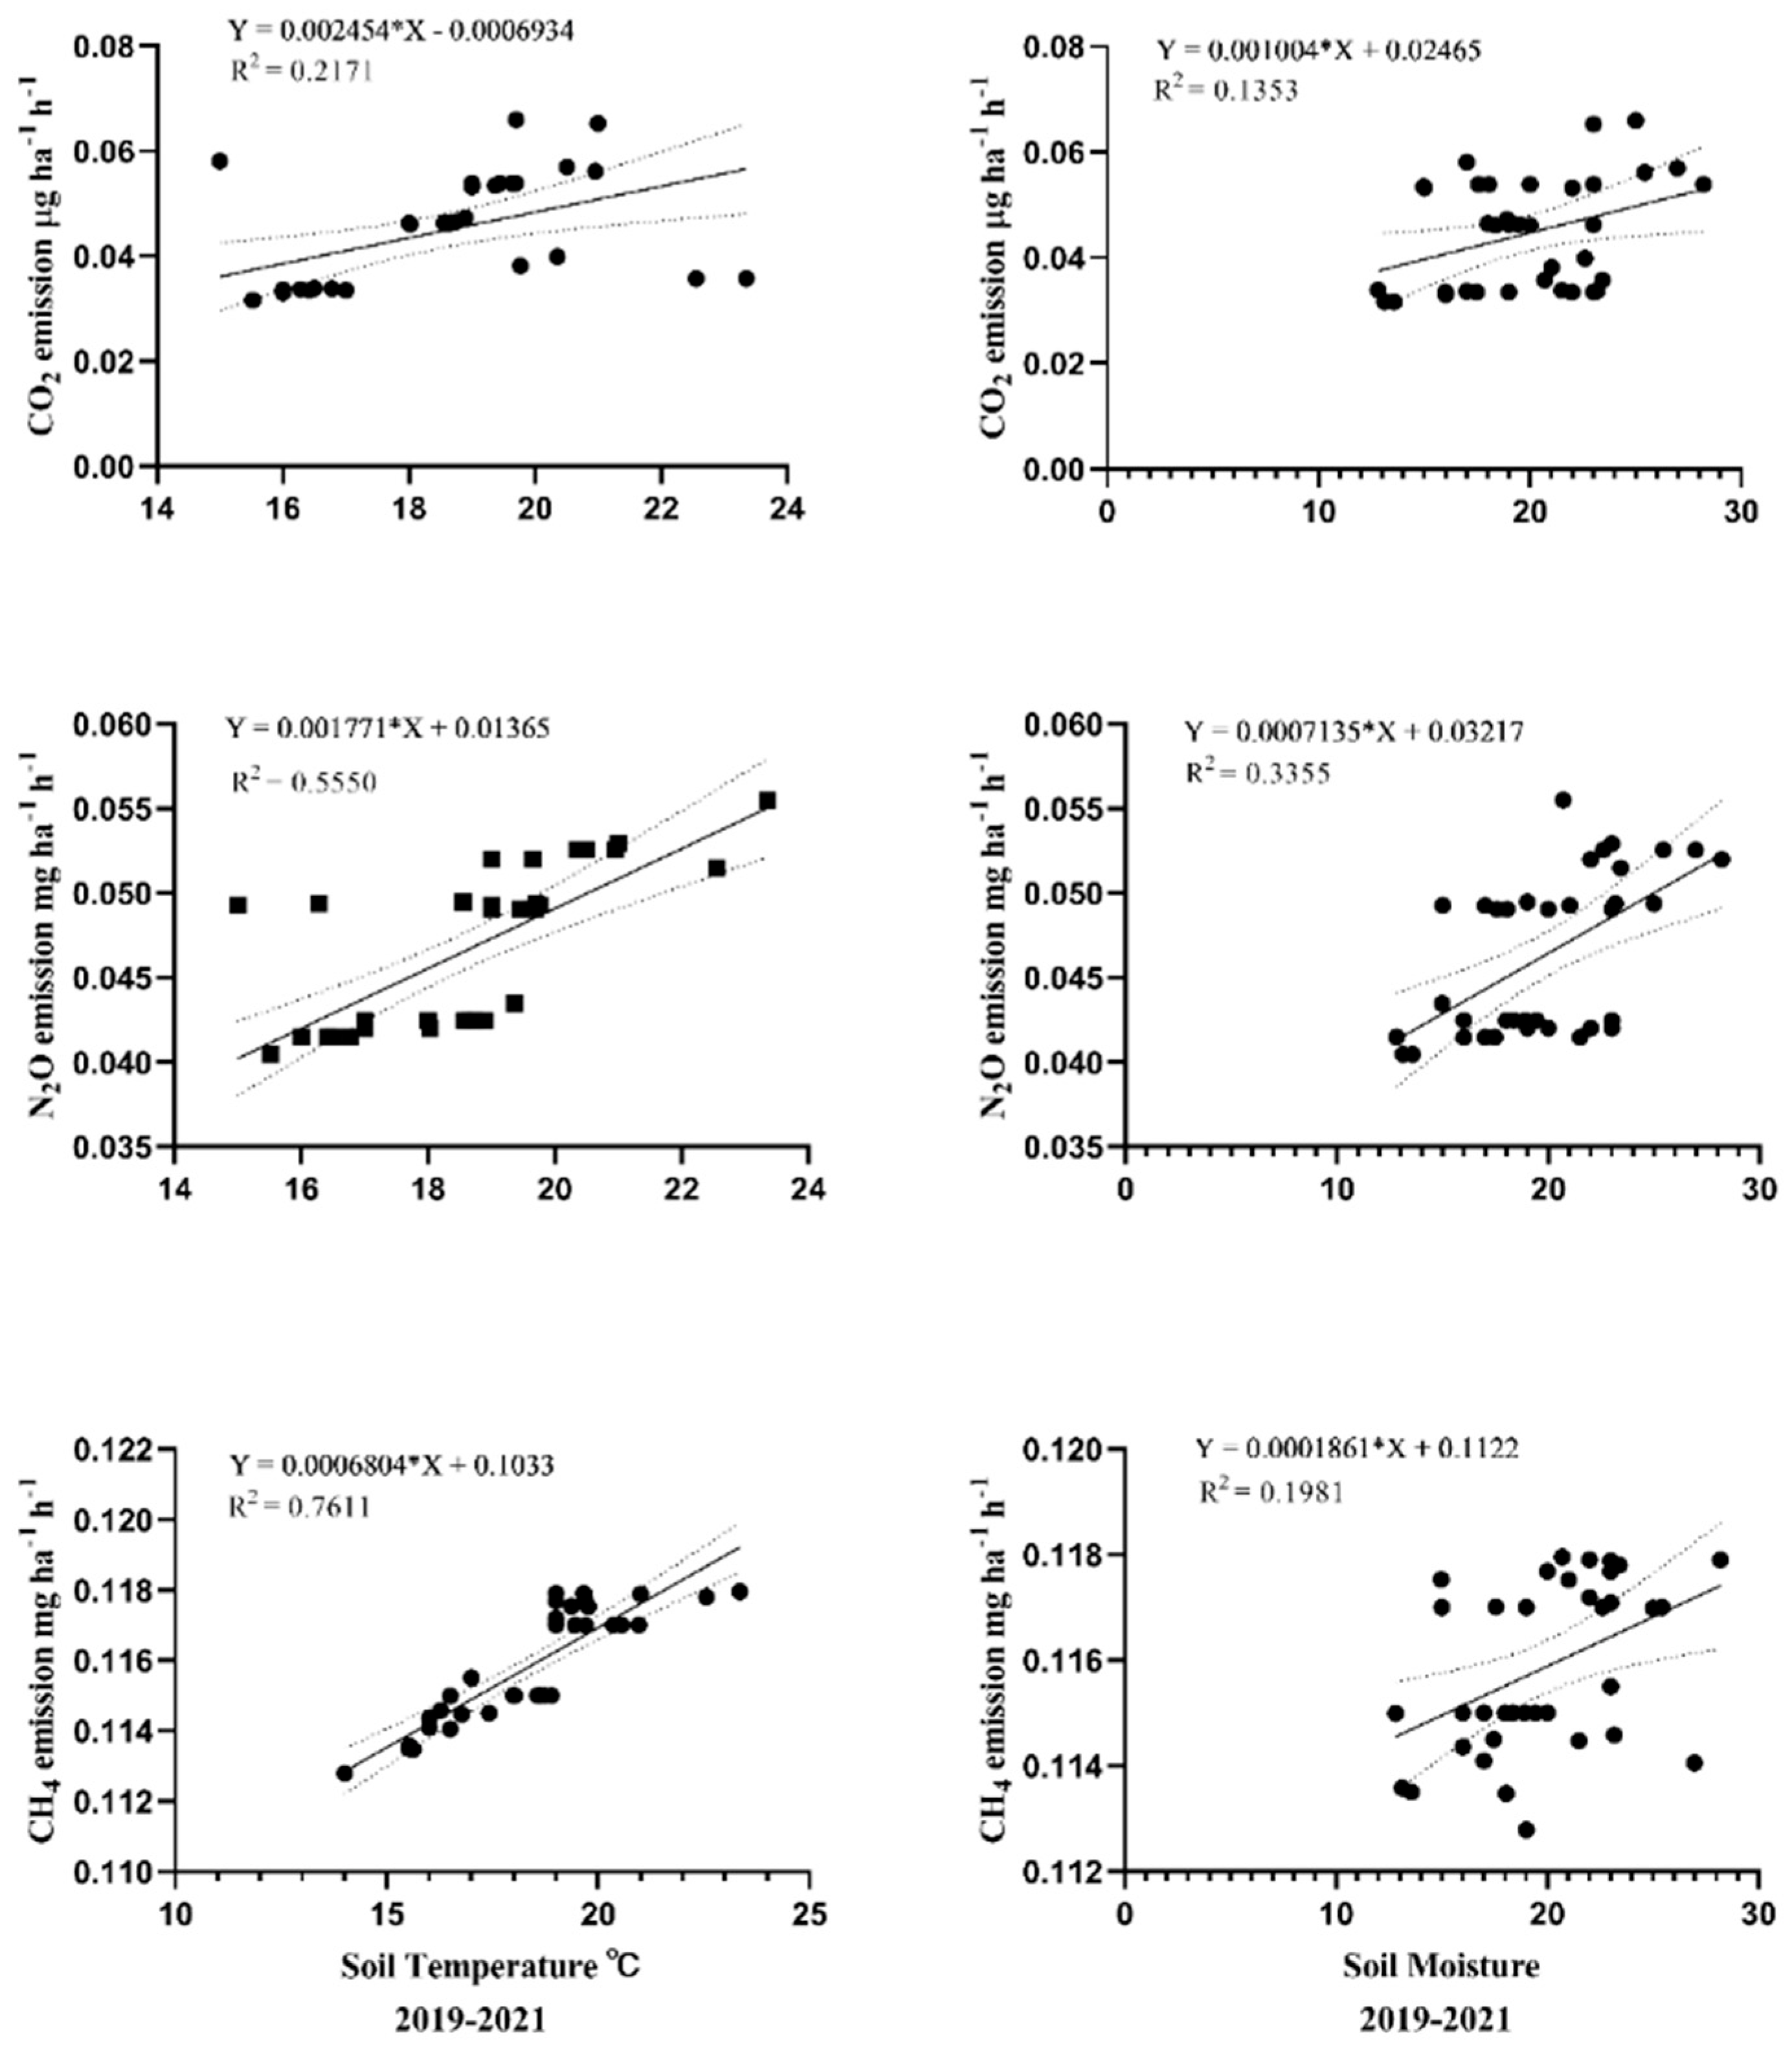
4.6. Correlation between Soil Moisture, Temperature, and CO2 and N2O Emissions

According to the current study, CO2, N2O, and CH4 emissions were considerably positively associated with soil temperature and moisture. According to a report, the primary variables affecting soil gas emission fluxes are its thermal characteristics [87,88]. Soil CO2 and CH4 emissions increase due to fact that higher soil temperature and moisture cause higher biochar decomposition and higher methane oxidation rates [89,90,91]. The reason for higher N2O emissions with higher temperatures could be attributed to N fertilization, which releases mineralized N upon decomposition [92]. It was observed that soil temperature and soil moisture had a positive, two-parameter linear association with CO2, N2O, and CH4 emissions (Figure 6). The findings of this study, therefore, show that agricultural management techniques under humid climate conditions affected the rate of soil GHG emission.
For the spring barley and pea crops in 2020–2021, the linear relationship between soil CO2, N2O, and CH4 emissions and soil moisture and soil temperature was studied. Figure 6 demonstrates a positive correlation between soil temperature and moisture and soil GHG CO2, N2O, and CH4 emissions. The linear CO2, N2O, and CH4 R2 values during 2020 and 2021 were 0.2171 and 0.1353, 0.5550 and 0.3355, and 0.7611 and 0.1981, respectively. According to Figure 6, soil CO2, N2O, and CH4 emissions significantly increased when soil temperature and wetness rose.

5. Conclusions

Biochar application substantially lowered direct CO2, N2O, and CH4 emissions from soil in the second year compared to first year for non-biochar-treated plots. Thus, the lower CO2, N2O, and CH4 emissions from the agricultural fields confirmed that swine manure digestate biochar could be a suitable remedy for agriculture fields with higher GHG emissions, especially in temperate climatic conditions. Likewise, the cumulative emissions and global warming potential were substantially influenced by biochar during the second year of the experiment. A positive correlation was recorded between GHG emissions and soil moisture and temperature. No negative environmental issues were recorded during the two years of field research. More research is required to explore the long-term implication of swine-digestate-manure-derived biochar.

Author Contributions

All authors contributed to this research paper. M.A. conceived the idea for the article; performed the practical and the literature searches, data preparation, analyses, and figures; and wrote the first draft. D.F., V.F. and V.T. critically revised the work and contributed to writing and editing. E.B.-G. and S.U. helped in biochar preparation and contributed to article conception, critical revision, and editing drafts. All authors have read and agreed to the published version of the manuscript.

Funding

This research received no external funding.

Institutional Review Board Statement

Not applicable.

Informed Consent Statement

Not applicable.

Data Availability Statement

The data that support the findings of this study are available from the corresponding author, Muhammad Ayaz, upon reasonable request.

Conflicts of Interest

The authors declare no conflict of interest.

References

  1. Wang, X. Managing Land Carrying Capacity: Key to Achieving Sustainable Production Systems for Food Security. Land 2022, 11, 484. [Google Scholar] [CrossRef]
  2. Martinho, V.J.P.D. Direct and indirect energy consumption in farming: Impacts from fertilizer use. Energy 2021, 236, 121504. [Google Scholar] [CrossRef]
  3. Yu, Y.; Hu, Y.; Gu, B.; Reis, S.; Yang, L. Reforming smallholder farms to mitigate agricultural pollution. Environ. Sci. Pollut. Res. 2021, 29, 13869–13880. [Google Scholar] [CrossRef]
  4. Ghafoor, I.; Habib-Ur-Rahman, M.; Ali, M.; Afzal, M.; Ahmed, W.; Gaiser, T.; Ghaffar, A. Slow-release nitrogen fertilizers enhance growth, yield, NUE in wheat crop and reduce nitrogen losses under an arid environment. Environ. Sci. Pollut. Res. 2021, 28, 43528–43543. [Google Scholar] [CrossRef]
  5. Akhtar, K.; Wang, W.; Ren, G.; Khan, A.; Enguang, N.; Khan, A.; Feng, Y.; Yang, G.; Wang, H. Straw mulching with inorganic nitrogen fertilizer reduces soil CO2 and N2O emissions and improves wheat yield. Sci. Total Environ. 2020, 741, 140488. [Google Scholar] [CrossRef]
  6. Huang, Q.; Zhang, G.; Ma, J.; Song, K.; Zhu, X.; Shen, W.; Xu, H. Dynamic interactions of nitrogen fertilizer and straw application on greenhouse gas emissions and sequestration of soil carbon and nitrogen: A 13-year field study. Agric. Ecosyst. Environ. 2021, 325, 107753. [Google Scholar] [CrossRef]
  7. Islam, S.M.; Gaihre, Y.K.; Islam, R.; Ahmed, N.; Akter, M.; Singh, U.; Sander, B.O. Mitigating greenhouse gas emissions from irrigated rice cultivation through improved fertilizer and water management. J. Environ. Manag. 2022, 307, 114520. [Google Scholar] [CrossRef]
  8. Han, Z.; Lin, H.; Xu, P.; Li, Z.; Wang, J.; Zou, J. Impact of organic fertilizer substitution and biochar amendment on net greenhouse gas budget in a tea plantation. Agric. Ecosyst. Environ. 2021, 326, 107779. [Google Scholar] [CrossRef]
  9. Lamb, W.F.; Grubb, M.; Diluiso, F.; Minx, J.C. Countries with sustained greenhouse gas emissions reductions: An analysis of trends and progress by sector. Clim. Policy 2021, 22, 1–17. [Google Scholar] [CrossRef]
  10. Bruinsma, J. World Agriculture: Towards 2015/2030: An FAO Perspective; Routledge: Abingdon, UK, 2017. [Google Scholar]
  11. Tsujimoto, S.; Takagi, T.; Osada, T.; Ogino, A. Greenhouse gas reduction and improved sustainability of animal husbandry using amino acids in swine, poultry feeds. Anim. Sci. J. 2013, 84, 409–415. [Google Scholar] [CrossRef]
  12. Sonwani, S.; Saxena, P. Introduction to Greenhouse Gases: Sources, Sinks and Mitigation. In Greenhouse Gases: Sources, Sinks and Mitigation; Springer: Berlin/Heidelberg, Germany, 2022; pp. 1–7. [Google Scholar]
  13. Doyeni, M.O.; Stulpinaite, U.; Baksinskaite, A.; Suproniene, S.; Tilvikiene, V. Greenhouse gas emissions in agricultural cultivated soils using animal waste-based digestates for crop fertilization. J. Agric. Sci. 2021, 159, 23–30. [Google Scholar] [CrossRef]
  14. Kumar, A.; Mishra, S.; Pandey, R.; Yu, Z.G.; Kumar, M.; Khoo, K.S.; Thakur, T.K.; Show, P.L. Microplastics in terrestrial ecosystems: Un-ignorable impacts on soil characterises, nutrient storage and its cycling. TrAC Trends Anal. Chem. 2023, 158, 116869. [Google Scholar] [CrossRef]
  15. Raza, S.; Jiang, Y.; Elrys, A.S.; Tao, J.; Liu, Z.; Li, Z.; Chen, Z.; Zhou, J. Dicyandiamide efficacy of inhibiting nitrification and carbon dioxide emission from calcareous soil depends on temperature and moisture contents. Arch. Agron. Soil Sci. 2021, 68, 1413–1429. [Google Scholar] [CrossRef]
  16. Sereni, L.; Guenet, B.; Blasi, C.; Crouzet, O.; Lata, J.-C.; Lamy, I. To what extend can soil moisture and soil contamination stresses affect greenhouse gas emissions? An attempt to calibrate a nitrification/denitrification model. Biogeosci. Discuss. 2021, 1–27. [Google Scholar]
  17. Goyal, R.; Kahlon, M.S. Soil physico-chemical properties and water productivity of maize as affected by biochar application under different irrigation regimes in northwest India. Commun. Soil Sci. Plant Anal. 2022, 53, 1068–1084. [Google Scholar] [CrossRef]
  18. Wu, L.; Zheng, H.; Wang, X. Effects of soil amendments on fractions and stability of soil organic matter in saline-alkaline paddy. J. Environ. Manag. 2021, 294, 112993. [Google Scholar] [CrossRef]
  19. Huang, Y.; Tao, B.; Xiaochen, Z.; Yang, Y.; Liang, L.; Wang, L.; Jacinthe, P.-A.; Tian, H.; Wen, R. Conservation tillage increases corn and soybean water produc-tivity across the Ohio River Basin. Agric Water Manag. 2021, 254, 106962. [Google Scholar] [CrossRef]
  20. Liu, Q.; Li, Y.; Liu, S.; Gao, W.; Shen, J.; Zhang, G.; Xu, H.; Zhu, Z.; Ge, T.; Wu, J. Anaerobic primed CO2 and CH4 in paddy soil are driven by Fe reduction and stimulated by biochar. Sci. Total Environ. 2022, 808, 151911. [Google Scholar] [CrossRef]
  21. Li, X.; Wang, R.; Shao, C.; Li, D.; Bai, S.; Hou, N.; Zhao, X. Biochar and Hydrochar from Agricultural Residues for Soil Conditioning: Life Cycle Assessment and Microbially Mediated C and N Cycles. ACS Sustain. Chem. Eng. 2022, 10, 3574–3583. [Google Scholar] [CrossRef]
  22. Ayaz, M.; Feizien, D.; Tilvikien, V.; Akhtar, K.; Stulpinait, U. Biochar Role in the Sustainability of Agriculture and Environment. Sustainability 2021, 13, 1330. [Google Scholar] [CrossRef]
  23. An, N.; Zhang, L.; Liu, Y.; Shen, S.; Li, N.; Wu, Z.; Yang, J.; Han, W.; Han, X. Biochar application with reduced chemical fertilizers improves soil pore structure and rice productivity. Chemosphere 2022, 298, 134304. [Google Scholar] [CrossRef]
  24. Shi, Y.; Liu, X.; Zhang, Q.; Li, G.; Wang, P. Biochar rather than organic fertilizer mitigated the global warming potential in a sa-line-alkali farmland. Soil Tillage Res. 2022, 219, 105337. [Google Scholar] [CrossRef]
  25. Babu, S.; Singh, R.; Yadav, D.; Rathore, S.S.; Raj, R.; Avasthe, R.; Yadav, S.; Das, A.; Yadav, V.; Yadav, B.; et al. Nanofertilizers for agricultural and environmental sustainability. Chemosphere 2021, 292, 133451. [Google Scholar] [CrossRef]
  26. Wang, J.; Qin, L.; Cheng, J.; Shang, C.; Li, B.; Dang, Y.; He, H. Suitable chemical fertilizer reduction mitigates the water footprint of maize production: Evidence from Northeast China. Environ. Sci. Pollut. Res. 2021, 29, 22589–22601. [Google Scholar] [CrossRef]
  27. Klusáčková, M. Approximated EU Greenhouse Gas Inventory; Flemish Institute for Technological Research: Mol, Belgium, 2021. [Google Scholar]
  28. Nguyen, M.K.; Lin, C.; Hoang, H.G.; Sanderson, P.; Dang, B.T.; Bui, X.T.; Nguyen, N.S.H.; Vo, D.-V.N.; Tran, H.T. Evaluate the role of biochar during the organic waste composting process: A critical review. Chemosphere 2022, 299, 134488. [Google Scholar] [CrossRef]
  29. Ji, B.; Chen, J.; Li, W.; Mei, J.; Yang, Y.; Chang, J. Greenhouse gas emissions from constructed wetlands are mitigated by biochar substrates and distinctly affected by tidal flow and intermittent aeration modes. Environ. Pollut. 2020, 271, 116328. [Google Scholar] [CrossRef]
  30. He, Y.; Zhou, X.; Jiang, L.; Li, M.; Du, Z.; Zhou, G.; Shao, J.; Wang, X.; Xu, Z.; Bai, S.H.; et al. Effects of biochar application on soil greenhouse gas fluxes: A meta-analysis. GCB Bioenergy 2016, 9, 743–755. [Google Scholar] [CrossRef]
  31. Lai, L.; Ismail, M.R.; Yusof, M.M.; Ismail, R. Rice straw biochar and different urea rates on rice yield and CH4 and CO2 gases emissions. Chil. J. Agric. Res. 2021, 81, 448–455. [Google Scholar] [CrossRef]
  32. Buneviciene, K.; Drapanauskaite, D.; Mazeika, R.; Tilvikiene, V.; Baltrusaitis, J. Granulated biofuel ash as a sustainable source of plant nutrients. Waste Manag. Res. J. Sustain. Circ. Econ. 2020, 39, 806–817. [Google Scholar] [CrossRef]
  33. Ayaz, M.; Feizien, D.; Feiza, V.; Tilvikien, V.; Baltr, E. The Impact of Swine Manure Biochar on the Physical Properties and Microbial Activity of Loamy Soils. Plants 2022, 11, 1729. [Google Scholar] [CrossRef]
  34. Egene, C.E.; Sigurnjak, I.; Regelink, I.C.; Schoumans, O.F.; Adani, F.; Michels, E.; Sleutel, S.; Tack, F.M.G.; Meers, E. Solid fraction of separated digestate as soil improver: Implications for soil fertility and carbon sequestration. J. Soils Sediments 2021, 21, 678–688. [Google Scholar] [CrossRef]
  35. Nikitin, B. A Method for humus determination. Agrokhimiia 1999, 91–93. [Google Scholar]
  36. Razzaghi, F.; Arthur, E.; Moosavi, A.A. Evaluating models to estimate cation exchange capacity of calcareous soils. Geoderma 2021, 400, 115221. [Google Scholar] [CrossRef]
  37. Prasad, M.; Tzortzakis, N. Critical review of chemical properties of biochar as a component of growing media. Acta Hortic. 2021, 115–124. [Google Scholar] [CrossRef]
  38. Egnér, H.; Riehm, H.; Domingo, W.R. Untersuchungen über die chemische Bodenanalyse als Grundlage für die Beurteilung des Nährstoffzustandes der Böden. II. Chem. Extraktionsmethoden Phosphor Kaliumbestimmung K. Lantbr. Ann. 1960, 26, 199–215. [Google Scholar]
  39. Zhang, J.; Li, Y.; Chang, S.X.; Qin, H.; Fu, S.; Jiang, P. Understory management and fertilization affected soil greenhouse gas emissions and labile organic carbon pools in a Chinese chestnut plantation. For. Ecol. Manag. 2015, 337, 126–134. [Google Scholar] [CrossRef]
  40. Kanerva, T.; Regina, K.; Rämö, K.; Ojanperä, K.; Manninen, S. Fluxes of N2O, CH4 and CO2 in a meadow ecosystem exposed to elevated ozone and carbon dioxide for three years. Environ. Pollut. 2007, 145, 818–828. [Google Scholar] [CrossRef]
  41. Zhai, L.-M.; Liu, H.-B.; Zhang, J.-Z.; Huang, J.; Wang, B.-R. Long-Term Application of Organic Manure and Mineral Fertilizer on N2O and CO2 Emissions in a Red Soil from Cultivated Maize-Wheat Rotation in China. Agric. Sci. China 2011, 10, 1748–1757. [Google Scholar] [CrossRef]
  42. Araújo, M.D.; de Souza, H.A.; Signor, D.; Muniz, L.C.; Costa, J.B.; de Souza, I.M.; Ribeiro Reis, V.R.; Pereira Brasil, E.; Pompeu, R.E.C.C. Integrated production systems in a Plinthosol: Greenhouse gas emissions and soil quality. Aust. J. Crop Sci. 2022, 16, 184–191. [Google Scholar] [CrossRef]
  43. Shaaban, M.; Khalid, M.S.; Hu, R.; Zhou, M. Effects of water regimes on soil N2O, CH4 and CO2 emissions following addition of dicyandiamide and N fertilizer. Environ. Res. 2022, 212, 113544. [Google Scholar] [CrossRef]
  44. Liao, C.-S.; Xie, Z.-H.; Jien, S.-H. Decomposition and Nutrient Releasing of Biochar Compound Materials in Soil with Different Textures. Processes 2021, 9, 1521. [Google Scholar] [CrossRef]
  45. Ferry, Y.; Herman, M.; Tarigan, E.B.; Pranowo, D. Improvements of soil quality and cocoa productivity with agricultural waste biochar. IOP Conf. Ser. Earth Environ. Sci. 2022, 974, 012045. [Google Scholar] [CrossRef]
  46. Neogi, S.; Sharma, V.; Khan, N.; Chaurasia, D.; Ahmad, A.; Chauhan, S.; Singh, A.; You, S.; Pandey, A.; Bhargava, P.C. Sustainable biochar: A facile strategy for soil and environmental restoration, energy generation, mitigation of global climate change and circular bioeconomy. Chemosphere 2022, 293, 133474. [Google Scholar] [CrossRef]
  47. Lu, T.; Wang, X.; Du, Z.; Wu, L. Impacts of continuous biochar application on major carbon fractions in soil profile of North China Plain’s cropland: In comparison with straw incorporation. Agric. Ecosyst. Environ. 2021, 315, 107445. [Google Scholar] [CrossRef]
  48. Zhang, S.; Fang, Y.; Luo, Y.; Li, Y.; Ge, T.; Wang, Y.; Wang, H.; Yu, B.; Song, X.; Chen, J.; et al. Linking soil carbon availability, microbial community composition and enzyme activities to organic carbon mineralization of a bamboo forest soil amended with pyrogenic and fresh organic matter. Sci. Total Environ. 2021, 801, 149717. [Google Scholar] [CrossRef]
  49. Ahirwal, J.; Kumari, S.; Singh, A.K.; Kumar, A.; Maiti, S.K. Changes in soil properties and carbon fluxes following afforestation and agriculture in tropical forest. Ecol. Indic. 2021, 123, 107354. [Google Scholar] [CrossRef]
  50. Shakoor, A.; Arif, M.S.; Shahzad, S.M.; Farooq, T.H.; Ashraf, F.; Altaf, M.M.; Ahmed, W.; Tufail, M.A.; Ashraf, M. Does biochar accelerate the mitigation of greenhouse gaseous emissions from agricultural soil?—A global meta-analysis. Environ. Res. 2021, 202, 111789. [Google Scholar] [CrossRef]
  51. Lehmann, J.; Cowie, A.; Masiello, C.A.; Kammann, C.; Woolf, D.; Amonette, J.E.; Cayuela, M.L.; Camps-Arbestain, M.; Whitman, T. Biochar in climate change mitigation. Nat. Geosci. 2021, 14, 883–892. [Google Scholar] [CrossRef]
  52. Bolan, N.; Hoang, S.A.; Beiyuan, J.; Gupta, S.; Hou, D.; Karakoti, A.; Joseph, S.; Jung, S.; Kim, K.-H.; Kirkham, M.; et al. Multifunctional applications of biochar beyond carbon storage. Int. Mater. Rev. 2021, 67, 150–200. [Google Scholar] [CrossRef]
  53. Grau-Andrés, R.; Pingree, M.R.; Öquist, M.G.; Wardle, D.A.; Nilsson, M.-C.; Gundale, M.J. Biochar increases tree biomass in a managed boreal forest, but does not alter N2O, CH4, and CO2 emissions. GCB Bioenergy 2021, 13, 1329–1342. [Google Scholar] [CrossRef]
  54. Alskaf, K.; Mooney, S.J.; Sparkes, D.L.; Wilson, P.; Sjögersten, S. Short-term impacts of different tillage practices and plant residue retention on soil physical properties and greenhouse gas emissions. Soil Till. Res. 2021, 206, 104803. [Google Scholar] [CrossRef]
  55. Li, Z.; Zhang, Q.; Qiao, Y.; Du, K.; Li, Z.; Tian, C.; Zhu, N.; Leng, P.; Yue, Z.; Cheng, H.; et al. Influence of straw mulch and no-tillage on soil respiration, its components and economic benefit in a Chinese wheat–maize cropping system. Glob. Ecol. Conserv. 2022, 34, e02013. [Google Scholar] [CrossRef]
  56. Reicosky, D. Tillage-induced CO2 emission from soil. Nutr. Cycl. Agroecosyst. 1997, 49, 273–285. [Google Scholar] [CrossRef]
  57. Kumar, A.; Bhattacharya, T.; Mukherjee, S.; Sarkar, B. A perspective on biochar for repairing damages in the soil–plant system caused by climate change-driven extreme weather events. Biochar 2022, 4, 22. [Google Scholar] [CrossRef]
  58. Abagandura, G.O.; Bansal, S.; Karsteter, A.; Kumar, S. Soil greenhouse gas emissions, organic carbon and crop yield following pinewood biochar and biochar–manure applications at eroded and depositional landscape positions: A field trial in South Dakota, USA. Soil Use Manag. 2022, 38, 487–502. [Google Scholar] [CrossRef]
  59. Zhang, L.; Zhang, W.; Cui, Z.; Hu, Y.; Schmidhalter, U.; Chen, X. Environmental, human health, and ecosystem economic perfor-mance of long-term optimizing nitrogen management for wheat production. J. Clean. Prod. 2021, 311, 127620. [Google Scholar] [CrossRef]
  60. Jamali, M.; Soufizadeh, S.; Yeganeh, B.; Emam, Y. A comparative study of irrigation techniques for energy flow and greenhouse gas (GHG) emissions in wheat agroecosystems under contrasting environments in south of Iran. Renew. Sustain. Energy Rev. 2021, 139, 110704. [Google Scholar] [CrossRef]
  61. Han, Z.; Wang, J.; Xu, P.; Li, Z.; Liu, S.; Zou, J. Differential responses of soil nitrogen-oxide emissions to organic substitution for synthetic fertilizer and biochar amendment in a subtropical tea plantation. GCB Bioenergy 2021, 13, 1260–1274. [Google Scholar] [CrossRef]
  62. Novoa, R.S.A.; Tejeda, H.R. Evaluation of the N2O emissions from N in plant residues as affected by environmental and man-agement factors. Nutr. Cycl. Agroecosyst. 2006, 75, 29–46. [Google Scholar] [CrossRef]
  63. Kim, G.W.; Kim, P.J.; Khan, M.I.; Lee, S.-J. Effect of Rice Planting on Nitrous Oxide (N2O) Emission under Different Levels of Nitrogen Fertilization. Agronomy 2021, 11, 217. [Google Scholar] [CrossRef]
  64. Ma, R.; Yu, K.; Xiao, S.; Liu, S.; Ciais, P.; Zou, J. Data-driven estimates of fertilizer-induced soil NH3, NO and N2O emissions from croplands in China and their climate change impacts. Glob. Chang. Biol. 2022, 28, 1008–1022. [Google Scholar] [CrossRef]
  65. Garcia-Ruiz, R.; Baggs, E.M. N2O emission from soil following combined application of fertiliser-N and ground weed residues. Plant Soil. 2007, 299, 263–274. [Google Scholar] [CrossRef]
  66. Nelissen, V.; Saha, B.K.; Ruysschaert, G.; Boeckx, P. Effect of different biochar and fertilizer types on N2O and NO emissions. Soil Biol. Biochem. 2014, 70, 244–255. [Google Scholar] [CrossRef]
  67. Van Zwieten, L.; Kimber, S.; Morris, S.; Downie, A.; Berger, E.; Rust, J.; Scheer, C. Influence of biochars on flux of N2O and CO2 from Ferrosol. Soil Res. 2010, 48, 555–568. [Google Scholar] [CrossRef]
  68. Montes, F.; Meinen, R.; Dell, C.; Rotz, A.; Hristov, A.N.; Oh, J.; Waghorn, G.; Gerber, P.J.; Henderson, B.; Makkar, H.P.S.; et al. SPECIAL TOPICS—Mitigation of methane and nitrous oxide emissions from animal operations: II. A review of manure management mitigation options. J. Anim. Sci. 2013, 91, 5070–5094. [Google Scholar] [CrossRef] [Green Version]
  69. Helgason, B.L.; Janzen, H.H.; Chantigny, M.H.; Drury, C.F.; Ellert, B.H.; Gregorich, E.G.; Lemke, L.R.; Pattey, E.; Rochette, P.; Wagner-Riddle, C. Toward improved coefficients for pre-dicting direct N2O emissions from soil in Canadian agroecosystems. Nutr. Cycl. Agroecosyst. 2005, 72, 87–99. [Google Scholar] [CrossRef]
  70. González-Cencerrado, A.; Ranz, J.P.; Jiménez, M.T.L.-F.; Gajardo, B.R. Assessing the environmental benefit of a new fertilizer based on activated biochar applied to cereal crops. Sci. Total Environ. 2019, 711, 134668. [Google Scholar] [CrossRef]
  71. Dawar, K.; Fahad, S.; Jahangir, M.M.R.; Munir, I.; Alam, S.S.; Alam Khan, S.; Mian, I.A.; Datta, R.; Saud, S.; Banout, J.; et al. Biochar and urease inhibitor mitigate NH3 and N2O emissions and improve wheat yield in a urea fertilized alkaline soil. Sci. Rep. 2021, 11, 17413. [Google Scholar] [CrossRef]
  72. Smith, K.A.; Conen, F. Impacts of land management on fluxes of trace greenhouse gases. Soil Use Manag. 2004, 20, 255–263. [Google Scholar] [CrossRef]
  73. Shcherbak, I.; Millar, N.; Robertson, G.P. Global metaanalysis of the nonlinear response of soil nitrous oxide (N2O) emissions to fertilizer nitrogen. Proc. Natl. Acad. Sci. USA 2014, 111, 9199–9204. [Google Scholar] [CrossRef] [Green Version]
  74. Sonoki, T.; Furukawa, T.; Jindo, K.; Suto, K.; Aoyama, M.; Sánchez-Monedero, M.Á. Influence of biochar addition on methane me-tabolism during thermophilic phase of composting. J. Basic Microbiol. 2013, 53, 617–621. [Google Scholar] [CrossRef]
  75. Kammann, C.; Ippolito, J.; Hagemann, N.; Borchard, N.; Cayuela, M.L.; Estavillo, J.M.; Fuertes-Mendizabal, T.; Jeffery, S.; Kern, J.; Novak, J.; et al. Biochar as a tool to reduce the agricultural greenhouse-gas burden–knowns, unknowns and future research needs. J. Environ. Eng. Landsc. Manag. 2017, 25, 114–139. [Google Scholar] [CrossRef] [Green Version]
  76. Jeffery, S.; Verheijen, F.G.; Kammann, C.; Abalos, D. Biochar effects on methane emissions from soils: A meta-analysis. Soil Biol. Biochem. 2016, 101, 251–258. [Google Scholar] [CrossRef]
  77. Yu, L.; Tang, J.; Zhang, R.; Wu, Q.; Gong, M. Effects of biochar application on soil methane emission at different soil moisture levels. Biol. Fertil. Soils 2013, 49, 119–128. [Google Scholar] [CrossRef]
  78. Lin, X.W.; Xie, Z.B.; Zheng, J.Y.; Liu, Q.; Bei, Q.C.; Zhu, J.G. Effects of biochar application on greenhouse gas emissions, carbon seques-tration and crop growth in coastal saline soil. Eur. J. Soil Sci. 2015, 66, 329–338. [Google Scholar] [CrossRef]
  79. Feng, Y.; Xu, Y.; Yu, Y.; Xie, Z.; Lin, X. Mechanisms of biochar decreasing methane emission from Chinese paddy soils. Soil Biol. Biochem. 2011, 46, 80–88. [Google Scholar] [CrossRef]
  80. Xie, Z.; Xu, Y.; Liu, G.; Liu, Q.; Zhu, J.; Tu, C.; Amonette, J.E.; Cadisch, G.; Yong, J.W.H.; Hu, S. Impact of biochar application on nitrogen nutrition of rice, greenhouse-gas emissions and soil organic carbon dynamics in two paddy soils of China. Plant Soil 2013, 370, 527–540. [Google Scholar] [CrossRef]
  81. IPCC CWT. Climate Change 2007: Synthesis Report. Contribution of Working Groups I, II and III to the Fourth Assessment Report of the Intergovernmental Panel on Climate Change; IPCC: Geneva, Switzerland, 2007; p. 104. [Google Scholar]
  82. Mukherjee, A.; Lal, R. Biochar Impacts on Soil Physical Properties and Greenhouse Gas Emissions. Agronomy 2013, 3, 313–339. [Google Scholar] [CrossRef] [Green Version]
  83. Xu, H.; Cai, A.; Wu, D.; Liang, G.; Xiao, J.; Xu, M.; Colinet, G.; Zhang, W. Effects of biochar application on crop productivity, soil carbon sequestration, and global warming potential controlled by biochar C: N ratio and soil pH: A global meta-analysis. Soil Tillage Res. 2021, 213, 105125. [Google Scholar] [CrossRef]
  84. Giwa, A.S.; Xu, H.; Chang, F.; Wu, J.; Li, Y.; Ali, N.; Ding, S.; Wang, K. Effect of biochar on reactor performance and methane generation during the anaerobic digestion of food waste treatment at long-run operations. J. Environ. Chem. Eng. 2019, 7, 103067. [Google Scholar] [CrossRef]
  85. Parmar, A.; Nema, P.K.; Agarwal, T. Biochar production from agro-food industry residues: A sustainable approach for soil and environmental management. Curr. Sci. 2014, 107, 1673–1682. [Google Scholar]
  86. Tao, Z.; Li, C.; Li, J.; Ding, Z.; Xu, J.; Sun, X.; Zhou, P.; Zhao, M. Tillage and straw mulching impacts on grain yield and water use efficiency of spring maize in Northern Huang–Huai–Hai Valley. Crop J. 2015, 3, 445–450. [Google Scholar] [CrossRef] [Green Version]
  87. Zhang, D.; Pan, G.; Wu, G.; Kibue, G.W.; Li, L.; Zhang, X.; Zheng, J.; Zheng, J.; Cheng, K.; Joseph, S.; et al. Biochar helps enhance maize productivity and reduce greenhouse gas emissions under balanced fertilization in a rainfed low fertility inceptisol. Chemosphere 2016, 142, 106–113. [Google Scholar] [CrossRef]
  88. Khan, R.; Abbas, A.; Farooque, A.A.; Abbas, F.; Wang, X. Mitigation of Greenhouse Gas Emissions from Agricultural Fields through Bioresource Management. Sustainability 2022, 14, 5666. [Google Scholar] [CrossRef]
  89. Schaufler, G.; Kitzler, B.; Schindlbacher, A.; Skiba, U.; Sutton, M.A.; Zechmeister-Boltenstern, S. Greenhouse gas emissions from European soils under different land use: Effects of soil moisture and temperature. Eur. J. Soil Sci. 2010, 61, 683–696. [Google Scholar] [CrossRef]
  90. Sänger, A.; Geisseler, D.; Ludwig, B. Effects of moisture and temperature on greenhouse gas emissions and C and N leaching losses in soil treated with biogas slurry. Biol. Fertil. Soils 2011, 47, 249–259. [Google Scholar] [CrossRef]
  91. Yuan, H.; Lu, T.; Wang, Y.; Huang, H.; Chen, Y. Influence of pyrolysis temperature and holding time on properties of biochar derived from medicinal herb (radix isatidis) residue and its effect on soil CO2 emission. J. Anal. Appl. Pyrolysis 2014, 110, 277–284. [Google Scholar] [CrossRef]
  92. Chen, C.; Chen, D.; Lam, S.K. Simulation of Nitrous Oxide Emission and Mineralized Nitrogen under Different Straw Retention Conditions Using a Denitrification-Decomposition Model. CLEAN Soil Air Water 2014, 43, 577–583. [Google Scholar] [CrossRef]
Figure 1. Mean monthly precipitation (mm) and air temperature (°C) during 2020 and 2021.
Plants 12 01002 g001
Figure 2. Direct effect of biochar on CO2 emissions at different growth stages of spring barley (2020) and after effects on pea crop (2021). Treatments: control-without amendments; N1-160 kg ha−1 nitrogen fertilizer; N2-120 kg ha−1 nitrogen fertilizer; B-25 t ha−1 biochar; N1B-160 kg ha−1 nitrogen fertilizer plus 25 t ha−1 biochar; N2B-120 kg ha−1 nitrogen fertilizer plus 25 t ha−1 biochar.
Plants 12 01002 g002
Figure 3. Direct effect of biochar on N2O emissions at different growth stages of spring barley (2020) and after effects on pea crop (2021). Treatments: control-without amendments; N1-160 kg ha−1 nitrogen fertilizer; N2-120 kg ha−1 nitrogen fertilizer; B-25 t ha−1 biochar; N1B-160 kg ha−1 nitrogen fertilizer plus 25 t ha−1 biochar; N2B-120 kg ha−1 nitrogen fertilizer plus 25 t ha−1 biochar.
Plants 12 01002 g003
Figure 4. Direct effect of biochar on CH4 emissions at different growth stages of spring barley (2020) and after effects on pea crop (2021). Treatments: control-without amendments; N1-160 kg ha−1 nitrogen fertilizer; N2-120 kg ha−1 nitrogen fertilizer; B-25 t ha−1 biochar; N1B-160 kg ha−1 nitrogen fertilizer plus 25 t ha−1 biochar; N2B-120 kg ha−1 nitrogen fertilizer plus 25 t ha−1 biochar.
Plants 12 01002 g004
Figure 5. Changes in soil moisture content (%) and soil temperature (°C) in different growth stages of spring barley (2020) and pea crops (2021).
Plants 12 01002 g005
Figure 6. Linear relationship of soil CO2, N2O, and CH4 emissions with soil temperature and soil moisture at different growth stages of spring barley (2020) and pea crops (2021).
Plants 12 01002 g006
Table 1. Physiochemical properties of soil and biochar and soil chemical changes during two years.
Soil
Depth (cm)pHTotal N (%)P2O5 (mg/kg)K2O (mg/kg)Organic carbon (%)Mineral nitrogen (mg/kg)NH4-N (mg/kg)NO3-N+N2O-N (mg/kg)
0–106.80.1413.90228.221.02---
0–206.90.1424.03230.110.98---
0–60--- -11.211.2110
Soil Chemical Changes
Before sowing6.80.14142230.171.036.781.259.39
After harvesting6.90.13254232.080.999.202.097.11
Difference−0.10.01−112−1.910.04−2.42−0.84−1.58
Biochar
-pHAsh content (%)Moisture wt. (%)Volatile wt. (%)Residual mass (char formed) wt. (%)Total Mg (g/kg)Organic C (%)
9.132.212.5256.7340.7510.5062.33
P2O5—phosphorus pentoxide; NH4-N—ammonium nitrogen; NO3-N+N2O-N—nitrate plus nitrite.
Table 2. Cumulative CO2–C, N2O–N, and CH4 (mg ha−1 hr−1) emissions under different treatments over the two-year study.
TreatmentCumulative CO2 Cumulative N2OCumulative CH4
2020
Control13262 ± 81.71a10.09 ± 0.17a20.18 ± 0.20ab
N112393 ± 79.03ab9.66 ± 0.19ab19.78 ± 0.17ab
N212487 ± 110.1ab9.66 ± 0.15ab21.13 ± 0.21a
B13685 ± 99.21a9.66 ± 0.17ab20.68 ± 0.13ab
N1B13972 ± 83.52a9.93 ± 0.19ab20.77 ± 0.18ab
N2B12385 ± 91.33ab10.04 ± 0.15a21.20 ± 0.19a
2021
Control8374 ± 91.01a7.05 ± 0.11a14.26 ± 0.20a
N18093 ± 91.26a7.96 ± 0.11a14.18 ± 0.18a
N28264 ± 83.21a7.84 ± 0.13a14.08 ± 0.20a
B6907 ± 74.32b6.64 ± 0.12b13.06 ± 0.16b
N1B6716 ± 63.41b7.00 ± 0.14a13.05 ± 0.15b
N2B6833 ± 78.51b6.97 ± 0.12a14.16 ± 0.19a
Treatments: control-without amendments; N1-160 kg ha−1 nitrogen fertilizer; N2-120 kg ha−1 nitrogen fertilizer; B-25 t ha−1 biochar; N1B-160 kg ha−1 nitrogen fertilizer plus 25 t ha−1 biochar; N2B-120 kg ha−1 nitrogen fertilizer plus 25 t ha−1 biochar. Letters (a, b, and ab) show significant differences among treatments for spring barley (2020) and pea crops (2021) at p ≤ 0.05 (LSD).
Table 3. Effect of biochar on global warming potential (GWP) (mg ha hr−1) during the years of 2020 and 2021.
TreatmentGWP of CO2GWP of CH4GWP of N2O Cumulative GWP
2020
Control60.59 ± 0.117a2.95 ± 0.05a15.85 ± 0.15a79.39 ± 0.112a
N161.68 ± 0.132a2.96 ± 0.06a15.56 ± 0.19a80.20 ± 0.132a
N260.38 ± 0.126a2.94 ± 0.04a15.44 ± 0.12ab78.76 ± 0.144ab
B62.09 ± 0.137a2.94 ± 0.05a15.79 ± 0.20a80.82 ± 0.141a
N1B62.66 ± 0.118a2.95 ± 0.02a15.67 ± 0.14 a 81.28 ± 0.152a
N2B59.58 ± 0.127a2.96 ± 0.07a15.73 ± 0.17a78.27 ± 0.143ab
2021
Control60.81 ± 0.281a2.82 ± 0.09a16.29 ± 0.27ab79.92 ± 0.138a
N159.76 ± 0.256ab2.79 ± 0.08a16.60 ± 0.14a79.15 ± 0.163a
N260.77 ± 0.242ab2.81 ± 0.07a17.46 ± 0.21a81.04 ± 0.140a
B37.17 ± 0.271b2.70 ± 0.09b13.08 ± 0.17b52.95 ± 0.145b
N1B 39.33 ± 0.229b2.74 ± 0.02ab15.29 ± 0.19a57.36 ± 0.134b
N2B37.70 ± 0.217b2.75 ± 0.10ab15.11 ± 0.21a55.53 ± 0.122b
Treatments: control-without amendments; N1-160 kg ha−1 nitrogen fertilizer; N2-120 kg ha−1 nitrogen fertilizer; B-25 t ha−1 biochar; N1B-160 kg ha−1 nitrogen fertilizer plus 25 t ha−1 biochar; N2B-120 kg ha−1 nitrogen fertilizer plus 25 t ha−1 biochar. Letters (a, b, and ab) show significant differences among treatments for spring barley (2020) and pea crops (2021) at p ≤ 0.05 (LSD).
Disclaimer/Publisher’s Note: The statements, opinions and data contained in all publications are solely those of the individual author(s) and contributor(s) and not of MDPI and/or the editor(s). MDPI and/or the editor(s) disclaim responsibility for any injury to people or property resulting from any ideas, methods, instructions or products referred to in the content.

