

High Temperature Alters Phenology, Seed Development and Yield in Three Rice Varieties

Abstract
:1. Introduction
2. Results
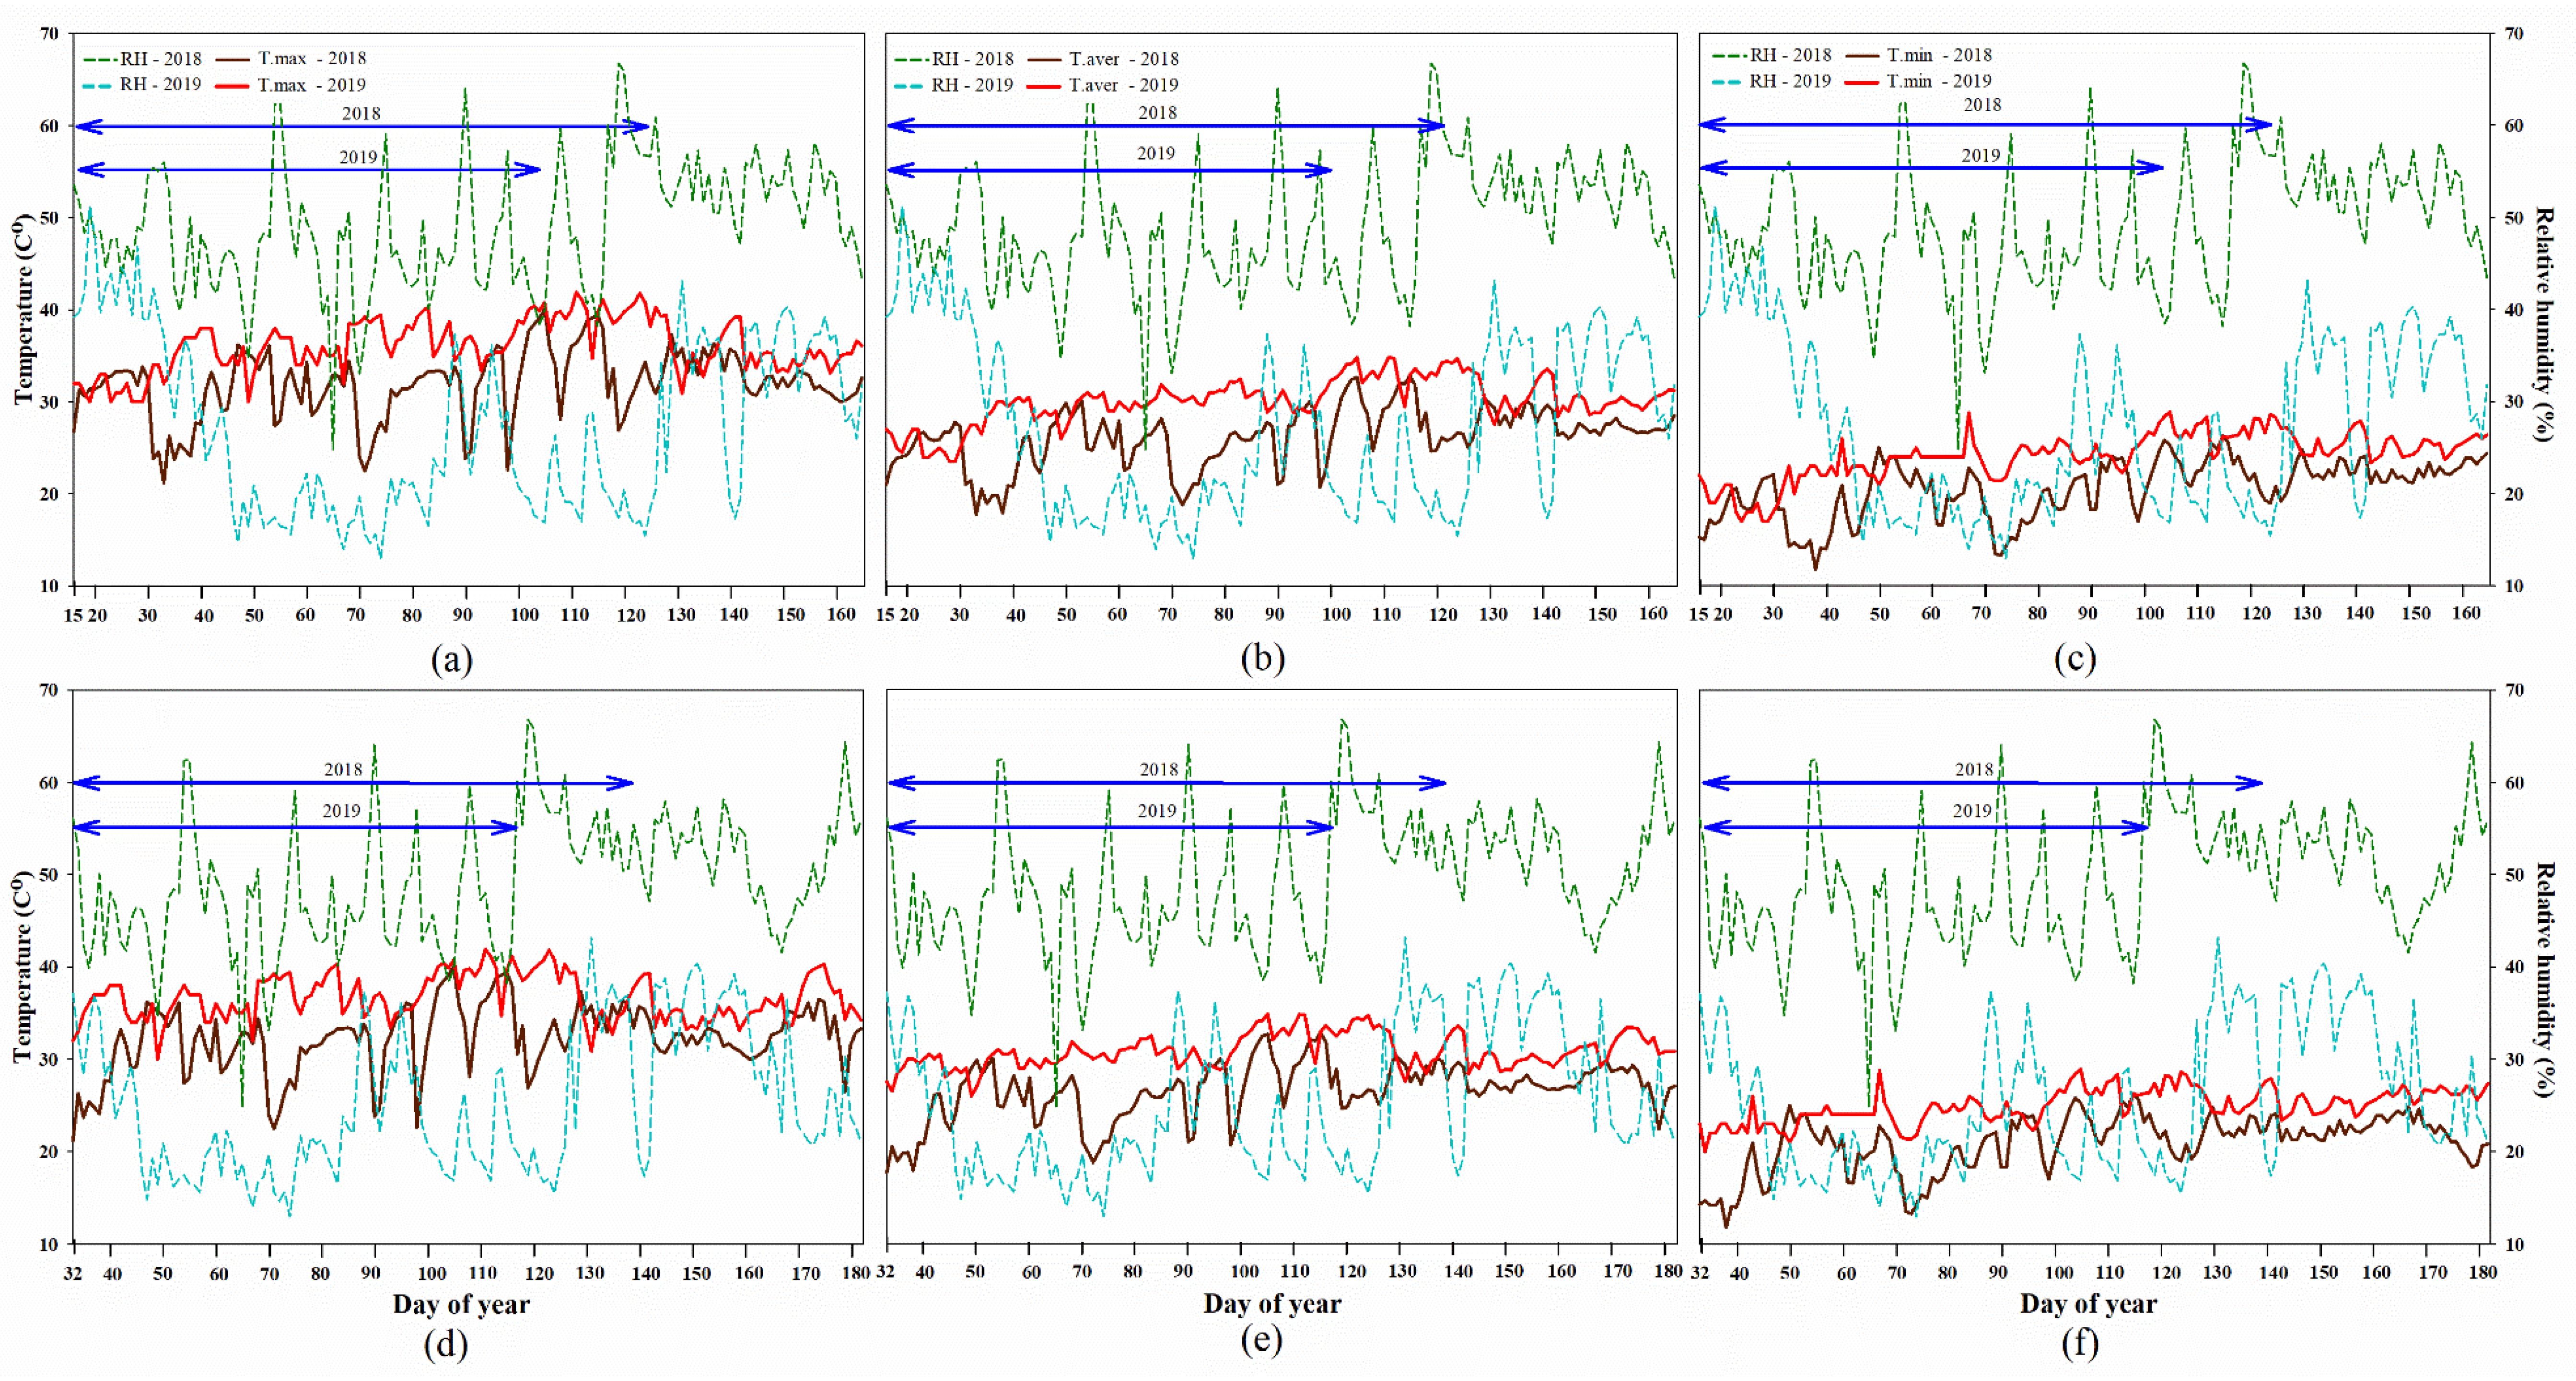
2.1. Climate Data
2.2. High Temperature Influenced Rice Phenology Shift
2.3. High Temperatures Influenced Embryo and Seed Development
2.4. High Temperatures Influenced Yield Components and Yield
2.5. High Temperatures Influenced Grain and Seed Quality
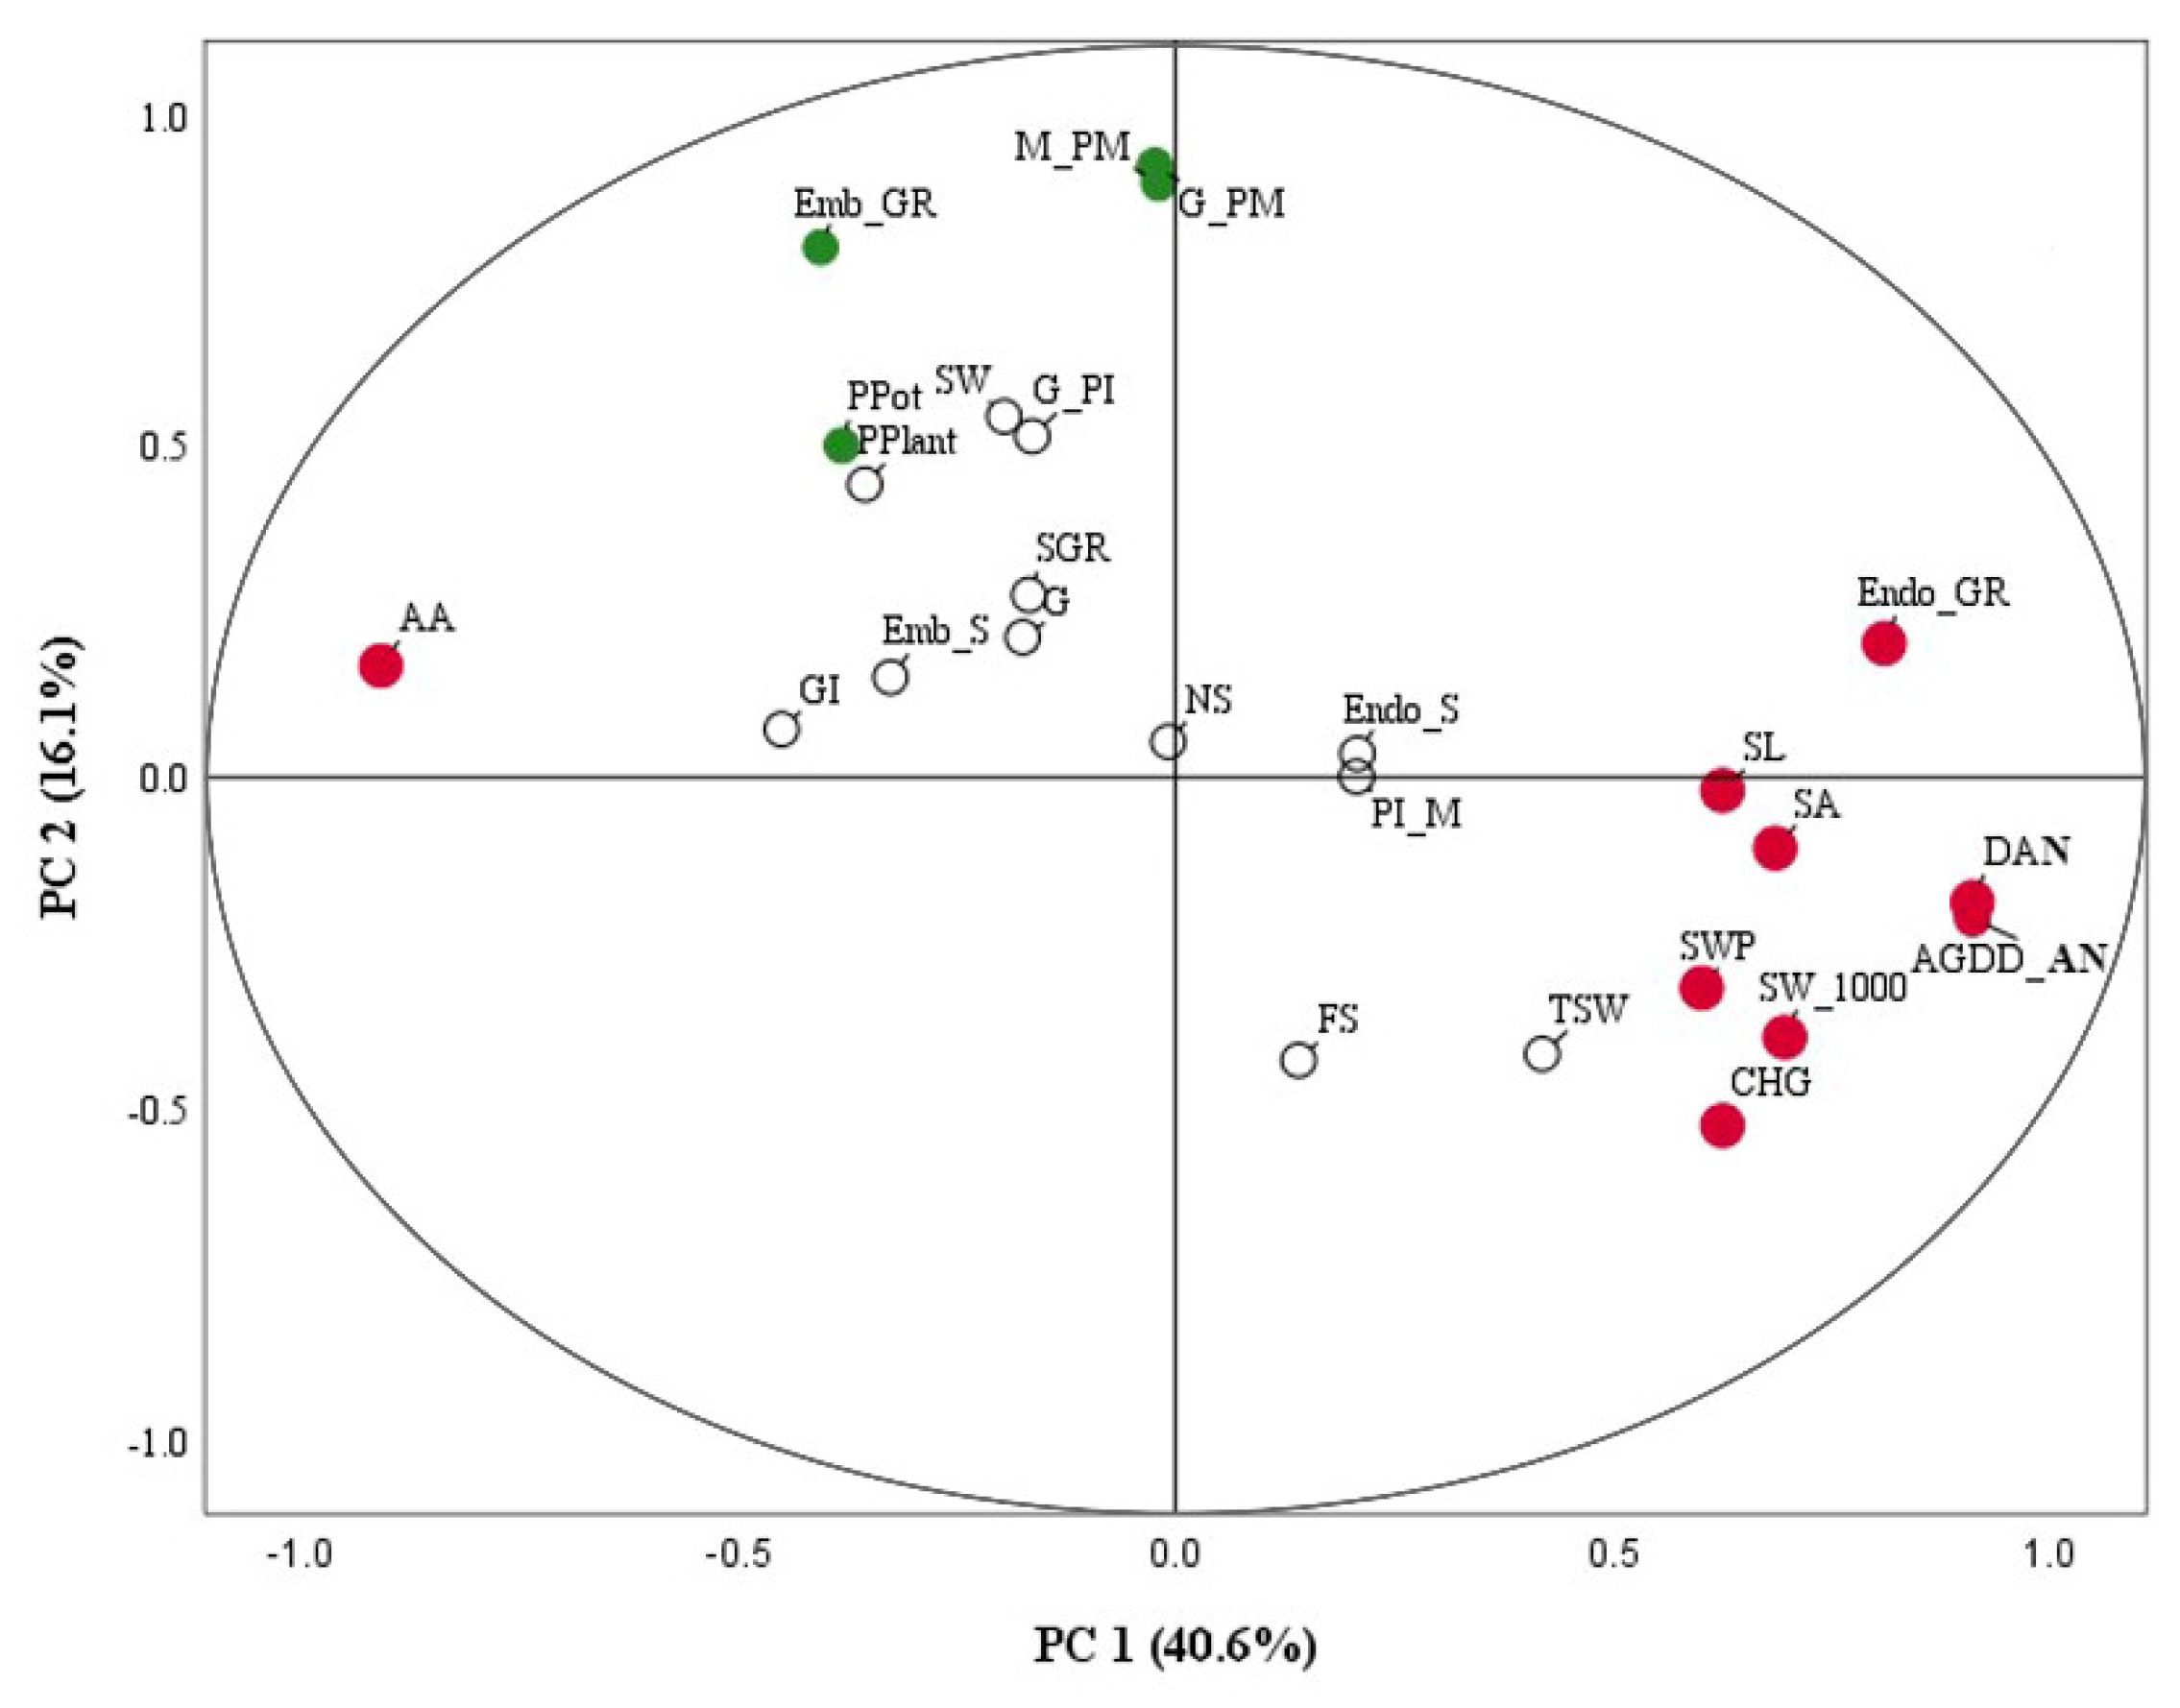
2.6. Relative Level of Phenology, Seed Development and Yield Traits in Rice under High Temperatures
3. Discussion
4. Materials and Methods
4.1. Plant Materials
4.2. Cultivating Conditions and High Temperature Treatment
4.3. Climate Data
4.4. Phenological Data
4.5. Embryo and Seed Development
4.6. Yield and Yield Components
4.7. Grain and Seed Quality
4.7.1. Grain Quality
4.7.2. Seed Quality
Germination Percentage (G)
Germination Index (GI)
Accelerated Aging Test (AA)
Seedling Growth Rate (SGR)
4.8. Statistical Analysis
5. Conclusions
Supplementary Materials
Author Contributions
Funding
Acknowledgments
Conflicts of Interest
References
- McCarthy, J.J.; Canziani, O.F.; Leary, N.A.; Dokken, D.J.; White, K.S. Climate Change 2001: Impacts, Adaptation, and Vulnerability: Contribution of Working Group II to the Third Assessment Report of the Intergovernmental Panel on Climate Change; Cambridge University Press: Cambridge, UK, 2001; Volume 2, pp. 75–416. [Google Scholar]
- FAO. FAO Strategy on Climate Change; FAO: Rome, Italy, 2017; p. 48. [Google Scholar]
- TMD. The Impact of Climate Change on Food Production; Thai Meteorological Department: Bangkok, Thailand, 2017.
- USDA. Grain: World Markets and Trade; The Report of Foreign Agricultural Services, United States Department of Agriculture: Washington, DC, USA, 2019; p. 56.
- FAS. Thailand Rice: Recent Dry Conditions after a Promising Start; Optimism Still Remains for this Crop Season; Commodity Intelligence Report, Foreign Agricultural Service, United States Department of Agriculture: Washington, DC, USA, 2021; p. 14.
- OAE. Agricultural Production Data: Off-Season Rice Varieties—Cultivated Area Harvested Area Productivity and Yield per Rai in 2020; Office of Agricultural Economics: Bangkok, Thailand, 2022.
- OAE. Agricultural Production Data: Off-Season Rice Varieties—Cultivated Area Harvested Area Productivity and Yield per Rai in 2016; Office of Agricultural Economics: Bangkok, Thailand, 2022.
- Yoshida, S. Tropical Climate and Its Influence on Rice; Indian Railway Personnel Service: New Delhi, India, 1978; pp. 1–25.
- Peng, S.; Huang, J.; Sheehy, J.E.; Laza, R.C.; Visperas, R.M.; Zhong, X.; Centeno, G.S.; Khush, G.S.; Cassman, K.G. Rice yields decline with higher night temperature from global warming. Proc. Natl. Acad. Sci. USA 2004, 101, 9971–9975. [Google Scholar] [CrossRef] [PubMed]
- Prasad, P.; Boote, K.; Allen, L., Jr.; Sheehy, J.; Thomas, J. Species, ecotype and cultivar differences in spikelet fertility and harvest index of rice in response to high temperature stress. Field Crops Res. 2006, 95, 398–411. [Google Scholar] [CrossRef]
- Rani, B.A.; Maragatham, N. Effect of elevated temperature on rice phenology and yield. Indian J. Sci. Technol. 2013, 6, 5095–5097. [Google Scholar] [CrossRef]
- Ahmed, N.; Tetlow, I.J.; Nawaz, S.; Iqbal, A.; Mubin, M.; Nawaz ul Rehman, M.S.; Butt, A.; Lightfoot, D.A.; Maekawa, M. Effect of high temperature on grain filling period, yield, amylose content and activity of starch biosynthesis enzymes in endosperm of basmati rice. J. Sci. Food Agric. 2014, 95, 1–7. [Google Scholar] [CrossRef]
- Nguyen, J.-F.; Migonney, V.; Ruse, N.D.; Sadoun, M. Resin composite blocks via high-pressure high-temperature polymerization. Dent. Mater. 2012, 28, 529–534. [Google Scholar] [CrossRef] [PubMed]
- Arshad, M.S.; Farooq, M.; Asch, F.; Krishna, J.S.V.; Prasad, P.V.V.; Siddique, K.H.M. Thermal stress impacts reproductive development and grain yield in rice. Plant Physiol. Biochem. 2017, 115, 57–72. [Google Scholar] [CrossRef]
- Johkan, M.; Oda, M.; Maruo, T.; Shinohara, Y. Crop production and Global Warming. In Global Warming Impacts—Case Studies on the Economy, Human Health, and on Urban and Natural Environments; Casalegno, S., Ed.; In Tech: Rijeka, Croatia, 2011; pp. 139–152. [Google Scholar]
- Jagadish, S.; Craufurd, P.; Wheeler, T. High temperature stress and spikelet fertility in rice (Oryza sativa L.). J. Exp. Bot. 2007, 58, 1627–1635. [Google Scholar] [CrossRef]
- Wopereis, M.; Defoer, T.; Idinoba, P.; Diack, S.; Dugué, M. Participatory Learning and Action Research (PLAR) for Integrated Rice Management (IRM) in Inland Valleys of Sub-Saharan Africa: Technical Manual; WARDA Cotonou Benin/IFDC: Muscle Shoals, AL, USA, 2007. [Google Scholar]
- Oh-e, I.; Saitoh, K.; Kuroda, T. Effects of high temperature on growth, yield and dry-matter production of rice grown in the paddy field. Plant Prod. Sci. 2007, 10, 412–422. [Google Scholar] [CrossRef]
- Mitsui, T.; Yamakawa, H.; Kobata, T. Molecular physiological aspects of chalking mechanism in rice grains under high-temperature stress. Plant Prod. Sci. 2016, 19, 22–29. [Google Scholar] [CrossRef]
- Shi, W.; Muthurajan, R.; Rahman, H.; Selvam, J.; Peng, S.; Zou, Y.; Jagadish, K.S. Source–sink dynamics and proteomic reprogramming under elevated night temperature and their impact on rice yield and grain quality. New Phytol. 2013, 197, 825–837. [Google Scholar] [CrossRef] [PubMed]
- Fahad, S.; Bajwa, A.A.; Nazir, U.; Anjum, S.A.; Farooq, A.; Zohaib, A.; Sadia, S.; Nasim, W.; Adkins, S.; Saud, S. Crop production under drought and heat stress: Plant responses and management options. Front. Plant Sci. 2017, 8, 1147. [Google Scholar] [CrossRef]
- Jiang, H.; Dian, W.; Wu, P. Effect of high temperature on fine structure of amylopectin in rice endosperm by reducing the activity of the starch branching enzyme. Phytochemistry 2003, 63, 53–59. [Google Scholar] [CrossRef] [PubMed]
- Johkan, M.; Oda, M.; Maruo, T.; Shinohara, Y. Crop Production and Global Warming; InTech Europe: Rijeka, Croatia, 2011; pp. 139–152. [Google Scholar]
- Gutterman, Y. Maternal effects on seeds during development. In Seeds: The Ecology of Regeneration in Plant Communities; Fenner, M., Ed.; CABI: Wallingford, UK, 2000; Volume 2, pp. 59–84. [Google Scholar]
- Hampton, J.G.; Boelt, B.; Rolston, M.P.; Chastain, T.G. Effects of elevated CO2 and temperature on seed quality. J. Agric. Sci. 2013, 151, 154–162. [Google Scholar] [CrossRef]
- Begcy, K.; Sandhu, J.; Walia, H. Transient heat stress during early seed development primes germination and seedling establishment in rice. Front. Plant Sci. 2018, 9, 1768. [Google Scholar] [CrossRef] [PubMed]
- Ellis, R.H. Rice seed quality development and temperature during late development and maturation. Seed Sci. Res. 2011, 21, 95–101. [Google Scholar] [CrossRef]
- Ahmad, S.; Abbas, G.; Ahmed, M.; Fatima, Z.; Anjum, M.A.; Rasul, G.; Khan, M.A.; Hoogenboom, G. Climate warming and management impact on the change of phenology of the rice-wheat cropping system in Punjab, Pakistan. Field Crops Res. 2019, 230, 46–61. [Google Scholar] [CrossRef]
- Ahmad, S.; Abbas, Q.; Abbas, G.; Fatima, Z.; Atique Ur, R.; Naz, S.; Younis, H.; Khan, R.J.; Nasim, W.; Habib Ur Rehman, M.; et al. Quantification of Climate Warming and Crop Management Impacts on Cotton Phenology. Plants 2017, 6, 7. [Google Scholar] [CrossRef]
- Wang, H.L.; Gan, Y.T.; Wang, R.Y.; Niu, J.Y.; Zhao, H.; Yang, Q.G.; Li, G.C. Phenological trends in winter wheat and spring cotton in response to climate changes in northwest China. Agric. For. Meteorol. 2008, 148, 1242–1251. [Google Scholar] [CrossRef]
- Zacharias, M.; Singh, S.; Naresh Kumar, S.; Harit, R.; Aggarwal, P. Impact of elevated temperature at different phenological stages on the growth and yield of wheat and rice. Indian J. Plant Physiol. 2010, 15, 350. [Google Scholar]
- Wu, X.; Liu, J.; Li, D.; Liu, C.M. Rice caryopsis development II: Dynamic changes in the endosperm. J. Integr. Plant Biol. 2016, 58, 786–798. [Google Scholar] [CrossRef]
- Wu, X.; Liu, J.; Li, D.; Liu, C.M. Rice caryopsis development I: Dynamic changes in different cell layers. J. Integr. Plant Biol. 2016, 58, 772–785. [Google Scholar] [CrossRef] [PubMed] [Green Version]
- Hoshikawa, K. The growing Rice Plant: An Anatomical Monograph; Nobunkyo Press: Tokyo, Japan, 1989; pp. 199–205. [Google Scholar]
- Folsom, J.J.; Begcy, K.; Hao, X.; Wang, D.; Walia, H. Rice Fertilization-Independent Endosperm1 regulates seed size under heat stress by controlling early endosperm development. Plant Physiol. 2014, 165, 238–248. [Google Scholar] [CrossRef]
- Djanaguiraman, M.; Prasad, P.V.V. Ethylene production under high temperature stress causes premature leaf senescence in soybean. Funct. Plant Biol. 2010, 37. [Google Scholar] [CrossRef]
- Mohammed, A.R.; Tarpley, L. High night temperature and plant growth regulator effects on spikelet sterility, grain characteristics and yield of rice (Oryza sativa L.) plants. Can. J. Plant Sci. 2011, 91, 283–291. [Google Scholar] [CrossRef]
- Coast, O.; Ellis, R.H.; Murdoch, A.J.; Quinones, C.; Jagadish, K.S.V. High night temperature induces contrasting responses for spikelet fertility, spikelet tissue temperature, flowering characteristics and grain quality in rice. Funct Plant Biol 2015, 42, 149–161. [Google Scholar] [CrossRef]
- Cliu, W.; Yin, T.; Zhao, Y.; Wang, X.; Wang, K.; Shen, Y.; Ding, Y.; Tang, S. Effects of high temperature on rice grain development and quality formation based on proteomics comparative analysis under field warming. Front. Plant Sci. 2021, 12, 746180. [Google Scholar] [CrossRef]
- Tashiro, T.; Wardlaw, I.F. The effect of high temperature on kernel dimensions and the type and occurrence of kernel damage in rice. Aust. J. Agric. Res. 1991, 42, 485–496. [Google Scholar] [CrossRef]
- Inouchi, N.; Ando, H.; Asaoka, M.; Okuno, K.; Fuwa, H. The effect of environmental temperature on distribution of unit chains of rice amylopectin. Starch-Stärke 2000, 52, 8–12. [Google Scholar] [CrossRef]
- Mahendran, R.; Veerabadhiran, P.; Robin, S.; Raveendran, M. Research. Principal component analysis of rice germplasm accessions under high temperature stress. J. Agric. Sci. Res. (IJASR) 2015, 5, 355–359. [Google Scholar]
- McMaster, G.S.; Wilhelm, W. Growing degree-days: One equation, two interpretations. Agric. For. Meteorol. 1997, 87, 291–300. [Google Scholar] [CrossRef]
- Redona, D. Standard Evaluation System (SES) for Rice, 5th ed.; International Rice Research Institute, Los Baños: Laguna, Phillppines, 2013; p. 55. [Google Scholar]
- Ogawa, Y.; Orts, W.; Glenn, G.; Wood, D. A simple method for studying whole sections of rice grain. Biotech. Histochem. 2003, 78, 237–242. [Google Scholar] [CrossRef] [PubMed]
- Yeung, E.C.T.; Stasolla, C.; Sumner, M.J.; Huang, B.Q. Plant Microtechniques and Protocols; Springer: Cham, Switzerland, 2015. [Google Scholar]
- ISTA. International Rules for Seed Testing—Rules Testing 2013; International Seed Testing Association: Bassersdorf, Switzerland, 2013. [Google Scholar]
- Abeysiriwardena, D.d.Z.; Ohba, K.; Maruyama, A. Influence of temperature and relative humidity on grain sterility in rice. J. Natl. Sci. Found. Sri Lanka 2002, 30, 33–41. [Google Scholar] [CrossRef] [Green Version]
- Copeland, L.o.; McDonald, M.B. Principles of Seed Science and Technology; Springer Science & Business Media: New York, NY, USA, 2001; p. 467. [Google Scholar]
- Hampton, J.G.; Tekrony, D.M. Handbook of Vigour Test Methods; The International Seed Testing Association: Zurich, Switzerland, 1995. [Google Scholar]


| Planting Date (PD) | Rice Varieties/Experimental Year | |||||||||||
|---|---|---|---|---|---|---|---|---|---|---|---|---|
| PTT1 | SP1 | CN1 | All Varieties | |||||||||
| 2018 | 2019 | t-Test | 2018 | 2019 | t-Test | 2018 | 2019 | t-Test | 2018 | 2019 | t-Test | |
| Germination-PI | ||||||||||||
| PDI | 46.88 ± 0.63aA | 43.75 ± 1.61aA | ns | 43.13 ± 1.57aA | 46.25 ± 0.72bA | ns | 41.88 ± 0.63aA | 41.25 ± 1.61aA | ns | 43.96 ± 0.19aA | 43.75 ± 0.19 aA | ns |
| PDII | 45.63 ± 1.20aA | 48.75 ± 1.61aA | ns | 43.75 ± 0.72aB | 51.88 ± 1.57aA | ** | 42.50 ± 1.02aA | 45.63 ± 1.20aA | ns | 43.96 ± 0.00 aA | 48.75 ± 0.01 aA | ns |
| t-test | ns | ns | ns | * | ns | ns | ns | ns | ||||
| Average | 46.25 ± 0.67A | 46.25 ± 1.42A | ns | 43.44 ± 0.81B | 49.06 ± 1.33A | ** | 42.19 ± 0.57A | 43.44 ± 1.24A | ns | 43.96 ± 0.13A | 46.25 ± 0.01A | ns |
| PI-Milky | ||||||||||||
| PDI | 38.25 ± 1.61aA | 30.63 ± 1.20aB | ** | 38.88 ± 1.20aA | 30.00 ± 1.02aB | ** | 37.00 ± 1.02aA | 30.63 ± 1.57aB | * | 38.04 ± 0.19 aA | 30.42 ± 0.19 aA | ns |
| PDII | 36.38 ± 0.63aA | 27.50 ± 1.77aB | ** | 41.38 ± 1.20aA | 28.13 ± 0.63aB | ** | 37.00 ± 1.02aA | 30.63 ± 1.20aB | ** | 38.25 ± 0.00 aA | 28.75 ± 0.01 aA | ns |
| t-test | ns | ns | ns | ns | ns | ns | ns | ns | ||||
| Average | 37.31 ± 0.88A | 29.06 ± 1.15B | ** | 40.13 ± 0.92A | 29.06 ± 0.66B | ** | 37.00 ± 0.67A | 30.63 ± 0.92B | ** | 38.15 ± 0.13A | 29.58 ± 0.02A | ns |
| Milky-PM | ||||||||||||
| PDI | 15.25 ± 0.48aA | 13.75 ± 0.48aA | ns | 15.00 ± 0.41aA | 12.25 ± 0.63aB | ** | 13.50 ± 0.65aA | 10.00 ± 0.71aB | * | 14.58 ± 0.19aA | 12.00 ± 0.19aA | ns |
| PDII | 14.00 ± 0.71aA | 10.25 ± 0.48bB | ** | 13.50 ± 0.65aA | 12.25 ± 0.25aA | ns | 13.50 ± 0.87aA | 10.00 ± 0.58aB | * | 13.67 ± 0.01aA | 10.83 ± 0.01aA | ns |
| t-test | ns | ** | ns | ns | ns | ns | ns | ns | ||||
| Average | 14.63 ± 0.46A | 12.00 ± 0.73B | ** | 14.25 ± 0.45A | 12.25 ± 0.31B | ** | 13.50 ± 0.50A | 10.00 ± 0.42B | ** | 14.13 ± 0.13A | 11.42 ± 0.01B | * |
| Germination-PM | ||||||||||||
| PDI | 100.38 ± 0.19aA | 88.13 ± 0.19aB | * | 97.00 ± 0.19bA | 88.50 ± 0.19bB | * | 92.38 ± 0.19bA | 81.88 ± 0.19aA | ns | 96.58 ± 0.19aA | 86.17 ± 0.19aA | ns |
| PDII | 96.00 ± 0.00bA | 86.50 ± 0.00aA | ns | 98.63 ± 0.05aA | 92.25 ± 0.01aB | * | 93.00 ± 0.00aA | 86.25 ± 0.01aA | ns | 95.88 ± 0.00bA | 88.33 ± 0.00aA | ns |
| t-test | * | ns | * | * | * | ns | * | ns | ||||
| Average | 98.19 ± 0.52A | 87.31 ± 0.03B | ** | 97.81 ± 0.52A | 90.38 ± 0.02B | ** | 92.69 ± 0.52A | 84.06 ± 0.02B | ** | 96.23 ± 0.13A | 87.25 ± 0.01B | ** |
| Planting Date (PD) | Rice Varieties | |||||||||||
|---|---|---|---|---|---|---|---|---|---|---|---|---|
| PTT1 | SP1 | CN1 | All Varieties | |||||||||
| 2018 | 2019 | t-Test | 2018 | 2019 | t-Test | 2018 | 2019 | t-Test | 2018 | 2019 | t-Test | |
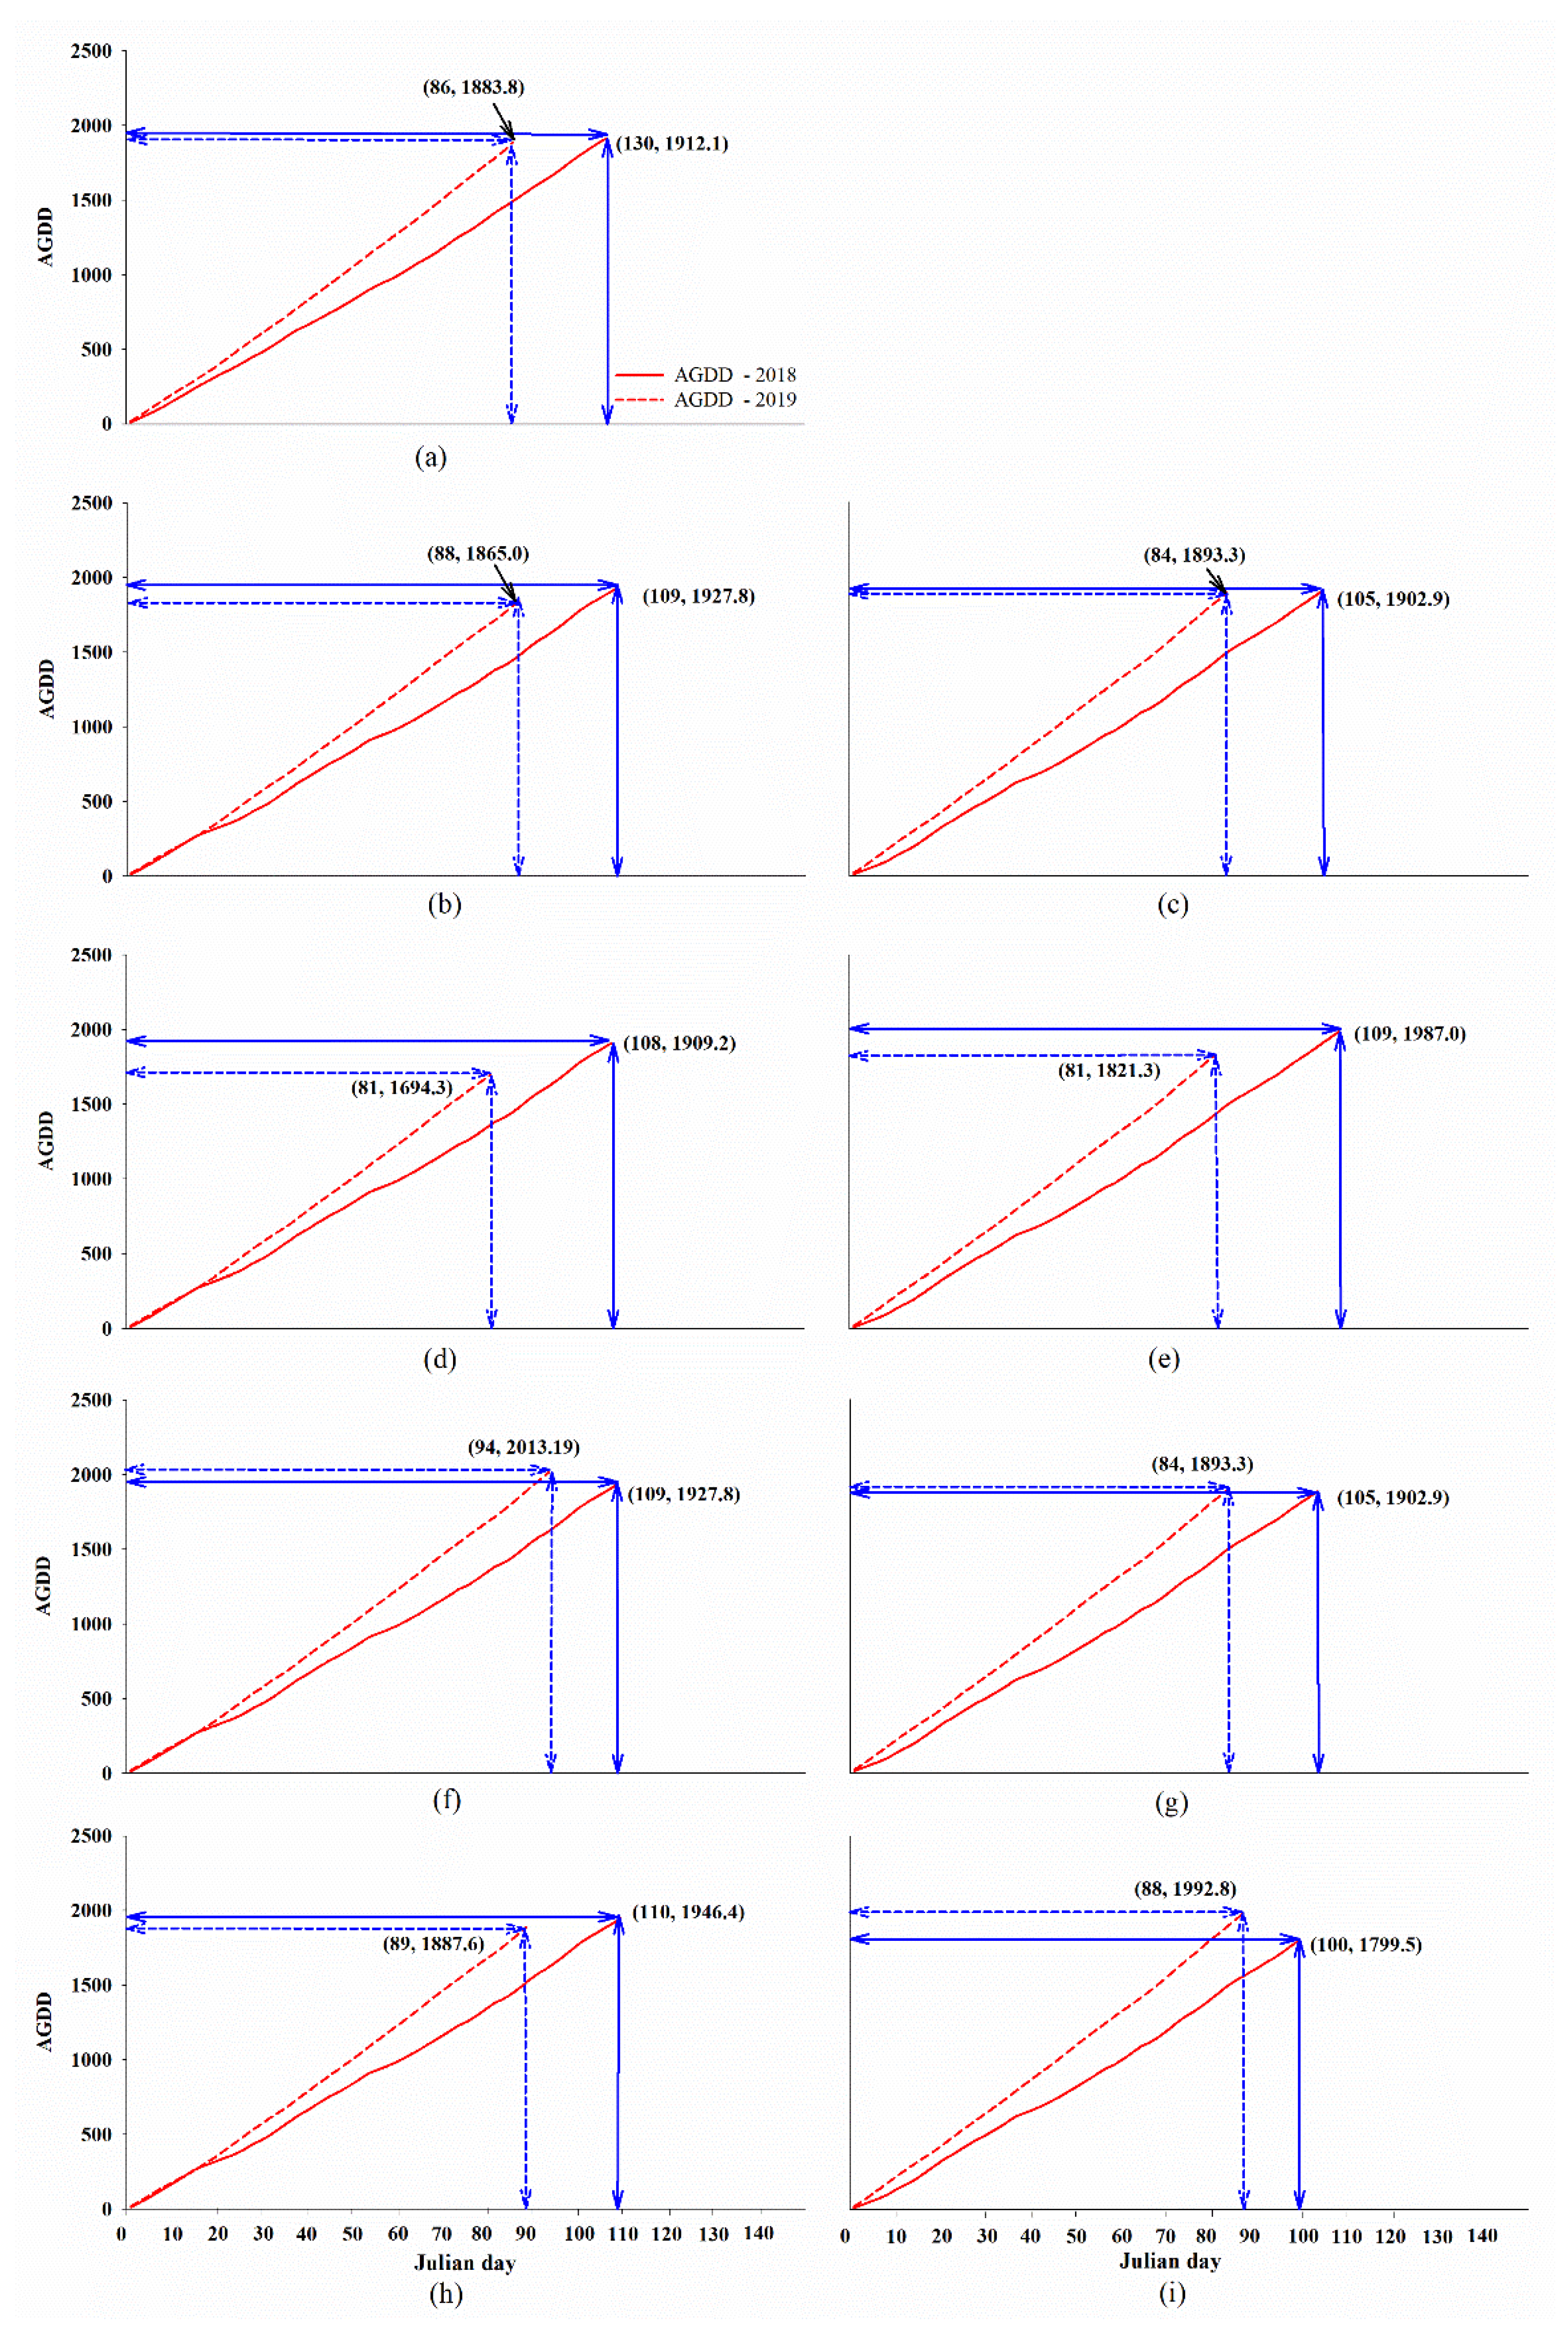
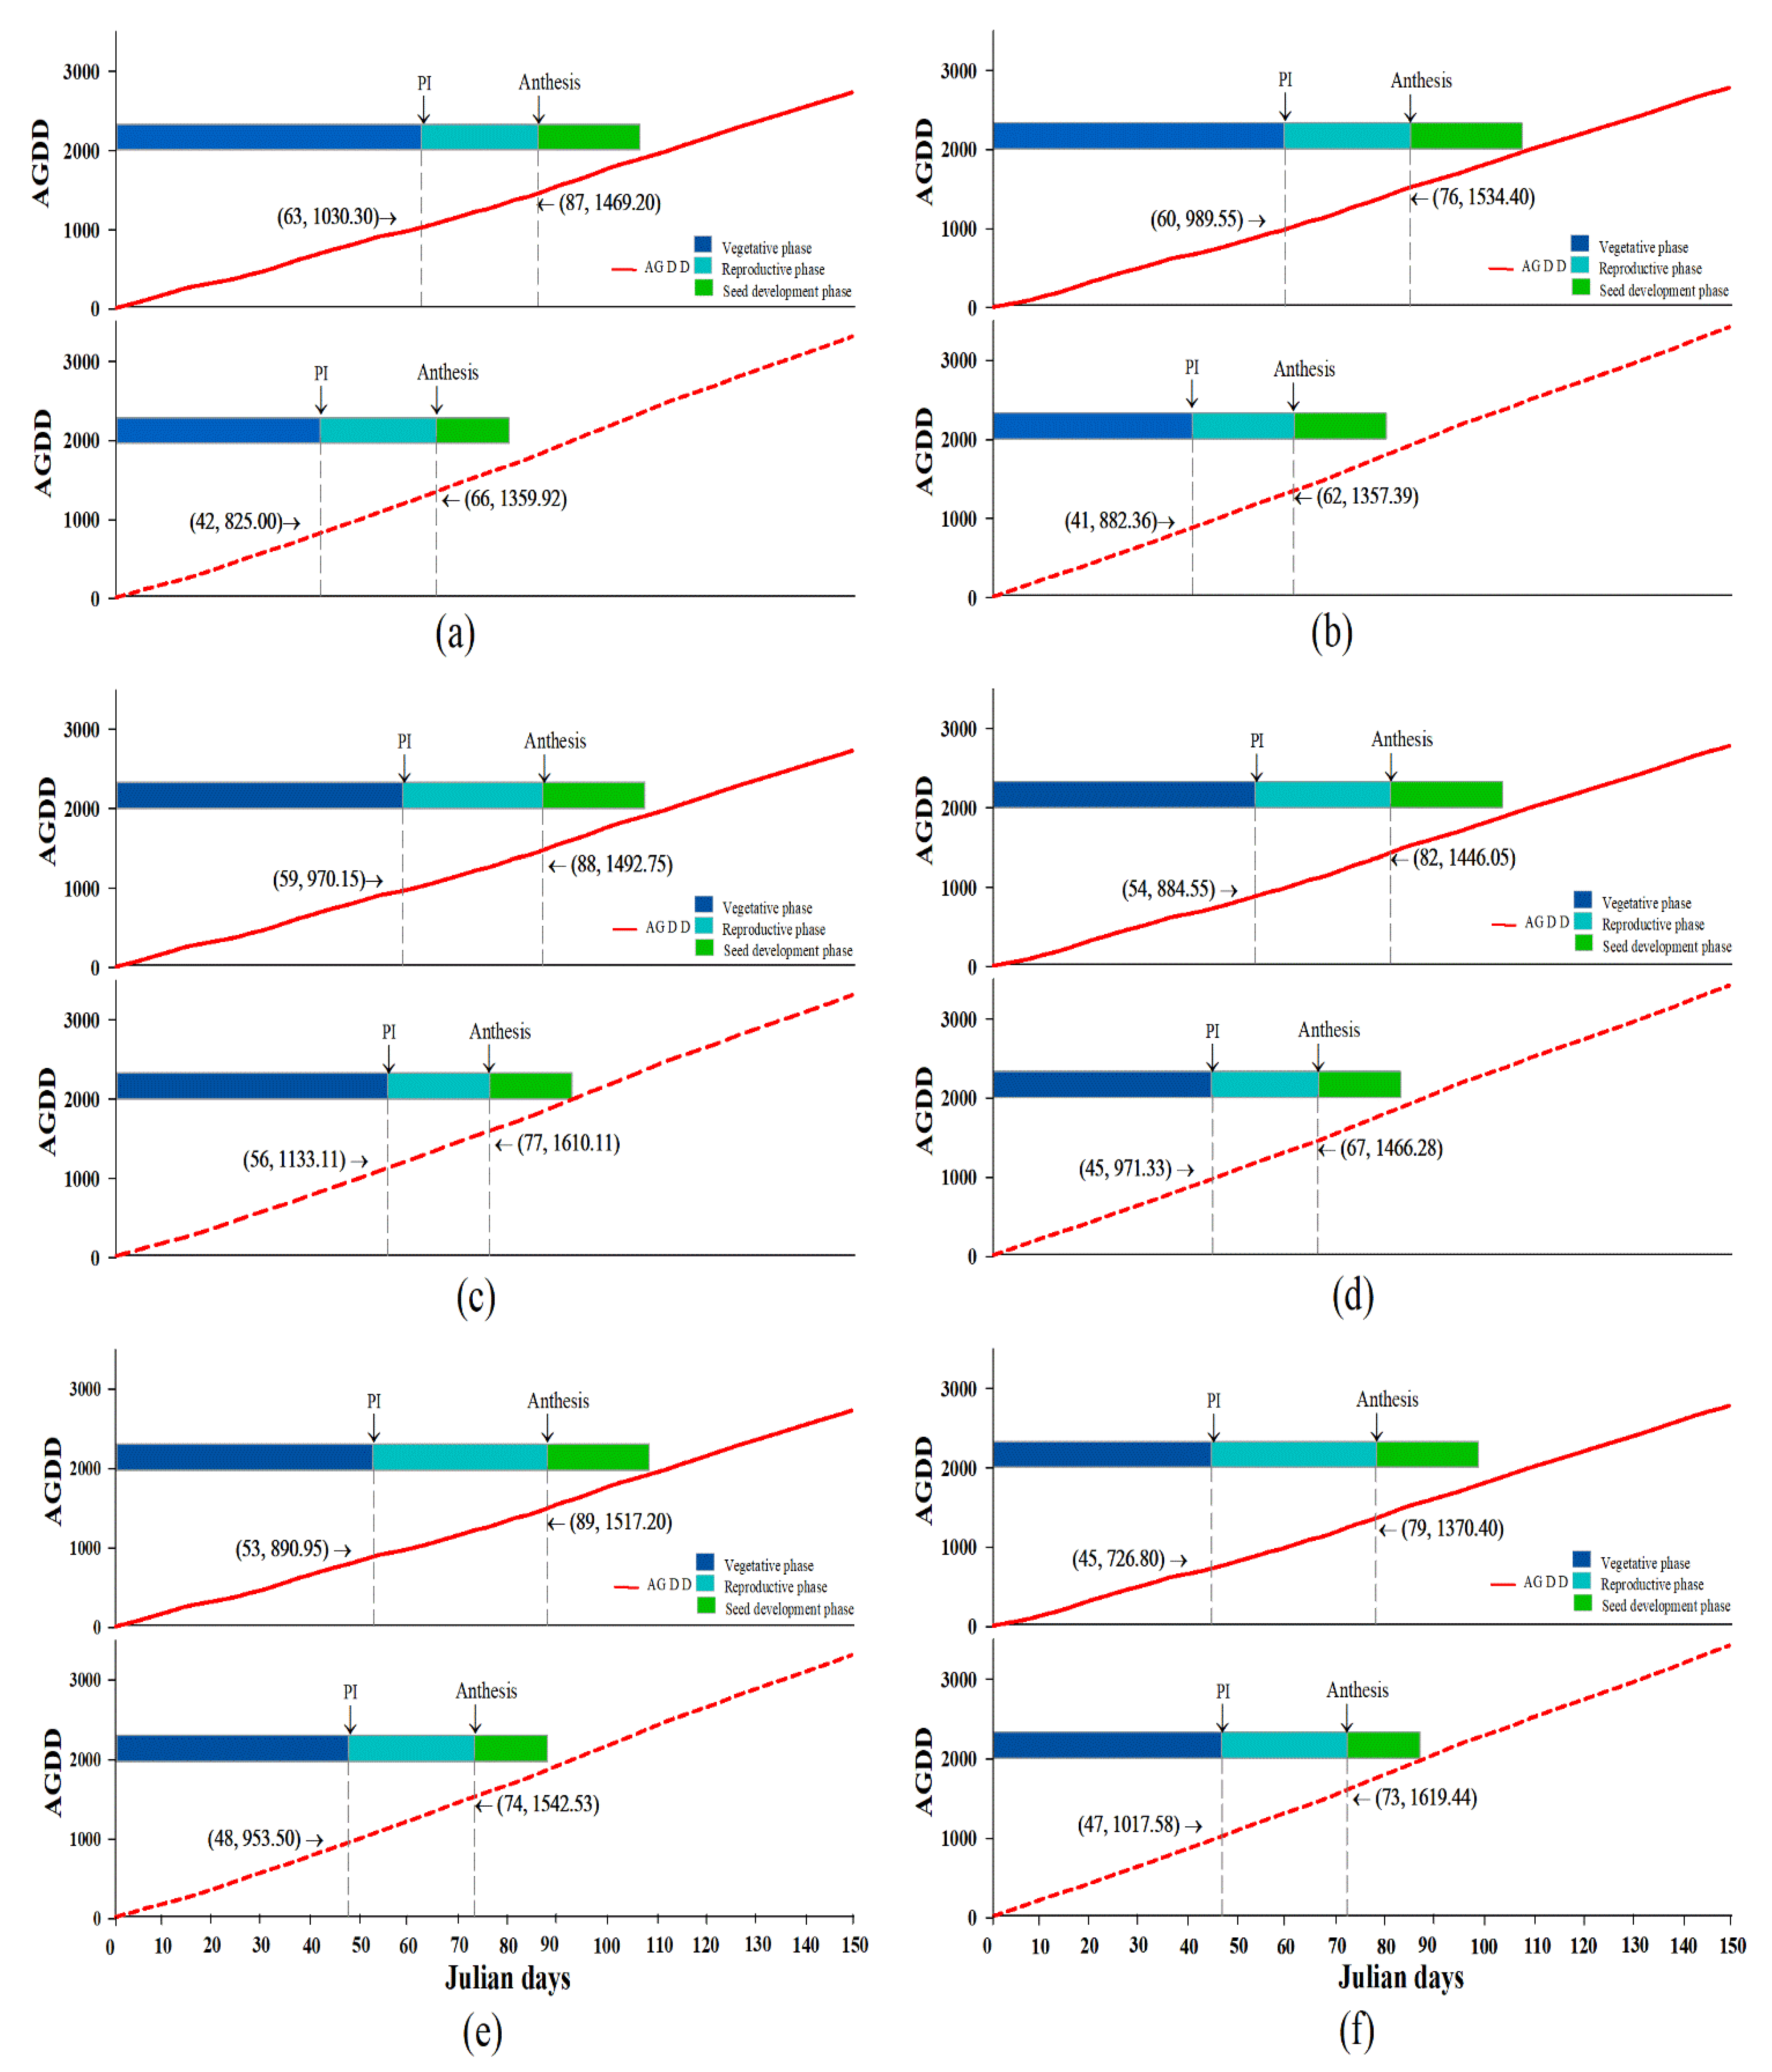
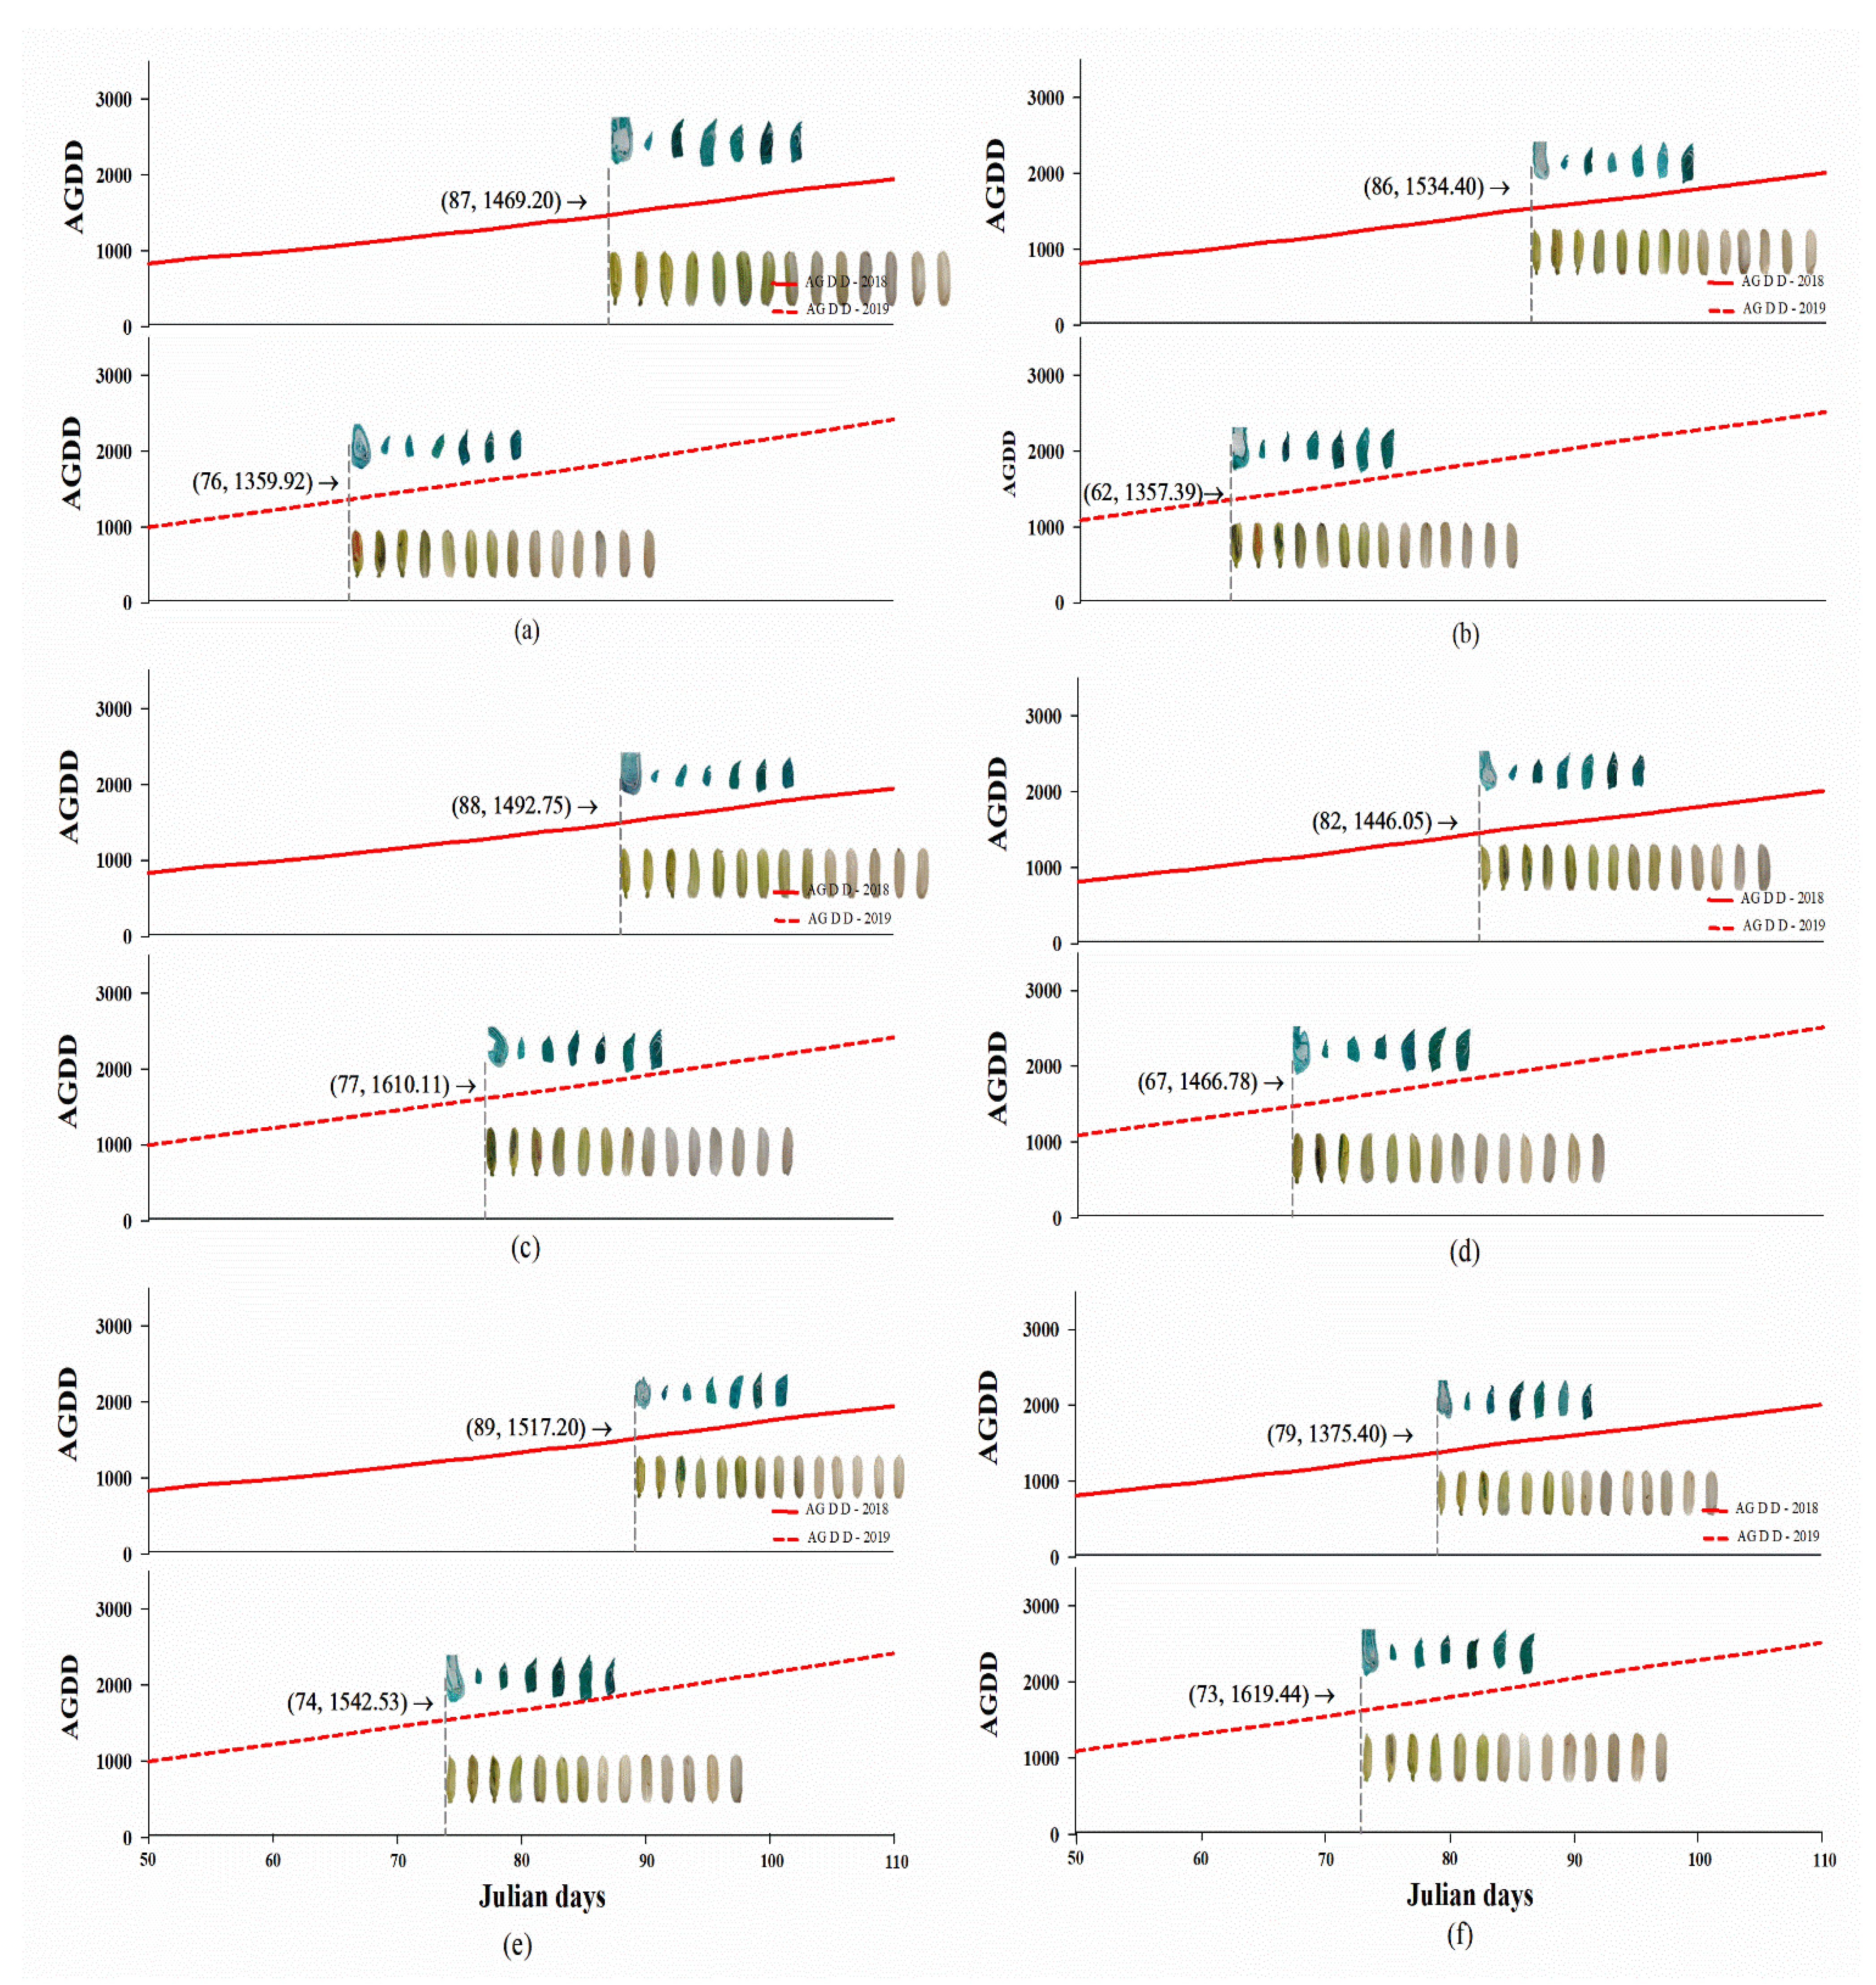
| Day of anthesis beginning embryonic and seed development (DAS) | ||||||||||||
| PD1 | 87.25 ± 2.02aA | 66.25 ± 2.06aB | ** | 87.75 ± 0.75aA | 77.00 ± 0.00aB | ** | 89.00 ± 1.68aA | 73.50 ± 1.50aB | ** | 88.00 ± 0.85aA | 72.25 ± 1.55aB | ** |
| PD2 | 85.75 ± 1.89aA | 61.75 ± 0.75aB | ** | 82.25 ± 2.59aA | 67.25 ± 0.85bB | ** | 79.25 ± 2.69bA | 72.50 ± 1.66aA | ns | 82.42 ± 1.49bA | 67.17 ± 1.46bB | ** |
| t-test | ns | ns | ns | ** | * | ns | ** | * | ||||
| Average | 86.50 ± 1.31A | 64.00 ± 1.32B | ** | 85.00 ± 1.63A | 72.13 ± 1.88B | ** | 84.13 ± 2.36A | 73.00 ± 1.05B | ** | 85.21 ± 1.02A | 69.71 ± 1.17B | ** |
| AGDD at anthesis day influenced embryonic and seed development after anthesis (oC) | ||||||||||||
| PD1 | 1480.76 ± 43.20aA | 1366.08 ± 48.05aA | ns | 1487.61 ± 17.68aB | 1610.11 ± 0.00aA | ** | 1519.61 ± 37.20aA | 1532.86 ± 32.69aA | ns | 1496.00 ± 18.71aA | 1503.02 ± 35.35aA | ns |
| PD2 | 1522.19 ± 37.13aA | 1351.99 ± 15.86aB | ** | 1443.78 ± 53.57aA | 1473.16 ± 20.19bA | ns | 1385.18 ± 58.10aB | 1604.96 ± 42.08aA | * | 1450.38 ± 31.30aA | 1476.70 ± 34.51aA | ns |
| t-test | ns | ns | ns | ** | ns | ns | ns | ns | ||||
| Average | 1501.48 ± 27.51A | 1359.03 ± 23.57B | ** | 1465.69 ± 27.40A | 1541.64 ± 27.52A | ns | 1452.39 ± 40.81B | 1568.91 ± 28.18A | * | 1473.19 ± 18.45A | 1489.86 ± 24.32A | ns |
| Planting Date (PD) | Rice Varieties | |||||||||||
|---|---|---|---|---|---|---|---|---|---|---|---|---|
| PTT1 | SP1 | CN1 | All Varieties | |||||||||
| 2018 | 2019 | t-Test | 2018 | 2019 | t-Test | 2018 | 2019 | t-Test | 2018 | 2019 | t-Test | |
| embryo size (mm2/seed) | ||||||||||||
| PD1 | 3.55 ± 0.04aA | 3.05 ± 0.05aB | ** | 3.32 ± 0.09aA | 3.06 ± 0.06aB | * | 3.23 ± 0.08aA | 2.94 ± 0.05bB | * | 3.37 ± 0.06aA | 3.01 ± 0.01bA | ns |
| PD2 | 3.56 ± 0.14aA | 3.15 ± 0.06aB | * | 3.40 ± 0.10aA | 3.12 ± 0.04aB | * | 3.34 ± 0.09aA | 3.15 ± 0.04aA | ns | 3.43 ± 0.07aA | 3.14 ± 0.02aA | ns |
| t-test | ns | ns | ns | ns | ns | * | ns | * | ||||
| Average | 3.56 ± 0.07A | 3.10 ± 0.04B | ** | 3.36 ± 0.07A | 3.09 ± 0.03B | ** | 3.29 ± 0.06A | 3.04 ± 0.05B | ** | 3.40 ± 0.05A | 3.08 ± 0.03B | ** |
| embryo growth rate (mm2/day) | ||||||||||||
| PD1 | 0.29 ± 0.01aA | 0.25 ± 0.01aB | ** | 0.27 ± 0.01aA | 0.24 ± 0.01aB | * | 0.27 ± 0.01aA | 0.24 ± 0.01aB | * | 0.28 ± 0.01aA | 0.25 ± 0.01bB | ** |
| PD2 | 0.29 ± 0.01aA | 0.26 ± 0.01aB | * | 0.28 ± 0.01aA | 0.26 ± 0.01aA | ns | 0.28 ± 0.01aA | 0.24 ± 0.01aB | ** | 0.28 ± 0.01aA | 0.25 ± 0.01aB | ** |
| t-test | ns | ns | ns | ns | ns | ns | ns | * | ||||
| Average | 0.29 ± 0.01A | 0.26 ± 0.01B | ** | 0.28 ± 0.01A | 0.25 ± 0.01B | ** | 0.27 ± 0.01A | 0.24 ± 0.01B | ** | 0.28 ± 0.01A | 0.25 ± 0.01B | ** |
| endosperm size (mm2/seed) | ||||||||||||
| PD1 | 16.05 ± 0.89aA | 14.76 ± 0.43aA | ns | 16.62 ± 0.30aA | 13.16 ± 0.16aB | ** | 16.29 ± 0.42aA | 13.17 ± 0.69aB | ** | 16.32 ± 0.34aA | 13.70 ± 0.29aB | ** |
| PD2 | 12.81 ± 0.26bA | 13.19 ± 0.26bA | ns | 13.36 ± 0.75bA | 13.64 ± 0.19aA | ns | 13.81 ± 0.24bA | 14.23 ± 0.52aA | ns | 13.33 ± 0.28bB | 13.69 ± 0.21aA | * |
| t-test | * | * | ** | ns | ** | ns | ** | ns | ||||
| Average | 14.43 ± 0.75A | 13.97 ± 0.38A | ns | 14.99 ± 0.72A | 13.40 ± 0.15B | * | 15.05 ± 0.52A | 13.70 ± 0.45A | ns | 14.82 ± 0.60A | 13.69 ± 0.17A | ns |
| endosperm growth rate (mm2/day) | ||||||||||||
| PD1 | 0.60 ± 0.04aA | 0.46 ± 0.01aB | ** | 0.64 ± 0.01aA | 0.47 ± 0.03aB | ** | 0.63 ± 0.02aA | 0.47 ± 0.01aB | ** | 0.62 ± 0.01aA | 0.48 ± 0.02aB | ** |
| PD2 | 0.47 ± 0.01bA | 0.43 ± 0.01aB | * | 0.51 ± 0.03bA | 0.53 ± 0.02aA | ns | 0.53 ± 0.01bA | 0.51 ± 0.04aA | ns | 0.50 ± 0.01bA | 0.49 ± 0.01a | ns |
| t-test | * | ns | ** | ns | ** | ns | ** | ns | ||||
| Average | 0.53 ± 0.03A | 0.44 ± 0.01B | * | 0.57 ± 0.03A | 0.52 ± 0.02A | ns | 0.58 ± 0.02A | 0.49 ± 0.02B | ** | 0.56 ± 0.02A | 0.48 ± 0.01B | ** |
| Factors | No. Panicle/Pot | No. Panicle/Plant | No. Seed /Panicle | Filled Seed/Pot (%) | Total Seed Weight/Pot (g) | Total Seed Weight/ Panicle | 1000-Seed Weight (g) |
|---|---|---|---|---|---|---|---|
| Year (Y) | |||||||
| 2018 | 291.29 ± 4.39b | 7.20 ± 0.17 | 54.88 ± 1.55b | 96.32 ± 0.33a | 295.93 ± 7.73a | 1.26 ± 0.04a | 26.65 ± 0.22a |
| 2019 | 309.25 ± 10.75a | 7.07 ± 0.24 | 61.17 ± 1.81a | 67.00 ± 1.45b | 172.25 ± 4.56b | 0.59 ± 0.02b | 24.22 ± 0.31b |
| F-test | * | ns | ** | ** | ** | ** | ** |
| Planting date (PD) | |||||||
| PDI | 310.17 ± 10.29a | 7.34 ± 0.18a | 55.92 ± 1.34b | 81.43 ± 3.06 | 234.52 ± 13.70 | 0.90 ± 0.08 | 25.88 ± 0.40a |
| PDII | 290.38 ± 5.24b | 6.93 ± 0.23b | 60.13 ± 2.09a | 81.90 ± 3.39 | 233.66 ± 15.01 | 0.93 ± 0.07 | 24.99 ± 0.31b |
| F-test | * | * | * | ns | ns | ns | ** |
| Variety (V) | |||||||
| PTT1 | 315.06 ± 11.43a | 7.67 ± 0.22a | 59.31 ± 2.01 | 81.22 ± 4.12b | 248.82 ± 18.80a | 0.93 ± 0.11 | 24.64 ± 0.37b |
| SP1 | 315.25 ± 9.46a | 7.63 ± 0.13a | 59.81 ± 2.15 | 78.91 ± 4.42b | 223.95 ± 18.39b | 0.90 ± 0.10 | 24.93 ± 0.51b |
| CN1 | 270.50 ± 4.15b | 6.11 ± 0.18b | 54.94 ± 2.34 | 84.85 ± 3.22a | 229.50 ± 15.35ab | 0.95 ± 0.08 | 26.74 ± 0.24a |
| F-test | ** | ** | ns | ** | * | ns | ** |
| Y × PD | |||||||
| 2018 × PDI | 286.75 ± 4.47b | 7.49 ± 0.20 | 57.83 ± 2.10b | 95.37 ± 0.39 | 293.27 ± 10.69 | 1.28 ± 0.05a | 27.29 ± 0.32a |
| 2018 × PDII | 295.83 ± 7.55b | 6.90 ± 0.27 | 51.92 ± 2.03b | 97.28 ± 0.39 | 298.58 ± 11.57 | 1.24 ± 0.06a | 26.01 ± 0.18b |
| 2019 × PDI | 333.58 ± 17.97a | 7.19 ± 0.31 | 54.00 ± 1.56b | 67.49 ± 1.93 | 175.76 ± 6.56 | 0.54 ± 0.02b | 24.46 ± 0.46b |
| 2019 × PDII | 284.92 ± 7.24b | 6.95 ± 0.38 | 68.33 ± 1.39a | 66.51 ± 2.23 | 168.75 ± 6.47 | 0.64 ± 0.04b | 23.97 ± 0.42c |
| F-test | ** | ns | ** | ns | ns | * | * |
| Y × V | |||||||
| 2018 × PTT1 | 290.38 ± 6.59a | 7.55 ± 0.36ab | 57.88 ± 3.16 | 96.66 ± 0.37a | 316.87 ± 11.30 | 1.33 ± 0.07a | 26.01 ± 0.08b |
| 2018 × SP1 | 305.00 ± 7.57a | 7.49 ± 0.18ab | 56.00 ± 2.36 | 95.32 ± 0.75a | 288.42 ± 13.14 | 1.24 ± 0.06a | 26.63 ± 0.50b |
| 2018 × CN1 | 278.50 ± 6.27b | 6.55 ± 0.21b | 50.75 ± 2.09 | 96.99 ± 0.43a | 282.49 ± 13.84 | 1.22 ± 0.07a | 27.32 ± 0.33a |
| 2019 × PTT1 | 339.75 ± 18.52a | 7.79 ± 0.27a | 60.75 ± 2.59 | 65.79 ± 2.09bc | 180.76 ± 8.00 | 0.54 ± 0.03c | 23.27 ± 0.21c |
| 2019 × SP1 | 325.50 ± 17.21a | 7.76 ± 0.19a | 63.63 ± 3.17 | 62.49 ± 2.50c | 159.48 ± 9.43 | 0.55 ± 0.05c | 23.22 ± 0.19c |
| 2019 × CN1 | 262.50 ± 4.03c | 5.66 ± 0.19c | 59.13 ± 3.75 | 72.72 ± 1.49b | 176.52 ± 4.01 | 0.68 ± 0.03b | 26.16 ± 0.19b |
| F-test | ** | * | ns | * | ns | * | ** |
| PD × V | |||||||
| PDI × PTT1 | 337.25 ± 19.39 | 8.03 ± 0.18 | 58.50 ± 2.16 | 79.73 ± 6.18 | 261.44 ± 26.53 | 0.94 ± 0.17 | 24.70 ± 0.46d |
| PDI × SP1 | 321.88 ± 17.65 | 7.66 ± 0.14 | 58.13 ± 1.93 | 78.76 ± 5.94 | 218.82 ± 22.25 | 0.86 ± 0.15 | 25.62 ± 0.87c |
| PDI × CN1 | 271.38 ± 4.04 | 6.34 ± 0.21 | 51.13 ± 2.08 | 85.79 ± 3.84 | 223.29 ± 22.25 | 0.92 ± 0.12 | 27.32 ± 0.32a |
| PDII × PTT1 | 292.88 ± 6.62 | 7.31 ± 0.37 | 60.13 ± 3.52 | 82.71 ± 5.81 | 236.19 ± 27.67 | 0.92 ± 0.15 | 24.57 ± 0.61d |
| PDII × SP1 | 308.63 ± 7.72 | 7.59 ± 0.23 | 61.50 ± 3.91 | 79.06 ± 6.96 | 229.08 ± 30.77 | 0.93 ± 0.13 | 24.23 ± 0.46d |
| PDII × CN1 | 269.63 ± 7.57 | 5.88 ± 0.28 | 58.75 ± 3.87 | 83.92 ± 5.43 | 235.72 ± 22.44 | 0.97 ± 0.11 | 26.17 ± 0.21b |
| F-test | ns | ns | ns | ns | ns | ns | ** |
| Y × PD × V | |||||||
| 2018 × PDI × PTT1 | 291.00 ± 5.21 | 7.95 ± 0.33 | 62.00 ± 3.19 | 95.78 ± 0.26 | 327.73 ± 16.62 | 1.37 ± 0.09 | 25.84 ± 0.10bc |
| 2018 × PDI × SP1 | 294.50 ± 9.13 | 7.70 ± 0.25 | 59.75 ± 2.98 | 94.40 ± 1.04 | 273.35 ± 11.64 | 1.25 ± 0.08 | 27.90 ± 0.13a |
| 2018 × PDI × CN1 | 274.75 ± 5.94 | 6.83 ± 0.17 | 51.75 ± 3.15 | 95.93 ± 0.22 | 278.75 ± 15.73 | 1.22 ± 0.11 | 28.14 ± 0.13a |
| 2018 × PDII × PTT1 | 289.75 ± 13.23 | 7.15 ± 0.63 | 53.75 ± 5.01 | 97.55 ± 0.18 | 306.01 ± 15.52 | 1.28 ± 0.13 | 26.17 ± 0.06b |
| 2018 × PDII × SP1 | 315.50 ± 10.51 | 7.28 ± 0.25 | 52.25 ± 2.78 | 96.25 ± 1.00 | 303.50 ± 22.77 | 1.22 ± 0.11 | 25.35 ± 0.27c |
| 2018 × PDII × CN1 | 282.25 ± 11.78 | 6.28 ± 0.37 | 49.75 ± 3.15 | 98.04 ± 0.24 | 286.22 ± 25.23 | 1.22 ± 0.10 | 26.50 ± 0.23b |
| 2019 × PDI × PTT1 | 383.50 ± 17.35 | 8.10 ± 0.21 | 55.00 ± 1.87 | 63.69 ± 2.57 | 195.16 ± 8.83 | 0.51 ± 0.04 | 23.57 ± 0.36d |
| 2019 × PDI × SP1 | 349.25 ± 29.50 | 7.63 ± 0.15 | 56.50 ± 2.60 | 63.12 ± 0.88 | 164.29 ± 13.88 | 0.47 ± 0.03 | 23.33 ± 0.25d |
| 2019 × PDI × CN1 | 268.00 ± 5.76 | 5.85 ± 0.17 | 50.50 ± 3.18 | 75.65 ± 0.63 | 167.83 ± 3.61 | 0.63 ± 0.01 | 26.49 ± 0.15b |
| 2019 × PDII × PTT1 | 296.00 ± 4.80 | 7.48 ± 0.48 | 66.50 ± 2.40 | 67.88 ± 3.29 | 166.37 ± 9.11 | 0.56 ± 0.04 | 22.97 ± 0.14d |
| 2019 × PDII × SP1 | 301.75 ± 11.66 | 7.90 ± 0.35 | 70.75 ± 2.53 | 61.87 ± 5.31 | 154.67 ± 14.38 | 0.63 ± 0.08 | 23.12 ± 0.31d |
| 2019 × PDII × CN1 | 257.00 ± 4.74 | 5.48 ± 0.34 | 67.75 ± 2.43 | 69.79 ± 2.07 | 185.21 ± 3.42 | 0.72 ± 0.04 | 25.84 ± 0.27bc |
| F-test | ns | ns | ns | ns | ns | ns | ** |
| CV (%) | 2.22 | 7.67 | 3.78 | 4.62 | 5.62 | 6.36 | 2.20 |
| Factors | Length (mm.) | Width (mm.) | Seed Area (mm2) | Chalky Grain (%) | G (%) | GI | AA (%) | SGR (%) |
|---|---|---|---|---|---|---|---|---|
| Year (Y) | ||||||||
| 2018 | 2.38 ± 0.07 | 7.43 ± 0.06a | 13.79 ± 0.12a | 28.75 ± 2.32b | 93.83 ± 1.06a | 12.28 ± 0.19a | 95.67 ± 0.91a | 9.50 ± 0.23a |
| 2019 | 2.37 ± 0.02 | 7.30 ± 0.03b | 13.38 ± 0.09b | 60.92 ± 6.25a | 85.33 ± 2.63b | 10.82 ± 0.38b | 79.00 ± 2.88b | 7.92 ± 0.10b |
| F-test | ns | * | ** | ** | ** | ** | ** | ** |
| Planting date (PD) | ||||||||
| PDI | 2.35 ± 0.02 | 7.32 ± 0.03 | 13.51 ± 0.10 | 54.08 ± 6.17a | 94.42 ± 0.86a | 12.45 ± 0.15a | 93.08 ± 1.30a | 8.97 ± 0.22a |
| PDII | 2.41 ± 0.07 | 7.40 ± 0.06 | 13.66 ± 0.12 | 35.58 ± 4.63b | 84.75 ± 2.61b | 10.65 ± 0.37b | 81.58 ± 3.26b | 8.45 ± 0.25b |
| F-test | ns | ns | ns | ** | ** | ** | ** | ** |
| Variety (V) | ||||||||
| PTT1 | 2.42 ± 0.10 | 7.48 ± 0.07a | 13.48 ± 0.17b | 39.44 ± 5.47 | 93.25 ± 2.17 | 12.28 ± 0.32a | 92.25 ± 2.47a | 9.07 ± 0.35a |
| SP1 | 2.32 ± 0.02 | 7.40 ± 0.04a | 13.42 ± 0.12b | 43.13 ± 5.29 | 89.75 ± 2.89 | 11.10 ± 0.40b | 88.88 ± 2.93a | 8.64 ± 0.21b |
| CN1 | 2.39 ± 0.02 | 7.20 ± 0.03b | 13.86 ± 0.09a | 51.94 ± 9.52 | 85.75 ± 2.67 | 11.26 ± 0.46b | 80.88 ± 3.96b | 8.42 ± 0.29b |
| F-test | ns | ** | ** | ns | ns | ** | ** | ** |
| Y × PD | ||||||||
| 2018 × PDI | 2.32 ± 0.02 | 7.35 ± 0.04 | 13.61 ± 0.13 | 26.50 ± 2.80b | 95.17 ± 1.42a | 12.78 ± 0.24a | 96.83 ± 0.63a | 9.87 ± 0.17a |
| 2018 × PDII | 2.44 ± 0.14 | 7.50 ± 0.10 | 13.98 ± 0.18 | 31.00 ± 3.71b | 92.50 ± 1.54a | 11.78 ± 0.23a | 94.50 ± 1.67a | 9.13 ± 0.40b |
| 2019 × PDI | 2.38 ± 0.04 | 7.29 ± 0.04 | 13.41 ± 0.15 | 81.67 ± 3.61a | 93.67 ± 0.98a | 12.12 ± 0.14a | 89.33 ± 2.04a | 8.06 ± 0.17c |
| 2019 × PDII | 2.37 ± 0.01 | 7.31 ± 0.05 | 13.35 ± 0.12 | 40.17 ± 8.50b | 77.00 ± 3.90b | 9.52 ± 0.53b | 68.67 ± 3.35b | 7.78 ± 0.11c |
| F-test | ns | ns | ns | ** | ** | ** | ** | * |
| Y x V | ||||||||
| 2018 × PTT1 | 2.51 ± 0.21 | 7.58 ± 0.14 | 13.79 ± 0.31 | 32.75 ± 2.72b | 98.50 ± 0.63 | 13.03 ± 0.34 | 98.75 ± 0.53a | 10.38 ± 0.12a |
| 2018 × SP1 | 2.30 ± 0.01 | 7.45 ± 0.06 | 13.71 ± 0.13 | 37.50 ± 2.13b | 92.50 ± 1.80 | 11.57 ± 0.29 | 95.75 ± 0.80ab | 9.44 ± 0.10b |
| 2018 × CN1 | 2.34 ± 0.02 | 7.25 ± 0.04 | 13.88 ± 0.14 | 16.00 ± 2.14c | 90.50 ± 1.59 | 12.23 ± 0.12 | 92.50 ± 2.10abc | 8.68 ± 0.53c |
| 2019 × PTT1 | 2.33 ± 0.02 | 7.38 ± 0.02 | 13.17 ± 0.07 | 46.13 ± 10.39b | 88.00 ± 3.46 | 11.54 ± 0.40 | 85.75 ± 3.71bc | 7.76 ± 0.15d |
| 2019 × SP1 | 2.34 ± 0.04 | 7.36 ± 0.05 | 13.12 ± 0.13 | 48.75 ± 10.31b | 87.00 ± 5.50 | 10.64 ± 0.74 | 82.00 ± 4.77c | 7.84 ± 0.06d |
| 2019 × CN1 | 2.45 ± 0.02 | 7.16 ± 0.04 | 13.84 ± 0.12 | 87.88 ± 3.88a | 81.00 ± 4.64 | 10.29 ± 0.78 | 69.25 ± 4.91d | 8.16 ± 0.25cd |
| F-test | ns | ns | ns | ** | ns | ns | ** | ** |
| PD × V | ||||||||
| PDI × PTT1 | 2.31 ± 0.03 | 7.36 ± 0.03 | 13.17 ± 0.09b | 50.88 ± 8.74 | 96.50 ± 1.45 | 12.82 ± 0.41 | 97.00 ± 1.07 | 9.02 ± 0.51ab |
| PDI × SP1 | 2.32 ± 0.04 | 7.38 ± 0.06 | 13.37 ± 0.16ab | 54.75 ± 7.64 | 95.75 ± 0.88 | 12.13 ± 0.14 | 94.00 ± 1.41 | 8.49 ± 0.30b |
| PDI × CN1 | 2.42 ± 0.03 | 7.23 ± 0.04 | 13.99 ± 0.11a | 56.63 ± 15.43 | 91.00 ± 1.36 | 12.40 ± 0.11 | 88.25 ± 2.81 | 9.38 ± 0.28a |
| PDII × PTT1 | 2.54 ± 0.20 | 7.61 ± 0.13 | 13.79 ± 0.31ab | 28.00 ± 3.80 | 90.00 ± 3.89 | 11.74 ± 0.43 | 87.50 ± 4.31 | 9.11 ± 0.52ab |
| PDII × SP1 | 2.32 ± 0.02 | 7.42 ± 0.06 | 13.46 ± 0.18ab | 31.50 ± 4.78 | 83.75 ± 4.96 | 10.08 ± 0.61 | 83.75 ± 5.23 | 8.79 ± 0.31b |
| PDII × CN1 | 2.36 ± 0.02 | 7.18 ± 0.04 | 13.73 ± 0.13ab | 47.25 ± 12.01 | 80.50 ± 4.56 | 10.13 ± 0.72 | 73.50 ± 6.61 | 7.46 ± 0.14c |
| F-test | ns | ns | ** | ns | ns | ns | ns | ** |
| Y × PD × V | ||||||||
| 2018 × PDI × PTT1 | 2.30 ± 0.04 | 7.35 ± 0.05 | 13.18 ± 0.11 | 28.50 ± 3.30bc | 99.00 ± 1.00 | 13.50 ± 0.61 | 99.50 ± 0.50 | 10.33 ± 0.20a |
| 2018 × PDI × SP1 | 2.32 ± 0.02 | 7.41 ± 0.09 | 13.65 ± 0.18 | 35.00 ± 2.89b | 96.50 ± 1.50 | 12.31 ± 0.10 | 95.50 ± 0.50 | 9.26 ± 0.15cd |
| 2018 × PDI × CN1 | 2.36 ± 0.04 | 7.29 ± 0.05 | 14.00 ± 0.20 | 16.00 ± 2.16d | 90.00 ± 2.16 | 12.52 ± 0.08 | 95.50 ± 0.50 | 10.03 ± 0.24ab |
| 2018 × PDII × PTT1 | 2.72 ± 0.41 | 7.81 ± 0.22 | 14.40 ± 0.44 | 37.00 ± 3.42b | 98.00 ± 0.82 | 12.56 ± 0.17 | 98.00 ± 0.82 | 10.43 ± 0.17a |
| 2018 × PDII × SP1 | 2.28 ± 0.01 | 7.48 ± 0.07 | 13.78 ± 0.19 | 40.00 ± 2.94b | 88.50 ± 1.50 | 10.83 ± 0.13 | 96.00 ± 1.63 | 9.61 ± 0.06bc |
| 2018 × PDII × CN1 | 2.32 ± 0.02 | 7.20 ± 0.07 | 13.75 ± 0.19 | 16.00 ± 4.08d | 91.00 ± 2.65 | 11.94 ± 0.04 | 89.50 ± 3.77 | 7.34 ± 0.19f |
| 2019 × PDI × PTT1 | 2.31 ± 0.03 | 7.36 ± 0.04 | 13.16 ± 0.16 | 73.25 ± 3.47a | 94.00 ± 2.16 | 12.15 ± 0.32 | 94.50 ± 0.96 | 7.72 ± 0.23ef |
| 2019 × PDI × SP1 | 2.33 ± 0.08 | 7.35 ± 0.08 | 3.09 ± 0.19 | 74.50 ± 2.02a | 95.00 ± 1.00 | 11.95 ± 0.24 | 92.50 ± 2.75 | 7.72 ± 0.06ef |
| 2019 × PDI × CN1 | 2.49 ± 0.02 | 7.16 ± 0.05 | 13.98 ± 0.12 | 97.25 ± 2.43a | 92.00 ± 1.83 | 12.27 ± 0.19 | 81.00 ± 1.29 | 8.74 ± 0.21d |
| 2019 × PDII × PTT1 | 2.35 ± 0.01 | 7.41 ± 0.02 | 13.18 ± 0.03 | 19.00 ± 1.29cd | 82.00 ± 5.23 | 10.93 ± 0.62 | 77.00 ± 3.51 | 7.80 ± 0.23ef |
| 2019 × PDII × SP1 | 2.35 ± 0.02 | 7.37 ± 0.08 | 13.15 ± 0.22 | 23.00 ± 7.05cd | 79.00 ± 9.88 | 9.33 ± 1.17 | 71.50 ± 4.99 | 7.97 ± 0.05e |
| 2019 × PDII × CN1 | 2.41 ± 0.02 | 7.16 ± 0.06 | 13.71 ± 0.20 | 78.50 ± 2.40a | 70.00 ± 4.08 | 8.31 ± 0.46 | 57.50 ± 4.35 | 7.59 ± 0.20ef |
| F-test | ns | ns | ns | ** | ns | ns | ns | ** |
| CV (%) | 9.55 | 1.50 | 1.53 | 20.62 | 3.06 | 6.77 | 3.92 | 6.18 |
| High Temperature Tolerant Traits Considered by PCA (no. 1–9) and Distinctive Traits (no. 10–17) | PTT1 | SP1 | CN1 |
|---|---|---|---|
| 1. Anthesis day | 64.00 ± 1.32b | 72.13 ± 1.88a | 73.00 ± 1.05a |
| 2. AGDD of anthesis | 1359.03 ± 23.57c | 1541.64 ± 27.52b | 1568.91 ± 28.18a |
| 3. Endosperm growth rate | 0.44 ± 0.01c | 0.51 ± 0.02a | 0.49 ± 0.02b |
| 4. Total seed weight/panicle | 0.54 ± 0.03b | 0.55 ± 0.05b | 0.68 ± 0.03a |
| 5. 1000-seed weight | 23.27 ± 0.21b | 23.22 ± 0.19b | 26.16 ± 0.19a |
| 6. Seed length, | ns | ns | ns |
| 7. Seed area | ns | ns | ns |
| 8. Chalky grain | 46.13 ± 10.39b | 48.75 ± 10.31b | 87.88 ± 3.88a |
| 9. Accelerating ageing | 85.75 ± 3.71a | 82.00 ± 4.77a | 69.25 ± 4.91b |
| 10. Phenology (Sowing-PM) | 81.00 ± 1.04c | 84.13 ± 0.45b | 87.63 ± 0.60a |
| 11. Embryo size | ns | ns | ns |
| 12. Embryo growth rate | ns | ns | ns |
| 13. Endosperm size | ns | ns | ns |
| 14. No. panicle/pot | 339.75 ± 18.52a | 325.50 ± 17.21a | 262.50 ± 4.03b |
| 15. No. panicle/plant | 7.79 ± 0.27a | 7.76 ± 0.19a | 5.66 ± 0.19b |
| 16. Filled seed/pot | 65.79 ± 2.09b | 62.49 ± 2.50c | 72.72 ± 1.49a |
| 17. SGR | 7.76 ± 0.15b | 7.84 ± 0.06b | 8.16 ± 0.25a |
Disclaimer/Publisher’s Note: The statements, opinions and data contained in all publications are solely those of the individual author(s) and contributor(s) and not of MDPI and/or the editor(s). MDPI and/or the editor(s) disclaim responsibility for any injury to people or property resulting from any ideas, methods, instructions or products referred to in the content. |
© 2023 by the authors. Licensee MDPI, Basel, Switzerland. This article is an open access article distributed under the terms and conditions of the Creative Commons Attribution (CC BY) license (https://creativecommons.org/licenses/by/4.0/).
Share and Cite
Sanwong, P.; Sanitchon, J.; Dongsansuk, A.; Jothityangkoon, D. High Temperature Alters Phenology, Seed Development and Yield in Three Rice Varieties. Plants 2023, 12, 666. https://doi.org/10.3390/plants12030666
Sanwong P, Sanitchon J, Dongsansuk A, Jothityangkoon D. High Temperature Alters Phenology, Seed Development and Yield in Three Rice Varieties. Plants. 2023; 12(3):666. https://doi.org/10.3390/plants12030666
Chicago/Turabian StyleSanwong, Pranee, Jirawat Sanitchon, Anoma Dongsansuk, and Darunee Jothityangkoon. 2023. "High Temperature Alters Phenology, Seed Development and Yield in Three Rice Varieties" Plants 12, no. 3: 666. https://doi.org/10.3390/plants12030666