
Determination of Heavy Metal Content: Arsenic, Cadmium, Mercury, and Lead in Cyano-Phycocyanin Isolated from the Cyanobacterial Biomass
 ,
,  ,
,
Abstract
:1. Introduction
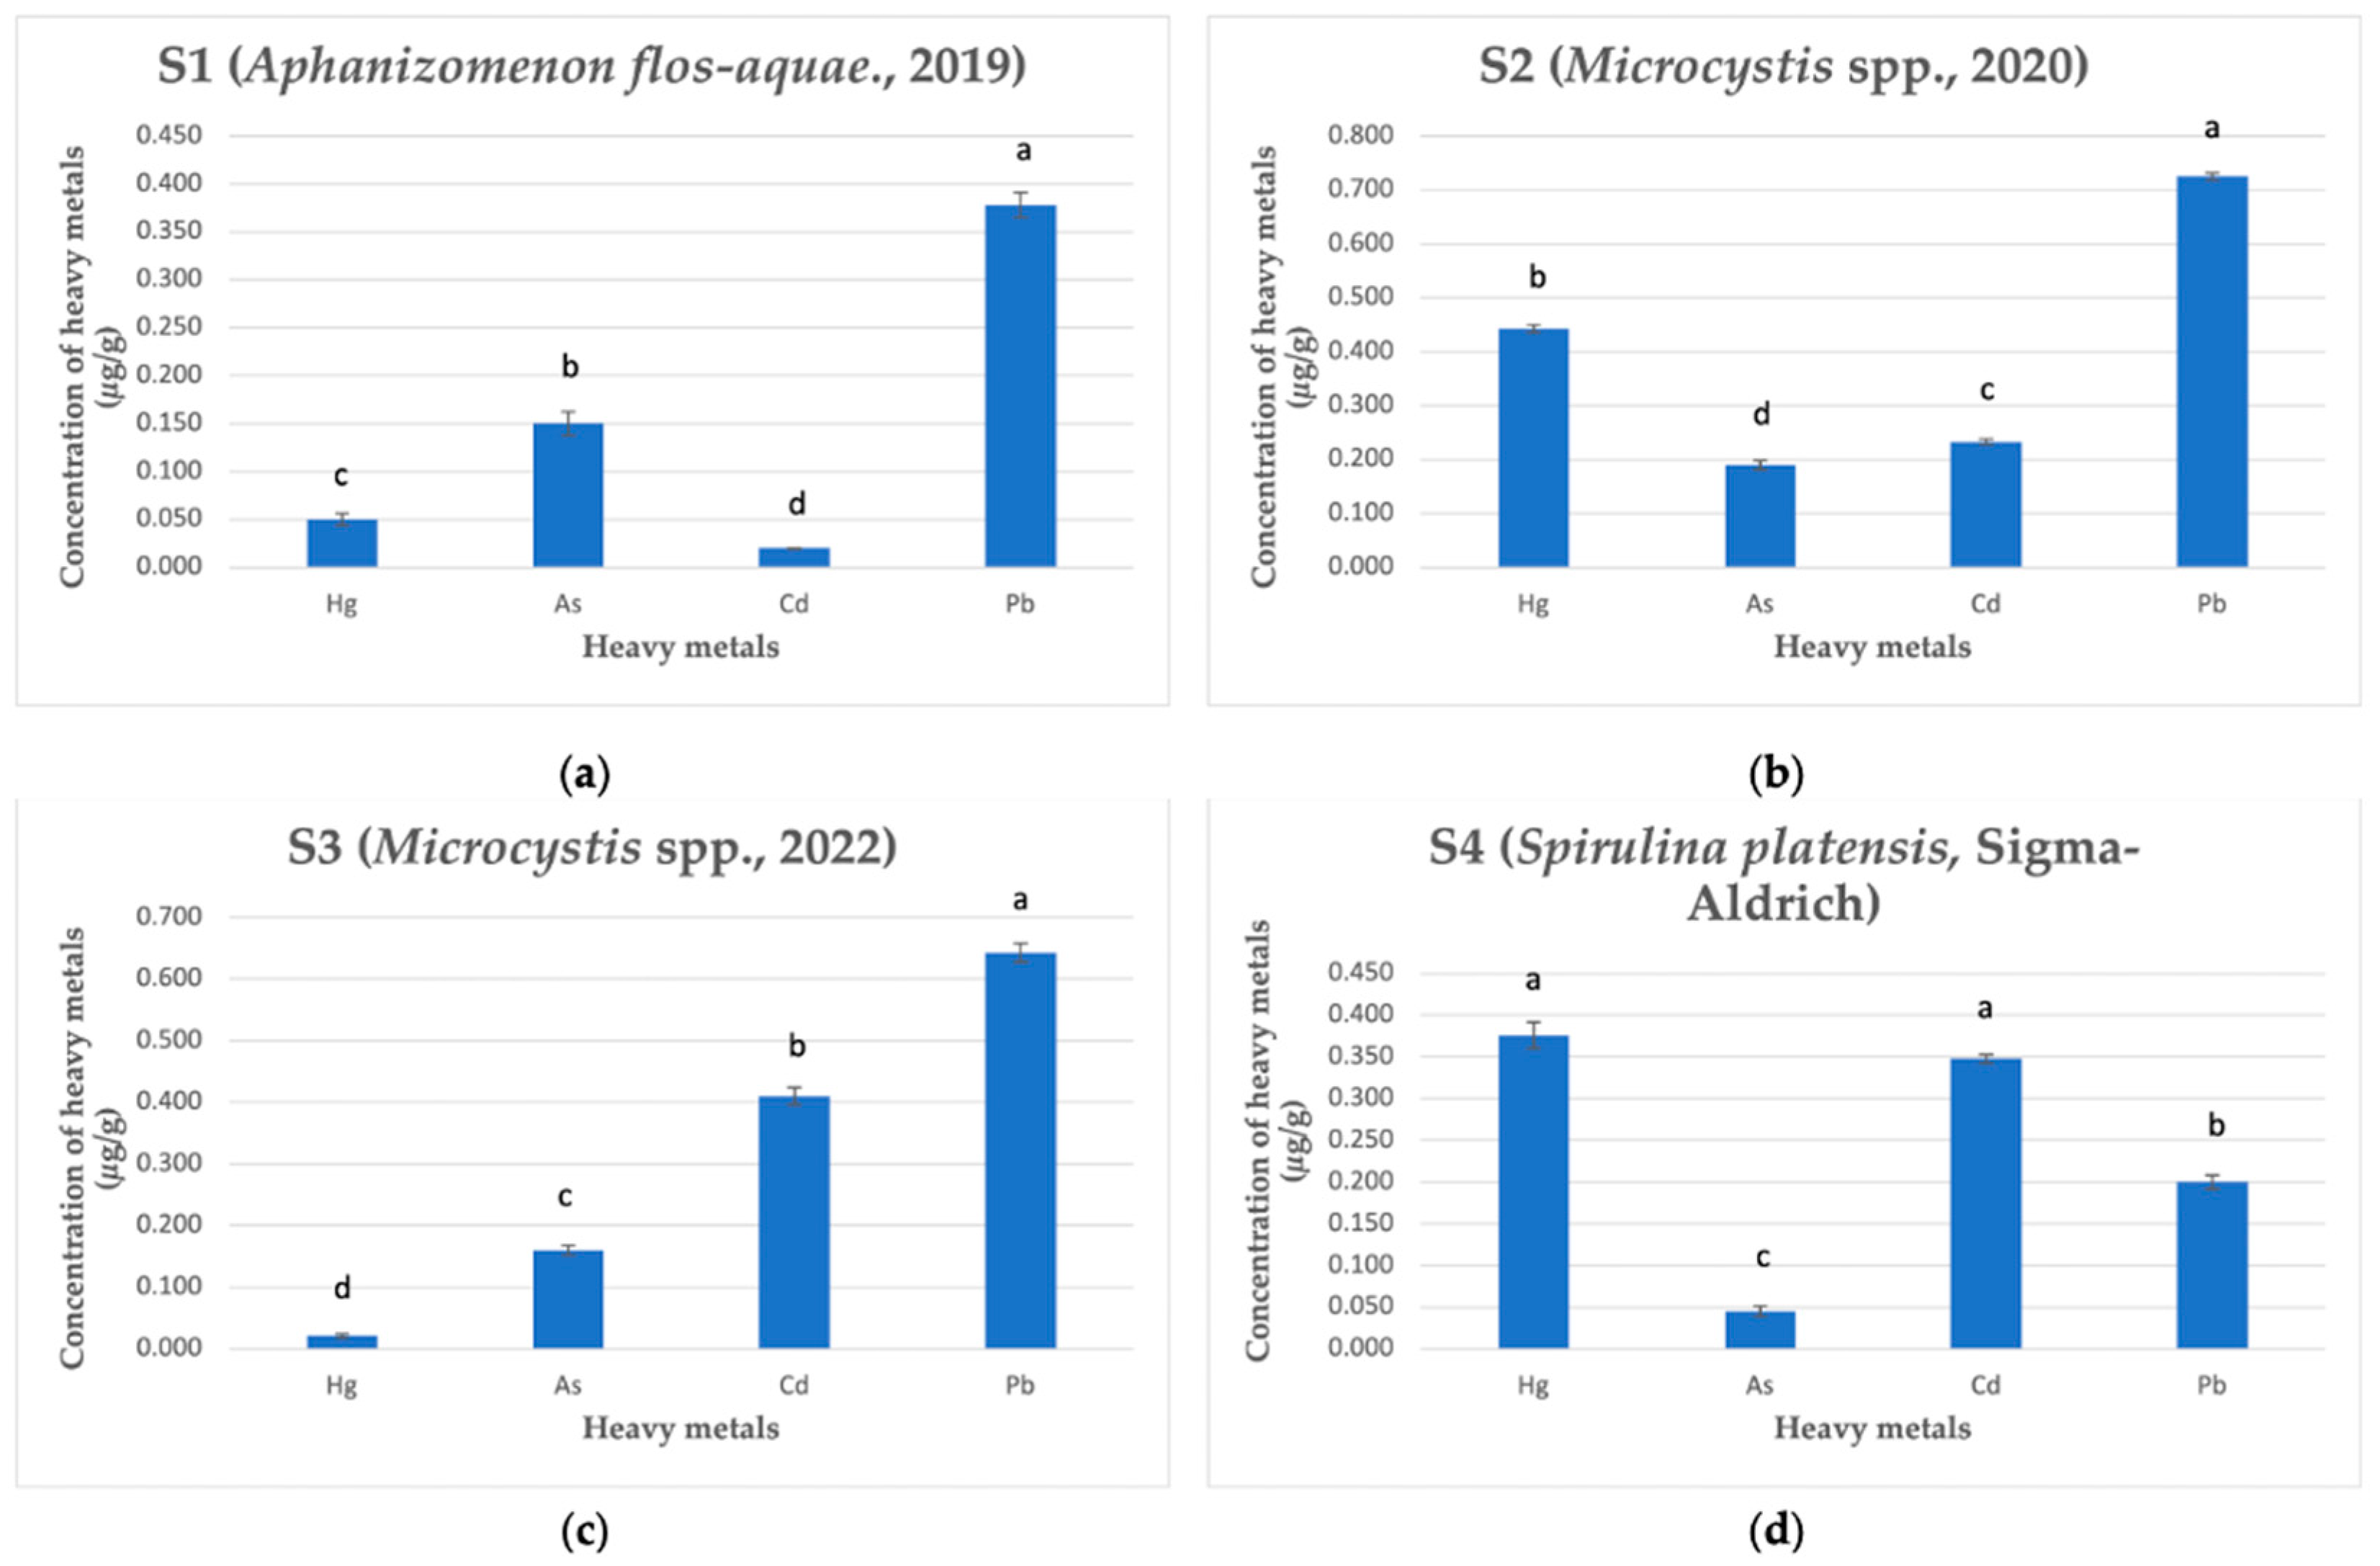
2. Results
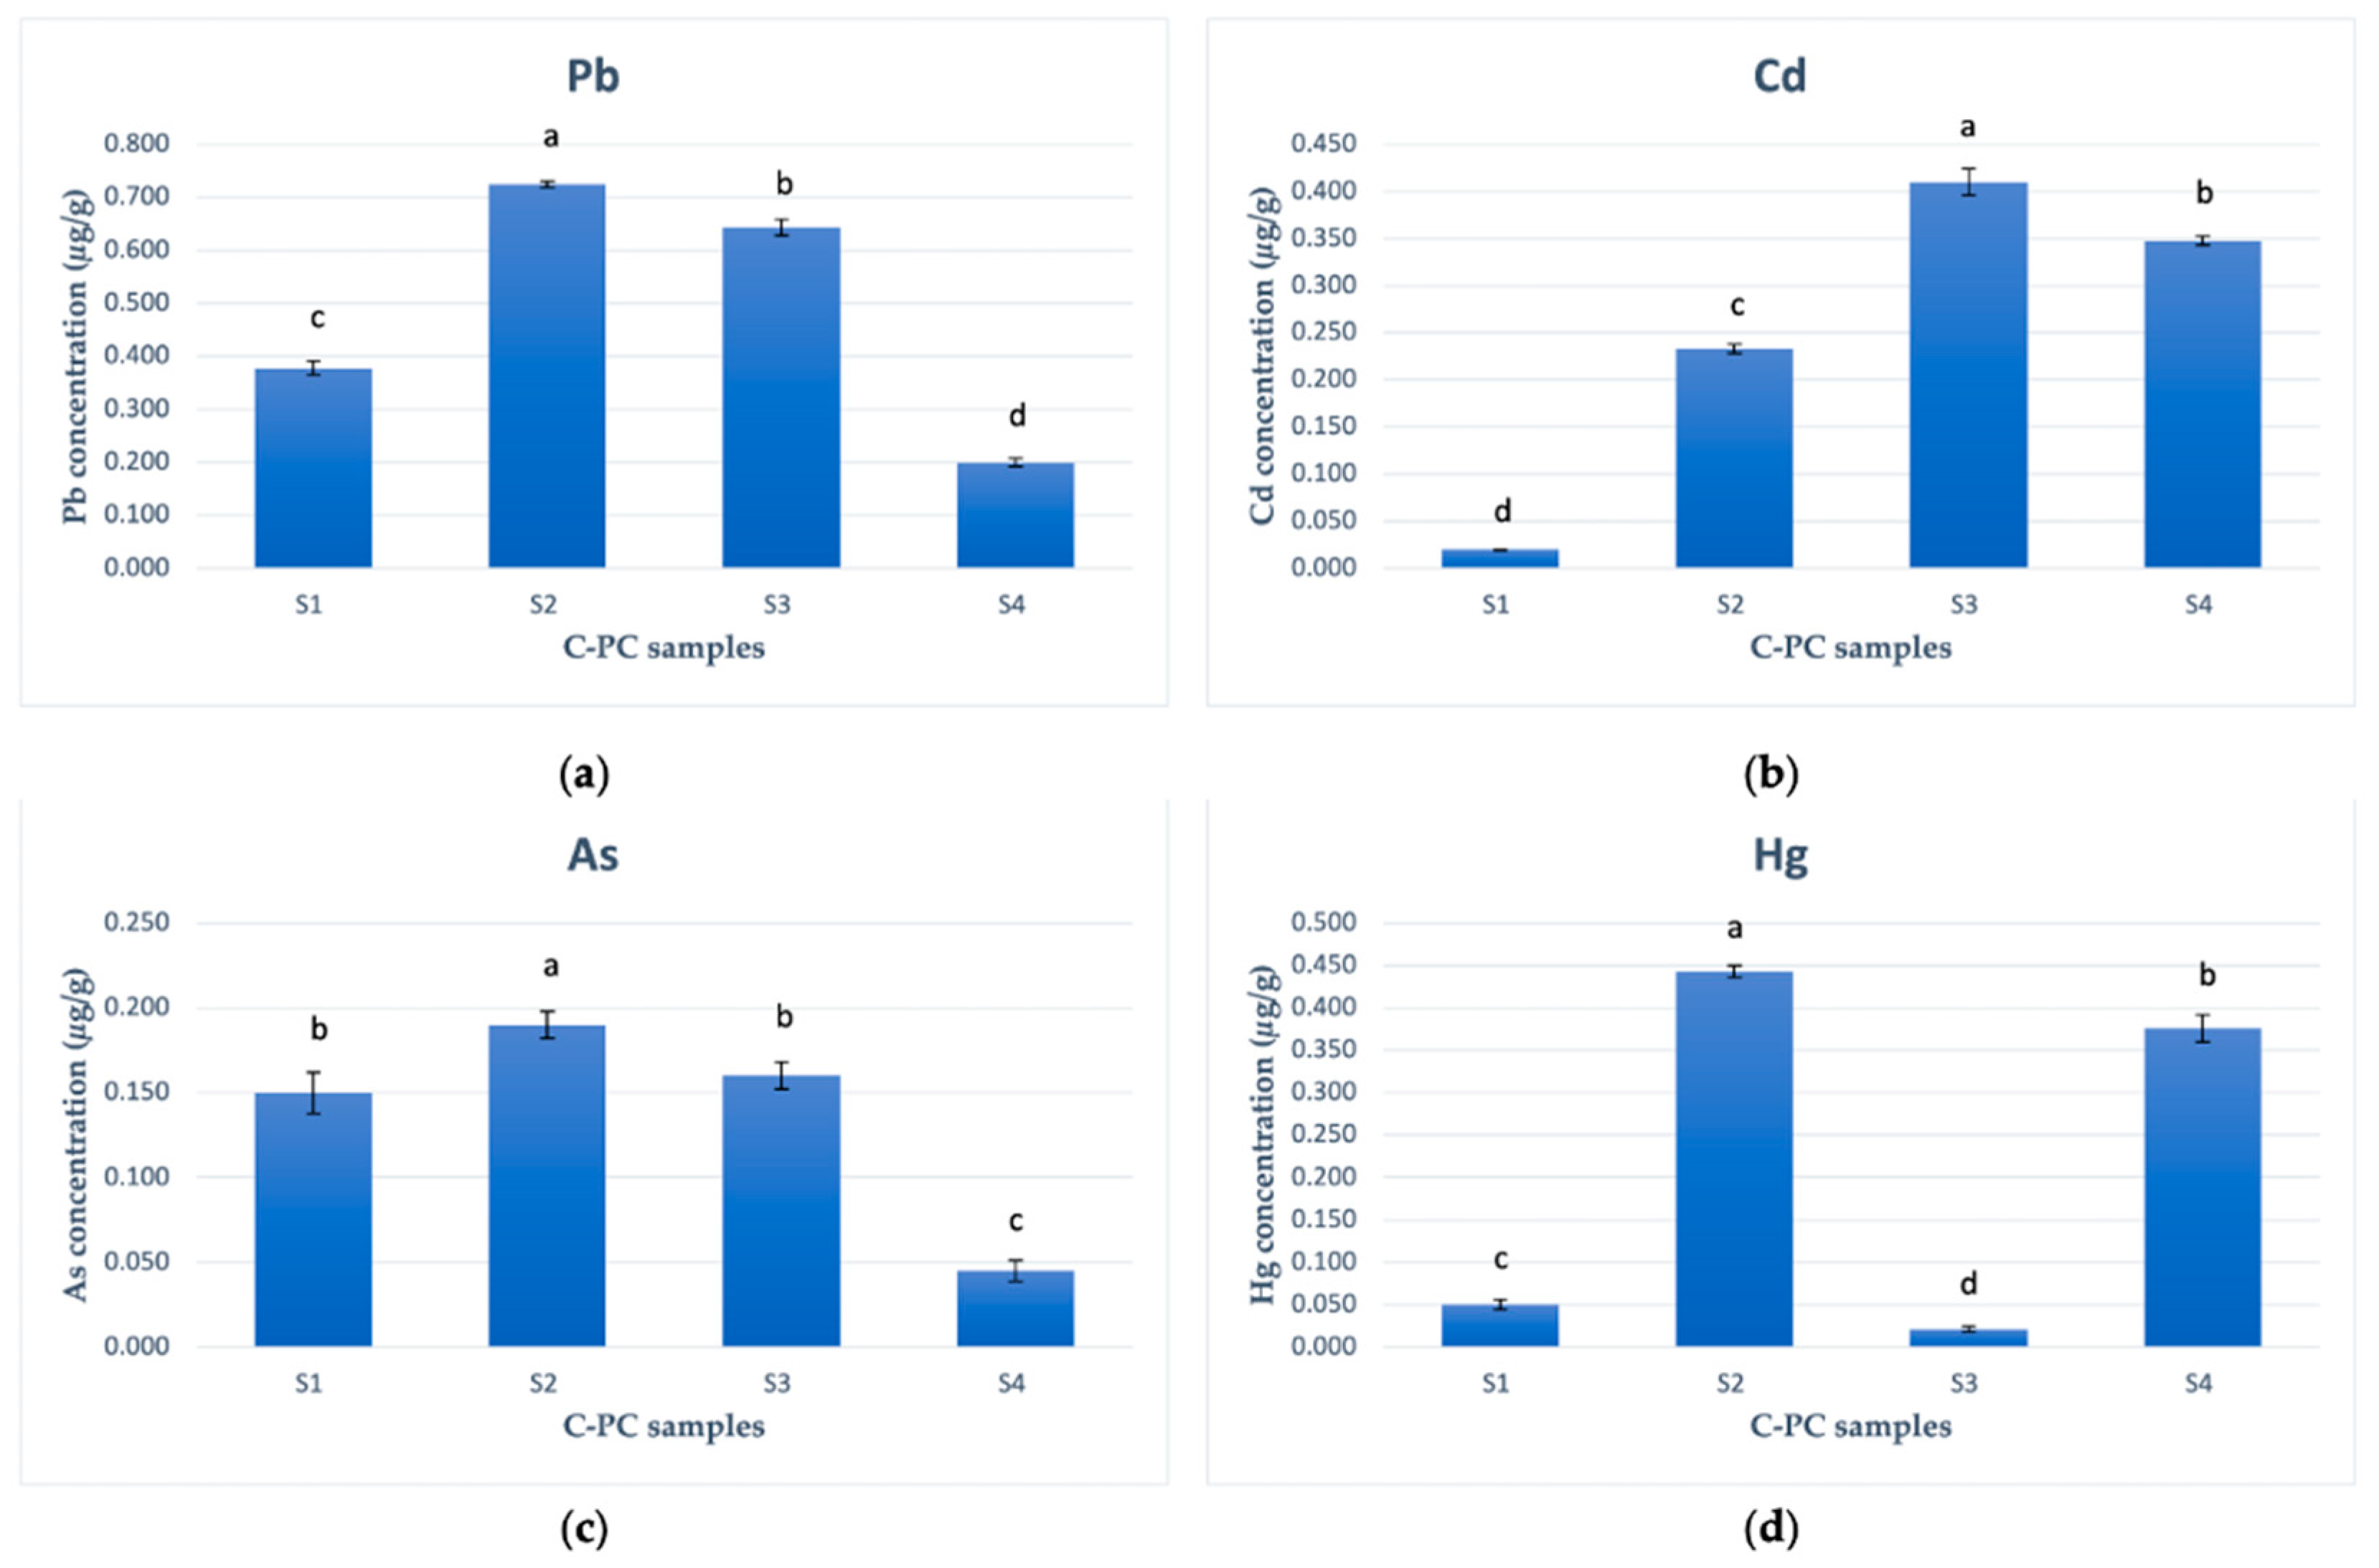
2.1. Lead (Pb)
2.2. Cadmium (Cd)
2.3. Arsenic (As)
2.4. Mercury (Hg)
3. Discussion
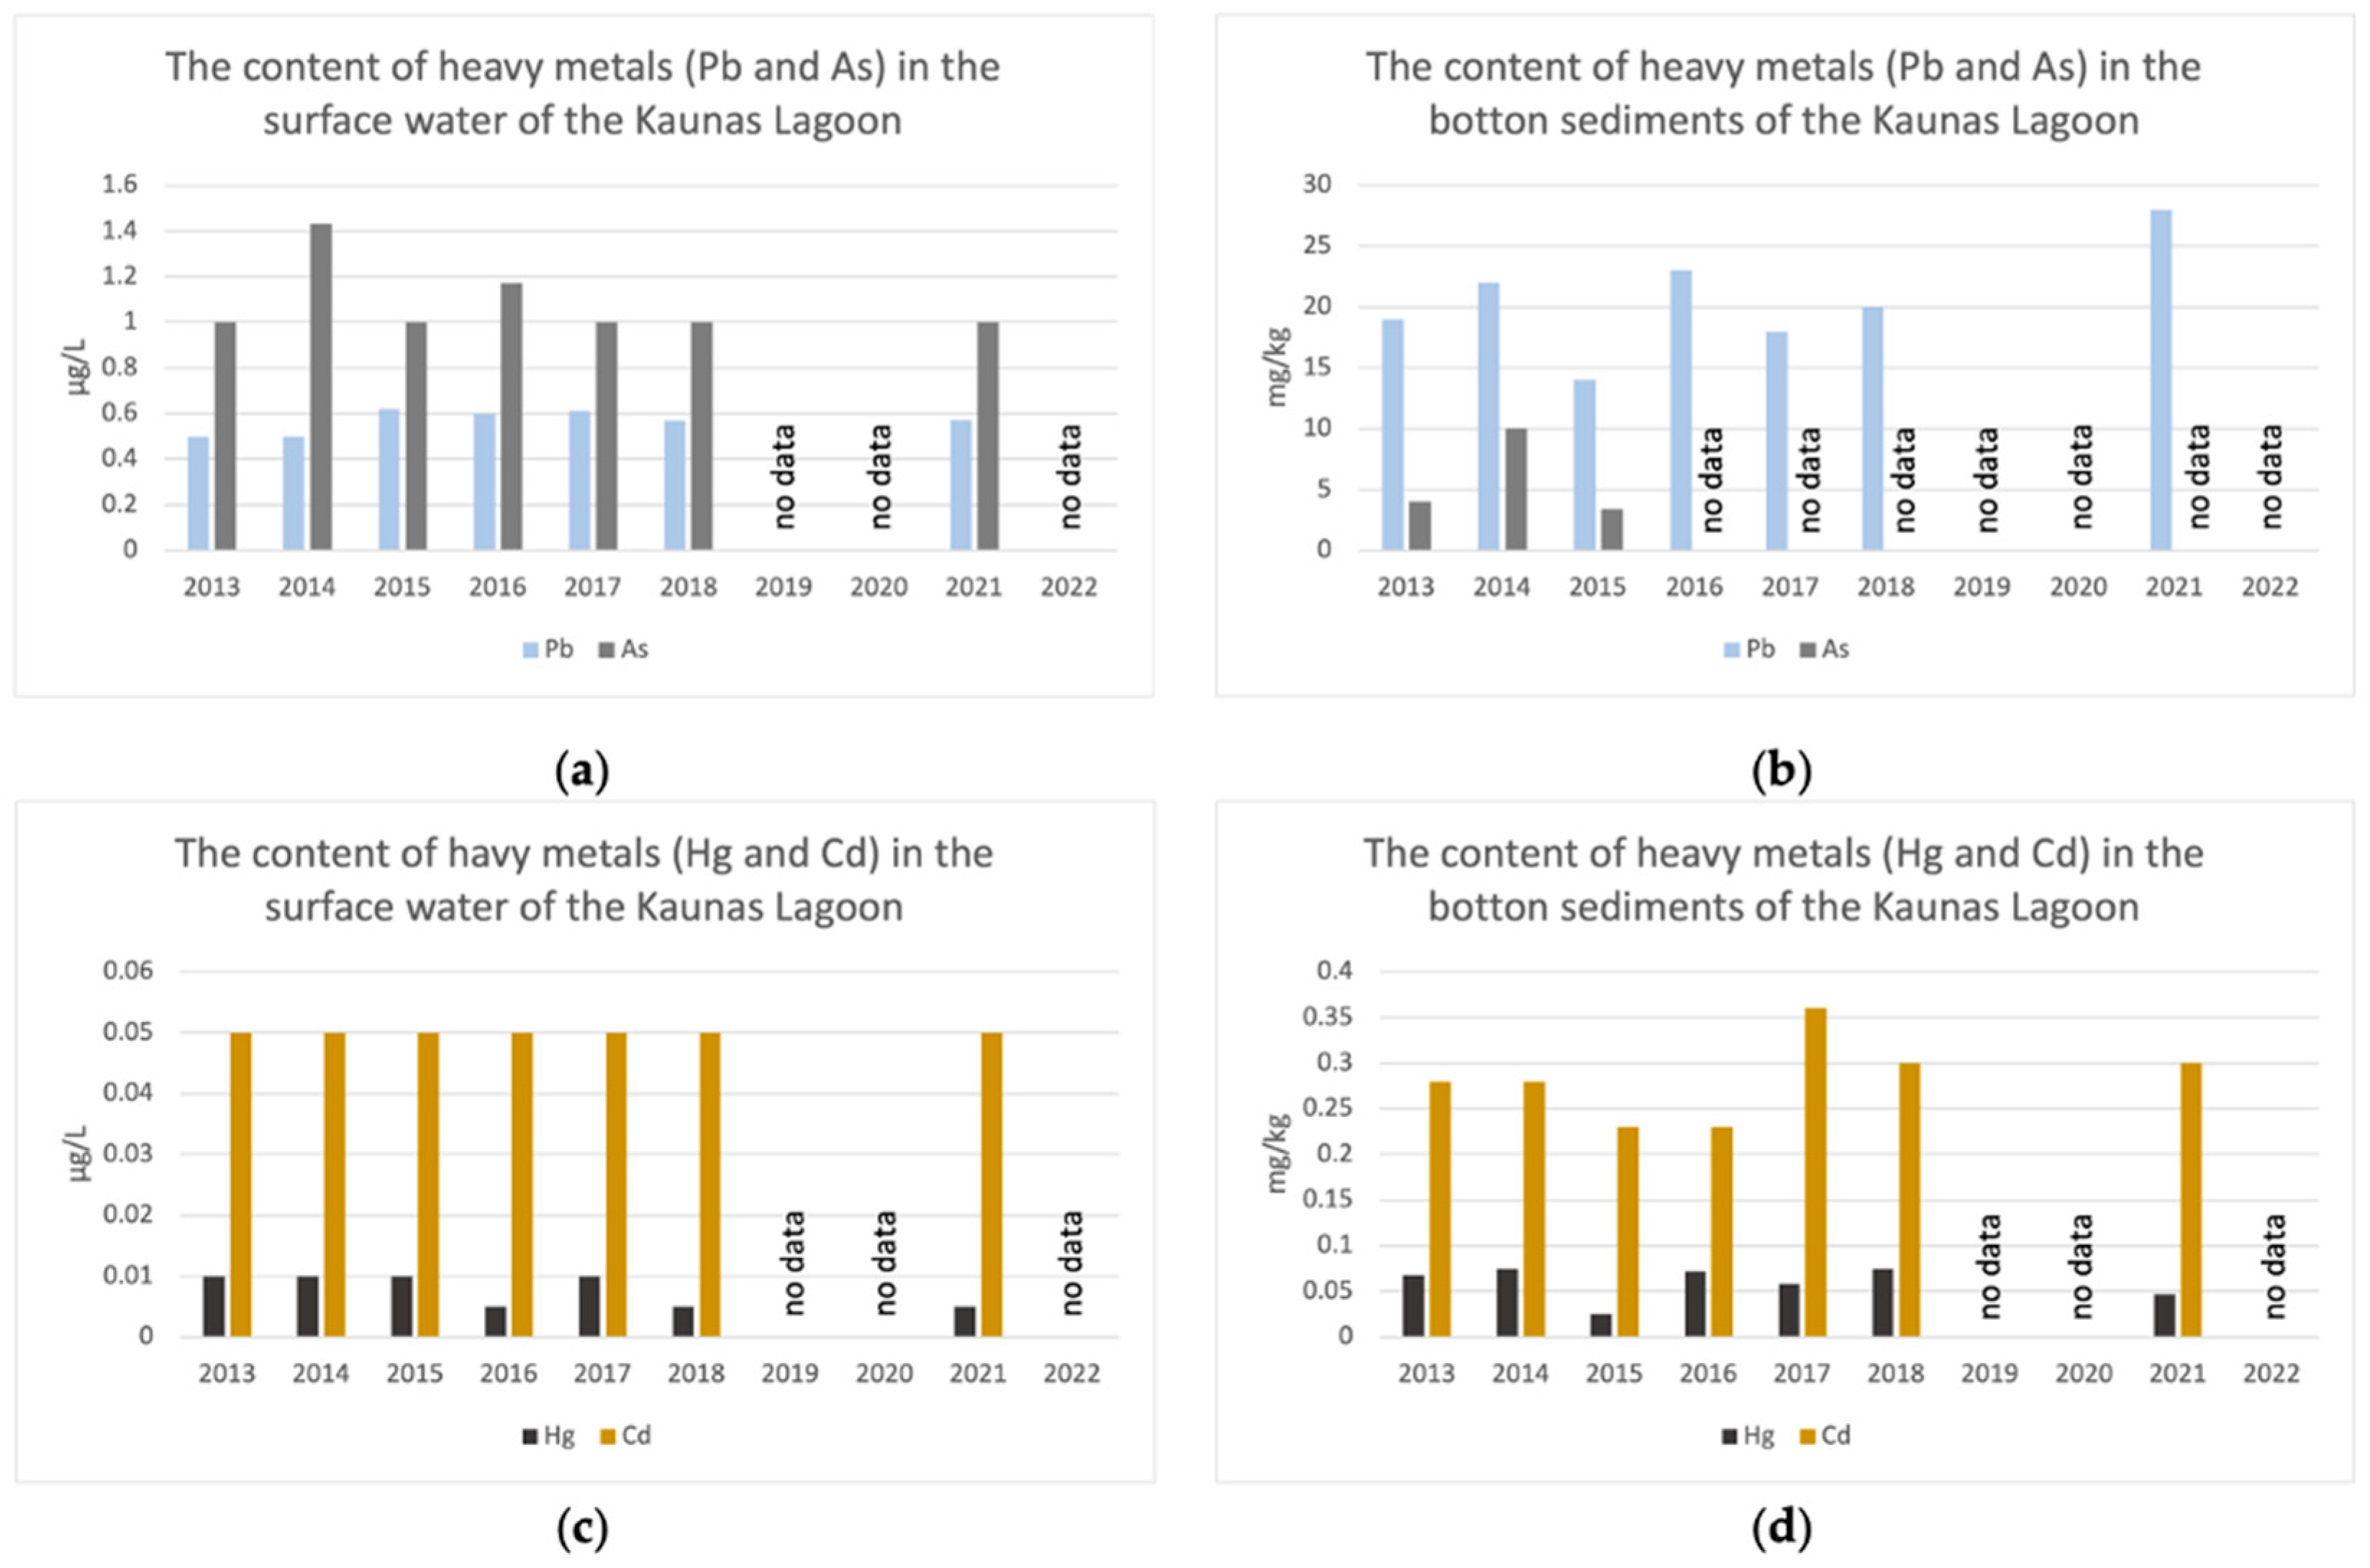
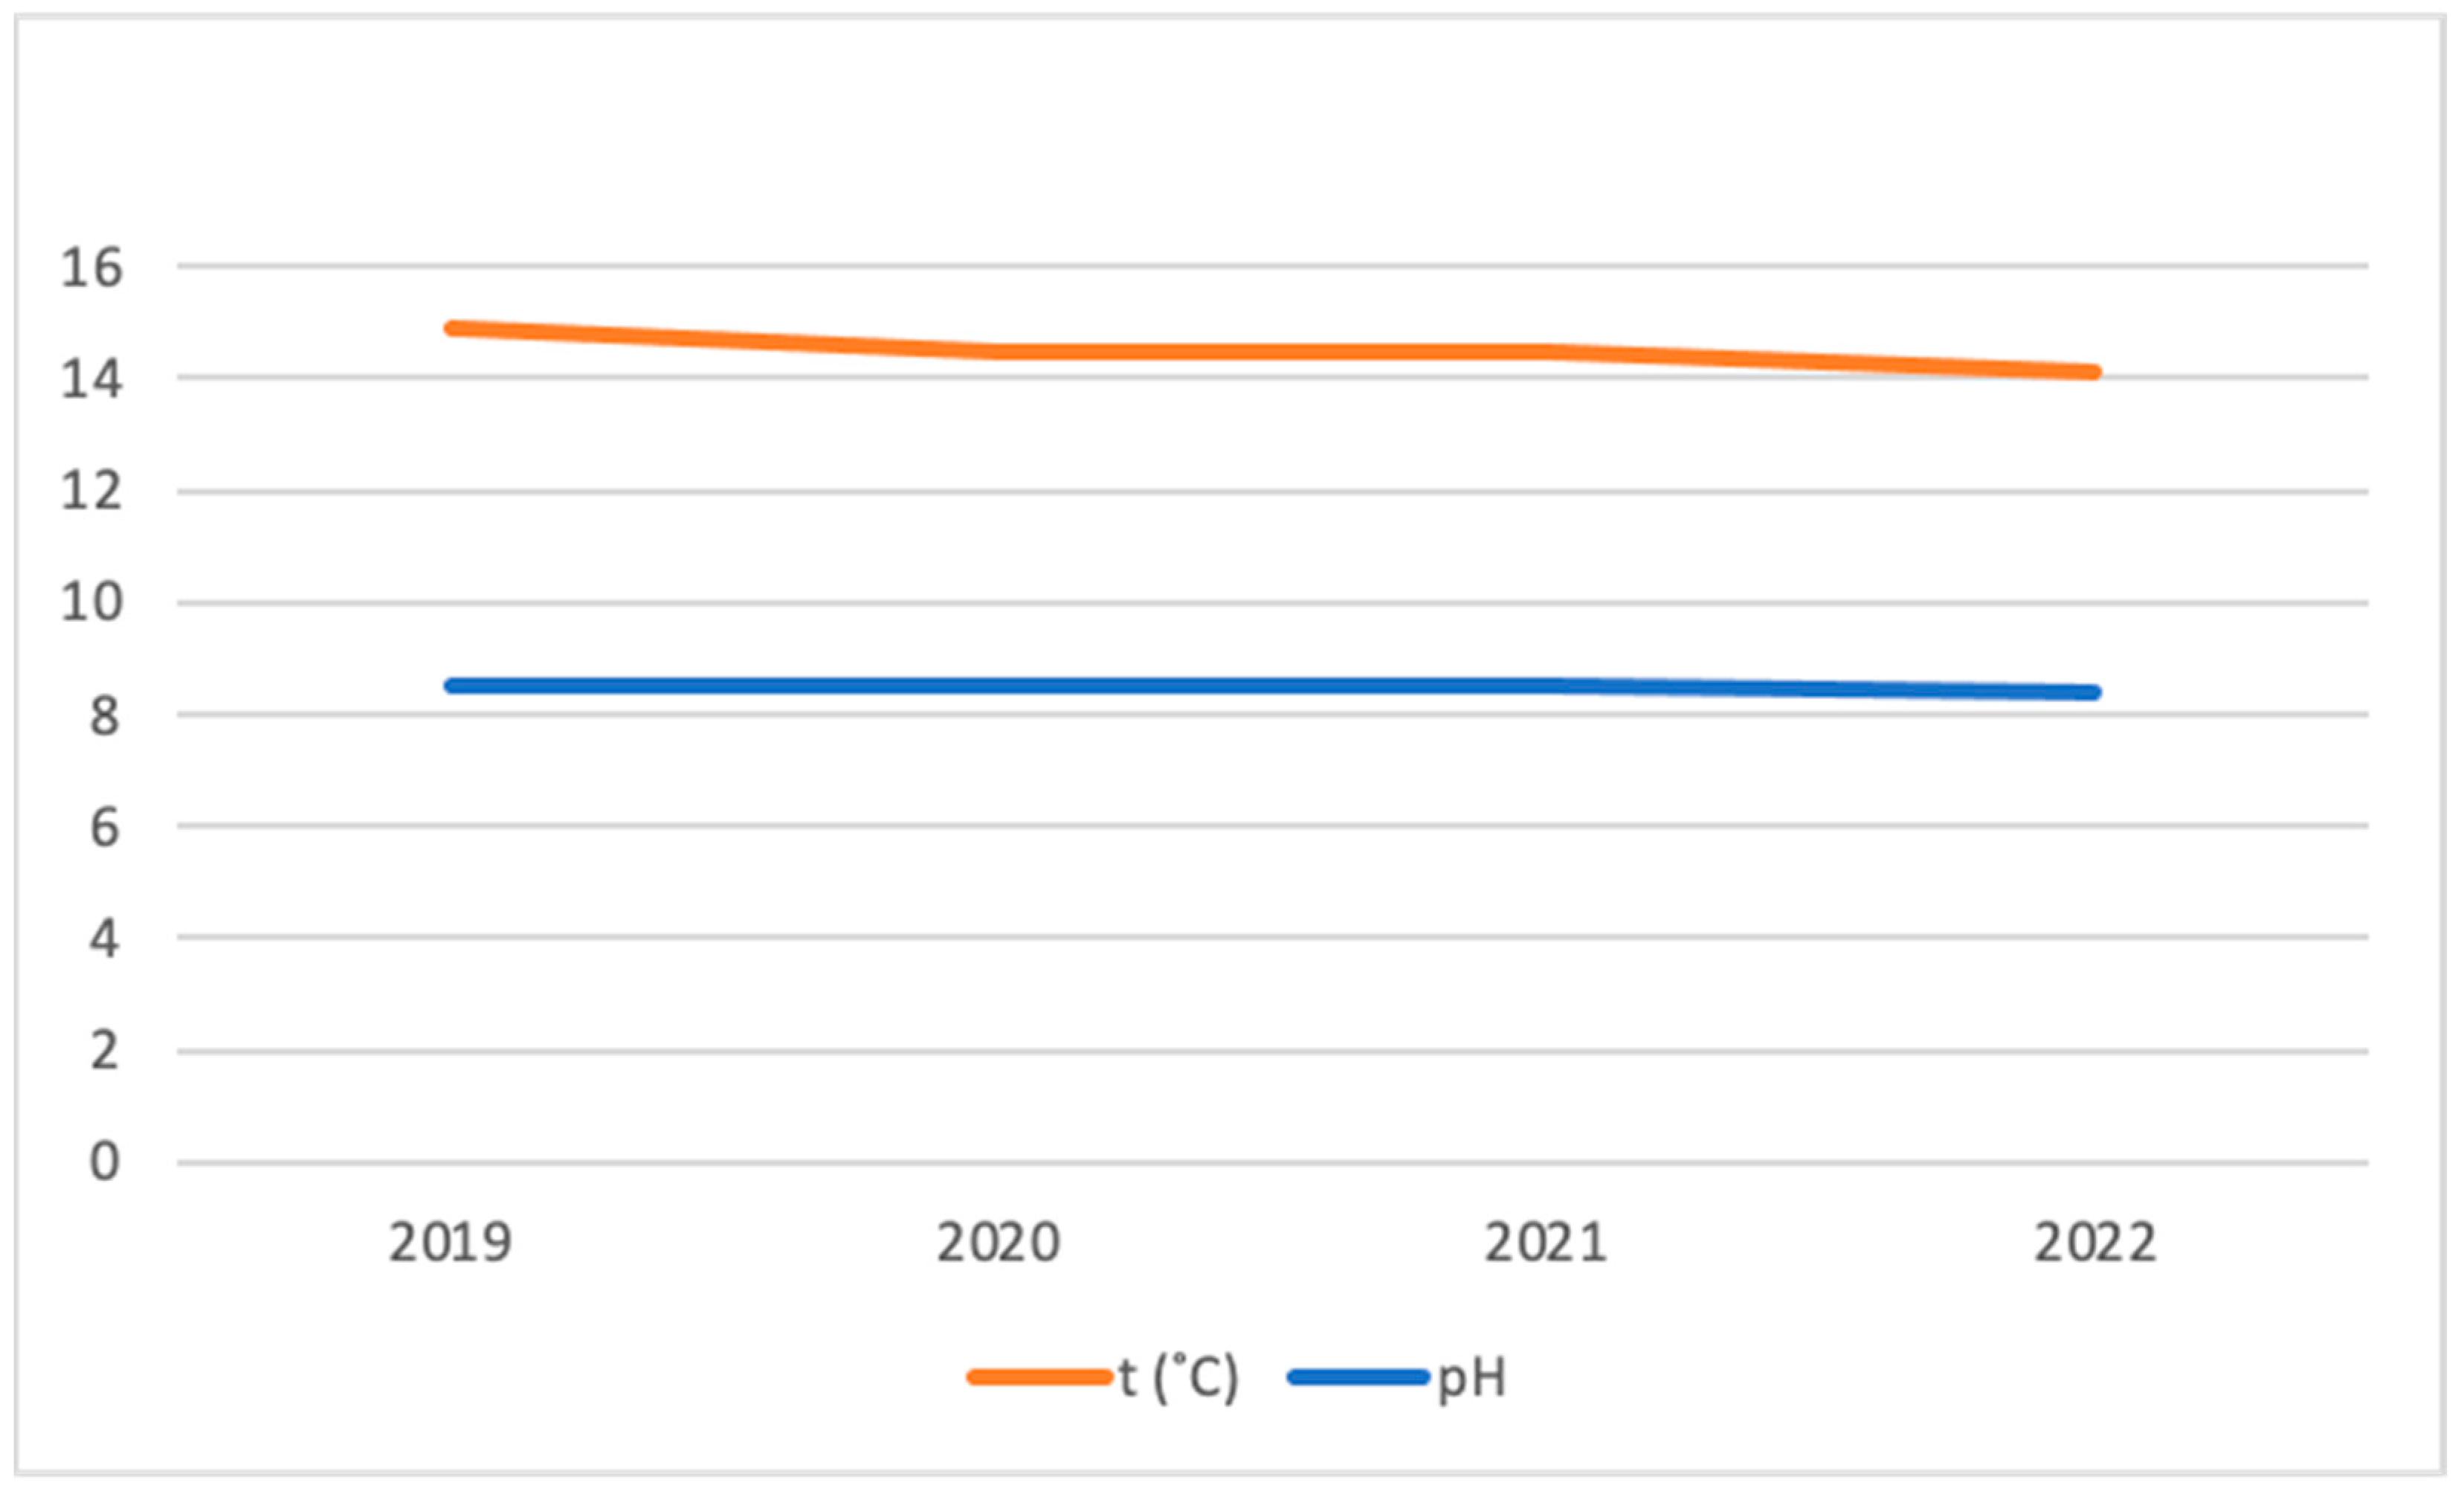
3.1. Heavy Metal Content in the Water Body
3.2. Aspects of Heavy Metal Binding by Cyanobacteria and C-PC
3.3. The Influence of the Purification Method on the Heavy Metal Content in C-PC
3.4. Regulation of Heavy Metal Content in Products
3.4.1. Food Products
3.4.2. Cosmetic Products
3.4.3. Medical Devices
3.4.4. Medicines
4. Materials and Methods
4.1. Collection of Cyanobacterial Biomass
4.2. C-PC Extraction and Purification
4.3. Materials: C-PC Partially Purified from S. platensis
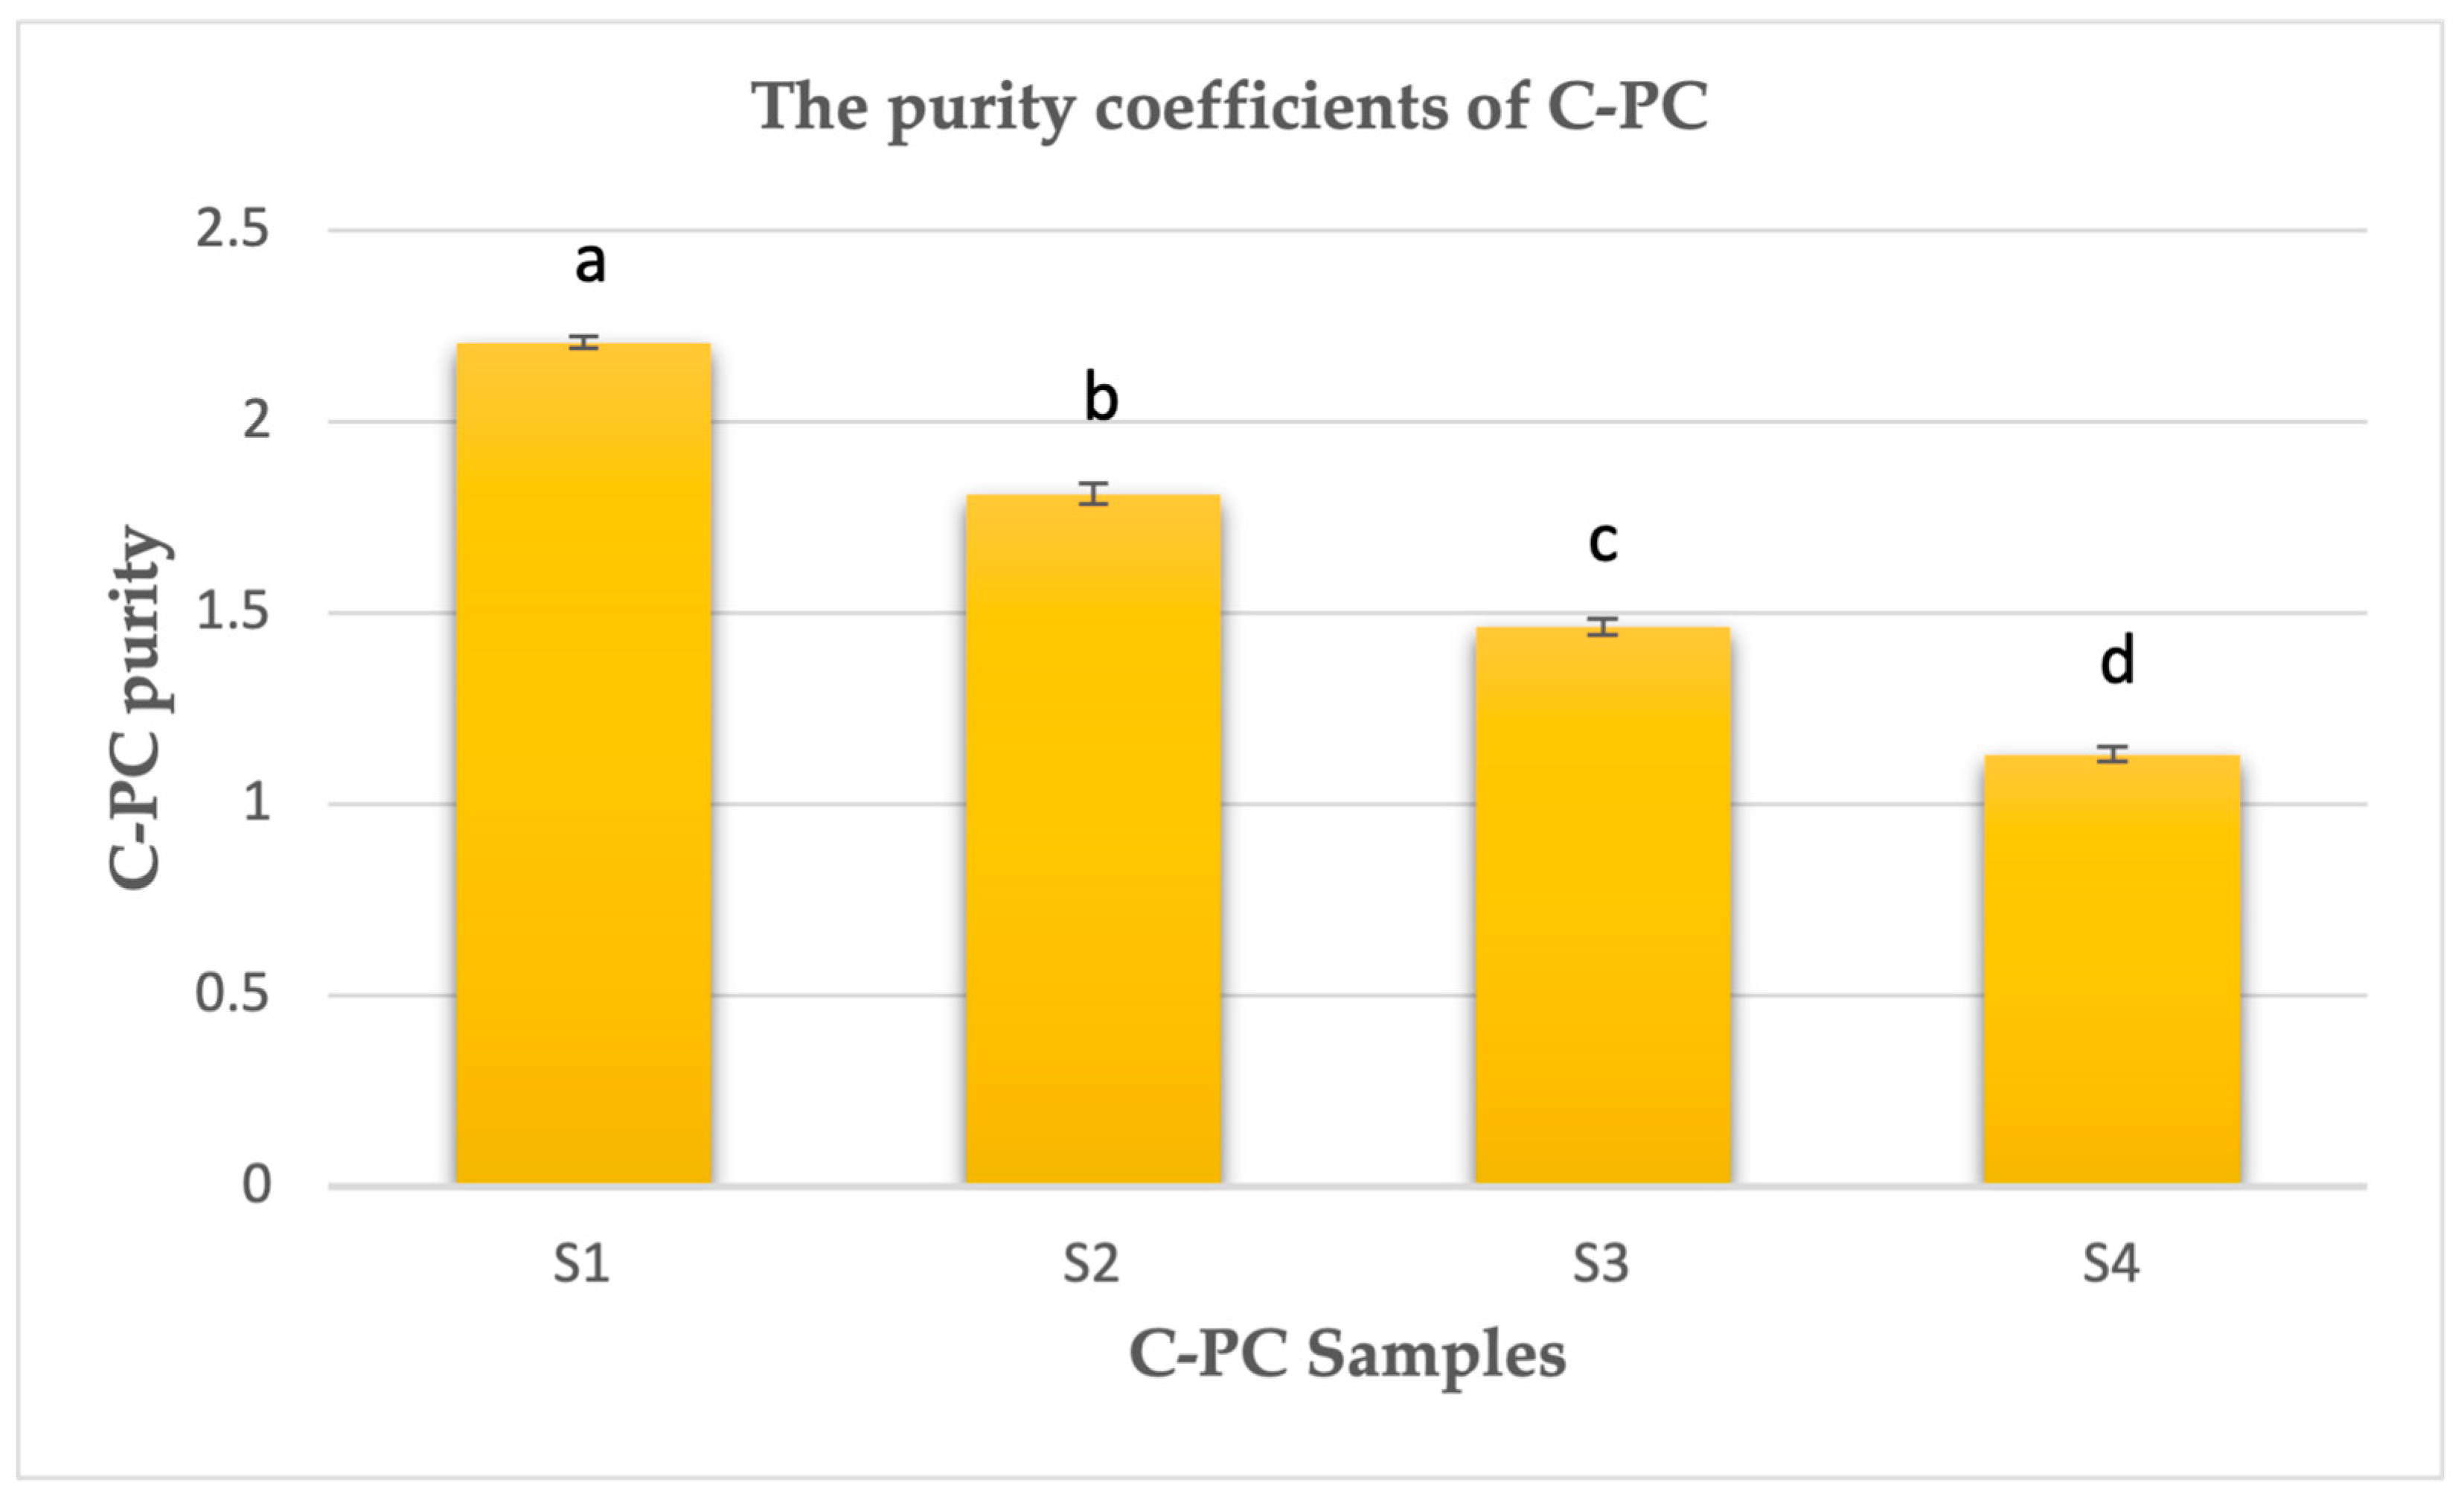
4.4. Purity Assessment of Phycocyanin
4.5. C-PC Sample Collection
4.6. Inductively Coupled Plasma-Mass Spectrometry
4.7. Statistical Analysis
5. Conclusions
Author Contributions
Funding
Data Availability Statement
Conflicts of Interest
References
- Chen, L.; Giesy, J.; Adamovsky, O.; Svirčev, Z.; Meriluoto, J.; Codd, G.A.; Mijovik, B.; Shi, T.; Xun, T.; Li, S.C.; et al. Challenges of using blooms of Microcystis spp. in animal feeds: A comprehensive review of nutritional, toxicological and microbial health evaluation. Sci. Total Environ. 2021, 764, 142319. [Google Scholar]
- Wright, L.P.; Zhang, L.; Cheng, I.; Aherne, J.; Wentworth, G.R. Impacts and Effects Indicators of Atmospheric Deposition of Major Pollutants to Various Ecosystems—A Review. Aerosol Air Qual. Res. 2018, 18, 1953–1992. [Google Scholar] [CrossRef]
- Chi, Z.; Hong, B.; Tan, S.; Wu, Y.; Li, H.; Lu, C.H.; Li, W. Impact Assessment of heavy metal cations to the characteristics of photosynthetic phycocyanin. J. Hazard. Mater. 2020, 391, 122225. [Google Scholar] [CrossRef] [PubMed]
- Rahman, Z.; Singh, V.P. The relative impact of toxic heavy metals (THMs) (arsenic (As), cadmium (Cd), chromium (Cr)(VI), mercury (Hg), and lead (Pb)) on the total environment: An overview. Environ. Monit. Assess. 2019, 191, 419. [Google Scholar] [PubMed]
- Shanab, S.; Essa, A.; Shalaby, E. Bioremoval capacity of three heavy metals by some microalgae species (Egyptian Isolates). Plant Signal. Behav. 2012, 7, 392–399. [Google Scholar] [CrossRef] [PubMed]
- Mehta, S.K.; Gaur, J.P. Use of Algae for Removing Heavy Metal Ions from Wastewater: Progress and Prospects. Crit. Rev. Biotechnol. 2005, 25, 113–152. [Google Scholar] [PubMed]
- Xia, W.; Chen, L.; Deng, X.; Liang, G.; Giesy, J.P.; Rao, Q.; Wen, Z.; Wu, Y.; Chen, J.; Xie, P. Spatial and interspecies differences in concentrations of eight trace elements in wild freshwater fishes at different trophic levels from middle and eastern China. Sci. Total Environ. 2019, 672, 883–892. [Google Scholar] [CrossRef]
- Raulinaitis, M.; Ignatavičius, G.; Sinkevičius, S.; Oškinis, V. Assessment of heavy metal contamination and spatial distribution in surface and surface sedimental layers in the northern part of Lake Babrukas. Ekologija 2012, 58, 33–43. [Google Scholar] [CrossRef]
- Tchounwou, P.B.; Yedjou, C.G.; Patlolla, A.K.; Sutton, D.J. Heavy Metal Toxicity and the Environment. Environmental Toxicology. In Molecular, Clinical and Environmental Toxicology, 1st ed.; Lunch, A., Ed.; Springer: New York, NY, USA, 2012; Volume 3, pp. 133–164. [Google Scholar]
- Yadav, S.; Prajapati, R.; Atri, N. UV-B-Heavy Metal Interaction: Comparative Evaluation on Photosynthetic Properties of Three Cyanobacteria. Curr. Microbiol. 2016, 73, 739–746. [Google Scholar] [CrossRef]
- Jia, Y.; Chen, W.; Zuo, Y.; Lin, L.; Song, L. Heavy metal migration and risk transference associated with cyanobacterial blooms in eutrofic freshwater. Sci. Total Environ. 2018, 613–614, 1324–1330. [Google Scholar] [CrossRef]
- Bellamy-Carter, J.; Sound, J.K.; Leney, A.C. Probing heavy metal binding to phycobiliproteins. FEBS J. 2022, 289, 4646–4656. [Google Scholar] [CrossRef]
- Minkova, K.M.; Tchernov, A.A.; Tchorbadjieva, M.I.; Fournadjieva, S.T.; Antova, R.E.; Busheva, M.C. Purification of C-phycocyanin from Spirulina (Arthrospira) fusiformis. J. Biotechnol. 2003, 102, 55–59. [Google Scholar] [CrossRef] [PubMed]
- Kauno Marios Regional Park. Available online: https://kaunomarios.lt/gamta,p2#Hidrologija (accessed on 15 April 2023).
- The Environmental Protection Agency. Available online: https://aaa.lrv.lt/lt/veiklos-sritys/vanduo/upes-ezerai-ir-tvenkiniai/upiu-ezeru-ir-tvenkiniu-bukle/upiu-ezeru-ir-tvenkiniu-chemine-bukle (accessed on 17 April 2023).
- Apibendrinta Lietuvos Aplinkos Būklės ir Jos Pokyčių Ataskaita 2022, Aplinkos Apsaugos Agentūra. Available online: https://aaa.lrv.lt/uploads/aaa/documents/files/leidinys%20ataskaita_SPAUDA11(1).pdf (accessed on 19 April 2023).
- Rossen, B.P. Biochemistry of arsenic detoxification. FEBS Lett. 2002, 529, 86–92. [Google Scholar] [CrossRef] [PubMed]
- Mathema, V.B.; Thakuri, B.C.; Sillanpää, M. Bacterial mer operon-mediated detoxification of mercurial compounds: A short review. Arch. Microbiol. 2011, 193, 837–844. [Google Scholar] [CrossRef]
- Cires, S.; Ballot, A. A review of the phylogeny, ecology, and toxin production of bloom- forming Aphanizomenon spp. and related species within the Nostocales (cyanobacteria). Harmful Algae 2016, 54, 21–43. [Google Scholar] [PubMed]
- Chen, J.Z.; Tao, X.C.; Xu, J.; Zhang, T.; Liu, Z.L. Biosorption of lead, cadmium, and mercury by immobilized Microcystis aeruginosa in a column. Process Biochem. 2005, 40, 3675–3679. [Google Scholar] [CrossRef]
- Sun, R.; Mo, Y.; Feng, X.; Zhang, L.; Jin, L.; Li, Q. Effects of typical species (Aphanizomenon fosaquae and Microcystis aeruginosa) on photoreduction of Hg2+ in water body. J. Environ. Sci. 2019, 85, 9–16. [Google Scholar] [CrossRef]
- Al-Dhabi, N.A. Heavy metal analysis in commercial Spirulina products for human consumption. Saudi J. Biol. Sci. 2013, 20, 383–388. [Google Scholar] [CrossRef] [PubMed]
- Gelagutashvili, E. Interaction of Heavy Metal Ions with C-Phycocyanin: Binding Isotherms and Cooperative Effects. Available online: https://arxiv.org/abs/0707.3019 (accessed on 10 March 2023).
- Park, W.S.; Kim, H.J.; Li, M.; Lim, D.H.; Kim, J.; Kwak, S.S.; Kang, C.M.; Ferruzzi, M.G.; Ahn, M.J. Two Classes of Pigments, Carotenoids and C-Phycocyanin, in Spirulina Powder and Their Antioxidant Activities. Molecules 2018, 23, 2065. [Google Scholar] [CrossRef]
- Glazer, A.N. Phycobilisome: A macromolecular complex optimized for light energy transfer. Biochim. Biophys. Acta 1984, 768, 29–51. [Google Scholar] [CrossRef]
- Silva, E.F.; Figueira, F.S.; Lettnin, A.P.; Carrett-Dias, M.; Filgueira, D.M.V.B.; Kalil, S.; Trindade, G.S.; Votto, A.P.S. C-Phycocyanin: Cellular targets, mechanisms of action and multi drug resistance in cancer. Pharmacol. Rep. 2017, 70, 75–80. [Google Scholar] [CrossRef]
- Tan, S.; Tan, X.; Chi, Z.; Zhang, D.; Li, W. In vitro assessment of the toxicity of lead (Pb2+) to phycocyanin. Chemosphere 2018, 192, 171–177. [Google Scholar] [CrossRef]
- Chi, Z.; Tan, S.; Tan, X.; Zhong, L.; Li, W. The toxicity of cadmium ion (Cd2+) to phycocyanin: An in vitro spectroscopic study. Environ. Sci. Pollut. Res. 2018, 25, 14544–14550. [Google Scholar] [CrossRef] [PubMed]
- Ashaolu, T.J.; Samborska, K.; Lee, C.C.; Tomas, M.; Capanoglu, E.; Tarhan, O.; Taze, B.; Jafari, S.M. Phycocyanin, a super functional ingredient from algae; properties, purification characterization, and applications. Int. J. Biol. Macromol. 2021, 193, 2320–2331. [Google Scholar]
- Patel, A.; Mishra, S.; Pawar, R.; Ghosh, P.K. Purification, and characterization of C-PC from cyanobacteria species of marine and freshwater habitat. Protein Expr. Purif. 2005, 40, 248–255. [Google Scholar] [CrossRef]
- Jungbauer, A.; Hahn, R. Ion-Exchange Chromatography. In Methods in Enzymology, 1st ed.; Jungbauer, A., Hahn, R., Eds.; Elsevier: Amsterdam, The Netherlands, 2009; Volume 463, pp. 349–371. [Google Scholar]
- Moraes, C.C.; Kalil, S.J. Strategy for a protein purification design using C-phycocyanin extract. Bioresour. Technol. 2009, 100, 5312–5317. [Google Scholar] [CrossRef]
- Silveira, S.T.; Quines, L.K.M.; Burkert, C.A.V.; Kalil, S.J. Separation of phycocyanin from Spirulina platensis using ion exchange chromatography. Bioprocess Biosyst. Eng. 2008, 31, 477–482. [Google Scholar] [CrossRef]
- Patil, G.; Chethana, S.; Sridevi, A.S.; Raghavarao, K.S.M.S. Method to obtain C-phycocyanin of high purity. J. Chromatogr. A 2006, 1127, 76–81. [Google Scholar] [CrossRef]
- Pierre, G.; Delattre, C.; Dubessay, P.; Jubeau, S.; Vialleix, C.; Cadoret, J.P.; Probert, I.; Michaud, P. What is in Store for EPS Microalgae in the Next Decade? Molecules 2019, 24, 4296. [Google Scholar] [CrossRef] [PubMed]
- Adjali, A.; Clarot, I.; Chen, Z.; Marchioni, E.; Boudier, A. Physicochemical degradation of phycocyanin and means to improve its stability: A short review. J. Pharm. Anal. 2022, 12, 406–414. [Google Scholar] [PubMed]
- Yu, P.; Wu, Y.; Wang, G.; Jia, T.; Zhang, Y. Purification and bioactivities of phycocyanin. Crit. Rev. Food Sci. Nutr. 2017, 57, 3840–3849. [Google Scholar] [PubMed]
- Council Regulation (EEC) No 315/93 of 8 February 1993 Laying Down Community Procedures for Contaminants in Food. Available online: https://eur-lex.europa.eu/legal-content/EN/TXT/?uri=CELEX%3A01993R0315-20090807 (accessed on 25 May 2023).
- Commission Regulation (EU) 2023/915 of 25 April 2023 on Maximum Levels for Certain Contaminants in Food and Repealing Regulation (EC) No 1881/2006. Available online: https://eur-lex.europa.eu/legal-content/EN/ALL/?uri=celex%3A32006R1881 (accessed on 25 May 2023).
- Sandgruber, F.; Gielsdorf, A.; Baur, A.C.; Schenz, B.; Müler, S.M.; Schwerdtle, T.; Stangl, G.I.; Griehl, C.; Lorkowski, S.; Dawczynski, C. Variability in Macro- and Micronutrients of 15 Commercially Available Microalgae Powders. Mar. Drugs 2021, 19, 310. [Google Scholar] [PubMed]
- Regulation (EC) No 1223/2009 of the European Parliament and of the Council of 30 November 2009 on Cosmetic Products. Available online: https://eur-lex.europa.eu/legal-content/EN/TXT/?uri=CELEX%3A02009R1223-20221217 (accessed on 25 May 2023).
- 2013/674/EU: Commission Implementing Decision of 25 November 2013 on Guidelines on Annex I to Regulation (EC) No 1223/2009 of the European Parliament and of the Council on Cosmetic Products. Available online: https://eur-lex.europa.eu/legal-content/EN/TXT/?uri=CELEX%3A32013D0674 (accessed on 25 May 2023).
- Regulation (EU) 2017/745 of the European Parliament and of the Council of 5 April 2017 on Medical Devices, Amending Directive 2001/83/EC, Regulation (EC) No 178/2002 and Regulation (EC) No 1223/2009 and Repealing Council Directives 90/385/EEC and 93/42/EEC. Available online: https://eur-lex.europa.eu/legal-content/EN/ALL/?uri=CELEX%3A32017R0745 (accessed on 25 May 2023).
- Regulation (EC) No 1272/2008 of the European Parliament and of the Council of 16 December 2008 on Classification, Labelling and Packaging of Substances and Mixtures, Amending and Repealing Directives 67/548/EEC and 1999/45/EC, and Amending Regulation (EC) No 1907/2006. Available online: https://eur-lex.europa.eu/legal-content/EN/TXT/?uri=CELEX%3A02008R1272-20230420 (accessed on 25 May 2023).
- ICH Guideline Q3D (R2) on Elemental Impurities. EMA/CHMP/ICH/353369/2013, Committee of Medicinal Products for Human Use. 2 May 2022. Available online: https://www.ema.europa.eu/en/documents/scientific-guideline/international-conference-harmonisation-technical-requirements-registration-pharmaceuticals-human-use_en-16.pdf (accessed on 25 May 2023).
- Khazi, M.I.; Demirel, Z.; Liaqat, F.; Dalay, M.C. Analytical Grade Purification of Phycocyanin from Cyanobacteria. In Biofuels from Algae. Methods in Molecular Biology, 1st ed.; Spilling, K., Ed.; Springer: New York, NY, USA, 1980; pp. 173–179. [Google Scholar]
- Bennett, A.; Bogorad, L. Complementary chromatic adaption in a filamentous blue-green alga. J. Cell Biol. 1973, 58, 419–435. [Google Scholar] [PubMed]


| Products | Maximum Levels for Heavy Metals | References | |||
|---|---|---|---|---|---|
| Pb | Cd | As | Hg | ||
| Food supplements | 3 mg/kg | 1 mg/kg (3 mg/kg) 1 | Not identified | 0.10 mg/kg | Regulation (EU) 2023/915 [38] |
| Cosmetic products | Prohibited 2 | Prohibited 2 | Prohibited 2 | 0.007% of ready-to-use preparation 3 | Regulation 1223/2009 [41] |
| Medical devices | ≤0.1% by mass (w/w) 4 | ≤0.1% by mass (w/w) 4 | ≤0.1% by mass (w/w) 4 | ≤0.1% by mass (w/w) 4 | Regulation 2017/745 [42] |
| Medicines 5 | |||||
| Oral | 5 μg/day (0.5 μg/g) | 5 μg/day (0.5 μg/g) | 15 μg/day (1.5 μg/g) | 30 μg/day (3 μg/g) | ICH guideline Q3D (R2) on elemental impurities [44] |
| Parental | 5 μg/day (0.5 μg/g) | 1.7 μg/day (0.2 μg/g) | 15 μg/day (1.5 μg/g) | 3 μg/day (0.3 μg/g) | |
| Inhalation | 50 μg/day (5 μg/g) | 3 μg/day (0.3 μg/g), | 1.9 μg/day (0.2 μg/g) | 1.2 μg/day (0.1 μg/g), | |
| Cutaneous | 50 μg/day (5 μg/g) | 20 μg/day (2 μg/g) | 30 μg/day (3 μg/g) | 30 μg/day (3 μg/g) | |
| Sample Code | Substance | Source | Purification Method | Year |
|---|---|---|---|---|
| S1 | C-PC, lyophilized powder | Cyanobacterial biomass, Kaunas Lagoon, Lithuania (A. flos-aquae) | Ion exchange chromatography | 2019 |
| S2 | C-PC, lyophilized powder | Cyanobacterial biomass, Kaunas Lagoon, Lithuania (Microcystis spp.) | Gel filtration chromatography | 2020 |
| S3 | C-PC, lyophilized powder | Cyanobacterial biomass, Kaunas Lagoon, Lithuania (Microcystis spp.) | Gel filtration chromatography | 2022 |
| S4 | C-PC, lyophilized powder | Cultivated S. platensis, (Sigma-Aldrich) | Unknown | Unknown |
| ICP-MS Parameter | Operation Conditions |
|---|---|
| Spray chamber | Quartz cyclonic |
| Sample introduction | MEINHARD® nebulizer |
| RF 1 power | 1300 W |
| Plasma Ar 2 flow | 18 L/min |
| Nebulizer Ar flow | 1.02 L/min |
| Auxiliary Ar low | 1.20 L/min |
| Mode | STD |
| Helium flow for KED 3 | 5.3 mL/min |
| Dwell time | 50 ms |
| Replicates | 3 |
| Heavy Metal | LOD (µg/L) | LOQ (µg/L) |
|---|---|---|
| Pb | 0.002 | 0.008 |
| Cd | 0.002 | 0.006 |
| As | 0.001 | 0.004 |
| Hg | 0.005 | 0.016 |
Disclaimer/Publisher’s Note: The statements, opinions and data contained in all publications are solely those of the individual author(s) and contributor(s) and not of MDPI and/or the editor(s). MDPI and/or the editor(s) disclaim responsibility for any injury to people or property resulting from any ideas, methods, instructions or products referred to in the content. |
© 2023 by the authors. Licensee MDPI, Basel, Switzerland. This article is an open access article distributed under the terms and conditions of the Creative Commons Attribution (CC BY) license (https://creativecommons.org/licenses/by/4.0/).
Share and Cite
Galinytė, D.; Balčiūnaitė-Murzienė, G.; Karosienė, J.; Morudov, D.; Naginienė, R.; Baranauskienė, D.; Šulinskienė, J.; Kudlinskienė, I.; Savickas, A.; Savickienė, N. Determination of Heavy Metal Content: Arsenic, Cadmium, Mercury, and Lead in Cyano-Phycocyanin Isolated from the Cyanobacterial Biomass. Plants 2023, 12, 3150. https://doi.org/10.3390/plants12173150
Galinytė D, Balčiūnaitė-Murzienė G, Karosienė J, Morudov D, Naginienė R, Baranauskienė D, Šulinskienė J, Kudlinskienė I, Savickas A, Savickienė N. Determination of Heavy Metal Content: Arsenic, Cadmium, Mercury, and Lead in Cyano-Phycocyanin Isolated from the Cyanobacterial Biomass. Plants. 2023; 12(17):3150. https://doi.org/10.3390/plants12173150
Chicago/Turabian StyleGalinytė, Daiva, Gabrielė Balčiūnaitė-Murzienė, Jūratė Karosienė, Dmitrij Morudov, Rima Naginienė, Dalė Baranauskienė, Jurgita Šulinskienė, Ieva Kudlinskienė, Arūnas Savickas, and Nijolė Savickienė. 2023. "Determination of Heavy Metal Content: Arsenic, Cadmium, Mercury, and Lead in Cyano-Phycocyanin Isolated from the Cyanobacterial Biomass" Plants 12, no. 17: 3150. https://doi.org/10.3390/plants12173150