Article

Water and Nitrogen Coupling on the Regulation of Soil Nutrient–Microbial Biomass Balance and Its Effect on the Yield of Wolfberry (Lycium barbarum L.)

1
School of Civil and Water Engineering, Ningxia University, Yinchuan 750021, China
2
Ministry of Education Engineering Research Center for Modern Agricultural Water Resources Efficient Utilization in Dry Areas, Ningxia University, Yinchuan 750021, China
3
Ningxia Water-Saving Irrigation and Water Resources Control Engineering Technology Research Center, Ningxia University, Yinchuan 750021, China
4
The Scientific Research Institute of the Water Conservancy of Ningxia, Yinchuan 750021, China
*
Author to whom correspondence should be addressed.
These authors contributed equally to this work.
Plants 2023, 12(15), 2768; https://doi.org/10.3390/plants12152768
Submission received: 27 June 2023 / Revised: 18 July 2023 / Accepted: 20 July 2023 / Published: 25 July 2023
(This article belongs to the Special Issue Water and Nitrogen Management in Soil-Crop System II)

Abstract

:
Due to the problems of relatively fragile stability, the quality of soil in the drip-irrigated agricultural ecosystem has high spatial heterogeneity and experiences significant degradation. We conducted a two-year field plot study (2021–2022) in a typical region of the arid zone with the “wolfberry” crop as the research object, with three irrigation and three nitrogen application levels, and the local conventional management as the control (CK). Soil quality under experimental conditioning was comprehensively evaluated based on Principal Component Analysis (PCA) and Technique for Order Preference by Similarity to an Ideal Solution (TOPSIS), and regression analyses were carried out between the soil quality evaluation results and wolfberry yield. The results showed that short-term water and nitrogen regulation enhanced the soil nutrient content in the root zone of wolfberry to some extent, but it did not significantly affect soil carbon:soil nitrogen (Csoil:Nsoil), soil carbon:soil phosphorus (Csoil:Psoil), and soil nitrogen:soil phosphorus (Nsoil:Psoil). When the irrigation quota was increased from I1 to I2, the soil microbial biomass carbon, nitrogen, and phosphorus (Cmic, Nmic, and Pmic) tended to increase with the increase in N application, but the microbial biomass carbon:nitrogen (Cmic:Nmic), microbial biomass carbon:phosphorus (Cmic:Pmic), and microbial biomass nitrogen:phosphorus (Nmic:Pmic) did not change significantly. The comprehensive evaluation of the principal components and TOPSIS showed that the combined soil nutrient–microbial biomass and its ecological stoichiometry characteristics were better under the coupled treatments of I2, I3, N2, and N3, and the overall soil quality under these treatment conditions was significantly better than that under the CK treatment. Under I1 irrigation, nitrogen application significantly increased the yield of wolfberry, while under I2 and I3 irrigation, the wolfberry yield showed a parabolic trend with the increase in nitrogen application. The highest yield was recorded in the I2N2 treatment in the first and second years, with yields of 9967 kg hm−2 and 10,604 kg hm−2, respectively. The coefficient of determination (explained quantity) of the soil quality based on soil nutrient–microbial biomass and the characteristics of its ecological stoichiometry for wolfberry yield ranged from 0.295 to 0.573. These findings indicated a limited positive effect of these indicators of soil on wolfberry yield. The short-term water and nitrogen regulation partly influenced the soil and soil microbial biomass in agroecosystems, but the effect on elemental balance was not significant. Our findings might provide theoretical support for managing the health of agricultural ecosystems.

1. Introduction

Ecological stoichiometry is the study of energy balance and the balance between elements, such as carbon, nitrogen, and phosphorus, maintenance of whole ecosystems [1]. The concept was introduced by Elser et al. A study published by Sterner and Elser on ecological stoichiometry in Ecology and Oikos marked the emergence of ecological stoichiometry as a systematic and mature discipline [2]. Ecological stoichiometry is widely used for studying the dynamic balance of nutrients in the ecosystem, microbial nutrient transformation, and biogeochemical cycling in terrestrial ecosystems [3,4,5]. The elements C, N, and P are important components of soil as they are responsible for soil nutrient balance and cyclic transformation. Improper and extensive land use and anthropogenic activities can significantly disrupt the dynamic balance of C, N, and P and their distribution characteristics in the soil [6]. Microbial biomass is considered to be a source and sink in the soil nutrient cycling process, and its level reflects the soil organic matter turnover rate, soil vigor, and the level of ecosystem productivity [7,8]. The balance of microbial biomass is related to its activity and also influenced by processes such as nutrient release from soil organic matter [9,10].
Compared with other ecosystems, agricultural ecosystems have various applications, and human interference plays a dominant role in the development and evolution of the whole ecosystem. The study of the assignment of nutrient elements, such as C, N, and P, in crops and soils and their stoichiometric characteristics is important to elucidate the nutrient acquisition pathways of agricultural soils, reveal the cycling and transport of nutrients, and the evolution of the characteristics of the soil [11]. At present, most studies on the ecological stoichiometry of agricultural ecosystems have mainly focused on the effects of fertilization and tillage on the characteristics of the ecological stoichiometry of C, N, and P in the soil [12,13] and on the effects of fertilization and crop species on the ecological stoichiometry of crops [14]. The soil microbial biomass level was rarely addressed, and the studies were all on annual crops. Perennial crops have well-developed root systems and consume a large amount of soil nutrients, which can decrease soil quality and cause imbalances in elements. Understanding the effects of anthropogenic activities on soil nutrients and soil microbial ecological stoichiometry characteristics in the root zone of perennial crops is important for determining the health of the soil in agricultural ecosystems.
Wolfberry (Lycium barbarum L.) is a perennial deciduous shrub in the family Solanaceae [15]. It has significant beneficial effects on the kidney and liver, such as enhancing immunity, alleviating fever, clearing heat, and moistening the lungs [16,17]. Wolfberry requires a large amount of water and fertilizer, and to cope with regional water scarcity, drip irrigation technology is widely used in wolfberry cultivation [18]. Although water and fertilizer can be saved using this technique, they are mainly concentrated in the root zone of wolfberry, which decreases the stability of the soil and increases spatial heterogeneity, leading to changes in nutrient elements present in the soil not known.
Water and nitrogen fertilizer are the components most in demand during the cultivation of the wolfberry crop, and the application of water and nitrogen are also the most frequent and severely disruptive activity in cultivation. Proper water conditions promote plant root development, thus enhancing nitrogen uptake efficiency and conversion rate [19]. In contrast, inadequate water supply inhibits nitrogen fertilizer and crop growth. Too much will reduce the efficiency of water and fertilizer use, affecting crop yields and causing a large amount of soil nitrogen loss or leaching to the deep soil layer to cause soil and groundwater pollution [20]. Currently, Water and Nitrogen related researches mainly focus on the effects aspects such as crop growth, yield, quality, water and fertilizer use efficiency, and soil base nutrients [21,22]. The effects on the ecological stoichiometry characteristics of soil nutrient-microbial biomass have not been addressed. Thus, we conducted this study with the following objectives: (1) Discover the mechanism of short-term water and nitrogen regulation on the ecological stoichiometric balance of soil-microbial biomass; (2) Clarifying the amount of integrated soil quality contributing to crop yield based on soil nutrient allometry-microbial biomass ecological chemometrics. to construct a water and nitrogen management model with high efficiency of utilization of water and fertilizer resources, high yield and quality of wolfberry, and balanced soil nutrients.

2. Results

2.1. Characteristics of the Contents of Csoil, Nsoil, and Psoil and the Changes in the Ecological Stoichiometry

The contents of Csoil, Nsoil, and Psoil in the root zone of wolfberry in 2021 and 2022 showed an increasing trend with the increase in the application of N under the same irrigation quota (Figure 1a–c), while Csoil:Nsoil, Csoil:Psoil, and Nsoil:Psoil did not change significantly (Figure 1d–f). The content of Csoil showed maximum and minimum values under both I1N3 and I2N1 treatments; the content of Nsoil increased with an increase in the application of N, and the content of Psoil was relatively high under I2 irrigation. Csoil:Nsoil was higher under the I1N1 treatment, while Csoil:Psoil and Nsoil:Psoil were similar among treatments. Csoil:Nsoil was not significantly affected by water and N regulation or their interaction, but Csoil:Psoil and Nsoil:Psoil were significantly affected by irrigation (p < 0.05).

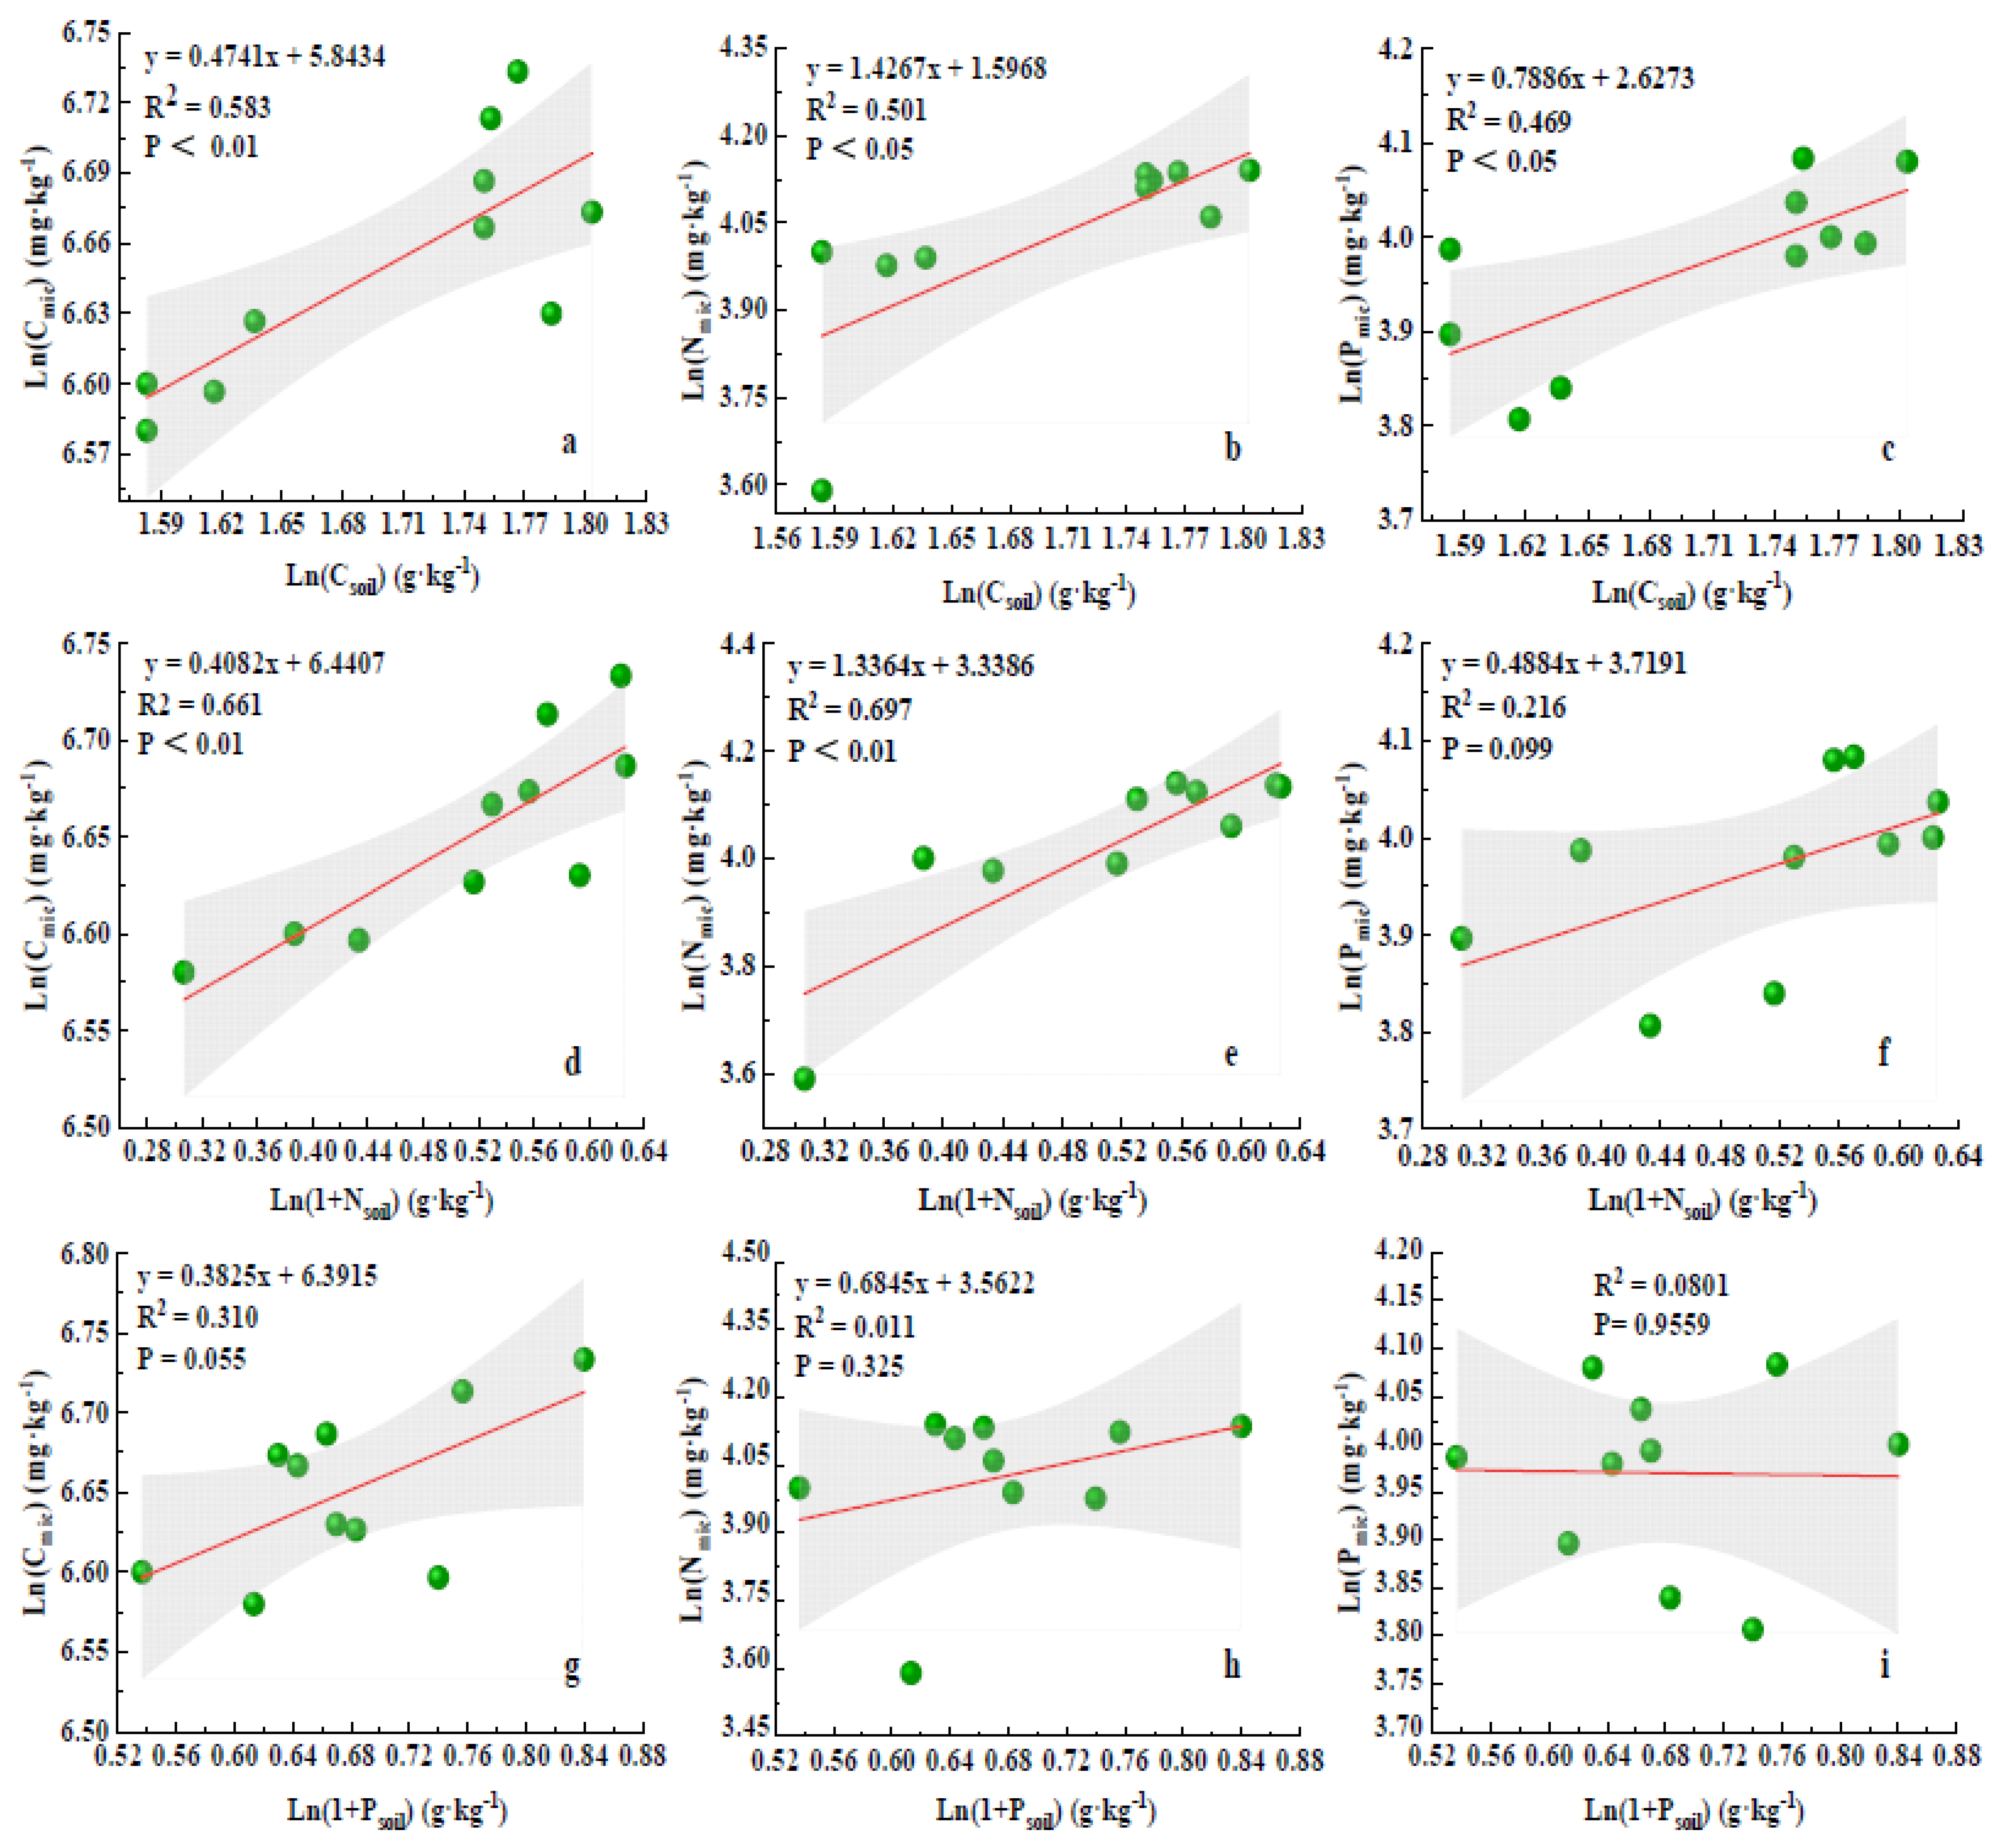
2.2. Characteristics of Cmic, Nmic, and Pmic, and the Changes in the Ecological Stoichiometry

The contents of soil Cmic, Nmic, and Pmic in the root zone of wolfberry in 2021 and 2022 gradually increased with the increase in the level of N application at the same irrigation level (Figure 2a–c), and the increase was more prominent when the irrigation amount increased from I1 to I2 gradient, but Cmic:Nmic, Cmic:Pmic, and Nmic:Pmic did not change significantly (Figure 2d–f). The soil Cmic content showed the highest and lowest values under the I2N3 and I1N1 treatments, respectively, and the soil Nmic content was significantly lower under the N1 treatment than under the N2 and N3 treatments in both years. Also, the values of Cmic:Nmic and Nmic:Pmic were significantly different under the I1N1 treatment compared to that under other treatments. Soil Cmic, Nmic, and Pmic were significantly affected by irrigation and N application. Additionally, Cmic:Nmic, Cmic:Pmic, and Nmic:Pmic were affected to different degrees by irrigation, N application, and their interaction.

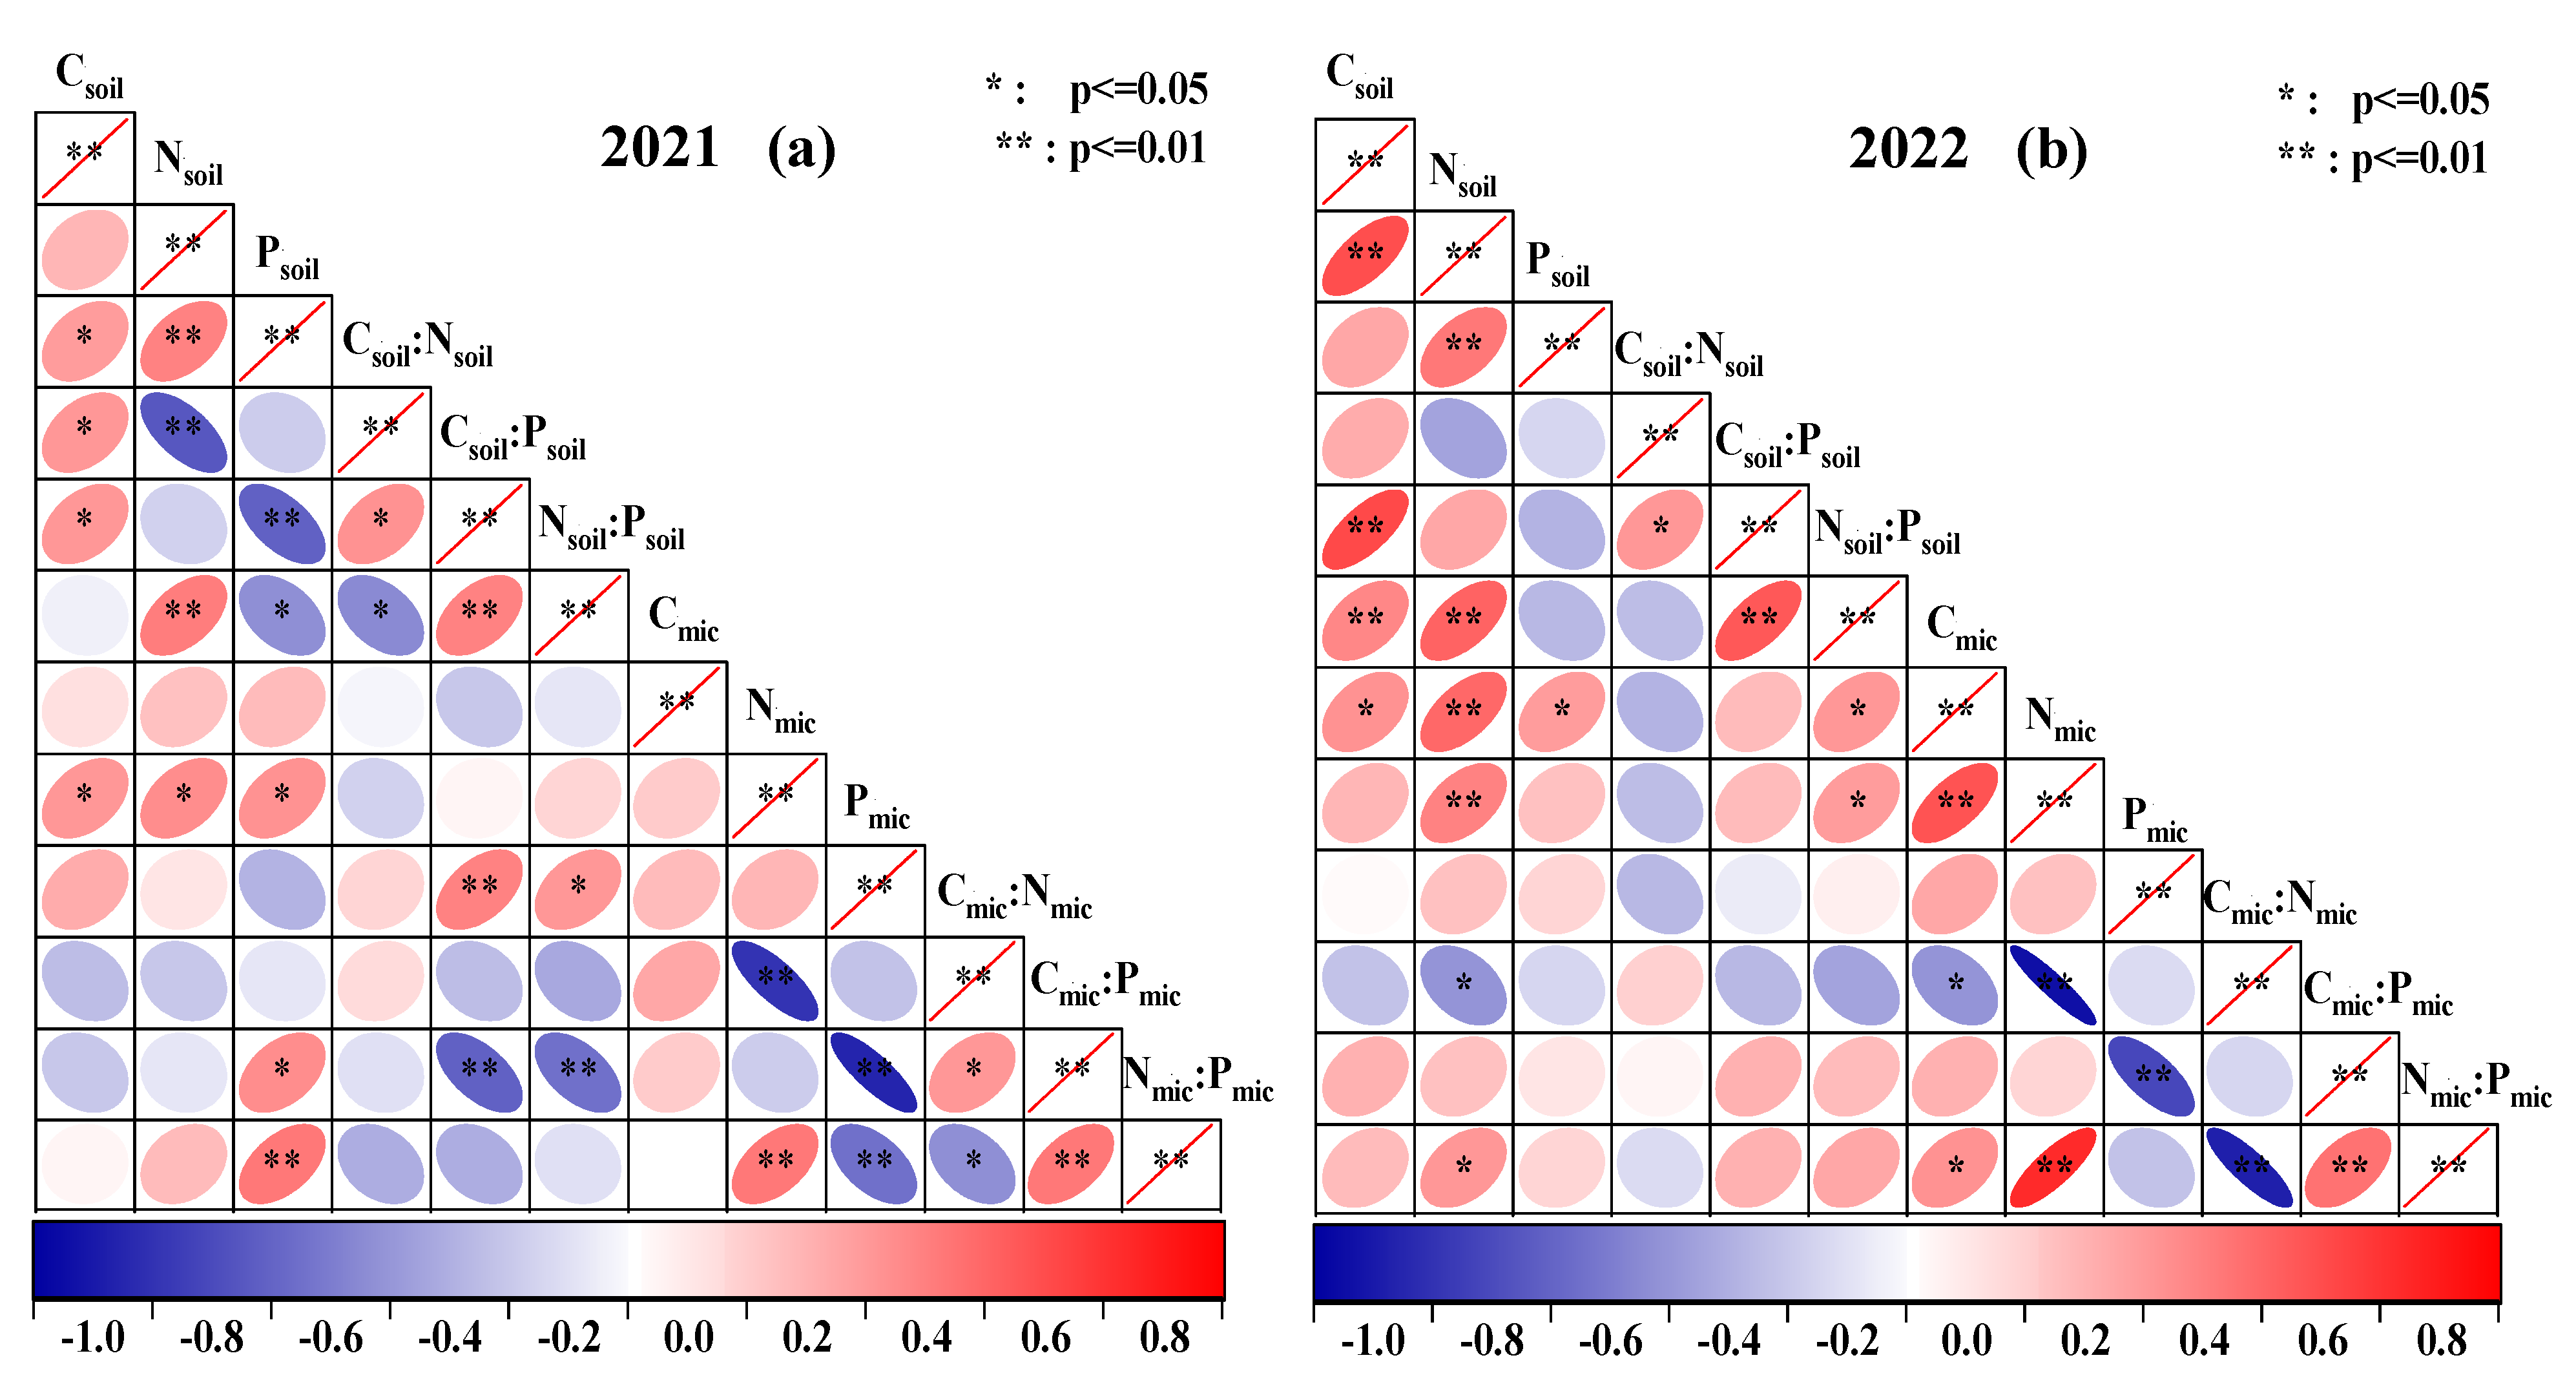
2.3. Correlation between Soil Nutrient–Microbial Biomass and the Ecological Stoichiometry Ratio

The results of Pearson’s correlation analysis showed some differences in the correlation between soil nutrient–microbial biomass and their ecological stoichiometry ratios in 2021 (Figure 3a) and 2022 (Figure 3b). The correlation between Csoil and Csoil:Psoil was positive and significant (p < 0.05), the correlation between Nsoil and Psoil, Nsoil:Psoil and Csoil:Psoil was positive and highly significant (p < 0.01), the correlation between Csoil:Nsoil and Csoil:Psoil was positive and significant (p < 0.05), and the correlation between Nmic:Pmic and Nmic, Cmic:Pmic was positive and highly significant (p < 0.01). The correlation between Cmic:Nmic and Nmic was negative and highly significant (p < 0.01), and the correlation between Cmic:Nmic and Cmic:Pmic was negative and highly significant (p < 0.01).
To further examine the correlation between soil nutrients and microbial biomass, a linear fit was performed on the mean values of the data collected for two years (Figure 4), and the results showed that Csoil was significantly and positively correlated with Cmic, Nmic, and Pmic (Figure 4a–c). Nsoil was significantly and positively correlated with Cmic and Nmic (Figure 4d,e), but the correlation with Pmic content was not significant (Figure 4f). None of the correlations between Psoil and Cmic, Nmic, and Pmic were significant (Figure 4g–i).

2.4. Effect of Water and Nitrogen Regulation on the Yield of Wolfberry

The effect of water and nitrogen regulation on the yield of wolfberry was significant (Figure 5). The highest yield in 2021 and 2022 and the mean values for the two years were recorded under the I2N2 treatment, with an increase in the yield by 6.68%, 9.08%, and 7.90% compared to that under the CK treatment and 20.23%, 28.75%, and 24.48% compared to that under the lowest yielding treatment (I1N1). The yield of wolfberry increased with the increase in nitrogen application under I1 irrigation, and the yield of wolfberry first increased and then slightly decreased with the increase in nitrogen application under I2 and I3 irrigation. These results indicated that excessive nitrogen application does not increase the yield of wolfberry.

2.5. Integrated Evaluation of Soil Nutrient–Microbial Biomass and the Effect on the Stoichiometric Characteristics

2.5.1. Evaluation of Soil Nutrient–Microbial Biomass and the Stoichiometric Characteristics Based on PCA

The effects of water and nitrogen regulation on the stoichiometric characteristics of soil–microbial biomass were analyzed by PCA, and the principal components were extracted based on the principle of explained variance > 1 and cumulative contribution ≥ 85% (Figure 6a,b, and Table 1). The contribution of the first principal component was 42.6% and 58.6%, the contribution of the second principal component was 30.5% and 18.7%, and the contribution of the third principal component was 14.2% and 13.8% in 2021 and 2022, respectively. The cumulative contribution of the first three principal components was 87.3% and 91.1%, which reflected all the indicators, suggesting the feasibility of the PCA.
The composite scores of the three principal components extracted under different water and nitrogen regulation treatments were calculated (Table 2). A higher score indicated a better combination of soil nutrient-microbial biomass and its stoichiometric characteristics under that treatment. The combined effect of each treatment in 2021 was I2N3 > I3N3 > I2N2 > I1N3 > CK > I3N2 > I1N2 > I3N1 > I2N1 > I1N1. In 2022, it was I3N2 > I3N3 > I2N3 > I2N2 > I1N3 > CK > I1N2 > I3N1 > I2N1 > I1N1. The combined soil nutrient-microbial biomass and its stoichiometric characteristics were better under I2, I3, N2, and N3-coupled treatments. The combined scores of I1, I2, I3, and N1 coupled treatments were negative, and the soil quality was poor. These findings indicated that the effect of N application on the soil nutrient-microbial biomass and the stoichiometric characteristics of wolfberry cultivation sites was significant.

2.5.2. Evaluation of Soil Nutrient–Microbial Biomass and the Stoichiometric Characteristics Based on the TOPSIS Method

To ensure that the evaluated results were accurate, the TOPSIS model was applied to further examine the soil–microbial biomass and stoichiometric characteristics (Table 3). A higher fit Ci value with the optimal treatment indicated a better overall quality of the treatment. The results of the analysis were consistent with those of PCA, indicating that both evaluation methods were reliable, and the interannual differences might be attributed to frequent human disturbances and climatic and environmental conditions.

2.6. Effect of Soil Quality on the Yield of Wolfberry

To determine the influence of soil quality on the yield of wolfberry in the root area, linear regression analysis was conducted, and the relationship between soil quality and wolfberry yield was comprehensively evaluated (Figure 7a,b). The coefficients of determination (R2) of the integrated evaluation results of soil quality and yield fitting curves were 0.472 and 0.295 in 2021 and 0.573 and 0.412 in 2022, respectively, and the parameters were positively correlated. The results suggested a positive effect of soil nutrient total–microbial biomass and its stoichiometric ratio on the yield of wolfberry.

3. Discussion

3.1. The Response of Csoil, Nsoil, and Psoil Contents and Their Stoichiometric Imbalance to the Water and Nitrogen Coupling Regulation

By conducting a water and nitrogen control experiment for two years, we found that the content of Csoil, Nsoil, and Psoil in the root area of wolfberry increased with the increase in nitrogen application under certain irrigation conditions. Similar results of this finding have been obtained in studies related to agricultural, grassland, and wetland ecosystems [23,24,25]. Such patterns occurred because under suitable water conditions, the input of exogenous N fertilizer can directly enhance the effective soil N nutrients, and also because suitable water and N conditions promote the conversion and uptake of inorganic salts, which can indirectly increase the soil carbon and N stocks [24]. Phosphorus fertilizer was used in the experiment under the same exogenous input conditions, mainly due to differences in the endogenous release of soil phosphorus pools under different irrigation gradients [26]. Additionally, the use of exogenous N fertilizer improved the physicochemical properties of the soil to a certain extent, stimulating the decomposition of root zone litter, soil humus, and microbial residues, which increased the effect of returning these materials to the field besides meeting the nutrients required for crop growth, resulting in a gradual increase in the Csoil, Nsoil, and Psoil content in the root zone of wolfberry [27].
We also found that Nsoil:Psoil gradually increased with the increase in N application, but the changes in Csoil:Nsoil and Csoil:Psoil were not significant. Thus, we concluded that N addition could significantly increase soil Nsoil:Psoil, but Csoil:Nsoil was generally relatively stable and not significantly affected by the addition of exogenous nutrients [28]. The Csoil:Nsoil:Psoil ecological stoichiometry characteristics are mainly influenced by soil nutrient content, but some studies have reported an extremely strong positive correlation between soil TN and SOC and found the effects of water and nitrogen regulation on the contents of soil SOC and TN to be almost identical [25]. The N application conditions provided a large source of inorganic N to the soil, and suitable moisture conditions stimulated the decomposition of litter and microbial residues to replenish the carbon pool and increase the release of carbon sources [29]. Soil phosphorus was easily adsorbed with soil by the adsorption of soil iron and aluminum oxides, and it was not easily absorbed by crops, while the accumulation and consumption of TN and SOC, which are the main structural components of soil, were relatively fixed, leading to more stable Csoil:Nsoil and Csoil:Psoil [30]. Exogenous phosphorus was quantitatively supplemented and limited the release of endogenous phosphorus caused by irrigation which might be the main reason for the gradual increase in Nsoil:Psoil with the increase in the application of N.

3.2. The Response of Cmic, Nmic, Pmic, and Their Stoichiometric Imbalance to the Water and Nitrogen Coupling Regulation

The dynamics of soil microbial biomass can reflect microbial populations, abundance, and activity, and its magnitude is closely related to the physicochemical properties of the soil [31]. Both experiments showed that the soil Cmic, Nmic, and Pmic contents in the root zone of wolfberry increased with the increase in irrigation water and then leveled off or even decreased. These findings indicated that the soil microbial biomass under irrigated conditions was lower than that in rain-fed farmlands, and a slight increase in precipitation significantly contributed to the increase in soil microbial biomass in scrubland and grassland, while a significant decrease in precipitation resulted in a significant decrease in soil microbial biomass [32]. This occurred because suitable moisture conditions provided water necessary for biological activities and also maintained the permeability of the soil to some extent, providing suitable conditions for the survival of soil microorganisms. Also, better moisture conditions increased the transformation of nutrient transport between plants and soil and accelerated the rate of mineralization of soil organic matter [33]. Irrigation conditions might cause nutrient loss to some extent, and the increase in the frequency of soil flooding might lead the soil interstices to be filled with water, resulting in poor aeration and the inhibition of soil microbial activity [34]. Some studies have shown that N application can significantly increase Cmic, Nmic, and Pmic in woodland soils, mainly because the input of exogenous N increases the effective and total N content in the soil and promotes the decomposition, conversion, and utilization of soil organic matter by microorganisms [35]. Also, N addition decreases microbial dependence on N, which in turn exacerbates plant inter-root phosphorus and carbon limitation and induces microorganisms to secrete large quantities of carbon and phosphorus hydrolases to meet the nutrient uptake [36]. We also found that soil Cmic, Nmic, and Pmic in the root zone of wolfberry gradually increased with the increase in N application at the same irrigation level.
The Cmic:Nmic:Pmic ratio is an important indicator of nutrient limitation in the soil [37]. The global mean values of Cmic:Nmic, Cmic:Pmic, and Nmic:Pmic for soils were found to be 42, 6, and 1, respectively [36]. The soil Cmic:Nmic, Cmic:Pmic, and Nmic:Pmic in the root zone of wolfberry were around 11.10–24.04, 11.12–18.42, and 0.70–1.29, respectively, with short-term water and nitrogen regulation. The ratio of Nmic:Pmic was lower than the global average ratio, indicating that the Nmic and Pmic contents of agricultural soils in our study area were relatively balanced, probably because of exogenous nitrogen supplementation [38]. By comparing the different water and nitrogen treatments, we found that the I1N1 treatment was significantly higher, indicating that some nitrogen limitation occurred under this treatment. The Cmic:Pmic ratio for all treatments and Nmic:Pmic ratio for some treatments were higher than the global soil, and no significant change in Cmic:Pmic between treatments was detected, while Nmic:Pmic showed an overall increasing trend with the increase in irrigation water, which indicated that increasing the quantity of irrigation water can improve the efficiency of the use of soil P to some extent [39]. The measures of soil microbial C, N, and P elements were mainly influenced by the soil organic matter content, and a higher abundance of effective N and fast-acting phosphorus in the soil indicated a lower microbial C, N, and P elemental ratio [37]. Humans play a key role in fertilizing and irrigating agricultural ecosystems, which in turn increase the microbial load and the activity of microorganisms and accelerate the rate of humus mineralization, leading to changes in the ecological stoichiometry of soil microorganisms.

3.3. The Response Mechanism of Wolfberry Yield to Soil Quality under Water and Nitrogen Coupling Regulation

Irrigation and the application of nitrogen fertilizer can supplement the water and nutrient elements required for crop growth and development, acting directly on the plant to promote crop growth and development and enhance crop yield [40]. They can also influence the soil environment, affecting nutrient cycling and elemental transport within the soil by regulating the soil carbon pool, which in turn can affect the release of elements in the soil and the characteristics of elemental balance, thus, indirectly affecting crop growth, development, and yield by changing the soil environment [41]. The irrigation and fertilizer application levels significantly affected crop growth, and the interactive effect of water and nutrients on crop growth and yield was significant [42]. The coefficient of determination (R2) of soil quality based on the total soil nutrient-microbial biomass and its chemometric ratio indicated positive effects on the yield of wolfberry under short-term water and nitrogen regulation in the range of 0.295–0.573. Nutrients are essential for crop growth and development; during crop growth, soil nutrients are consumed in large quantities. The application of nitrogen fertilizer additions makes up for the lack of satisfy the deficit in soil water and nutrients and helps in meeting the demands of the crops for soil water and nutrients, thus increasing crop yield [43]. When the amount of nitrogen applied exceeds the amount absorbed by the crop, the excess nitrogen is stored in the soil and increases soil fertility through accumulation. When crops have certain nutrient requirements or if the soil environment changes, the nitrogen and other nutrients in the soil are converted into inorganic salts that are easily absorbed and utilized by crops through microbial activation and mineralization, which improves crop yield [44].
Soil nutrients in this study only involved total soil–microbial biomass and the characteristics of its chemometric ratio. The positive effect of soil quality based on soil nutrient total–microbial biomass and its chemometric ratio on the yield of wolfberry was limited. It indicated that there are limitations in the soil nutrient evaluation system based on total soil nutrients and microbial biomass to reveal the effects of soil quality on crops. Soil fast-acting nutrients, enzyme activities, microbial diversity, and other sensitive indicators are more obviously affected by the external environment. Therefore, it is necessary to reveal the characteristics of soil fast-acting nutrients, enzyme activities, and microorganisms and their effects on crop physiology, growth, yield, and quality under water and nitrogen regulation in subsequent studies. At the same time, this study regarded the major area of root distribution of drip–irrigated wolfberry (0–40 cm) as a whole and did not reveal in detail characteristics of the soil elemental balance at different depths under water and nitrogen regulation and its relationship with crop yield in stratified layers, so further research is needed. Lastly, it will be significant for the sustainable development of agriculture if large-scale instrumentation can be utilized to achieve continuous monitoring of various indicators of soil nutrients, on the basis of which an intelligent decision-making management system can be established by using artificial intelligence technology.

4. Materials and Methods

4.1. Study Area

The study was conducted in Ningxia Concentric County, China (105°42′23.05″ E, 37°10′36.98″ N, and 1228 m, Figure 8). The area has a temperate continental semi-arid climate, with an average rainfall of 270 mm; approximately 70% of the annual rainfall occurs between July and September. The long-term average annual evaporation is about 2387 mm, which is higher than the average annual precipitation. The average annual temperature is around 8.6 °C, and the difference between the day and night temperatures is large. The average duration of sunshine is 3024 h, and the frost-free period is around 154 d. Soil properties in the test area were light loams in the range of 0–40 cm, with soil porosity of 46%, field water holding capacity of 13.4% to 15.1%, and other physicochemical properties are shown in Table 4. The groundwater of this region is between 20 and 25 m deep, and precipitation is minimal and concentrated. Thus, the reliable source of water for irrigation is the Yellow River. The precipitation and average daily temperature recorded throughout the fertility period in the two years of the study are shown in Figure 9. The varieties of wolfberry used in this study were 8a and 9a Ningqi No. 7. The plants were grown 0.75 m apart, and a line distance of 3 m was maintained. The trunk diameter of wolfberry trees is 30–45 mm, and they grow 80–110 cm in length at the start of their reproductive period. Wolfberry has a four-stage critical reproductive period, including the spring tip period (stage 1: late April to mid-May), the flowering period (stage 2: late May to mid-June), the fruit ripening period (stage 3: late June to mid-August), and the defoliation period (stage 4: late August to early September).

4.2. Experimental Design

The experiment was conducted from April to October 2021 and 2022. Two factors, i.e., the irrigation quota and nitrogen application, were manipulated in the experiment. Three irrigation levels, including low water I1 (2160 m3 ha−1), medium water I2 (2565 m3 ha−1), and high water I3 (2970 m3 ha−1) levels, and three N application rates, including low N1 (165 kg ha−1), medium N2 (225 kg ha−1), and high N3 (285 kg ha−1) rates, were used in the experiment following the drip irrigation planting technical protocols [45]. The information on the experimental design is presented in Table 5. The local conventional management standard was used as the control (CK) with 2970 m3 ha−1 irrigation quota, 330 kg ha−1 N, 90 kg ha−1 P, and 150 kg ha−1 K. Each plot had 10 trees with more than 3 m of separation between plots of wolfberry trees to prevent mutual influence. The experiment included nine treatments and one control treatment, with three replications for each treatment and 30 test plots in total. A 6 m buffer zone surrounding each test plot was maintained, and the total study area was 675 m2. Urea (46% N), calcium superphosphate (12% P2O5), and potassium sulfate (50% K2O) were used as test fertilizers. Above–ground, off–frame drip irrigation was performed, and the drip pipe was laid parallel to the rows. Water and nitrogen were provided simultaneously as follows: 20% and 15% (once) during the spring tip period, 30% and 25% (twice) during the flowering period, 40% and 50% (four times) during the fruit ripening period, and 10% (once) during both defoliation periods. All field management practices and levels, except for irrigation and fertilization, were identical to those of the surrounding area.

4.3. Soil Sample Collection

The soil samples were collected in the middle and late reproductive stages using a soil auger at approximately 10 cm of the roots from the side of the installed drip head of the wolfberry tree. The sampling depth was 0–40 cm, and soil samples were collected from three points in each plot and mixed thoroughly to obtain a fresh soil sample (about 1 kg). After removing gravel and animal and plant residues, the soil samples were divided into two parts using the quadrat method. One part was sealed in a sterile plastic bag, which was placed in a refrigerated box and transported back to the laboratory at the earliest for evaluating microbial biomass. The other part was dried under ambient conditions away from light; then, sand grains >2 mm were removed and sieved through 2 mm and 0.149 mm soil samples, respectively, to determine the physicochemical properties of the soil.

4.4. Measurement Indices and Methods

4.4.1. Soil Index Measurements and Methods

Soil organic carbon (Csoil) content was determined by the oxidation of potassium dichromate using an external heating method. The content of total nitrogen (Nsoil) was determined by the semi-micro Kjeldahl method—flow injector method. The content of total phosphorus (Psoil) was determined by NaOH melting, molybdenum antimony anti-color development, and the UV spectrophotometric method.
Soil microbial biomass carbon (Cmic), nitrogen (Nmic), and phosphorus (Pmic) indicators were determined by the chloroform fumigation leaching method [46]. Each sample of soil (fresh weight: 10 g) was fumigated with chloroform for 24 h at 25 °C in a dark box, and another sample of fresh soil (10 g) without chloroform fumigation was taken from each sample as a control. Cmic and Nmic were extracted with an aqueous solution of 0.5 mol/L K2SO4, Pmic was extracted with a solution of 0.5 mol/L NaHCO3, and the unfumigated control soil was extracted with 100 mL of 0.5 mol/L NaHCO3. The concentrations of carbon and nitrogen were measured using an organic carbon analyzer (TOC-VCPH, Shimadzu, Japan) and a continuous flow analyzer (AA3, SEAL Analytical, Germany), respectively. The phosphorus concentration was measured colorimetrically (the molybdenum blue colorimetric method) using a Shimadzu UV spectrophotometer (UV-2450, Shimadzu, Japan). Cmic, Nmic, and Pmic were derived using uniform conversion coefficients of 0.45, 0.54, and 0.40, respectively [47].

4.4.2. Methods for Measuring the Yield of Wolfberry

Wolfberry yield was determined using the weighing method. During the fruit ripening period, all plots of ripe fruit were collected in batches. The fresh fruit yield of wolfberries was determined using an electronic scale (AX5202ZH, 0.01 g, Ohaus, Parsippany, NJ, USA).

4.5. Data Processing and Analysis

The data were organized and modeled using Microsoft Excel 2021. Analysis of variance, correlation analysis, and principal component analysis was performed using the SPSS 22.0 software. Significance tests were performed using the LSD method (p < 0.05). The Origin 21.0 software was used for correlation charting.

4.5.1. Principal Component Analysis

Principal component analysis (PCA) is a method of dimensionality reduction analysis where variables are selected based on the amount of variance explained by each indicator and the cumulative contribution until the selected variables represent the information of the original indicator. Then, the combined score of each principal component is calculated [48].
(1)
The formula for calculating each principal component score is as follows:
{ F 1 = Z 11 X 1 + Z 12 X 2 + + Z 1 j X j F 2 = Z 21 X 1 + Z 22 X 2 + + Z 2 j X j F n = Z n 1 X 1 + Z n 2 X 2 + + Z n j X j
(2)
The data for the calculation of the combined score are as follows:
F = ( b 1 F 1 + b 2 F 2 + + b n F n ) / 100
Here, F is the composite score; b1, b2, , and bn are the variance contribution rates; F1, F2, , Fn are the scores of each principal component.

4.5.2. TOPSIS Method

(1)
A matrix was constructed based on the original evaluation parameters [49]. Assuming there were m evaluation objects and n evaluation indicators, the original data was expressed as the matrix Χ = ( Χ i j ) m × n; where, X i j represents the original data of the jth indicator of the ith treatment. The metrics were normalized as follows:
Z i j = X i j j = 1 n Χ i j 2
Here, i = (1, 2, …, m) and j = (1, 2, …, n).
(2)
The normalization matrix can be expressed as Ζ = ( Z i j ) m × n. The optimal and inferior vectors composed of the maximum and minimum values of each column were determined using Equations (4) and (5), respectively.
Z + = ( Z m a x 1 ,   Z m a x 2 ,   ,   Z m a x n )  
      Z = ( Z m i n 1 ,   Z m i n 2 ,   ,   Z m i n n )  
(3)
The Euclidean distances (Di+ and Di) were determined using Equations (6) and (7).
      D i + = j = 1 n ( Ζ max   j   Ζ ij ) 2
  D i - = j = 1 n ( Ζ max   j   Ζ ij ) 2
(4)
The fit of the ith treatment to the optimal solution C i was determined using the equation.
C i = D i ( D i + + D i )

5. Conclusions

Short-term water and nitrogen coupling had some regulatory effects on soil nutrient–microbial biomass in the root zone of wolfberry, but soil nutrient and microbial biomass ratios did not change significantly, i.e., soil nutrient balances were not significantly disturbed by the short-term water and N regulation. The absence of anthropogenic nutrient supply in agricultural ecosystems is likely to lead to soil elemental imbalances, and appropriate water and fertilizer application can significantly enhance soil quality based on nutrient–microbial biomass and its stoichiometric characteristics. Suitable water and nitrogen conditions significantly enhanced the yield of wolfberry; the I2N2 treatment of two years of yield compared with CK increased by 6.68%, 9.08%, which was used as a reference for water and nitrogen management of wolfberry under drip irrigation conditions. A small positive effect of total soil nutrient-microbial biomass and the stoichiometric ratios was recorded on the yield of wolfberry. Our findings provided support for the internal stability of the soil in agricultural ecosystems and the green–efficient-sustainable development of agriculture.

Author Contributions

Conceptualization, J.Y.; Experiments, Z.M., Y.Y. and F.S.; Data acquisition, Data analysis and processing, Chart production, Z.M., Y.Y., F.S. and Z.Y.; Writing—original draft and revision, Z.M.; Review—editing, B.D.; funding acquisition, J.Y. All authors have read and agreed to the published version of the manuscript.

Funding

This research was supported by the Ningxia Natural Science Foundation General (2022AAC03032) and Key Programs (2023AAC02022) and Ningxia First-class Discipline Construction Funding Project for Higher Education Institutions (Grant No. NXYLXK2021A03) and Innovation and Entrepreneurship Training Program for University Students of Ningxia University (202310749201).

Data Availability Statement

The data is contained within the article.

Conflicts of Interest

The authors declare no conflict of interest.

References

  1. Elser, J. Biological stoichiometry: A chemical brudge between ecology and evolutionary biology. Am. Nat. 2006, 168, 25–35. [Google Scholar] [CrossRef] [PubMed]
  2. Elser, J.J.; Sterner, R.W.; Gorokhova, E.; Gorokhova, E.; Fagan, W.F.; Markow, T.A. Biological stoichiometry from genes to ecosystems. Ecol. Lett. 2000, 3, 540–550. [Google Scholar] [CrossRef] [Green Version]
  3. Shi, L.J.; Li, Q.K.; Fu, X.L.; Kou, L.; Dai, X.Q.; Wang, H.M. Foliar, root and rhizospheric soil C:N:P stoichiometries of overstory and understory species in subtropical plantations. Catena 2021, 198, 105020. [Google Scholar] [CrossRef]
  4. Bai, X.J.; Wang, B.R.; An, S.S.; Zeng, Q.C.; Zhang, H.X. Response of forest species to C:N:P in the plant-litter-soil system and stoichiometric homeostasis of plant tissues during afforestation on the Loess Plateau, China. Catena 2019, 183, 104186. [Google Scholar] [CrossRef]
  5. Carrillo, Y.; Bell, C.; Koyama, A.; Canarini, A.; Boot, C.M.; Wallenstein, M. Plant traits, stoichiometry and microbes as drivers of decomposition in the rhizosphere in a temperate grassland. J. Ecol. 2017, 105, 1750–1765. [Google Scholar] [CrossRef] [Green Version]
  6. Qi, L.; Zhou, P.; Yang, L.H.; Gao, M. Effects of land reclamation on the physical, chemical, and microbial quantity and enzyme activity properties of degraded agricultural soils. J. Soils Sediments 2020, 20, 973–981. [Google Scholar] [CrossRef]
  7. Kwabiah, A.B.; Palm, C.A.; Stoskopf, N.C.; Voroney, R.P. Response of soil microbial biomass dynamics to quality of plant materials with emphasis on P availability. Soil Biol. Biochem. 2003, 35, 207–216. [Google Scholar] [CrossRef]
  8. Zhou, X.; Sun, H.; Pumpanen, J.; Sietio, O.M.; Heinonsalo, J.; Koster, K. The impact of wildfire on microbial C:N:P stoichiometry and the fungal-to-bacterial ratio in permafrost soil. Biogeochemistry 2019, 142, 1–17. [Google Scholar] [CrossRef] [Green Version]
  9. Zeng, Q.C.; Liu, Y.; Fang, Y.; Ma, R.T.; Lal, R.T.; An, S.S. Impact of vegetation restoration on plants and soil C:N:P stoichiometry on the Yun wu Mountain Reserve of China. Ecol. Eng. 2017, 109, 92–100. [Google Scholar] [CrossRef]
  10. Cui, H.; Ou, Y.; Lv, D.; Wang, L.X.; Liang, A.Z.; Yan, B.X. Aggregate-related microbial communities and nutrient stoichiometry under different croplands. Ecol. Process. 2020, 9, 1435–1443. [Google Scholar] [CrossRef]
  11. Xue, Q.; Newman, R.K.; Newman, C.W. Effects of heat treatment of barley starches on in vitro digestibility and glucose responses in rats. Cereal Chem. 1996, 73, 588–592. [Google Scholar]
  12. Yang, D.X.; Song, L.; Jin, G.Z. The soil C:N:P stoichiometry is more sensitive than the leaf C:N:P stoichiometry to nitrogen addition: A four-year nitrogen addition experiment in a Pinus koraiensis plantation. Plant Soil 2019, 442, 183–198. [Google Scholar] [CrossRef]
  13. Roldan, A.; Caravaca, F.; Hernandez, M.T.; Garcia, C.; Sanchez-Brito, C.; Velasquez, M. No-tillage, crop residue additions, and legume cover cropping effects on soil quality characteristics under maize in Patzcuaro watershed (Mexico). Soil Tillage Res. 2003, 72, 65–73. [Google Scholar] [CrossRef]
  14. Luo, Y.; Gong, Y.; Li, Y.M. Stoichiometry Characteristics of root, Stem and Leaf of Maize in Different Growth Stages in the Upper Reaches of the Tarim River. Res. Soil Water Conserv. 2018, 2502, 112–119. [Google Scholar]
  15. Duan, W.W.; Zhang, Z.J.; Zhu, J.J.; Zhang, D.; Qian, D.; Teng, F. Comparative Analysis of the Phenolic Profile of Lycium barbarum L. Fruits from Different Regions in China. Molecules 2022, 27, 5842. [Google Scholar] [CrossRef] [PubMed]
  16. Wang, C.C.; Chang, S.C.; Inbaraj, B.S.; Chen, B.H. Isolation of carotenoids, flavonoids and polysaccharides from Lycium barbarum L. and evaluation of antioxidant activity. Food Chem. 2010, 120, 184–192. [Google Scholar] [CrossRef]
  17. Mao, F.; Xiao, B.; Jiang, Z.; Zhao, J.; Huang, X.; Guo, J. Anticancer effect of Lycium barbarum polysaccharides on coloncancer cells involves G0/G1 phase arrest. Med. Oncol. 2011, 28, 121–126. [Google Scholar] [CrossRef]
  18. Deng, Z.; Yin, J.; Wu, J.B.; Zhang, H.J. Comprehensive evaluation of water and fertilizer application for Lycium barbarum L. based on AHP and entropy weight method. J. Drain. Irrig. Mach. Eng. 2021, 39, 712–719. [Google Scholar]
  19. Huang, L.; Yang, W.P.; Hu, X.Q.; Tao, Y.; Yao, S.M.; Ou, X.Q. Effects of Irrigation and Nitrogen Interaction on Water Consumption Characteristics and Nitrogen Utilization of Winter Wheat. J. Soil Water Conserv. 2016, 30, 168–174. [Google Scholar]
  20. Ma, Z.H.; Yin, J.; Yang, Y.P.; Sun, F.B.; Yang, Z. Effect of water and nitrogen coupling regulation on the growth, physiology, yield, and quality attributes and comprehensive evaluation of wolfberry (Lycium barbarum L.). Front. Plant Sci. 2023, 14, 1130109. [Google Scholar] [CrossRef]
  21. Dai, Z.G.; Fei, L.J.; Huang, D.L.; Zeng, J.; Chen, L.; Cai, Y.H. Coupling effects of irrigation and nitrogen levels on yield, water and nitrogen use efficiency of surge-root irrigated jujube in a semiarid region. Agric. Water Manag. 2019, 213, 146–154. [Google Scholar] [CrossRef]
  22. Mahmoodi-Eshkaftaki, M.; Rafiee, M.R. Optimization of irrigation management: A multi-objective approach based on crop yield, growth, evapotranspiration, water use efficiency and soil salinity. J. Clean. Prod. 2020, 252, 119901. [Google Scholar] [CrossRef]
  23. Liu, S.X.; AN, H.; Zhang, X.W.; Xing, B.B.; Wen, Z.L.; Wang, B. Effects of Nitrogen and Phosphorus Addition on Soil Nutrient Content and Stoi-chiometry in Desert Grassland. Environ. Sci. 2023, 44, 2724–2734. [Google Scholar]
  24. Spieles, D.J.; Mitsch, W.J. Macroinvertebrate community structure in high-and low-nutrient constructed wetlands. Wetlands 2000, 20, 716–729. [Google Scholar] [CrossRef]
  25. Schleuss, P.M.; Widdig, M.; Heintz-Buschart, A.; Guhr, A.; Martin, S.; Kirkman, K. Stoichiometric controls of soil carbon and nitrogen cycling after long-term nitrogen and phosphorus addition in a mesic grassland in South Africa. Soil Biol. Biochem. 2019, 135, 294–303. [Google Scholar] [CrossRef]
  26. Zhan, S.X.; Wang, Y.; Zhu, Z.C.; Li, W.H.; Bai, Y.F. Nitrogen enrichment alters plant N:P stoichiometry and intensifies phosphorus limitation in a steppe ecosystem. Environ. Exp. Bot. 2017, 134, 21–32. [Google Scholar] [CrossRef]
  27. Wang, F.; Li, Q.H.; Lin, C.; Zhong, S.J.; He, C.M.; Liu, Y.J. Effect of different fertilization modes on topsoil organic carbon sequestration and productivity in yellow paddy field of southern China. Plant Nutr. Fert. Sci. 2015, 21, 1447–1454. [Google Scholar]
  28. Bai, Y.F.; Wu, J.G.; Clark, C.M.; Naeem, S.; Pan, Q.M.; Huang, J.H. Tradeoffs and thresholds in the effects of nitrogen addition on biodiversity and ecosystem functioning: Evidence from inner Mongolia Grasslands. Glob. Chang. Biol. 2010, 16, 358–372. [Google Scholar] [CrossRef]
  29. Gao, Y.; He, N.P.; Yu, G.R.; Chen, W.L.; Wang, Q.F. Long-term effects of different land use types on C, N and P stoichiometry and storage in subtropical ecosystems: A case study in China. Ecol. Eng. 2014, 67, 171–181. [Google Scholar] [CrossRef]
  30. Jiang, Y.F.; Guo, X. Stoichiometric patterns of soil carbon, nitrogen, and phosphorus in farmland of the Poyang Lake region in Southern China. J. Soils Sediments 2019, 19, 3476–3488. [Google Scholar] [CrossRef]
  31. Truu, M.; Truu, J.; Heinsoo, K. Changes in soil microbial community under willow coppice: The effect of irrigation with secondary-treated municipal wastewater. Ecol. Eng. 2009, 35, 1011–1020. [Google Scholar] [CrossRef]
  32. Ren, C.J.; Zhao, F.Z.; Shi, Z.; Chen, J.; Han, X.H.; Yang, G.H. Differential responses of soil microbial biomass and carbon-degrading enzyme activities to altered precipitation. Soil Biol. Biochem. 2017, 115, 1–10. [Google Scholar] [CrossRef]
  33. Denef, K.; Six, J.; Paustian, K.; Merckx, R. Importance of macroaggregate dynamics in controlling soil carbon stabilization: Short-term effects of physical disturbance induced by dry-wet cycles. Soil Biol. Biochem. 2001, 33, 2145–2153. [Google Scholar] [CrossRef]
  34. Drenovsky, R.E.; Vo, D.; Graham, K.J.; Scow, K.M. Soil water content and organic carbon availability are major determinants of soil microbial community composition. Microb. Ecol. 2004, 48, 424–430. [Google Scholar] [CrossRef]
  35. Wang, L.J.; Chen, R.M.; Xiao, W.F.; Sun, P.F.; Shen, Y.F.; Zeng, L.X. Effects of nitrogen addition on soil microbial biomass and enzyme activities of Pinus massoniana-Quercus variabilis mixed plantations in the Three Gorges Reservoir Area. J. Appl. Sci. 2020, 33, 42–50. [Google Scholar]
  36. Zhu, X.M.; Liu, M.; Yin, H.J. Differential effects of N addition on the stoichiometry of microbes and extracellular enzymes in the rhizosphere and bulk soils of an alpine shrubland. Plant Soil 2020, 449, 285–301. [Google Scholar] [CrossRef]
  37. Cleveland, C.C.; Liptzin, D. C:N:P stoichiometry in soil: Is there a “Redfield ratio” for the microbial biomass? Biogeochemistry 2007, 85, 235–252. [Google Scholar] [CrossRef]
  38. Zhou, J.C.; Liu, X.F.; Zheng, Y.; Ji, Y.H.; Li, X.F.; Xu, P.C. Effects of nitrogen deposition on soil microbial biomass and enzyme activities in Castanopsis carlesii natural forests in subtropical regions. Acta Ecol. Sin. 2017, 37, 127–135. [Google Scholar]
  39. Xu, X.F.; Thornton, P.E.; Post, W.M. A global analysis of soil microbial biomass carbon, nitrogen and phosphorus in terrestrial ecosystems. Glob. Ecol. Biogeogr. 2013, 22, 737–749. [Google Scholar] [CrossRef]
  40. Sandhu, O.S.; Gupta, R.K.; Thind, H.S.; Jat, M.L.; Sidhu, H.S.; Yadvinder-Singh. Drip irrigation and nitrogen management for improving crop yields, nitrogen use efficiency and water productivity of maize-wheat system on permanent beds in north-west India. Agric. Water Manag. 2019, 219, 19–26. [Google Scholar] [CrossRef]
  41. Qian, Y.; Follett, R.F.; Kimble, J.M. Soil Organic Carbon Input from Urban Turfgrasses. Soil Sci. Soc. Am. J. 2010, 74, 366–371. [Google Scholar] [CrossRef]
  42. Gehl, R.J.; Schmidt, J.P.; Maddux, L.D.; Gordon, W.B. Corn yield response to nitrogen rate and timing in sandy irrigated soils. Agron. J. 2005, 97, 1230–1238. [Google Scholar] [CrossRef] [Green Version]
  43. Lu, J.Y.; Yang, M.; Liu, M.; Lu, Y.; Yang, H. Nitrogen and phosphorus fertilizations alter nitrogen, phosphorus and potassium resorption of alfalfa in the Loess Plateau of China. J. Plant Nutr. 2019, 42, 2234–2246. [Google Scholar] [CrossRef]
  44. Liu, Q.; Xu, H.W.; Yi, H.J. Impact of fertilizer on crop yield and C:N:P stoichiometry in arid and semi-arid soil. Int. J. Environ. Res. Public Health 2021, 18, 4341. [Google Scholar] [CrossRef] [PubMed]
  45. Ningxia Water Resources Department and Ningxia Institute of Water Resources Science. Ningxia Drip Irrigation Engineering Planning and Design Guidelines and Technical Regulations for Drip Irrigation Planting of Advantageous Specialty Crops; Ningxia People’s Publishing House: Yinchuan, China, 2017; Available online: https://item.kongfz.com/book/41091018.html (accessed on 26 June 2023).
  46. Vance, E.D.; Brookes, P.C.; Jenkinson, D.S. An extraction method for measuring soil microbial biomass C. Soil Biol. Biochem. 1987, 19, 703–707. [Google Scholar] [CrossRef]
  47. Chen, Y.L.; Chen, L.Y.; Peng, Y.F.; Ding, J.Z.; Li, F.; Yang, G.B. Linking microbial C:N:P stoichiometry to microbial community and abiotic factors along a 3500-km grassland transect on the Tibetan Plateau. Glob. Ecol. Biogeogr. 2016, 25, 1416–1427. [Google Scholar] [CrossRef]
  48. Pan, L.D.; Li, R.; Zhang, Y.S.; Li, Q.G.; Gao, J.Y. Effects of straw mulching on soil ecological stoichiometry characteristics and yield on sloping farmland in karst area, Southwestern China. Acta Ecol. Sin. 2022, 42, 4428–4438. [Google Scholar]
  49. Liu, Y.W.; Zhou, X.; Han, H.H.; Yang, Q.L.; Liu, X.G. Coupling scheme optimization of Panax notoginseng considering yield, quality and water-fertilizer use efficiency. Trans. Chin. Soc. Agric. Eng. 2021, 37, 139–146. [Google Scholar]
Figure 1. The contents of (a) Csoil, (b) Nsoil, (c) Psoil and the ecological stoichiometric ratio of (d) Csoil:Nsoil, (e) Csoil:Psoil, (f) Nsoil:Psoil. Note: Different lowercase letters indicate significant differences between treatments (p < 0.05), ** indicates a highly significant level (p < 0.01), * indicates a significant level (p < 0.05), ns indicates no significant effect (p > 0.05), I is the irrigation quota, N is the amount of nitrogen applied, CK is the control.
Plants 12 02768 g001
Figure 2. Characteristics The soil of (a) Cmic, (b) Nmic, (c) Pmic and the ecological stoichiometric ratio of (d) Cmic:Nmic, (e) Cmic:Pmic, (f) Nmic:Pmic. Note: Different lowercase letters indicate significant differences between treatments (p < 0.05), ** indicates a highly significant level (p < 0.01), * indicates a significant level (p < 0.05), ns indicates no significant effect (p > 0.05). I is the irrigation quota, N is the amount of nitrogen applied, CK is the control.
Plants 12 02768 g002aPlants 12 02768 g002b
Figure 3. Correlation between soil nutrient–microbial biomass and the stoichiometric ratio.
Plants 12 02768 g003
Figure 4. Correlation analysis of nutrient–microbial biomass. Note: (a) is the correlation between Cmic and Csoil; (b) is the correlation between Nmic and Csoil; (c) is the correlation between Pmic and Csoil; (d) is the correlation between Cmic and Nsoil; (e) is the correlation between Nmic and Nsoil; (f) is the correlation between Pmic and Nsoil; (g) is the correlation between Cmic and Psoil; (h) is the correlation between Nmic and Psoil; (i) is the correlation between Pmic and Psoil.
Plants 12 02768 g004
Figure 5. Effect of water and nitrogen regulation on the yield of wolfberry. Note: Different lowercase letters indicate significant differences between treatments (p < 0.05).
Plants 12 02768 g005
Figure 6. PCA of soil nutrient–microbial biomass and its stoichiometric ratio in (a) 2021 and (b) 2022. Black line: soil nutrients and the stoichiometric characteristics; red line: soil microbial biomass and the stoichiometric characteristics.
Plants 12 02768 g006
Figure 7. A linear regression relationship between soil quality and the yield of wolfberry, (a) Based on PCA, (b) Based on TOPSIS.
Plants 12 02768 g007
Figure 8. (a,b) The location of the study area on a map; (cg) Schematic representation of the experimental arrangement.
Plants 12 02768 g008
Figure 9. The daily precipitation and daily temperature recorded during the reproductive period of wolfberry in 2021 and 2022.
Plants 12 02768 g009
Table 1. The results of PCA.
YearAnalysis ItemsPrincipal Component 1Principal Component 2Principal Component 3Analysis ItemsPrincipal Component 1Principal Component 2Principal Component 3
2021Csoil0.776 0.190 0.348 Pmic0.861 −0.339 0.273
Nsoil0.740 0.502 0.202 Cmic:Nmic−0.701 −0.349 0.559
Psoil0.009 0.854 0.487 Cmic:Pmic−0.746 0.626 −0.096
Csoil:Nsoil−0.371 −0.619 0.282 Nmic:Pmic−0.018 0.776 −0.586
Csoil:Psoil0.669 −0.691 −0.157 Characteristics rate 5.11 3.66 1.71
Nsoil:Psoil0.770 −0.442 −0.322 Contribution rate/%42.6 30.5 14.2
Cmic0.544 0.429 0.555 Cumulative contribution rate/%42.6 73.1 87.3
Nmic0.834 0.409 −0.233
2022Csoil0.891 0.307 0.125 Pmic0.493 0.369 0.772
Nsoil0.972 −0.093 0.096 Cmic:Nmic−0.931 0.139 0.092
Psoil0.385 −0.715 0.525 Cmic:Pmic0.408 −0.469 −0.682
Csoil:Nsoil−0.618 0.611 0.059 Nmic:Pmic0.922 −0.178 −0.269
Csoil:Psoil0.492 0.818 −0.286 Characteristics rate 7.04 2.24 1.66
Nsoil:Psoil0.806 0.421 −0.301 Contribution rate/%58.6 18.7 13.8
Cmic0.885 0.022 0.192 Cumulative contribution rate/%58.6 77.3 91.1
Nmic0.982 0.011 0.075
Table 2. A comprehensive evaluation of soil nutrient–microbial biomass and stoichiometric characteristics under water and nitrogen regulation.
YearTreatmentPrincipal Component 1Principal Component 2Principal Component 3Comprehensive ScoresRankingYearTreatmentPrincipal Component 1Principal Component 2Principal Component 3Comprehensive ScoresRanking
2021I1N1−4.17−2.471.88−2.26102021I1N1−6.141.350.83−3.2310
N2−1.501.73−1.54−0.337N2−0.64−1.68−0.75−0.797
N31.760.15−0.400.744N30.531.31−0.260.525
I2N1−3.201.72−1.23−1.019I2N1−1.48−2.68−0.67−1.469
N21.450.201.110.843N21.14−0.993.000.904
N30.403.461.981.511N32.19−0.680.611.243
I3N1−0.31−2.15−1.39−0.988I3N1−1.680.71−0.85−0.978
N21.94−1.960.480.306N22.512.130.351.921
N32.25−0.09−0.270.892N32.540.27−0.671.452
CK1.36−0.59−0.630.315CK1.020.26−1.570.436
Table 3. A comprehensive evaluation of soil nutrient–microbial biomass and chemometric characteristics under water and nitrogen regulation, determined by the TOPSIS method.
YearTreatmentSoil Nutrient–Microbial Biomass and Stoichiometric Characteristics IndexDi±DiCiRanking
CsoilNsoilPsoilCsoil:NsoilCsoil:PsoilNsoil:PsoilCmicNmicPmicCmic:NmicCmic:PmicNmic:Pmic
2021I1N10.283 0.265 0.299 0.354 0.294 0.279 0.297 0.210 0.276 0.451 0.333 0.233 0.294 0.209 0.415 10
I1N20.299 0.320 0.318 0.288 0.291 0.313 0.302 0.299 0.254 0.307 0.371 0.367 0.246 0.410 0.625 5
I1N30.355 0.352 0.322 0.311 0.339 0.338 0.305 0.335 0.323 0.279 0.295 0.326 0.228 0.406 0.640 3
I2N10.277 0.272 0.330 0.332 0.259 0.256 0.300 0.308 0.250 0.297 0.368 0.381 0.285 0.417 0.594 8
I2N20.332 0.327 0.321 0.316 0.321 0.315 0.343 0.337 0.353 0.309 0.301 0.300 0.213 0.380 0.641 2
I2N30.335 0.355 0.405 0.291 0.256 0.273 0.350 0.338 0.319 0.314 0.338 0.329 0.221 0.422 0.656 1
I3N10.259 0.260 0.248 0.309 0.331 0.334 0.309 0.310 0.332 0.303 0.285 0.291 0.296 0.339 0.534 9
I3N20.349 0.315 0.294 0.348 0.372 0.336 0.317 0.330 0.360 0.293 0.271 0.285 0.244 0.381 0.609 7
I3N30.328 0.353 0.306 0.289 0.333 0.358 0.321 0.337 0.346 0.289 0.287 0.304 0.238 0.389 0.621 6
CK0.331 0.323 0.298 0.319 0.345 0.343 0.313 0.335 0.326 0.285 0.295 0.320 0.234 0.391 0.626 4
Z±0.355 0.355 0.405 0.354 0.372 0.358 0.350 0.338 0.360 0.451 0.371 0.381
Z0.259 0.260 0.248 0.288 0.256 0.256 0.297 0.210 0.250 0.279 0.271 0.233
2022I1N10.276 0.249 0.291 0.354 0.299 0.269 0.290 0.200 0.312 0.464 0.293 0.201 0.290 0.210 0.420 10
I1N20.287 0.310 0.313 0.291 0.289 0.313 0.312 0.297 0.303 0.313 0.325 0.312 0.220 0.179 0.448 7
I1N30.332 0.327 0.306 0.317 0.341 0.338 0.313 0.303 0.317 0.308 0.311 0.302 0.194 0.208 0.517 6
I2N10.300 0.306 0.340 0.308 0.277 0.284 0.298 0.279 0.287 0.321 0.331 0.313 0.227 0.173 0.433 8
I2N20.326 0.332 0.354 0.308 0.289 0.296 0.329 0.346 0.348 0.284 0.297 0.314 0.215 0.232 0.519 5
I2N30.332 0.341 0.335 0.306 0.312 0.321 0.336 0.356 0.327 0.283 0.324 0.343 0.198 0.259 0.566 3
I3N10.299 0.291 0.294 0.322 0.321 0.314 0.291 0.290 0.302 0.305 0.303 0.308 0.226 0.168 0.427 9
I3N20.345 0.337 0.305 0.321 0.356 0.348 0.328 0.367 0.338 0.266 0.307 0.343 0.210 0.280 0.572 2
I3N30.330 0.347 0.311 0.300 0.334 0.351 0.333 0.353 0.321 0.282 0.327 0.347 0.199 0.267 0.573 1
CK0.327 0.311 0.308 0.330 0.334 0.319 0.328 0.336 0.303 0.292 0.341 0.351 0.196 0.244 0.554 4
Z±0.345 0.347 0.354 0.354 0.356 0.351 0.336 0.367 0.348 0.464 0.341 0.351
Z0.276 0.249 0.291 0.291 0.277 0.269 0.290 0.200 0.287 0.266 0.293 0.201
Note: Ci indicates the fit degree, Z+ indicates the ideal solution, Z indicates the inverse ideal solution, Di+ indicates the distance between each treatment and the ideal solution, and Di indicates the distance between each treatment and the inverse ideal solution.
Table 4. Physicochemical properties of the soil in the study area.
YearDepthpHECTotal NTotal PTotal KOrganic MaterialAmmonium NNitrate N
cmμs cm−1g kg−1mg kg−1
20210–208.0016150.460.4316.197.5812.6714.69
20–408.2010910.420.4217.156.734.514.73
20220–208.0615240.450.4017.007.2112.2414.17
20–408.129630.410.4117.006.284.424.82
Table 5. The water and nitrogen management program of wolfberry.
Fertility Stages20212022
DateIrrigation Amount m2 hm−2Nitrogen Amount kg hm−2DateIrrigation Amount m2 hm−2Nitrogen Amount kg hm−2
I1I2I3N1N2N3I1I2I3N1N2N3
Spring tip period04–30432513.059424.7533.7542.7504–28432513.059424.7533.7542.75
Flowering period05–23216256.529712.3816.8821.3805–23216256.529712.3816.8821.38
06–18432513.059428.8839.3849.8806–15432513.059428.8839.3849.88
Fruit ripening period07–05216256.529720.6328.1335.6307–02216256.529720.6328.1335.63
07–15216256.529720.6328.1335.6307–15216256.529720.6328.1335.63
07–25216256.529720.6328.1335.6307–28216256.529720.6328.1335.63
08–05216256.529720.6328.1335.6308–08216256.529720.6328.1335.63
Defoliation period08–25216256.529716.5022.5028.5008–28216256.529716.5022.5028.50
Total216025652970165225285 216025652970165225285
Disclaimer/Publisher’s Note: The statements, opinions and data contained in all publications are solely those of the individual author(s) and contributor(s) and not of MDPI and/or the editor(s). MDPI and/or the editor(s) disclaim responsibility for any injury to people or property resulting from any ideas, methods, instructions or products referred to in the content.

