Next Article in Journal
Leaf Proteomic Analysis in Seedlings of Two Maize Landraces with Different Tolerance to Boron Toxicity
Next Article in Special Issue
Distinguishing the Effects of Stress Intensity and Stress Duration in Plant Responses to Salinity
Previous Article in Journal
Phytoextraction and Migration Patterns of Cadmium in Contaminated Soils by Pennisetum hybridum
Previous Article in Special Issue
Physiological Responses of Two Olive Cultivars to Salt Stress
 
 
Correction published on 27 November 2023, see Plants 2023, 12(23), 3987.
Article

LeGRXS14 Reduces Salt Stress Tolerance in Arabidopsis thaliana

1
College of Life Sciences and Oceanography, Shenzhen University, Shenzhen 518060, China
2
College of Physics and Optoelectronic Engineering, Shenzhen University, Shenzhen 518060, China
3
College of Life and Environmental Sciences, Hangzhou Normal University, Hangzhou 310030, China
*
Author to whom correspondence should be addressed.
Plants 2023, 12(12), 2320; https://doi.org/10.3390/plants12122320
Submission received: 6 April 2023 / Revised: 1 June 2023 / Accepted: 8 June 2023 / Published: 15 June 2023 / Corrected: 27 November 2023
(This article belongs to the Special Issue Salinity Stress Tolerance in Plants)

Abstract

:
Salt stress represents a significant abiotic stressor for plants and poses a severe threat to agricultural productivity. Glutaredoxins (GRXs) are small disulfide reductases that can scavenge cellular reactive oxygen species and are crucial for plant growth and development, particularly under stressful circumstances. Although CGFS-type GRXs were found to be involved in various abiotic stresses, the intrinsic mechanism mediated by LeGRXS14, a tomato (Lycopersicon esculentum Mill.) CGFS-type GRX, is not yet fully understood. We discovered that LeGRXS14 is relatively conserved at the N-terminus and exhibits an increase in expression level under salt and osmotic stress conditions in tomatoes. The expression levels of LeGRXS14 in response to osmotic stress peaked relatively rapidly at 30 min, while the response to salt stress only peaked at 6 h. We constructed LeGRXS14 overexpression Arabidopsis thaliana (OE) lines and confirmed that LeGRXS14 is located on the plasma membrane, nucleus, and chloroplasts. In comparison to the wild-type Col-0 (WT), the OE lines displayed greater sensitivity to salt stress, resulting in a profound inhibition of root growth under the same conditions. Analysis of the mRNA levels of the WT and OE lines revealed that salt stress-related factors, such as ZAT12, SOS3, and NHX6, were downregulated. Based on our research, it can be concluded that LeGRXS14 plays a significant role in plant tolerance to salt. However, our findings also suggest that LeGRXS14 may act as a negative regulator in this process by exacerbating Na+ toxicity and the resulting oxidative stress.

1. Introduction

Soil salinity is an increasingly severe environmental issue in agriculture worldwide [1,2]. Sodium chloride (NaCl) is the key salt accountable for salinization, which can hinder the growth and development of plants. Salt stress causes osmotic stress and ionic toxicity, which decrease turgor pressure and hasten stomatal closure. In addition, in metabolically active intracellular compartments, the excessive accumulation of Na+ and Cl can affect enzyme activities and result in physiological dysfunction. Salt stress also triggers an excess of reactive oxygen species (ROS) in plants, such as singlet oxygen (1O2), superoxide anions (O2·−), hydrogen peroxide (H2O2), and hydroxyl radicals (HO·), which act on DNA, lipids, and proteins, leading to irreversible oxidation events and oxidative damage and ultimately leading to cell death [3].
To maintain low ROS concentrations in cells, plants have evolved a variety of precise oxidative scavenging systems to combat oxidative damage. An array of enzymatic and non-enzymatic antioxidants can scavenge ROS, including ascorbate peroxidases (APXs), superoxide dismutases (SODs), catalases (CATs), glutathione peroxidases (GPXs), ascorbic acid, carotenoids, glutathione (GSH), flavonoids, and α-tocopherol [4]. Additional proteins have been identified as playing a role in the signaling of reactive oxygen species within plants, such as glutaredoxins (GRXs). These are small, ubiquitous oxidoreductase enzymes belonging to the thioredoxin (TRX) superfamily that were initially discovered in Escherichia coli in 1976 [5,6,7,8]. GRXs can regulate the redox state of thiol groups in cells or utilize the reducing power of glutathione (GSH) to exchange a glutathionylated moiety with target proteins. The reduction of dehydroascorbate (DHA), peroxiredoxin, and methionine sulfoxide reductase by glutaredoxins (GRXs) helps to remove ROS and repair oxidative damage to macromolecules [9,10,11,12,13].
Based on the motif present at their active sites, GRXs can be categorized into three distinct classes: CPYC-type, CGFS-type, and CC-type. CPYC-type GRXs can be found in nearly all prokaryotes and eukaryotes, whereas CC-type GRXs are only found in land plants. CGFS-type GRXs contain single-domain and multi-domain GRXs. Single-domain GRXs are similar to CPYC-type GRXs, and multi-domain GRXs occur exclusively in eukaryotes [14,15]. CPYC-type GRXs are involved in regulating the redox state of thiol groups in proteins or small compounds, while CC-type GRXs are mainly involved in developmental processes and stress responses [16,17]. Tomatoes are an important economic crop, and CGFS-type GRXs in tomatoes exhibit similar mechanisms in the plant stress response as CC-type GRXs. For example, the mutants legrxS14 and legrxs17 show hypersensitivity to heat and chilling stress, and legrxS14 mutants exhibit higher tolerance to heavy metal toxicity and drought stress [18]. Limited research exists on the involvement of LeGRXS14 in conferring salt tolerance; therefore, we examined the phenotype and molecular mechanism of LeGRXS14 under salt stress in overexpressing plants.
To investigate how LeGRXS14 responds to various abiotic challenges, we evaluated the temporal and spatial expression of LeGRXS14 in tomatoes under different stresses. We generated OE lines to investigate the role of LeGRXS14 under salt stress and to determine the exact subcellular localization of LeGRXS14 and its expression in different organs. Furthermore, we established the expression profile of genes associated with salt stress in OE lines to investigate the molecular mechanisms underlying the response of LeGRXS14 to salt stress.

2. Results

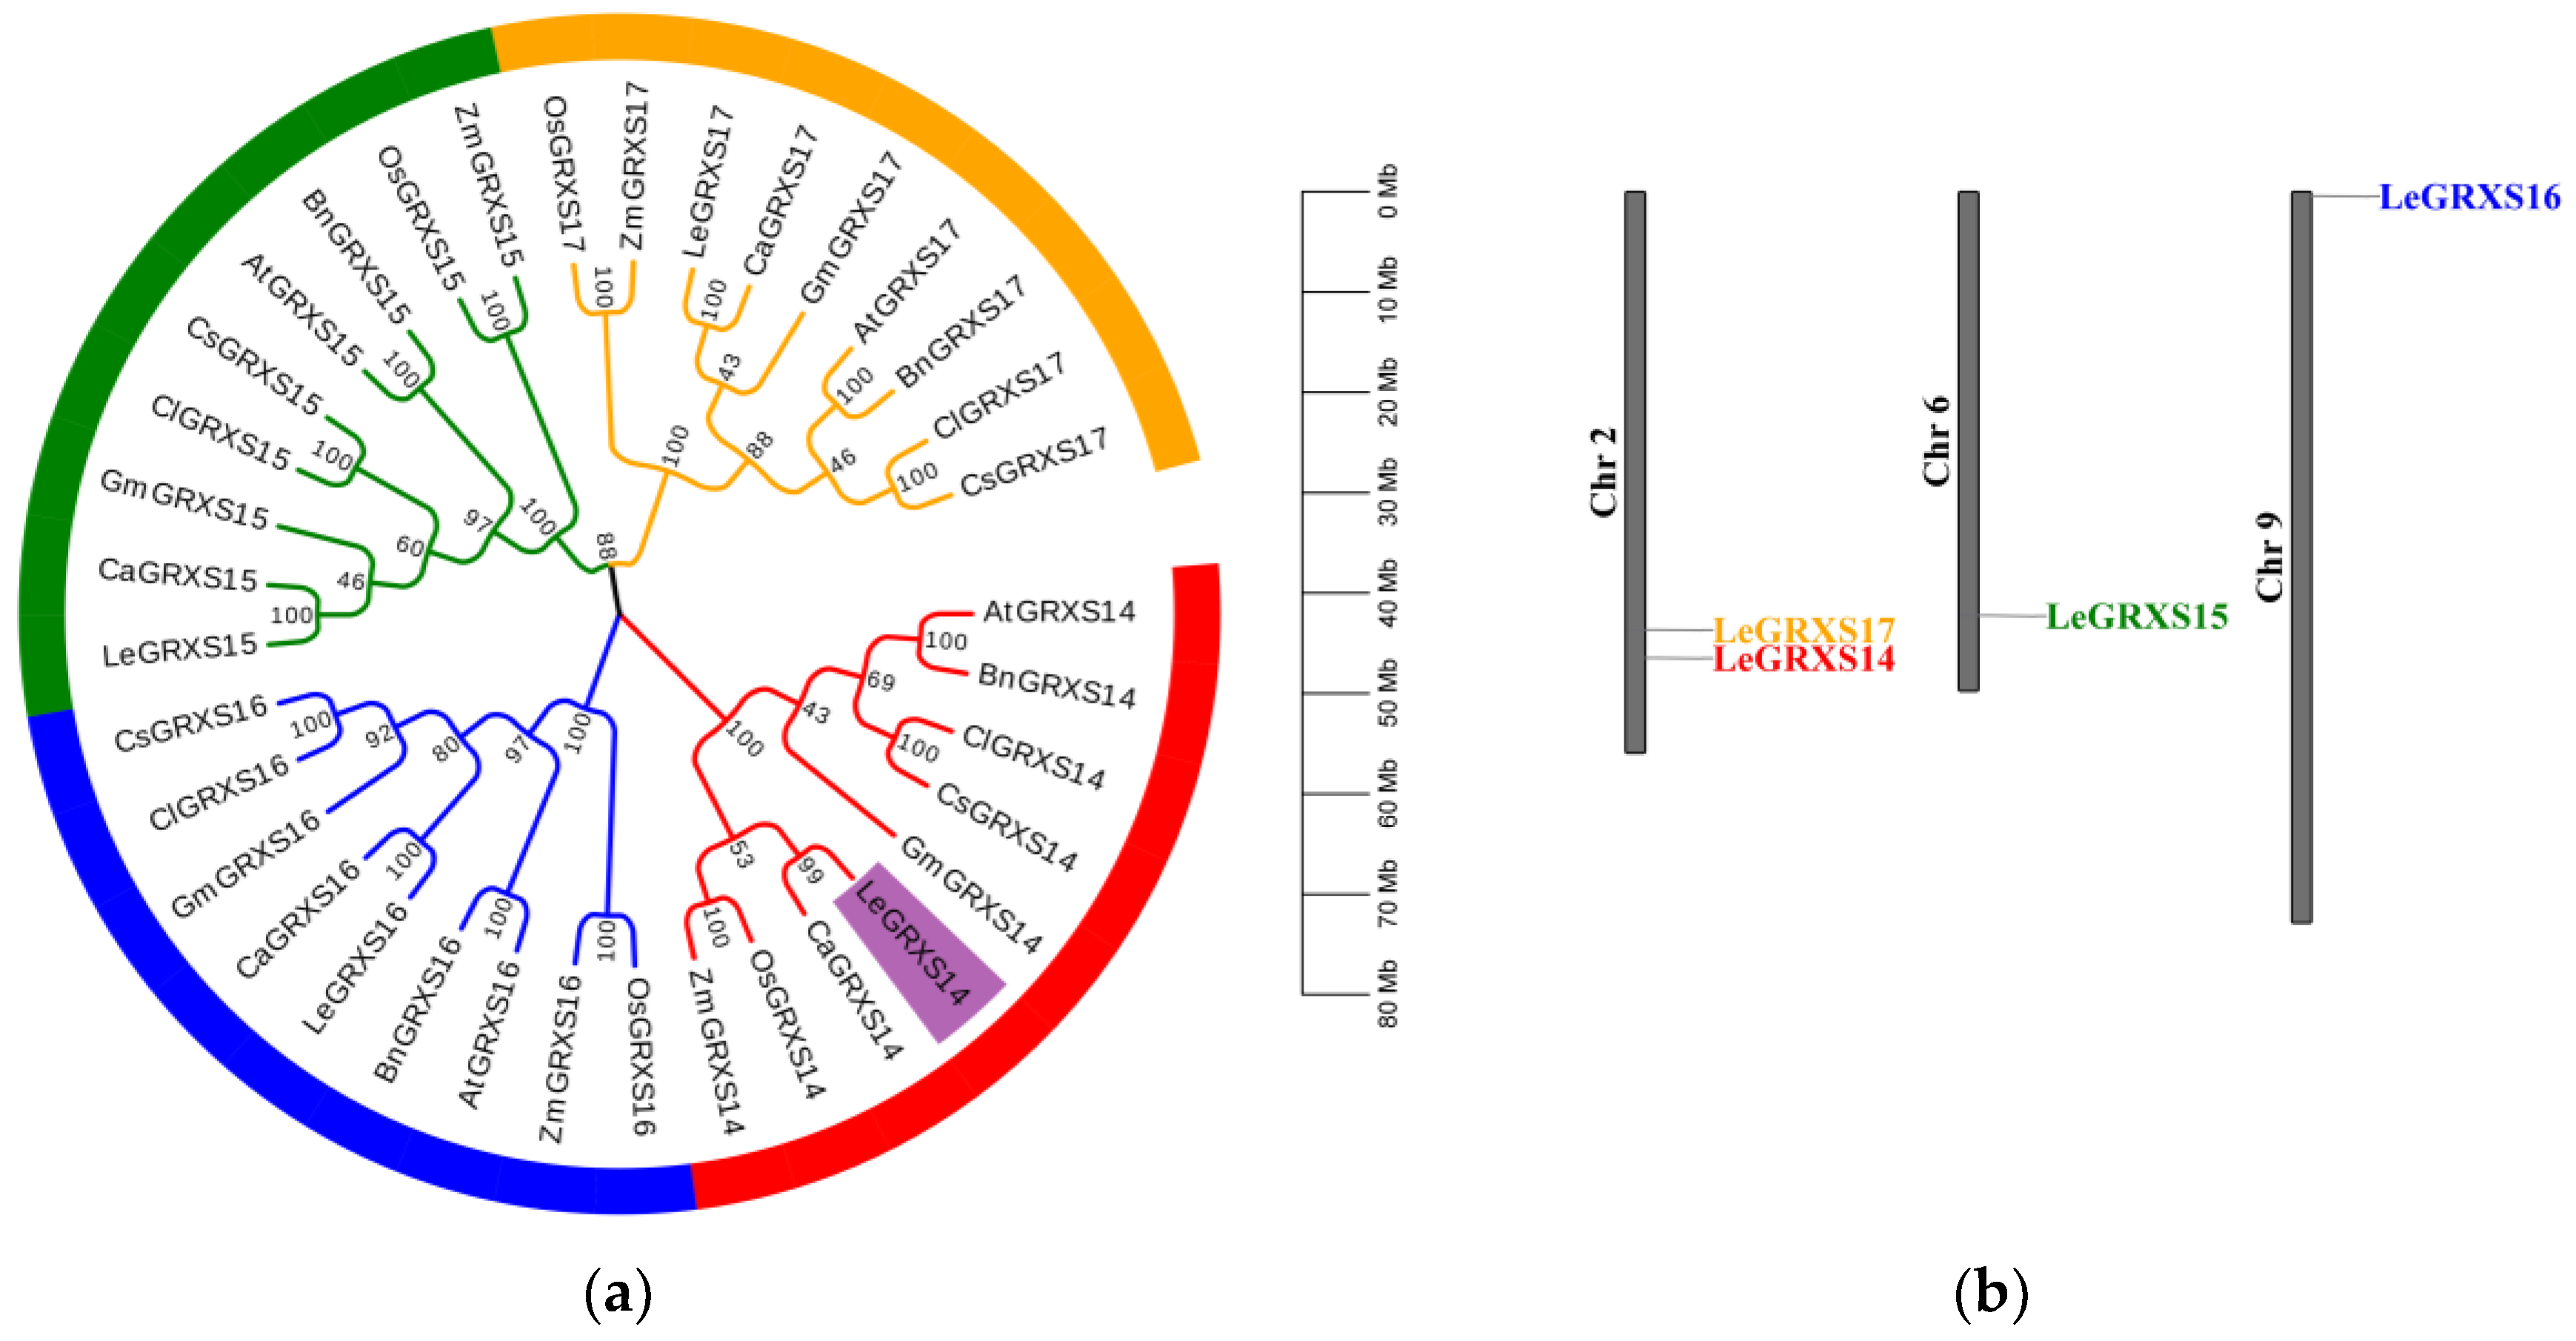
2.1. Phylogenetic Analysis and Chromosomal Distribution of CGFS-Type GRX Proteins

CGFS-type GRXs have four members in tomatoes, namely, LeGRXS14/15/16/17. To identify homologues in the model plant A. thaliana as well as in other commercial crops such as Brassica napus, Capsicum annuum, Citrullus lanatus, Cucumis sativus, Glycine max, Oryza sativa, and Zea mays, BLASTp searches were performed using the full-length protein sequences of LeGRXS14/15/16/17 as individual queries. The unrooted phylogenetic tree showed that the CGFS-type GRXs could be divided into four major groups (Figure 1a), with each group consisting of nine proteins. LeGRXS14 in the GRXS14 group (highlighted in purple in Figure 1a) showed a close relationship with CaGRXS14, OsGRXS14, and ZmGRXS14, indicating high homology in C. annuum, O. sativa, and Z. mays. The GRXS15/16/17 groups all had high similarity with LeGRXS14. LeGRXS15/16/17 were also most closely related to C. annuum, and they had high homology with G. max as well; this was in contrast to O. sativa and Z. mays in the GRXS14 group. We constructed a chromosomal distribution map of CGFS-type GRXs on the tomato chromosomes to understand their genomic distribution, and the results indicated that they were located on different chromosomes. LeGRXS14 and 17 were on Chr 2, and LeGRXS15 and 16 were on Chr 6 and Chr 9, respectively (Figure 1b).

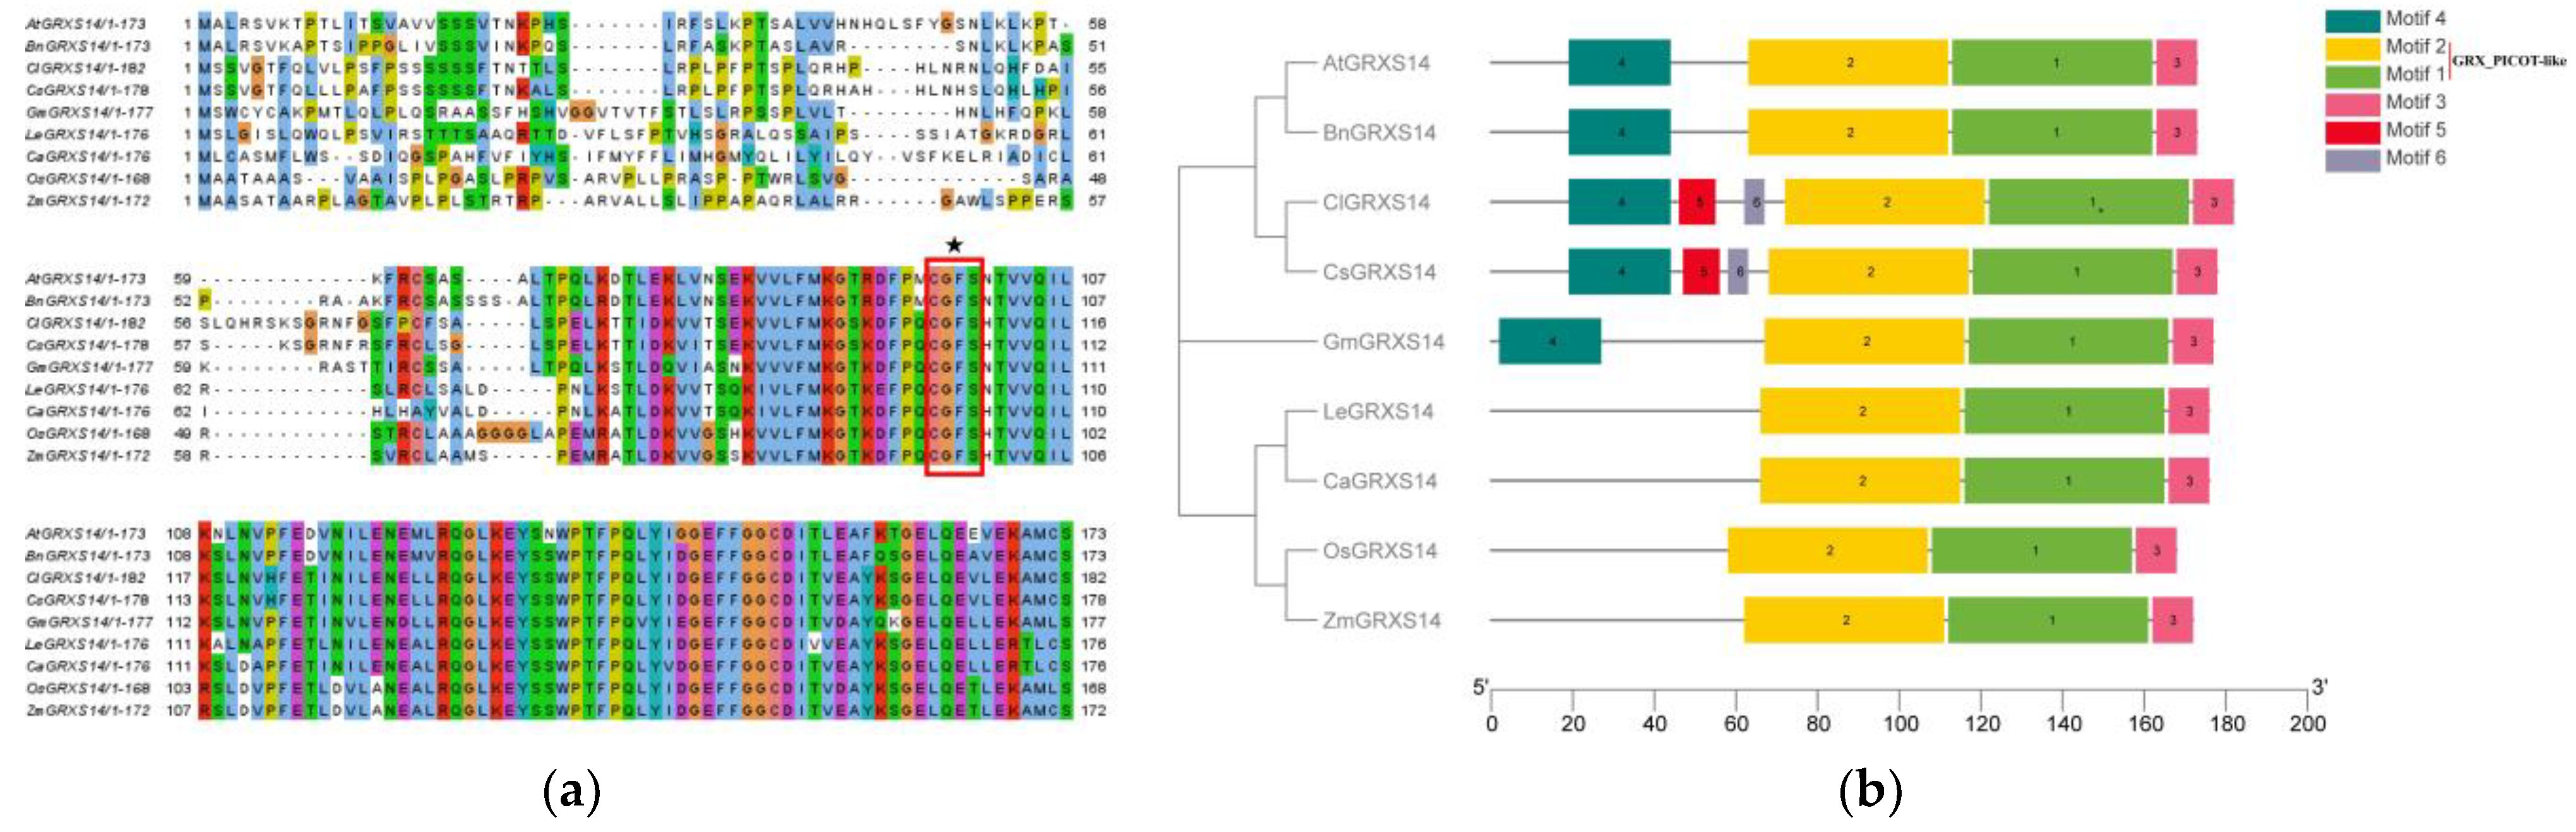
2.2. Multiple Sequence Alignment and Motif Analysis of GRXS14 in Tomatoes

Peptide alignment performed by the Clustal W program indicated that GRXs from different species showed obvious similarity, with the N-terminus in particular being highly conserved across species. The red boxes and black stars are marked with the active-site motif CGFS (Figure 2a). Considering that motifs are frequently divergent across multiple gene families, we examined the motifs of the GRXs. The MEME web server was used to assess the patterns, and six major motifs were identified. Motifs 1, 2, and 3 were present in all nine GRXS14s. LeGRXS14 clustered with CaGRXS14, OsGRXS14, and ZmGRXS14, while only ClGRXS14 and CaGRXS14 contained motif 5/6 in this cluster (Figure 2b). Supplemental Table S3 lists the lengths and preserved sequences of each motif in GRXS14. Motifs 1 and 2 have been identified to encode a GRX_PICOT-like domain, while motif 2 contains the active site motif CGFS. Other motifs have not been functionally annotated.

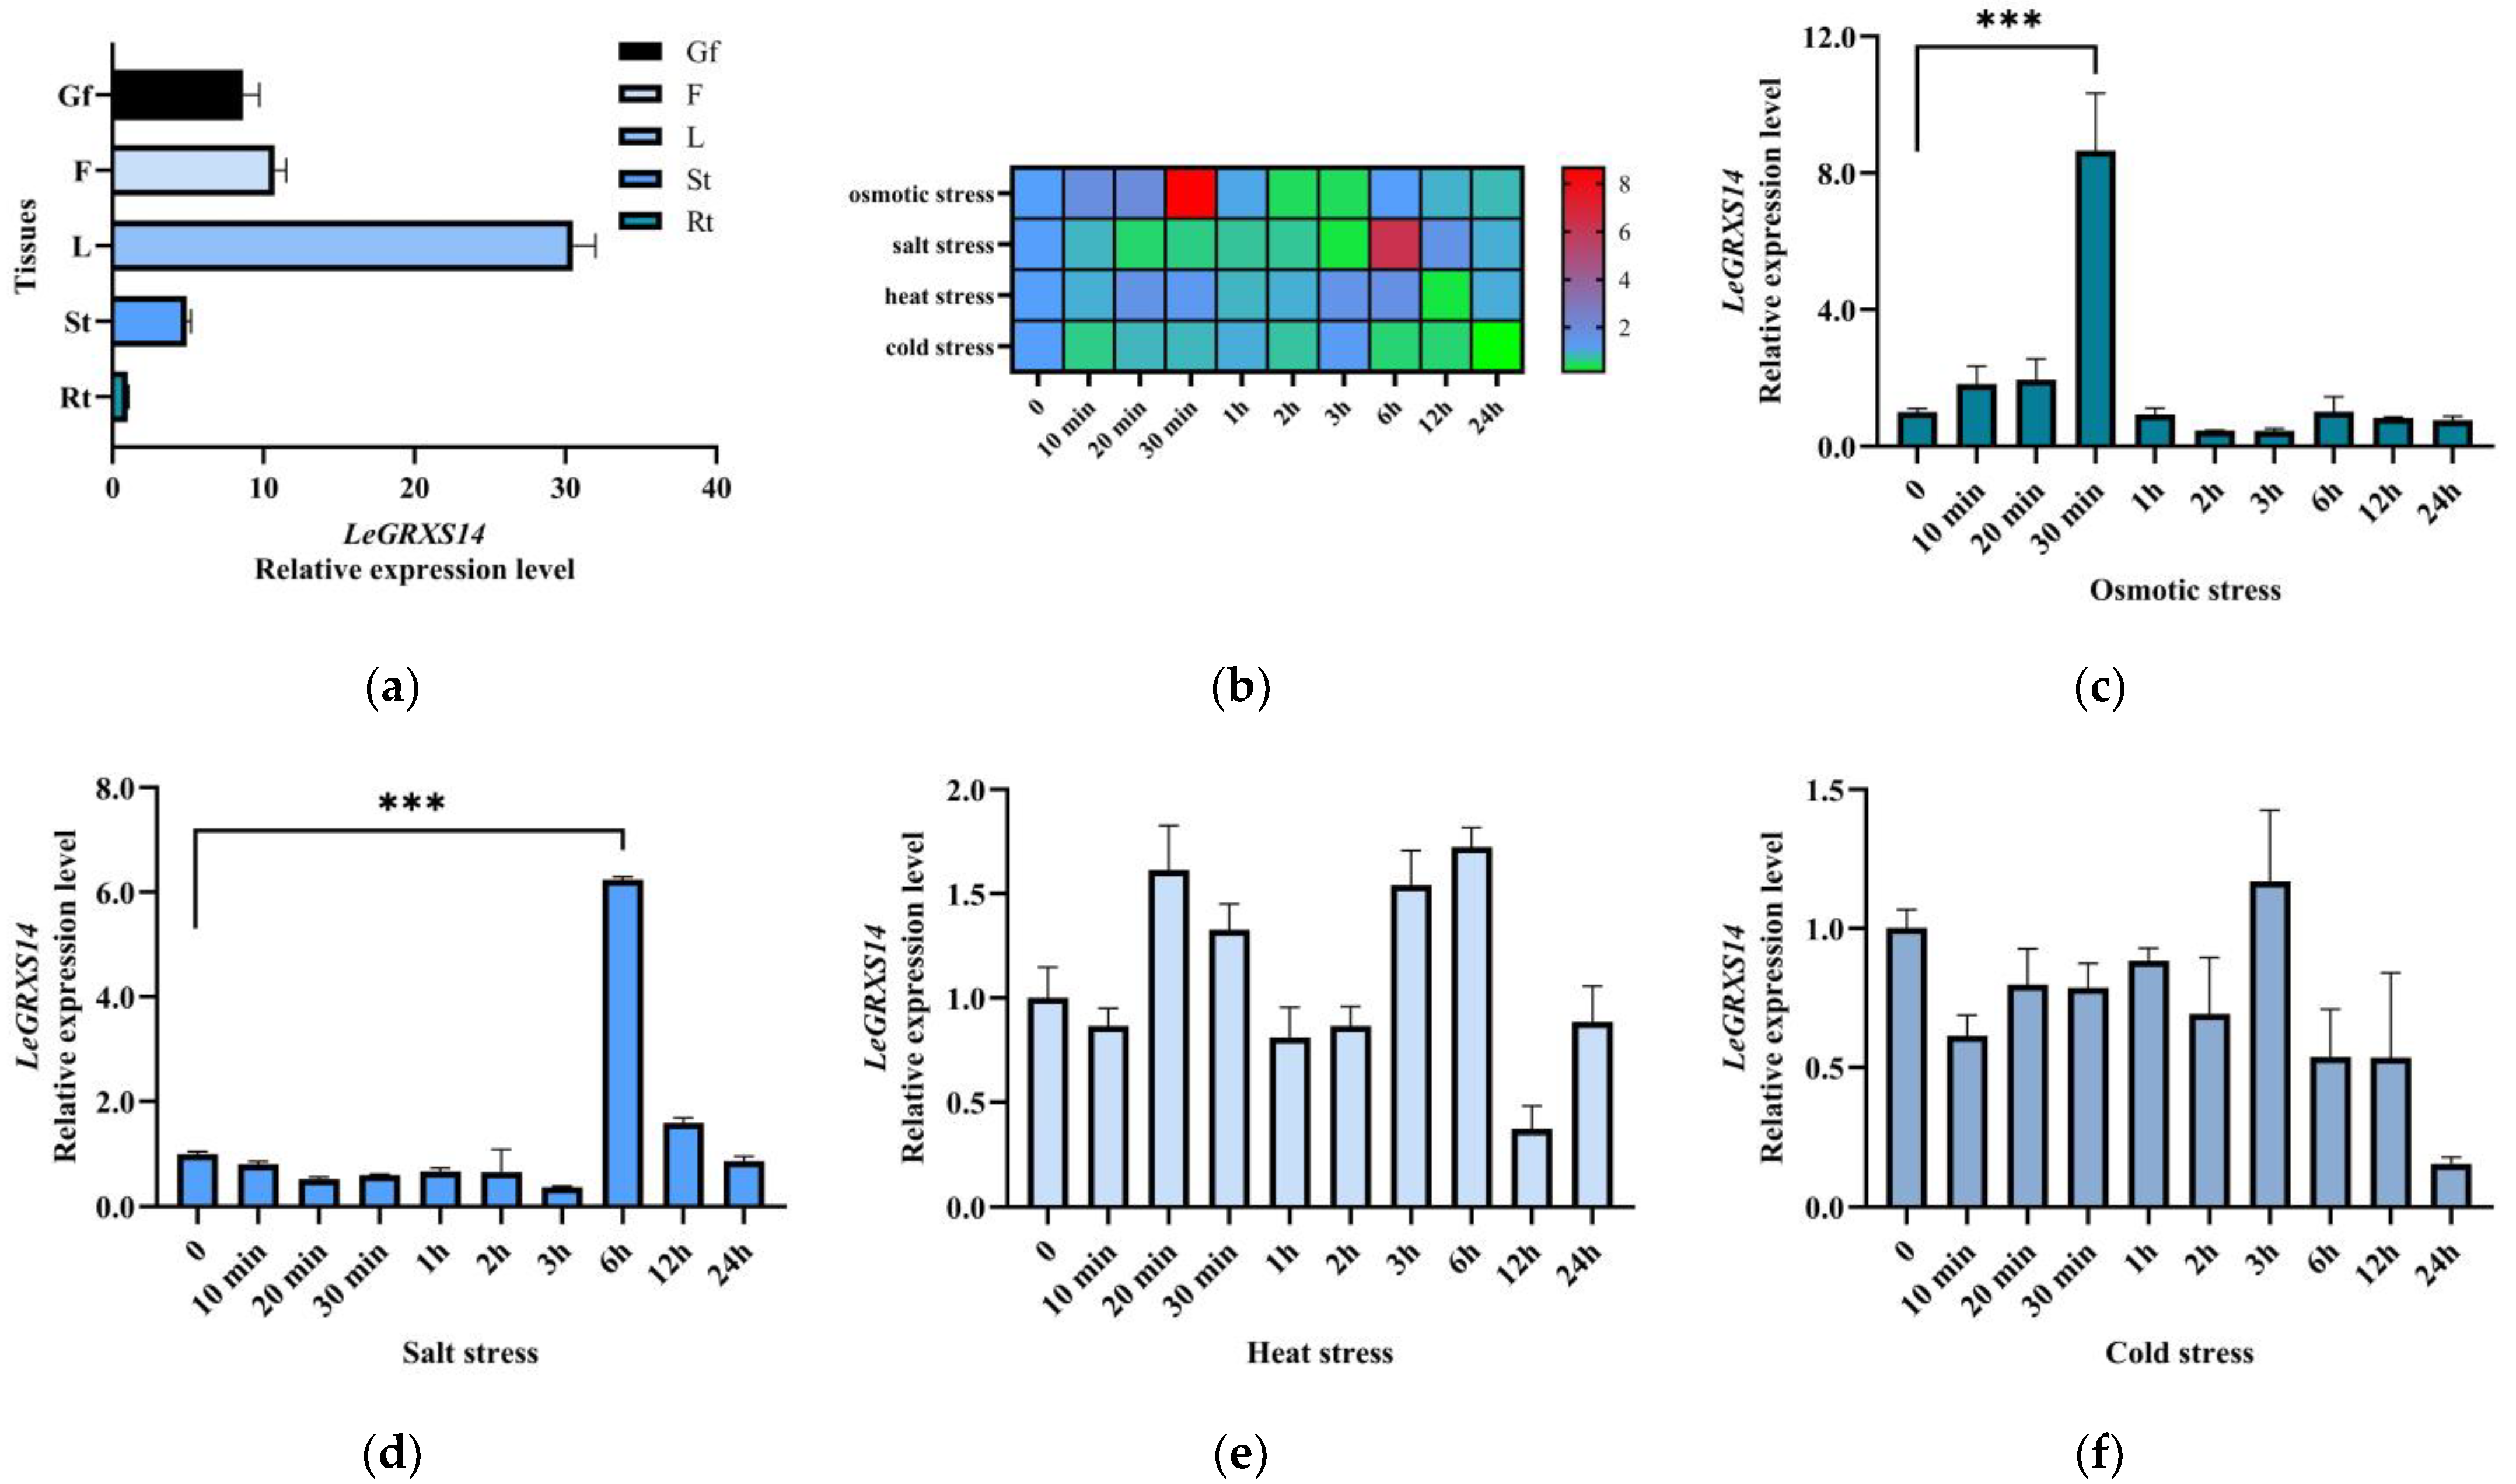
2.3. Expression Patterns of LeGRXS14 Genes in Tomato under Abiotic Stress

To investigate the gene expression level of LeGRXS14 in different tomato organs, RNA from the root (Rt), stem (St), leaf (L), flower (F), and green fruit (Gf) was extracted for qRT-PCR analysis. The findings demonstrated that LeGRXS14 was expressed across all of the aforementioned organs. Utilizing the root’s expression level as the control with a relative level of 1, our analysis revealed that the leaf exhibited the highest expression level of LeGRXS14 at 30.5, followed by the flower, fruit, and stem at levels of 10.7, 8.6, and 4.9, respectively. This finding serves to demonstrate the wide distribution of LeGRXS14 expression throughout the tomato plant, with particular prominence within the shoots (Figure 3a).
To gain a comprehensive understanding of the potential functions of LeGRXS14, we conducted a study that examined the impact of various abiotic stresses on the expression patterns of this gene in tomatoes. The selected stresses included heat, osmotic stress, cold, and salt. The tomato seedlings, aged one month, were subjected to each stress for a period of 24 h. The heatmap revealed that osmotic and salt stress had a bigger impact on LeGRXS14 gene expression than heat and cold stress (Figure 3b). The expression levels of LeGRXS14 did not exhibit significant changes under heat stress but did change dramatically under salt and osmotic stress (Figure 3c–f). The highest expression level appeared at 6 h under salt stress, and the gene expression level of LeGRXS14 increased by 6.2 times compared to that of the untreated seedlings (Figure 3d). In addition, osmotic stress caused an 8.7-fold increase in LeGRXS14 gene expression in 30 min (Figure 3c). These results suggest that salt and osmotic stress treatments increased the expression of LeGRXS14 and that osmotic stress enhanced the expression of LeGRXS14 much more rapidly than the salt stress treatment.

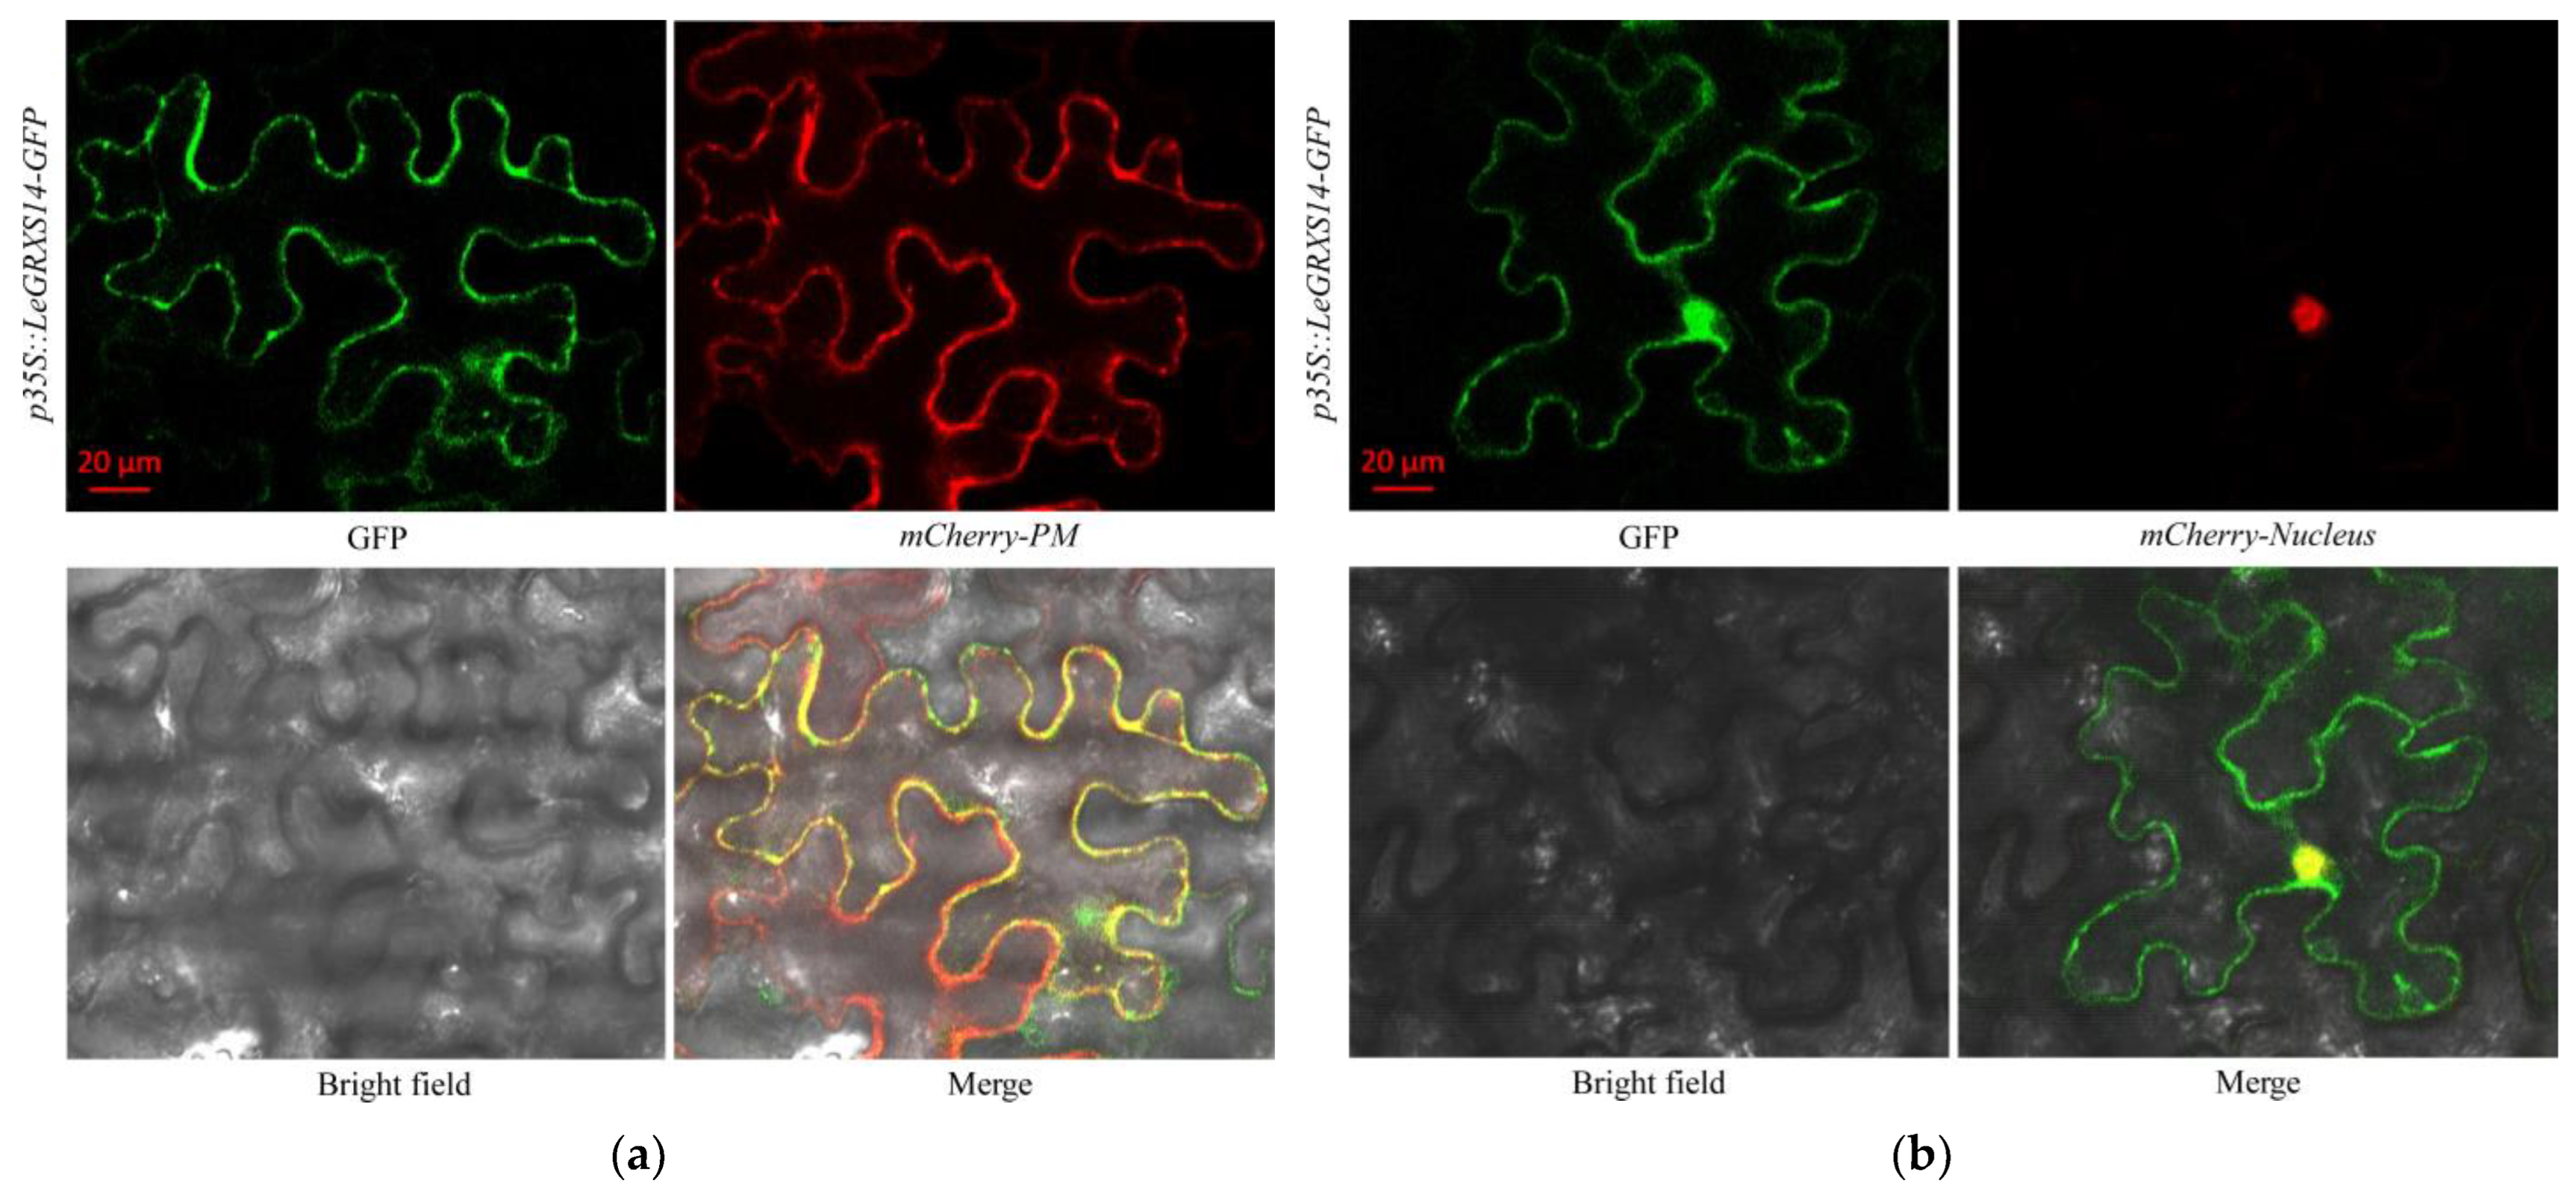
2.4. Subcellular Localization of LeGRXS14-GFP

We identified the subcellular localization of the LeGRXS14 proteins to comprehensively evaluate the physiological functions of LeGRXS14 in A. thaliana. In transgenic A. thaliana root cells containing p35S::LeGRXS14-GFP, GFP fluorescence was detected at high levels in the plasma membrane and nucleus (Figure S3a). To verify plasma membrane localization, we further verified plasma membrane localization of the LeGRXS14 protein in plasmolyzed cells and co-localization of LeGRXS14 with a plasma membrane marker (mCherry-Plasma membrane) in transiently transformed tobacco (Nicotiana benthamiana) leaves. The fluorescence results clearly demonstrate that LeGRXS14-GFP was expressed on the plasma membrane (Figures S3b,c, and 4a). We also detected co-localization of LeGRXS14 with a nucleus marker (mCherry-Nucleus) (Figure 4b), and overlapping pore patterns were observed in tobacco leaves transiently transformed with p35S::LeGRXS14-GFP and mCherry-Nucleus transgenes. In transgenic A. thaliana leaf protoplasts containing p35S::LeGRXS14-GFP, the presence of LeGRXS14-GFP was evident within chloroplasts. (Figure S3d). Overall, these findings confirmed that LeGRXS14-GFP was localized on both the plasma membrane, nucleus, and chloroplasts.

2.5. LeGRXS14 Overexpression in Response to Salt Stress in A. thaliana

To explore the molecular mechanism governing the response of LeGRXS14 to abiotic stress, we constructed OE lines to investigate their ability to tolerate long-term stress (Figure 5a). Under conditions of low Ca2+, both the WT and OE lines showed similar root lengths in 1/2 MS media without NaCl. However, after 12 days of salt treatment, the OE lines exhibited a reduced root length compared with the WT. Comprehensive statistical analysis of the data distribution clearly showed that the OE lines manifested heightened sensitivity to salt stress in comparison to the WT (Figure 5b). However, no discernible distinction could be observed between the WT and OE lines in a normal Ca2+ environment (Figure S1). The results indicated that the upregulation of LeGRXS14 in A. thaliana had an impact on the plant’s reaction to salt stress.

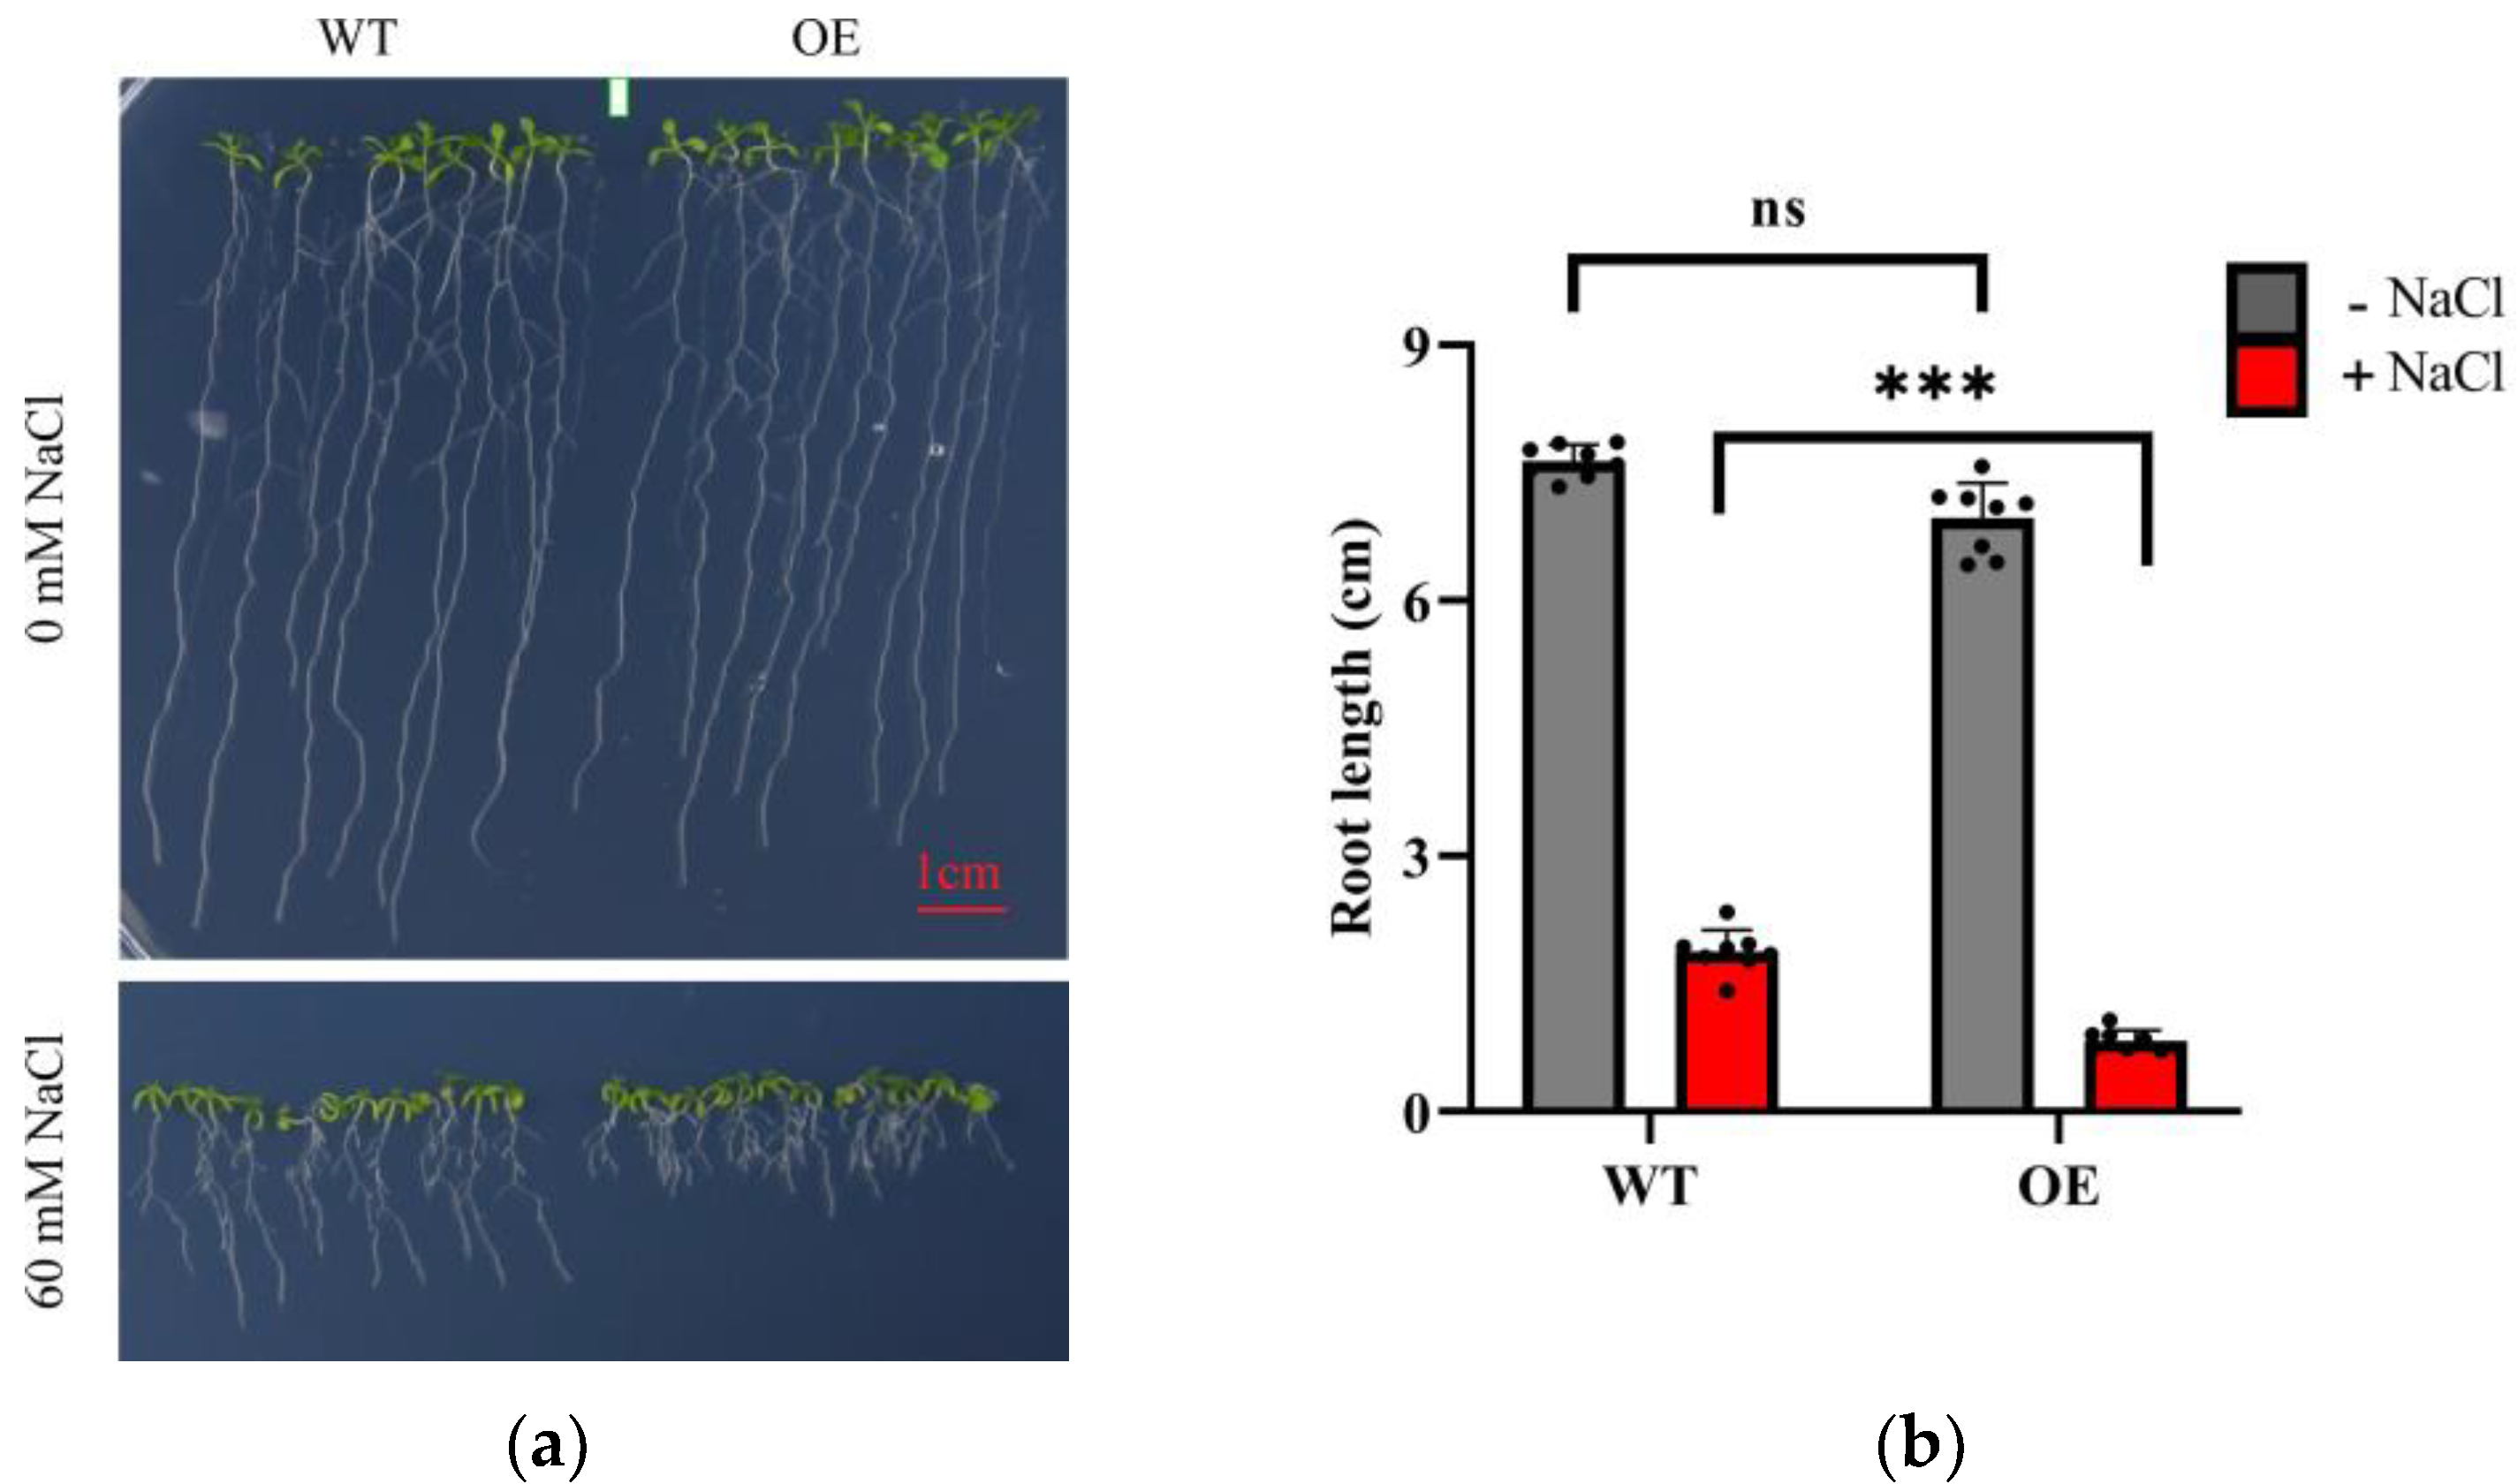
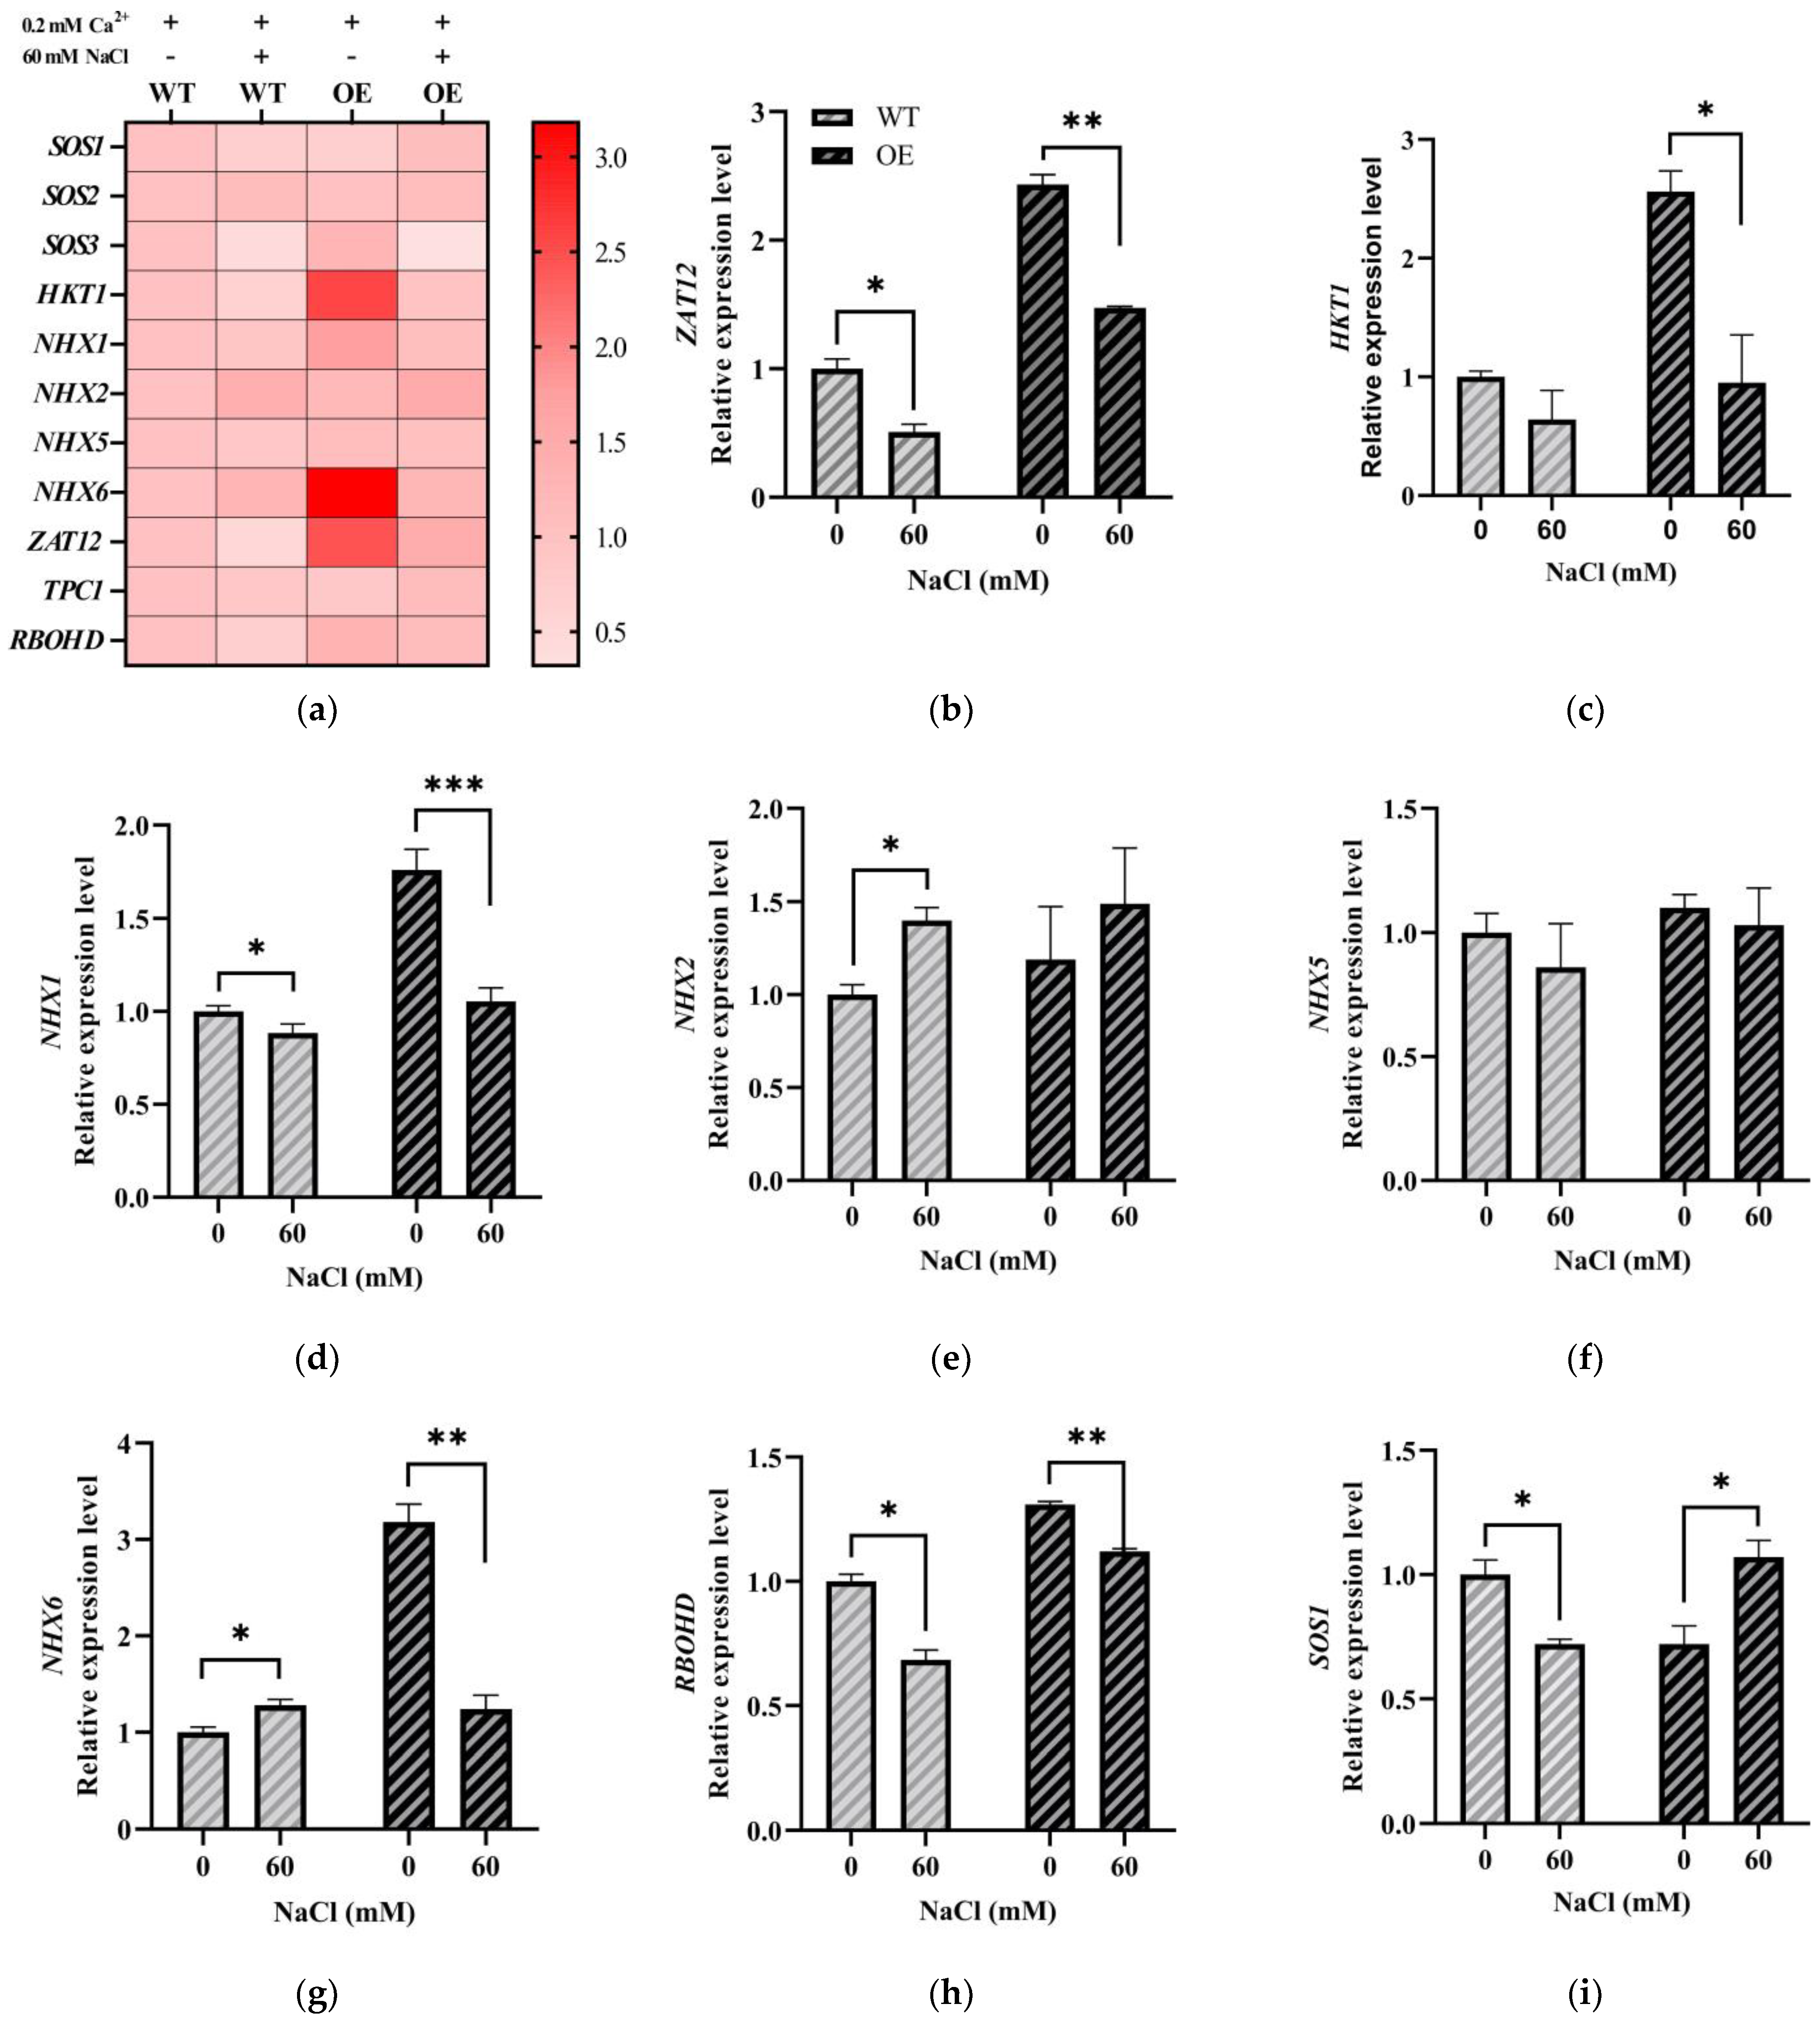
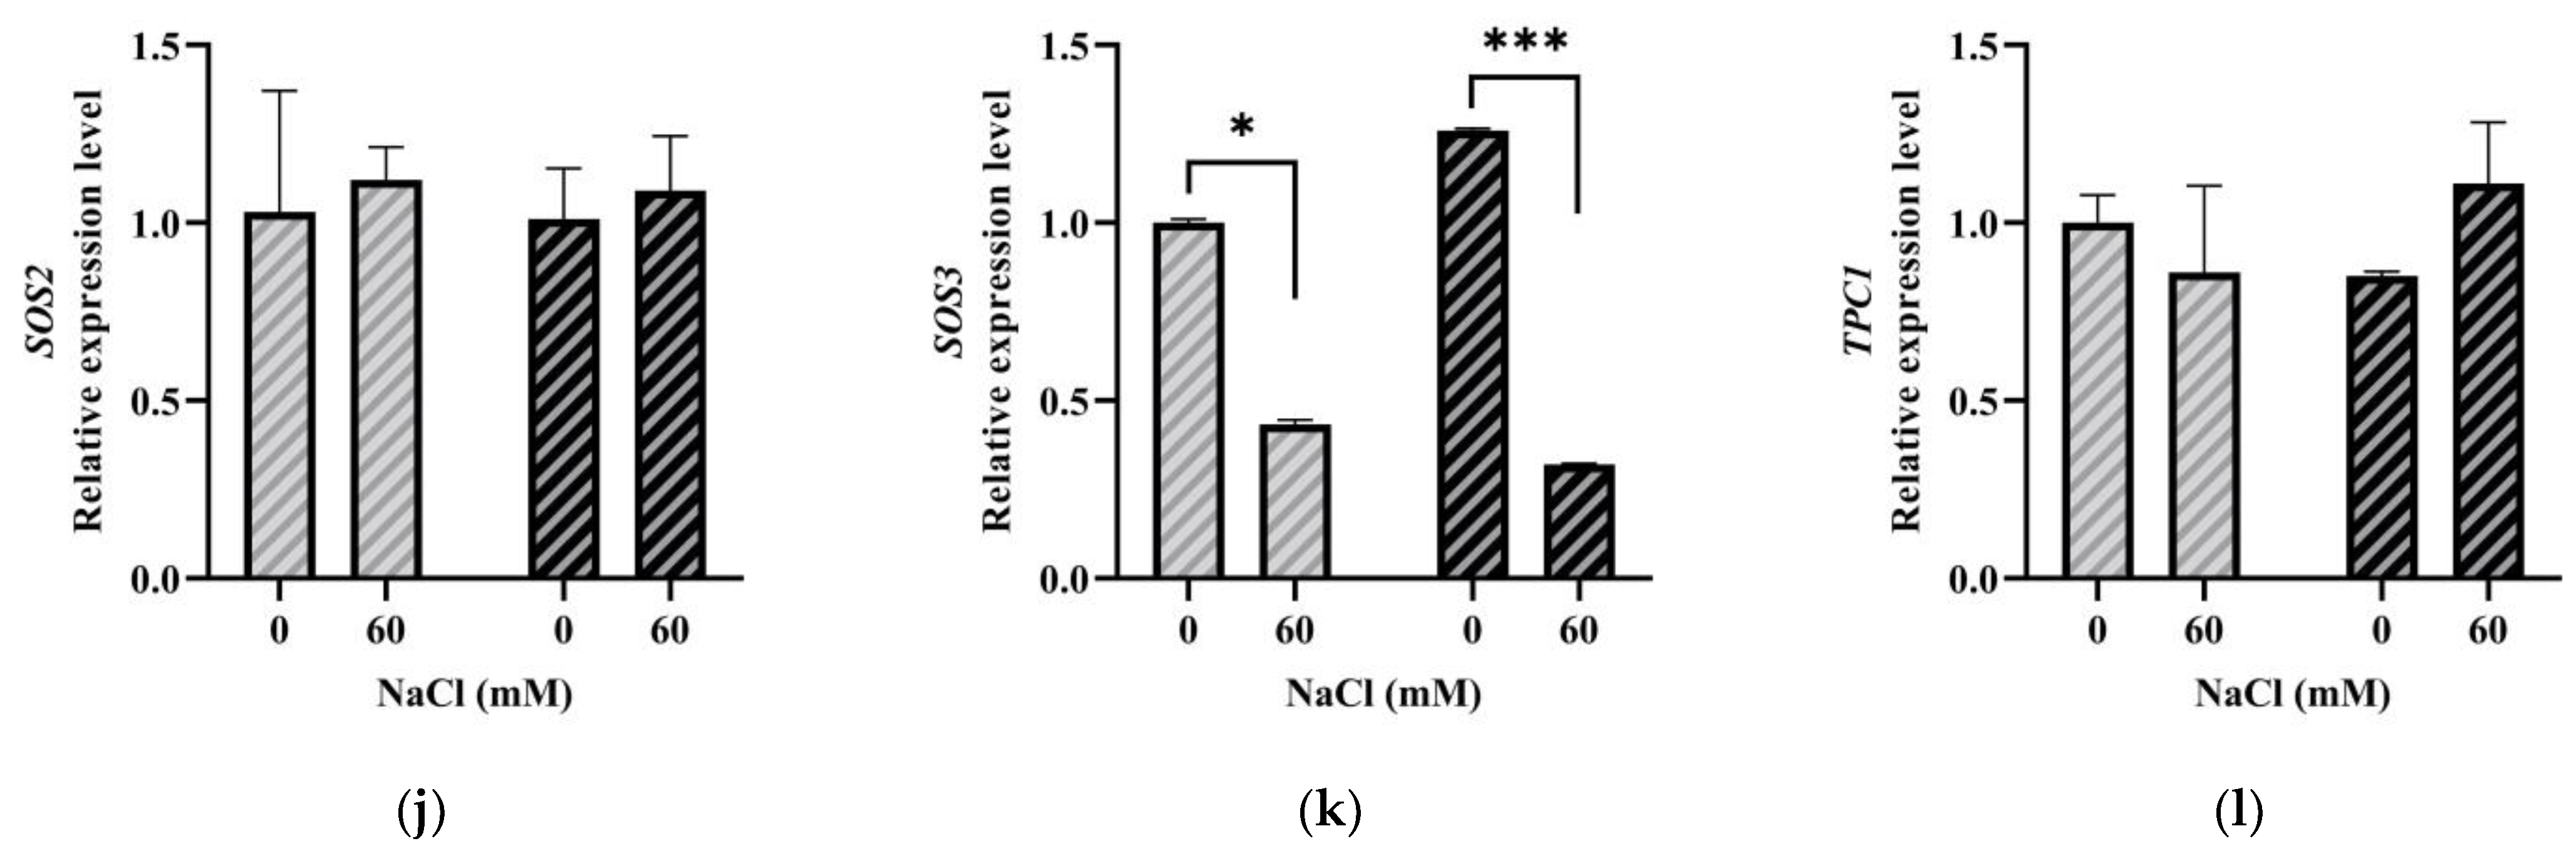
2.6. LeGRXS14 Is Related to Plant Resistance to Salt Stress

To gain insight into the molecular responses of LeGRXS14 to salt stress, various molecular markers were used to examine the relationship between LeGRXS14 and other molecular elements of plant salt resistance (Table S2). Quantitative RT-PCR was conducted to verify the gene expression patterns in A. thaliana under salt stress. We found that the transcriptional abundance of the salt stress response gene SOS3 in the OE seedlings was significantly decreased under salt stress (Figure 6k), and the same was observed with the ROS-related factors RBOHD and ZAT12 (Figure 6b,h). The results showed that the overexpression of LeGRXS14 in A. thaliana decreased the expression of salt stress response genes and ROS-related factor genes. In addition, we detected several changes in the transcription levels of salt stress-related genes such as HKT1 (Figure 6c), NHX1 (Figure 6d), and NHX6 (Figure 6g), and the mRNA levels of these were downregulated. These findings suggested that LeGRXS14 affects resistance to salt stress by inhibiting signaling pathways under salt stress.

3. Discussion

GRXs were first discovered by Holmgren in the TRX gene deletion of E. coli [7]. They are a class of sulfhydryl-disulfide bond oxidoreductases ubiquitous in prokaryotes and eukaryotes and have a disulfhydryl catalytic center that can control the redox state of target protein activities [19]. CGFS-type GRXs are involved in iron–sulfur cluster assembly, which is required for plant responses to environmental stimuli [5]. The function of CGFS-type GRXs in the response of plants to biotic and abiotic stress has been revealed in earlier studies. It was previously shown that transgenic rice constitutively expressing OsGRXS15 exhibited enhanced disease resistance to the pathogens Xanthomonas oryzae pv. oryzae and Fusarium fujikuroi [20]. The protein AtGRXS17 plays a specific role in enabling plants to tolerate moderately high temperatures, and its overexpression demonstrated a protective effect on root meristematic cells by preventing cell death caused by heat stress [21]. The CRISPR/Cas9-based knockout tomato mutant legrxs16 showed reduced drought resistance compared with the WT, while the overexpression of LeGRXS16 in soil-grown A. thaliana enhanced resistance to oxidative, drought, and salt stresses [22]. Similarly, legrxs14 displayed a higher degree of susceptibility to drought stress than the WT [18].
As ROS-scavenging network components, CGFS-type GRXs have been identified as being involved in plant resistance to a range of biotic and abiotic stresses. As indicated in the phylogenetic analysis, tomato proteins, including LeGRXS14/15/16/17 and CGFS-type GRX proteins of other species, are clustered into four groups. The differences between these four groups suggest that these proteins underwent significant genetic variation following divergent evolution (Figure 1a). We also found that the N-terminus of GRXS14 is highly and structurally conserved (Figure 2a). It has been reported that the N-terminal active site cysteine residue is crucial for homodimer binding [23]. LeGRXS14 shares a high degree of similarity with GRXs in C. annuum, O. sativa, and Z. mays (Figure 2b). It was found that CC-type OsGRX8 conferred decreased sensitivity to hormone stress in A. thaliana [6], CPYC-type OsGRX20 conferred increased tolerance to multiple stresses in rice [24], and ZmGRXCC14 was found to have a correlation with drought stress during the seedling stage [25], suggesting that LeGRXS14 may also play an important role in plant resistance to various stresses. The function of these genes under biotic and abiotic stresses should be further explored in the future.
We found that the expression of LeGRXS14 was apparent within the leaf (Figure 3a), and the protein was located on the plasma membrane, nucleus, and chloroplasts (Figure S3 and Figure 4). The LeGRXS14 gene responded to osmotic stress in 30 min, which was faster than the response to salt stress (Figure 3c,d). A previous study showed an increase in drought resistance in the CRISPR-cas9 mutant legrxs14 [18], and we confirmed that OE seedlings showed reduced salinity resistance (Figure 5a). From this, we speculated that LeGRXS14 is indeed related to salt stress; however, we did not detect any significant difference between the WT and OE lines under osmotic stress (Figure S2). Under conditions of low Ca2+, the overexpression of LeGRXS14 in A. thaliana plants reduced plant resistance to salt stress (Figure 5). We presumed that LeGRXS14 plays a vital role in the salt stress response, possibly by acting as a negative regulatory factor in salinity resistance, especially in Na+ effects. This may be related to the calcium signaling pathway under salt stress. However, the molecular mechanism of the salt stress response of LeGRXS14 remains unclear.
The salinity resistance markers SOS1, SOS2, SOS3, ZAT12, RBOHD, NHX1, NHX2, NHX5, and NHX6 participate in the process of plant salinity resistance [26,27,28,29]. We found that the mRNA levels exhibited obvious changes among these gene markers in the OE lines (Figure 6), particularly SOS3, ZAT12, and NHXs, for which the gene transcription levels were decreased. SOS1, SOS2, and SOS3 encode regulatory components controlling plant Na+/H+-exchange activity under salt tolerance, and SOS3 activates and directs SOS2 to the plasma membrane for the stimulatory phosphorylation of the Na+ transporter SOS1 [30,31]. Thus, the inhibition of SOS3 affects the phosphorylation of SOS1 and impairs plant Na+/H+-exchange activity (Figure 6k). Studies have suggested that NHX exchangers are involved in vacuolar Na+ sequestration under salt stress [32,33], and decreased NHX1 and NHX6 affect Na+ sequestration in the vacuole (Figure 6d,g). External NaCl treatments cause the Na+ content to increase in cells, but the exclusion of Na+ becomes impaired, leading to Na+ accumulation in the cells and ionic toxicity. Salt stress triggers secondary oxidative stress, and previous research has demonstrated that ZAT12 expression is activated at the transcriptional level during different abiotic stresses [34]. Furthermore, ZAT12 was thought to be involved in oxidative stress signaling as a negative regulator of Fe acquisition in A. thaliana [35]. PeZAT12 can regulate the expression of PeAPX2, thereby scavenging ROS under salt stress in poplar [36]. This may explain why the OE lines were more salt-sensitive than the WT.
In summary, LeGRXS14 may act as a negative regulatory factor for plant resistance to salt stress by suppressing vital genes such as SOS3 and NHXs that are crucial for salt stress tolerance, leading to the accumulation of Na+ in plant cells. Moreover, LeGRXS14 overexpression results in the inhibition of ZAT12, which impedes the elimination of reactive oxygen species (ROS) during salt stress. As a consequence, LeGRXS14 negatively influences the salt stress-related genes in A. thaliana, reducing the plant’s ability to cope with salt stress. In conclusion, the tomato gene LeGRXS14 reduces salt stress tolerance in A. thaliana.

4. Materials and Methods

4.1. Plant Materials and Growth Conditions

Arabidopsis thaliana seeds underwent sterilization by means of 2.5% PPM (Plant Preservative Mixture; Caisson Labs) for a duration of 3 days at 4 °C. Subsequently, the seeds were placed in 150 mm × 15 mm Petri dishes containing a culture medium comprised of 1/2 Murashige and Skoog salts (MS; Sigma, St. Louis, MO, USA), 1.5% (w/v) sucrose (Sigma), and 0.6% (w/v) agar (Sigma) in a pH 5.9 environment. The plants were subjected to growth conditions of ∼110 µmol m−2 s−1 white light as the photo fluency rate and 16 h of light and 8 h of darkness per day as the photoperiods, while being kept at a consistent temperature of 22 ± 2 °C.
Tomato seeds (‘Micro-Tom’) were sterilized using a combination of 70% ethyl alcohol and 4.5% sodium hypochlorite before being cultivated in Petri dishes. After seven days of growth in an MS medium, the seeds were then transferred to soil, where they continued to be cultivated under controlled conditions. Maintenance of the environmental rooms saw a consistent temperature of 25 ± 2 °C, with a photo fluency rate of white light of approximately ∼110 µmol m−2 s−1, and the photoperiod included 16 h light/8 h dark cycles. Four-leafed tomato seedlings were treated with drought stress [20% polyethylene glycol (PEG) 6000], salt stress (100 mmol·L–1 NaCl), heat stress (40 °C), and chilling stress (14 °C). The sampling time points were 0, 10, 20, and 30 min, and 1, 2, 3, 6, 12, and 24 h after the start of the stress treatment. Following treatment, plants were snap-frozen in liquid nitrogen and refrigerated at –80 °C.

4.2. DNA Constructs and Transgenic Lines

The LeGRXS14 accession numbers for the Solyc02g082200.3 full-length complementary region were obtained from tomato genomes (https://plants.ensembl.org/index.html, accessed on 5 January 2017). The method of Gateway cloning was employed for the construction of p35S::GRXS14 and p35S::GRXS14-GFP. PCR amplification of DNA fragments was carried out from cDNA, followed by cloning into the pENTR vector (Invitrogen). Subsequently, coding sequences from the entry clones were transferred to gateway-compatible destination vectors. The generation of transgenic A. thaliana plants was established through Agrobacterium-mediated transformation using homozygous transgenic T3 lines that contained a single insertion.

4.3. PCR Primers and Vectors

Cloning primers: GRXS14-cDNA_Fw, 5′-ATGTCGCTCGGAATTTCGC;
GRXS14-cDNA_Rev, 5′-TCAGGAGCACAATGTCCT, GRXS14-cDNA (no stop code) _Rev, 5′-GGAGCACAATGTCCTTTCT; vectors: p35S::GRXS14:pGWB402Ω, p35S::GRXS14-GFP:pGWB405.

4.4. RNA Extraction and qRT-PCR

RNA extraction was completed with a Total RNA Kit (Tiangen, Tianjin, China), with 100 mg of each section handled separately. Subsequently, 1 microgram of RNA was used for reverse transcription, followed by the use of the FastKing RT Kit (Tiangen) for cDNA synthesis. The quantitative real-time (qRT) PCR reaction was performed with the Real Universal Color PreMix (Tiangen) and involved an eight-well optical PCR plate for each reaction. Each reaction comprised 7.5 µL premix, 0.75 µL forward primer, 0.75 µL reverse primer, and 6 µL cDNA template. A set of PCR cycle parameters was initiated, which included one cycle of 30 s at 95 °C and 40 cycles of 10 s at 95 °C and 30 s at 60 °C. To ensure that gene expression levels were normalized, actin was utilized as an internal control. Supplementary Table S2 lists the primers used in this study. A melting curve was created after the 40 cycles to confirm that only one amplified product was obtained. For statistical analysis, the standard t-test was used.

4.5. GFP Subcellular Localization Analysis

To investigate GRXS14-GFP in Arabidopsis seedlings, we generated transgenic plants with 35S promoter-driven GRXS14 (p35S::GRXS14-GFP, full-length complementary DNA). To carry out confocal imaging, seven-day-old seedlings grown on ½ MS medium in Petri dishes were studied using a Zeiss LSM 710 microscope. Blue excitation (typically 488 nm) was used for the excitation of GFP. For confocal imaging, a ×20 water immersion objective was used. Our examination included more than 10 independent lines, and we induced plasmolysis using 0.8 M sorbitol. Protoplasts were generated through the enzymatic digestion of plant material using a solution consisting of 20 mM MES (pH 5.7), 1.5% cellulase R-10, 0.4% macerozyme R-10, 0.4 M mannitol, 20 mM KCl, 10 mM CaCl2, 0.1% BSA, and during the incubation process.
To study the localization of proteins in the cell, Agrobacterium tumefaciens-mediated transient expression in N. benthamiana was used to detect the co-localization of LeGRXS14 with a plasma membrane marker (mCherry-plasma membrane) and a nucleus marker (mCherry-Nucleus) [37]. Briefly, we prepared Luria-Bertani (LB) liquid medium with the appropriate antibiotic mixture for overnight incubation of Agrobacterium tumefaciens GV3101 transformed with the target gene and silencing suppressor strain 19K at 28 °C, collected the cultures, and resuspended them with transformation solution (10 mM MES/KOH (pH 5.6), 10 Mm MgCl2, and 150 μM acetosyringone), so that the OD600 was adjusted by 0.5. We mixed equal volumes of 19K, LeGRXS14-GFP, and markers separately and left this for 3 h before injecting it into one-month-old tobacco leaves. A Zeiss LSM 710 microscope was used to observe the co-localization. For confocal imaging, a ×20 water immersion objective was used. The excitation and emission wavelengths of the GFP signal were 488 nm and 493–570 nm; for the mCherry signal, they were 561 nm and 600–650 nm for the chlorophyll autofluorescence, they were 488 nm and 650–700 nm.

4.6. Growth Responses to Salt Stress

For the plant physiology assay, we sterilized WT and OE seeds with PPM and maintained them in darkness at 4 °C for three days. Immediately after this period, the seeds were placed in a low-calcium (0.2 mM CaCl2) ½ MS agar medium, with or without 60 mM NaCl. The ½ MS agar medium comprised the vital components of major salts (NH4NO3, MgSO4, KH2PO4, and KNO3; Sigma), a vitamin solution (Sigma), 0.5% sucrose (Sigma), and 0.6% agar (Sigma), with the calcium content increased to 0.2 mM CaCl2. Following a growth period of 12 days, we evaluated the seedling root lengths as part of our analysis.
The seeds were also placed in a normal-calcium (2.5 mM CaCl2) ½ MS agar medium, with or without 60 mM NaCl. Following a growth period of 8 days, we evaluated seedling root lengths as part of our analysis.

Supplementary Materials

The following supporting information can be downloaded at: https://www.mdpi.com/2223-7747/12/12/2320/s1, Figure S1: Phenotypic analyses of OE and WT in response to Salt stress; Table S1: Gene ID used in this paper. Figure S2: Phenotypic analyses of OE and WT in response to osmotic stress; Table S2: Primers used in this paper. Figure S3: Subcellular localization of LeGRXS14 proteins; Table S3: Lengths and preserved sequences of motifs in GRXS14.

Author Contributions

Conceptualization, X.L. (Xunyan Liu) and L.L.; methodology, L.L.; software, X.L. (Xiaofei Li).; validation, L.L., X.L. (Xunyan Liu), M.S. and Q.Z.; formal analysis, L.L.; investigation, J.S.; resources, X.L. (Xunyan Liu); data curation, L.L., X.L. (Xiaofei Li) and M.S.; writing—original draft preparation, L.L.; writing—review and editing, X.L. (Xunyan Liu); visualization, L.L.; supervision, X.L. (Xunyan Liu); project administration, M.S.; funding acquisition, X.L. (Xunyan Liu). All authors have read and agreed to the published version of the manuscript.

Funding

This research was funded by the Zhejiang Major Scientific and Technological Project of Agricultural (Upland crop) Breeding, grant number 2021C02064-6, and the Zhejiang Province Public Welfare Technology Application Research Project, grant number LGN18C020005.

Data Availability Statement

Not applicable.

Acknowledgments

We thank https://www.mdpi.com/authors/english (accessed on 11 May 2023) for its linguistic assistance during the preparation of this manuscript.

Conflicts of Interest

The authors declare no conflict of interest.

References

  1. Najla, S.; Vercambre, G.; Pagès, L.; Grasselly, D.; Gautier, H.; Genard, M. Effect of Salinity on Tomato Plant Architecture. Acta Hortic. 2008, 801, 1183–1190. [Google Scholar] [CrossRef]
  2. van Zelm, E.; Zhang, Y.; Testerink, C. Salt tolerance mechanisms of plants. Annu. Rev. Plant Biol. 2020, 71, 403–433. [Google Scholar] [CrossRef]
  3. Lennicke, C.; Cochemé, H.M. Redox metabolism: ROS as specific molecular regulators of cell signaling and function. Mol. Cell 2021, 81, 3691–3707. [Google Scholar] [CrossRef]
  4. Dvořák, P.; Krasylenko, Y.; Zeiner, A.; Šamaj, J.; Takáč, T. Signaling Toward Reactive Oxygen Species-Scavenging Enzymes in Plants. Front. Plant Sci. 2020, 11, 618835. [Google Scholar] [CrossRef] [PubMed]
  5. Rouhier, N. Plant glutaredoxins: Pivotal players in redox biology and iron-sulphur centre assembly. New Phytol. 2010, 186, 365–372. [Google Scholar] [CrossRef]
  6. Sharma, R.; Priya, P.; Jain, M. Modified expression of an auxin-responsive rice CC-type glutaredoxin gene affects multiple abiotic stress responses. Planta 2013, 238, 871–884. [Google Scholar] [CrossRef] [PubMed]
  7. Holmgren, A. Hydrogen donor system for Escherichia coli ribonucleoside-diphosphate reductase dependent upon glutathione. Proc. Natl. Acad. Sci. USA 1976, 73, 2275–2279. [Google Scholar] [CrossRef]
  8. Ogata, F.T.; Branco, V.; Vale, F.F.; Coppo, L. Glutaredoxin: Discovery, redox defense and much more. Redox Biol. 2021, 43, 101975. [Google Scholar] [CrossRef]
  9. Sturlese, M.; Manta, B.; Bertarello, A.; Bonilla, M.; Lelli, M.; Zambelli, B.; Grunberg, K.; Mammi, S.; Comini, M.A.; Bellanda, M. The lineage-specific, intrinsically disordered N-terminal extension of monothiol glutaredoxin 1 from trypanosomes contains a regulatory region. Sci. Rep. 2018, 8, 13716. [Google Scholar] [CrossRef]
  10. Rouhier, N.; Lemaire, S.D.; Jacquot, J.P. The role of glutathione in photosynthetic organisms: Emerging functions for glutaredoxins and glutathionylation. Annu. Rev. Plant Biol. 2008, 59, 143–166. [Google Scholar] [CrossRef]
  11. Meyer, Y.; Buchanan, B.B.; Vignols, F.; Reichheld, J.P. Thioredoxins and Glutaredoxins: Unifying Elements in Redox Biology. Annu. Rev. Genet. 2009, 43, 335–367. [Google Scholar] [CrossRef] [PubMed]
  12. Mittler, R.; Zandalinas, S.I. Reactive oxygen species signalling in plant stress responses. Nat. Rev. Mol. Cell Biol. 2022, 23, 663–679. [Google Scholar] [CrossRef]
  13. Rouhier, N.; Villarejo, A.; Srivastava, M.; Gelhaye, E.; Keech, O.; Droux, M.; Finkemeier, I.; Samuelsson, G.; Dietz, K.J.; Jacquot, J.P.; et al. Identification of plant glutaredoxin targets. Antioxid. Redox Signal. 2005, 7, 919–929. [Google Scholar] [CrossRef]
  14. Rouhier, N.; Gelhaye, E.; Jacquot, J.P. Plant glutaredoxins: Still mysterious reducing systems. Cell. Mol. Life Sci. 2004, 61, 1266–1277. [Google Scholar] [CrossRef]
  15. Meyer, Y.; Belin, C.; Delorme-Hinoux, V.; Reichheld, J.P.; Riondet, C. Thioredoxin and glutaredoxin systems in plants: Molecular mechanisms, crosstalks, and functional significance. Antioxid. Redox Signal. 2012, 17, 1124–1160. [Google Scholar] [CrossRef]
  16. Lillig, C.H.; Berndt, C. Glutaredoxins in Thiol/Disulfide Exchange. Antioxid. Redox Signal. 2013, 18, 1654–1665. [Google Scholar] [CrossRef] [PubMed]
  17. Gutsche, N.; Thurow, C.; Zachgo, S.; Gatz, C. Plant-specific CC-type glutaredoxins: Functions in developmental processes and stress responses. Biol. Chem. 2015, 396, 495–509. [Google Scholar] [CrossRef]
  18. Kakeshpour, T.; Tamang, T.M.; Motolai, G.; Fleming, Z.W.; Park, J.-E.; Wu, Q.; Park, S. CGFS-type glutaredoxin mutations reduce tolerance to multiple abiotic stresses in tomato. Physiol. Plant 2021, 173, 1263–1279. [Google Scholar] [CrossRef] [PubMed]
  19. Picciocchi, A.; Saguez, C.; Boussac, A.; Cassier-Chauvat, C.; Chauvat, F. CGFS-Type Monothiol Glutaredoxins from the Cyanobacterium Synechocystis PCC6803 and Other Evolutionary Distant Model Organisms Possess a Glutathione-Ligated [2Fe-2S] Cluster. Biochemistry 2007, 46, 15018–15026. [Google Scholar] [CrossRef]
  20. Son, S.; Kim, H.; Lee, K.S.; Kim, S.; Park, S.R. Rice glutaredoxin GRXS15 confers broad-spectrum resistance to Xanthomonas oryzae pv. oryzae and Fusarium fujikuroi. Biochem. Biophys. Res. Commun. 2020, 533, 1385–1392. [Google Scholar] [CrossRef]
  21. Martins, L.; Knuesting, J.; Bariat, L.; Dard, A.; Freibert, S.A.; Marchand, C.H.; Young, D.; Dung, N.H.T.; Voth, W.; Debures, A.; et al. Redox Modification of the Iron-Sulfur Glutaredoxin GRXS17 Activates Holdase Activity and Protects Plants from Heat Stress. Plant Physiol. 2020, 184, 676–692. [Google Scholar] [CrossRef]
  22. Guo, Y.; Huang, C.; Xie, Y.; Song, F.; Zhou, X. A tomato glutaredoxin gene SlGRX1 regulates plant responses to oxidative, drought and salt stresses. Planta 2010, 232, 1499–1509. [Google Scholar] [CrossRef]
  23. Zaffagnini, M.; Michelet, L.; Massot, V.; Trost, P.; Lemaire, S.D. Biochemical Characterization of Glutaredoxins from Chlamydomonas reinhardtii Reveals the Unique Properties of a Chloroplastic CGFS-type Glutaredoxin*. J. Biol. Chem. 2008, 283, 8868–8876. [Google Scholar] [CrossRef]
  24. Ning, X.; Sun, Y.; Wang, C.; Zhang, W.; Sun, M.; Hu, H.; Liu, J.; Yang, L. A Rice CPYC-Type Glutaredoxin OsGRX20 in Protection against Bacterial Blight, Methyl Viologen and Salt Stresses. Front. Plant Sci. 2018, 9, 111. [Google Scholar] [CrossRef]
  25. Ding, S.; He, F.; Tang, W.; Du, H.; Wang, H. Identification of Maize CC-Type Glutaredoxins That Are Associated with Response to Drought Stress. Genes 2019, 10, 610. [Google Scholar] [CrossRef]
  26. Gupta, B.; Huang, B. Mechanism of salinity tolerance in plants: Physiological, biochemical, and molecular characterization. Int. J. Genom. 2014, 2014, 701596. [Google Scholar] [CrossRef] [PubMed]
  27. Maathuis, F.J.M. Sodium in plants: Perception, signalling, and regulation of sodium fluxes. J. Exp. Bot. 2013, 65, 849–858. [Google Scholar] [CrossRef]
  28. Munns, R.; Tester, M. Mechanisms of Salinity Tolerance. Annu. Rev. Plant Biol. 2008, 59, 651–681. [Google Scholar] [CrossRef] [PubMed]
  29. Shams, M.; Khadivi, A. Mechanisms of salinity tolerance and their possible application in the breeding of vegetables. BMC Plant Biol. 2023, 23, 139. [Google Scholar] [CrossRef] [PubMed]
  30. Liu, J.P.; Zhu, J.K. A calcium sensor homolog required for plant salt tolerance. Science 1998, 280, 1943–1945. [Google Scholar] [CrossRef]
  31. Qiu, Q.S.; Guo, Y.; Dietrich, M.A.; Schumaker, K.S.; Zhu, J.K. Regulation of SOS1, a plasma membrane Na+/H+ exchanger in Arabidopsis thaliana, by SOS2 and SOS3. Proc. Natl. Acad. Sci. USA 2002, 99, 8436–8441. [Google Scholar] [CrossRef]
  32. Bassil, E.; Blumwald, E. The ins and outs of intracellular ion homeostasis: NHX-type cation/ H+ transporters. Curr. Opin. Plant Biol. 2014, 22, 1–6. [Google Scholar] [CrossRef] [PubMed]
  33. Bassil, E.; Coku, A.; Blumwald, E. Cellular ion homeostasis: Emerging roles of intracellular NHX Na+/H+ antiporters in plant growth and development. J. Exp. Bot. 2012, 63, 5727–5740. [Google Scholar] [CrossRef] [PubMed]
  34. Davletova, S.; Schlauch, K.; Coutu, J.; Mittler, R. The zinc-finger protein Zat12 plays a central role in reactive oxygen and abiotic stress signaling in Arabidopsis. Plant Physiol. 2005, 139, 847–856. [Google Scholar] [CrossRef] [PubMed]
  35. Le, C.T.; Brumbarova, T.; Ivanov, R.; Stoof, C.; Weber, E.; Mohrbacher, J.; Fink-Straube, C.; Bauer, P. ZINC FINGER OF ARABIDOPSIS THALIANA12 (ZAT12) Interacts with FER-LIKE IRON DEFICIENCY-INDUCED TRANSCRIPTION FACTOR (FIT) Linking Iron Deficiency and Oxidative Stress Responses. Plant Physiol. 2016, 170, 540–557. [Google Scholar] [CrossRef] [PubMed]
  36. He, F.; Niu, M.X.; Feng, C.H.; Li, H.G.; Su, Y.; Su, W.L.; Pang, H.; Yang, Y.; Yu, X.; Wang, H.L.; et al. PeSTZ1 confers salt stress tolerance by scavenging the accumulation of ROS through regulating the expression of PeZAT12 and PeAPX2 in Populus. Tree Physiol. 2020, 40, 1292–1311. [Google Scholar] [CrossRef] [PubMed]
  37. Sun, Z.; Zhang, S.; Xie, L.; Zhu, Q.; Tan, Z.; Bian, J.; Sun, L.; Chen, J. The secretory pathway and the actomyosin motility system are required for plasmodesmatal localization of the P7-1 of rice black-streaked dwarf virus. Arch. Virol. 2013, 158, 1055–1064. [Google Scholar] [CrossRef]
Figure 1. Schemes follow another format. If there are multiple panels, they should be listed as Phylogenetic analysis and chromosomal distribution of CGFS-type GRX proteins: (a) The full-length amino acid sequences of CGFS-type GRX proteins were aligned by Clustal W, and the phylogenetic tree was built using the neighbor-joining (NJ) method in MEGA (v11.0). The grouping of the GRX proteins is indicated by different colors, with LeGRXS14 marked in purple. The proteins are abbreviated as follows: A. thaliana, AtGRXSx; B. napus, BnGRXSx; C. annuum, CaGRXSx; C. lanatus, ClGRXSx; C. sativus, CsGRXSx; G. max, GmGRXSx; O. sativa, OsGRXSx; L. esculentum, LeGRXSx; and Z. mays, ZmGRXSx. Supplemental Table S1 lists the gene IDs. (b) Chromosomal distribution map of CGFS-type GRXs on tomato chromosomes.
Plants 12 02320 g001
Figure 2. Alignment and motif analysis of LeGRXS14 and its homologous protein sequences: (a) Alignment of the tomato protein LeGRXS14 and its homologous protein sequences; (b) phylogenetic relationships and conserved motifs of LeGRXS14 and its homologous protein sequences in A. thaliana, B. napus, C. annuum, C. lanatus, C. sativus, G. max, O. sativa, L. esculentum, and Z. mays. Amino acids that are conserved throughout are shaded in different colors. Each motif is represented by a number in a colored box.
Plants 12 02320 g002
Figure 3. Expression patterns of LeGRXS14 in tomatoes: (a) The expression of LeGRXS14 in different organs was analyzed using quantitative RT-PCR. Transcripts of LeGRXS14 accumulate in different organs. The root (Rt) expression data were normalized to 1 and used as a reference to determine the relative LeGRXS14 expression levels in all other organs. The data are the means ± SD of three independent experiments. Gf-green fruit; F-flower; L-leaf; St-stem; Rt-root; (b) heatmap of LeGRXS14 expression in response to heat, salt, and osmotic stress; (c) statistical analysis of LeGRXS14 expression in response to osmotic stress; (d) statistical analysis of LeGRXS14 expression under salt stress; (e) statistical analysis of LeGRXS14 expression under heat stress; (f) statistical analysis of LeGRXS14 expression under cold stress. Quantitative RT-PCR analysis of LeGRXS14 transcripts in one-month-old seedlings treated with heat, salt, and osmotic stress. The data in the figure are the mean ± SD (n = 4); *** p < 0.001.
Plants 12 02320 g003
Figure 4. Subcellular localization of LeGRXS14 proteins: (a) Subcellular localization of LeGRXS14-GFP and mCherry-plasma membrane in tobacco. (b) Subcellular localization of LeGRXS14-GFP and mCherry-nucleus in tobacco. Green shows GFP signals, and red shows mCherry signals. Bars = 20 µm.
Plants 12 02320 g004
Figure 5. Phenotypic analyses of WT and OE lines under salt stress: (a) The WT and OE lines were cultured for a 12-day period on media with or without 60 mM NaCl. (b) The quantified data presented in the figure depicts the root length of the WT and OE seedlings. The data displayed in the figure are presented as the mean ± SD (n = 8); *** p < 0.001.
Plants 12 02320 g005
Figure 6. Expression patterns of salt stress-related molecular markers and genes in A. thaliana: (a) Heatmap expression analysis of molecular marker genes in response to salt stress by qRT-PCR. (b) Statistical analysis of ZAT12 expression in WT and OE under salt stress. (c) Statistical analysis of HKT1 expression in WT and OE under salt stress. (d) Statistical analysis of NHX1 expression in WT and OE under salt stress. (e) Statistical analysis of NHX2 expression in WT and OE under salt stress. (f) Statistical analysis of NHX5 expression in WT and OE under salt stress. (g) Statistical analysis of NHX6 expression in WT and OE under salt stress. (h) Statistical analysis of RBOHD expression in WT and OE under salt stress. (i) Statistical analysis of SOS1 expression of WT and OE under salt stress. (j) Statistical analysis of SOS2 expression in WT and OE under salt stress. (k) Statistical analysis of SOS3 expression in WT and OE under salt stress. (l) Statistical analysis of TPC1 expression in WT and OE under salt stress. Quantitative RT-PCR analysis of LeGRXS14 transcription in 10-day-old seedlings subjected to 60 mM NaCl treatment. The data displayed in the figure are presented as the mean ± SD (n = 4); * p < 0.05, ** p < 0.01, *** p < 0.001.
Plants 12 02320 g006aPlants 12 02320 g006b
Disclaimer/Publisher’s Note: The statements, opinions and data contained in all publications are solely those of the individual author(s) and contributor(s) and not of MDPI and/or the editor(s). MDPI and/or the editor(s) disclaim responsibility for any injury to people or property resulting from any ideas, methods, instructions or products referred to in the content.

