2.1. Identification of Isolated Vescalin, Castalin, Vescalagin and Castalagin
In order to understand which compounds contribute to the antimicrobial activity of chestnut extract, the individual compounds were first isolated from the crude extract. The description of the isolation procedure and the characterization of vescalagin and castalagin was provided in our previous study [
6], and only the most important information is described here. The vescalagin and castalagin used in this study had chromatographic purities of 97.0% and 95.9%, respectively.
The structures of isolated vescalin and castalin were confirmed by a combination of methods. The HPLC retention time was compared to the retention time of the standard, and the chromatograms of castalin and vescalin are provided in
Supplementary Material Figures S1 and S2, respectively. The structure of both compounds was further confirmed by LC–MS/MS and NMR spectroscopy techniques.
The chromatographic purities of isolated vescalin and castalin were 94.0% and 93.0%, respectively. Vescalin:
1H NMR (300 MHz, D2O) δ 6.90 (s, 1H); 5.43 (s, 1H); 5.13 (m, 1H); 4,86 (d, 1H, J = 1.68 Hz); 4.57 (d, 1H, J = 6.80 Hz); 4.06 (m, 1H); 3.94 (m, 2H). Castalin:
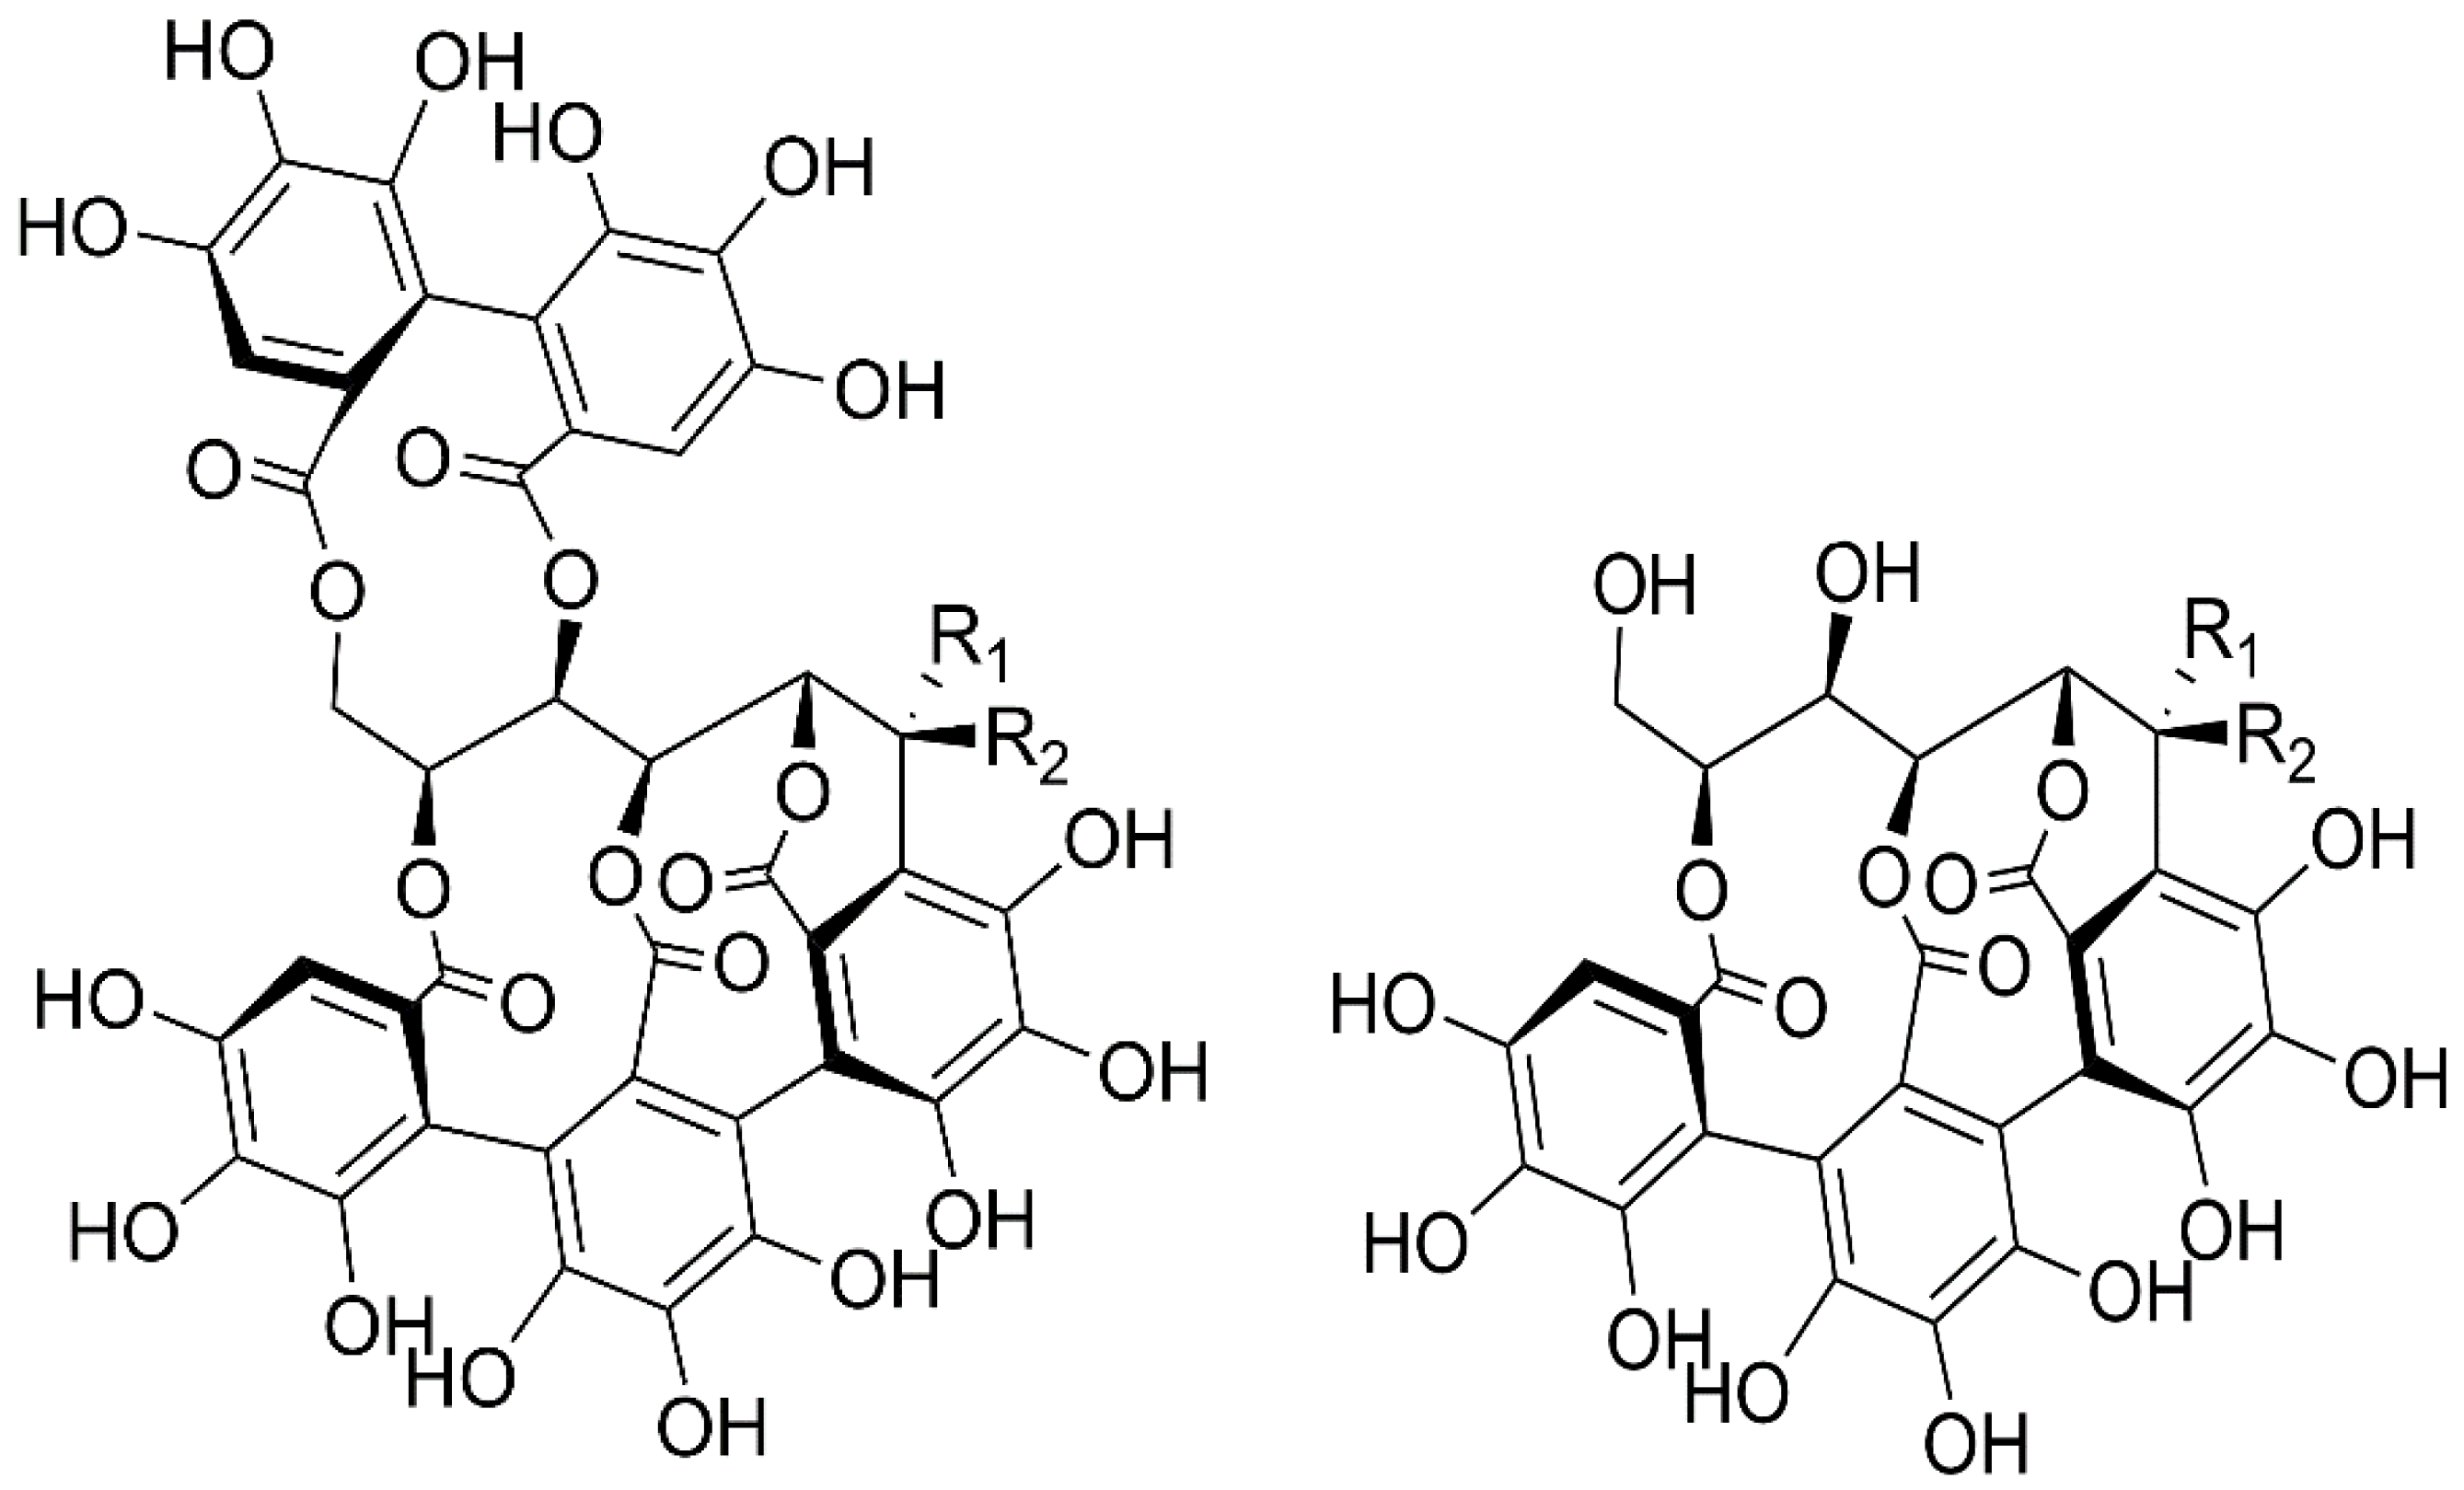
1H NMR [300 MHz, D2O] δ 6.90 (s, 1H); 5.70 (d, 1H, J = 4.10 Hz); 5.24 (d, 1H, J = 4 Hz); 5.14 (m, 1H); 5.00 (d, 1H, J = 6.70 Hz); 4.08 (t, 1H, J = 7.40 Hz); 3.94 (m, 2H). Structures of vescalin, castalin, vescalagin, and castalagin are depicted in
Figure 1.
2.2. Variation of the Growth Medium Strength and Its Influence on MIC
In this study, the influence of the bacterial growth medium strength on the minimum inhibitory concentration (MIC) of tannins against Gram-positive S. aureus was determined. This was performed in order to gain insight into the importance of the interactions of tannins with the growth medium for their antibacterial activity. The nutrient content in the growth medium varied from half to one and a half of the concentration recommended by the producer.
The influence of growth medium strength on the MIC of tannins against Gram-negative bacteria
E. coli was investigated previously [
6], and a pronounced dependence of the MIC values on growth medium strength was observed. It was found that the rise in MIC values of all samples was approximately linear when the concentration of medium was increased, indicating that a direct interaction of tannins with the nutrients of the growth medium represents a likely source of their antimicrobial activity. Tannins have already been shown to chelate metal ions [
32].
The effect of the growth medium strength on Gram-positive
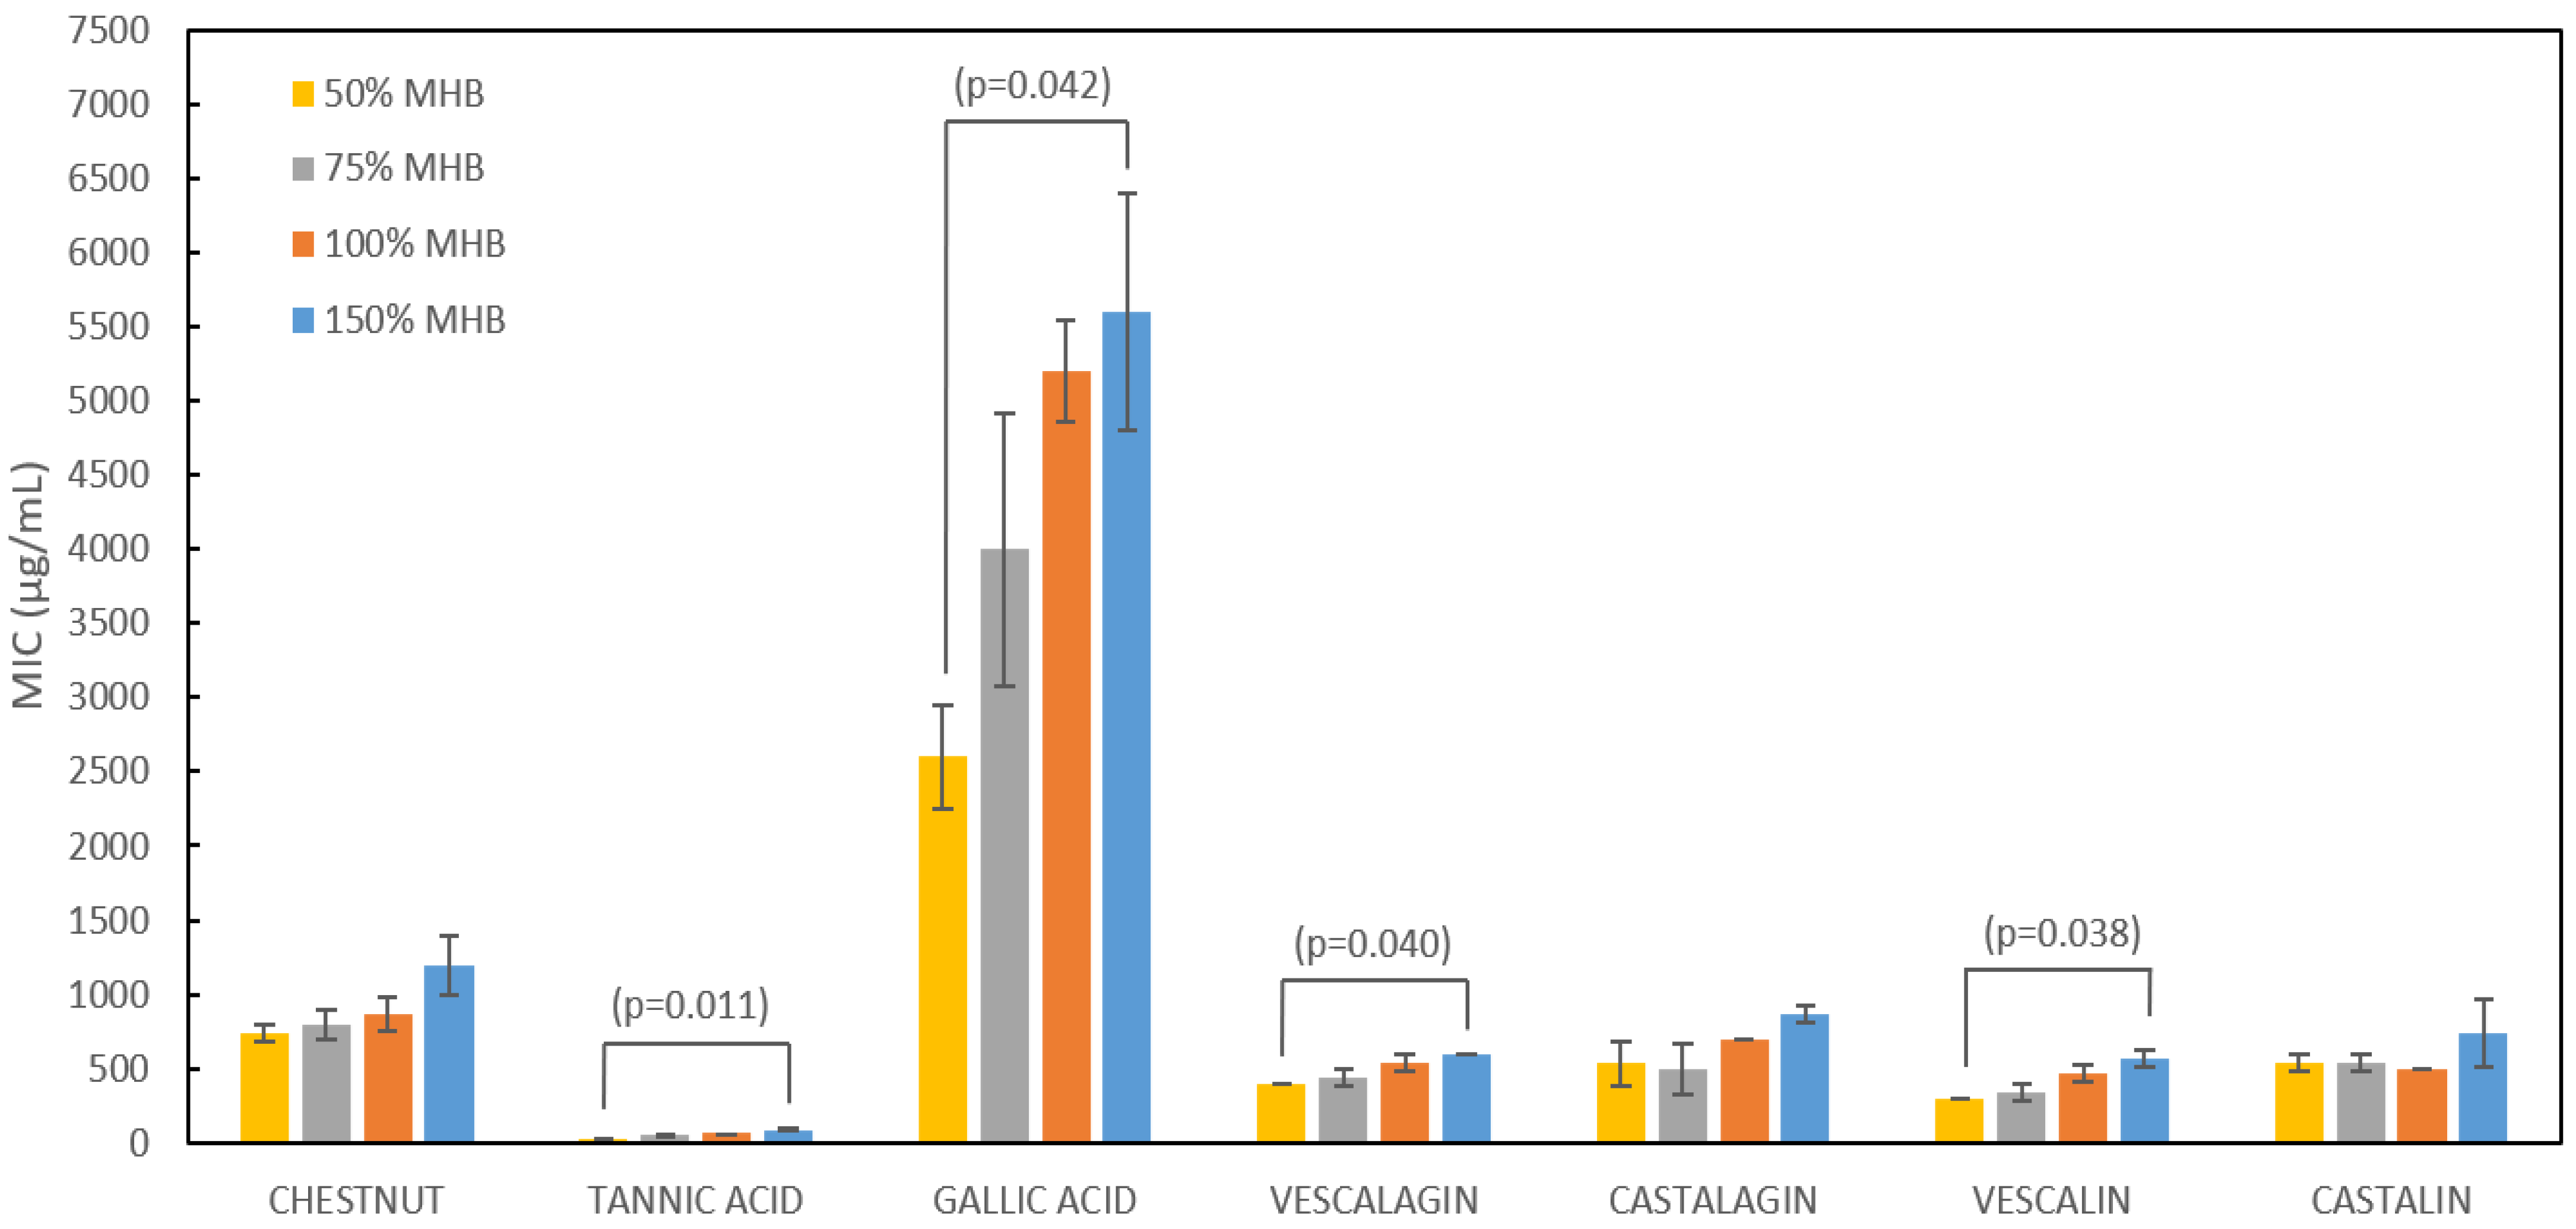
S. aureus is depicted in
Figure 2, while numerical values can be found in
Supplementary Material Table S1. It can be further observed that with higher growth medium concentrations, the MIC values of almost all tested samples also increase.
The Spearman’s rho correlation coefficient between the growth medium strength and MIC values is 0.28 and is at the 0.01 level of significance. Statistically significant differences were found between 50% growth medium concentration MIC and 150% growth medium concentration MIC for almost all samples except chestnut, castalagin and castalin. The increase in MIC values with increasing growth medium strength continued to be observed to some extent, but was not as pronounced as in the case of
E. coli [
6]. In the case of
E. coli, the MIC values doubled with a doubling of the growth medium strength, indicating that the most pronounced mechanism of their antimicrobial action could be the complexation of tannins with essential ions in the growth medium. However, additional studies must be performed to prove this point. The only exception in the case of
S. aureus were the MIC values of gallic acid, wherein the increase in MIC values was well pronounced. The dependence of the MIC value on the strength of the medium, although not as pronounced, was nevertheless present and indicates that the concentration of the medium has an influence on the strength of the compound, which in turn influences the MIC values. In the study by Araújo et al. [
33], it was postulated that the most important mechanism of antimicrobial activity of vescalagin and castalagin against
S. aureus is the disruption of the cell wall caused by the modulation of the normal arrangement of peptidoglycans on the bacterial surface. The main difference is that
S. aureus belongs to the category of Gram-positive bacteria, which differ from Gram-negative bacteria (
E. coli) in the chemical composition of the cell wall. Gram-positive bacteria possess a thicker layer of peptidoglycans, whereas Gram-negative bacteria possess a thinner layer of peptidoglycans and an additional outer membrane with lipopolysaccharides. The difference in cell wall structure between Gram-positive and Gram-negative bacteria may at least partly explain the different trends in the growth medium strength’s effect on tannins’ efficacy against
S. aureus and
E. coli. However, for additional confirmation, it would be beneficial to carry out a study on more representatives of Gram-positive bacteria.
2.3. Minimum Inhibitory Concentrations (MICs) of Studied Samples against Staphylococcus aureus
MIC values for all samples against
S. aureus were determined visually using a broth microdilution assay. For comparison with the literature, the results of MIC values of tannins in 100% medium are collected in
Table 1. The MIC values for media of different concentrations are summarised in
Supplementary Material Table S1.
All tested samples affected the growth of
S. aureus, with MIC values ranging from 60 to 5200 µg/mL, whereas the MIC value of the positive control (streptomycin) was 3.25 µg/mL. It can be concluded that the MIC of gallic acid is an order of magnitude higher than that of all other studied samples, including the crude chestnut extract. However, the MIC of tannic acid was one order of magnitude lower than the other samples. The reason for the higher antibacterial activity of tannic acid may be found in the higher flexibility of the compounds, which makes interactions with proteins [
34,
35] or with the phospholipid bilayer [
36] more likely. The MIC values of the crude chestnut extract and its isolated compounds are of the same order of magnitude. Castalagin exhibited a slightly stronger antibacterial activity than the chestnut extract itself (MIC value of 700 µg/mL of castalagin, compared to MIC value of 867 µg/mL for the chestnut extract). The MIC value of vescalagin was already slightly lower, with a value of 533 µg/mL. Finally, the MIC values of vescalin and castalin were practically half of the MIC value of the chestnut extract, with MIC values of 350 µg/mL and 450 µg/mL, respectively. It is interesting to observe that although vescalin and castalin, as well as vescalagin and castalagin, are structurally very similar compounds (they represent diastereoisomers), the difference in their stereochemistry obviously plays a role in their antibacterial activity, since the MIC values of vescalagin and vescalin were consistently lower than the MIC values of castalagin and castalin. When the MIC values were converted to molar rather than mass concentrations, the MIC values for vescalagin, castalagin, vescalin, and castalin were 0.57 µmol/mL, 0.75 µmol/mL, 0.55 µmol/mL and 0.71 µmol/mL, respectively. As already discussed above, the MIC values of vescalagin and vescalin were again consistently lower than the MIC values of castalagin and castalin. Furthermore, the MIC values of vescalagin and vescalin were now identical within the standard deviation. The same holds true for the MIC values of castalagin and castalin, possibly indicating that the common nonahydroxytriphenoyl group (NHTP group) is of crucial importance for the antibacterial activity of these four compounds.
The MIC values of some of the studied compounds for
S. aureus have been already determined in previous studies. Araújo et al. [
33] determined the MICs of vescalagin and castalagin against
S. aureus (ATCC 25923) and methicillin-resistant
S. aureus (ATCC 700698), and the results for
S. aureus (ATCC 25923) are consistent with ours, with slight differences regarding the MIC values of vescalagin and those of castalagin. Our determined MIC value of vescalagin was 533 µg/mL, whereas theirs was 500 µg/mL, and our MIC of castalagin was 700 µg/mL, whereas their MIC was 500 µg/mL. Any discrepancy can be at least partly a consequence of the different dilution methods. Whereas most studies have typically used the twofold serial dilution method, the concentrations in our study were denser, which allowed a more accurate determination of MIC values, which cannot be observed with the logarithmic dilution method.
Taguri et al. [
37] studied the MIC values of castalagin and tannic acid against the same strain of
S. aureus. Their MIC value of 100 µg/mL for tannic acid was slightly higher than ours, which was 60 µg/mL. This difference in the MIC value of tannic acid could at least partly have arisen from a difference in tannic acid composition, since tannic acid in general is not a pure compound, but a mixture of various gallotannins. Their determined MIC value for castalagin was also 100 µg/mL, which is quite a bit lower than the value of 700 µg/mL that was determined in our study.
In a previous study [
6], we determined the MIC values of pure tannins and extracts against Gram-negative
Escherichia coli, and all exhibited lower MIC values compared to Gram-positive
S. aureus. In many cases, the MIC of antibiotics against Gram-positive bacteria was lower than against Gram-negative bacteria, because the latter have an additional outer membrane. In our case, it was just the opposite, which may be due to different mechanisms of the antibacterial action of tannins against Gram-negative and Gram-positive bacteria [
2].
Antibacterial activity of tannic and gallic acid on the growth of
S. aureus ATCC 6538P was also monitored by Chung [
38] by using the disk diffusion method. Gallic acid at a concentration of 5 mg/mL showed no antibacterial activity, whereas 5 mg/mL tannic acid inhibited the growth of many Gram-positive and Gram-negative bacteria, which corresponds with our findings, as the MIC value of tannic acid was very low, whereas gallic acid had a very high one.
It should be noted that the MIC values reported in the literature vary to a certain extent. However, the values given for vescalagin and castalagin are, at least quantitatively, consistent.
2.4. Minimum Bactericidal Concentrations (MBCs) of Studied Samples against S. aureus
MBC values were determined for all samples, and the values for 100% medium are collected in
Table 2. All values were higher than the corresponding MIC values. It should be noted that MBC values were determined for all tested samples except for tannic acid.
As in the case of MIC, the highest MBC value was determined for gallic acid, which was also an order of magnitude higher than that of the remaining samples. The MBC value of the crude chestnut extract was 2000 µg/mL, whereas the MBC values of vescalagin and castalagin were slightly lower, at 1500 µg/mL. The MBC values of vescalin and castalin were lower still, at 1000 µg/mL. It was observed that for tannic acid, whose MIC values were significantly lower than those of the remaining samples, the bacteria regrew after subculturing on the agar plates at all concentrations up to 500 µg/mL.
To the best of our knowledge, this is the first study determining the MBC of vescalin and castalin, whereas MBC values of vescalagin and castalagin against
S. aureus (ATCC 25923) and methicillin-resistant
S. aureus (ATCC 700698) were determined by Araújo et al. [
33]. The reported values for
S. aureus (ATCC 25923) were practically the same as the MBC values determined in our study (1000 µg/mL), whereas the reported values for strain ATCC 700698 were somewhat lower (250 µg/mL).
2.5. Lag Phases, Growth Rates and Generation Times
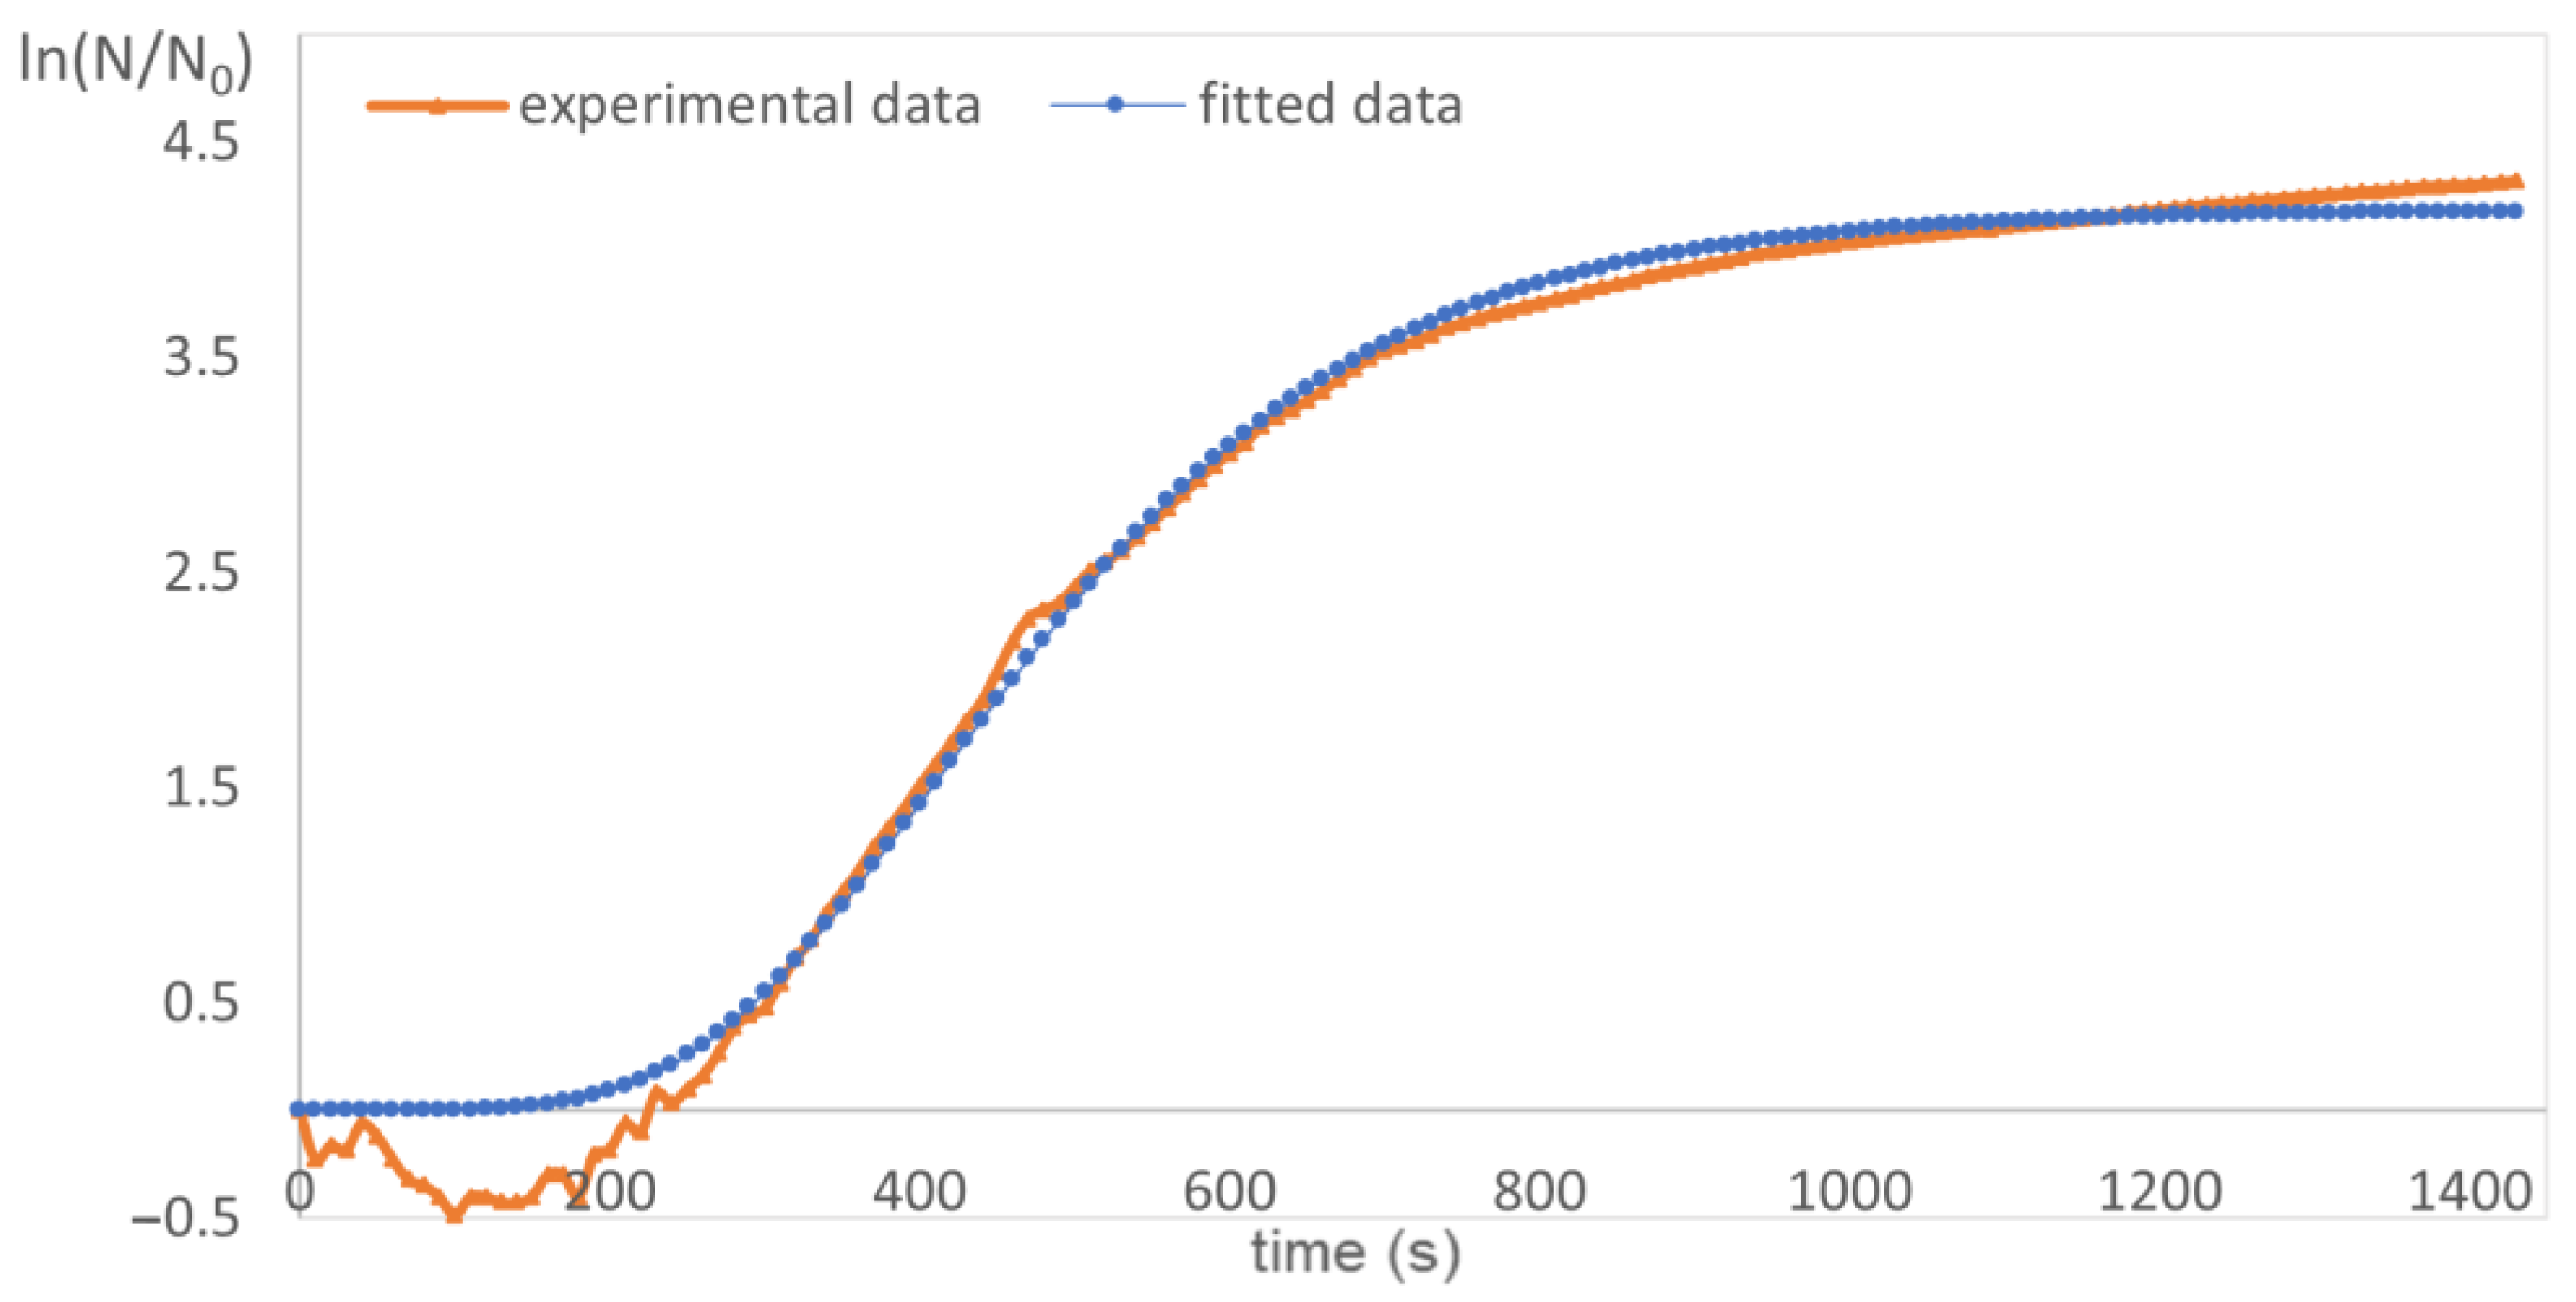
Experimentally obtained growth curves were fitted to Equation (1), resulting in corresponding growth rates and lag phases [
39]. The results of the fit agreed very well with the experimentally obtained data, as can be observed in
Figure 3. Generation times were calculated from Equation (2). Both equations are detailed in
Section 3.6.
As can be observed from
Table 3, the lag time of the negative control was 100 min, which agrees well with lag times reported in the scientific literature, wherein the length of the lag phase was around 120 min [
40]. The lag times of
S. aureus lengthened with the increasing tannin concentration for the vast majority of samples. It can also be observed that all samples had a longer lag phase than the negative control even at the lowest tannin concentrations. The growth rates also decreased for the majority of samples. However, some concentrations deviated from these general trends. Since generation times were calculated directly from the growth rates, the generation times also deviated in these cases, but generally lengthened with the increasing tannin concentrations. This phenomenon is a consequence of environmental challenges or cellular stresses that may often prolong the lag phase and simultaneously cause low growth rates of a particular microbial population [
41].
However, the observed extensions of the lag phases of
S. aureus were not as pronounced as in the case of
E. coli [
42]. In the case of
E. coli, the prolongation of the lag phase followed an exponential relationship with the increasing tannin concentration, which we assumed to be due to the chelation of certain essential ions from the growth medium with tannins. In the case of
S. aureus, no exponential elongation was observed. This could be due to the fact that a different mechanism of tannin antimicrobial action was taking over.

 ,
, 


