

Linking Leaf Functional Traits with Soil and Climate Factors in Forest Ecosystems in China

 , and
, and
Abstract
:1. Introduction
2. Results
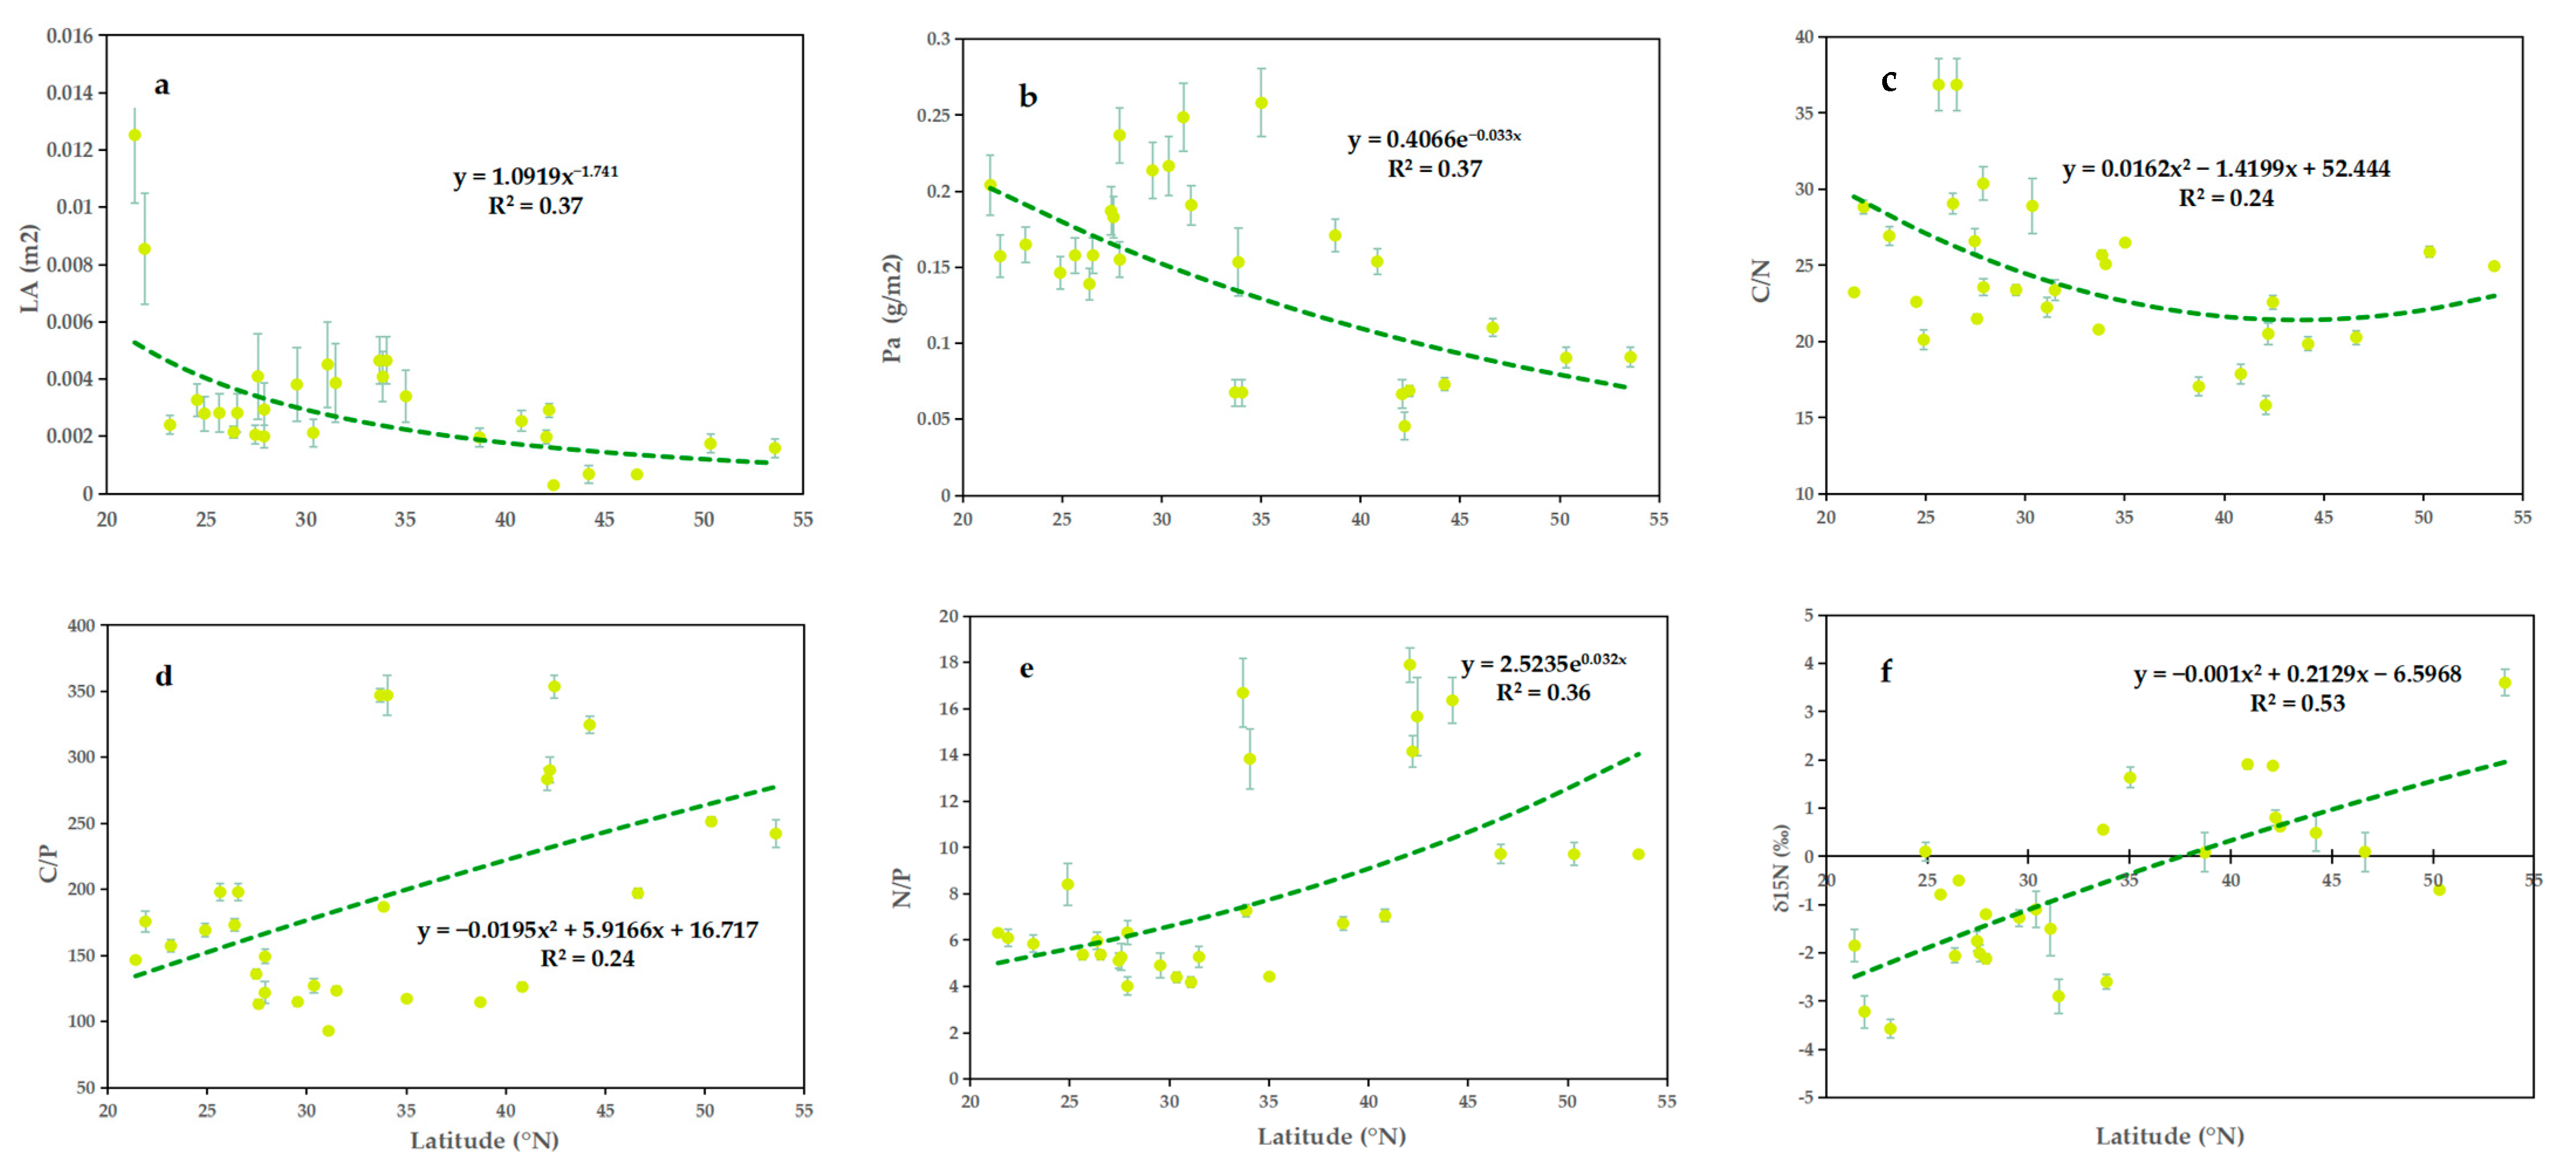
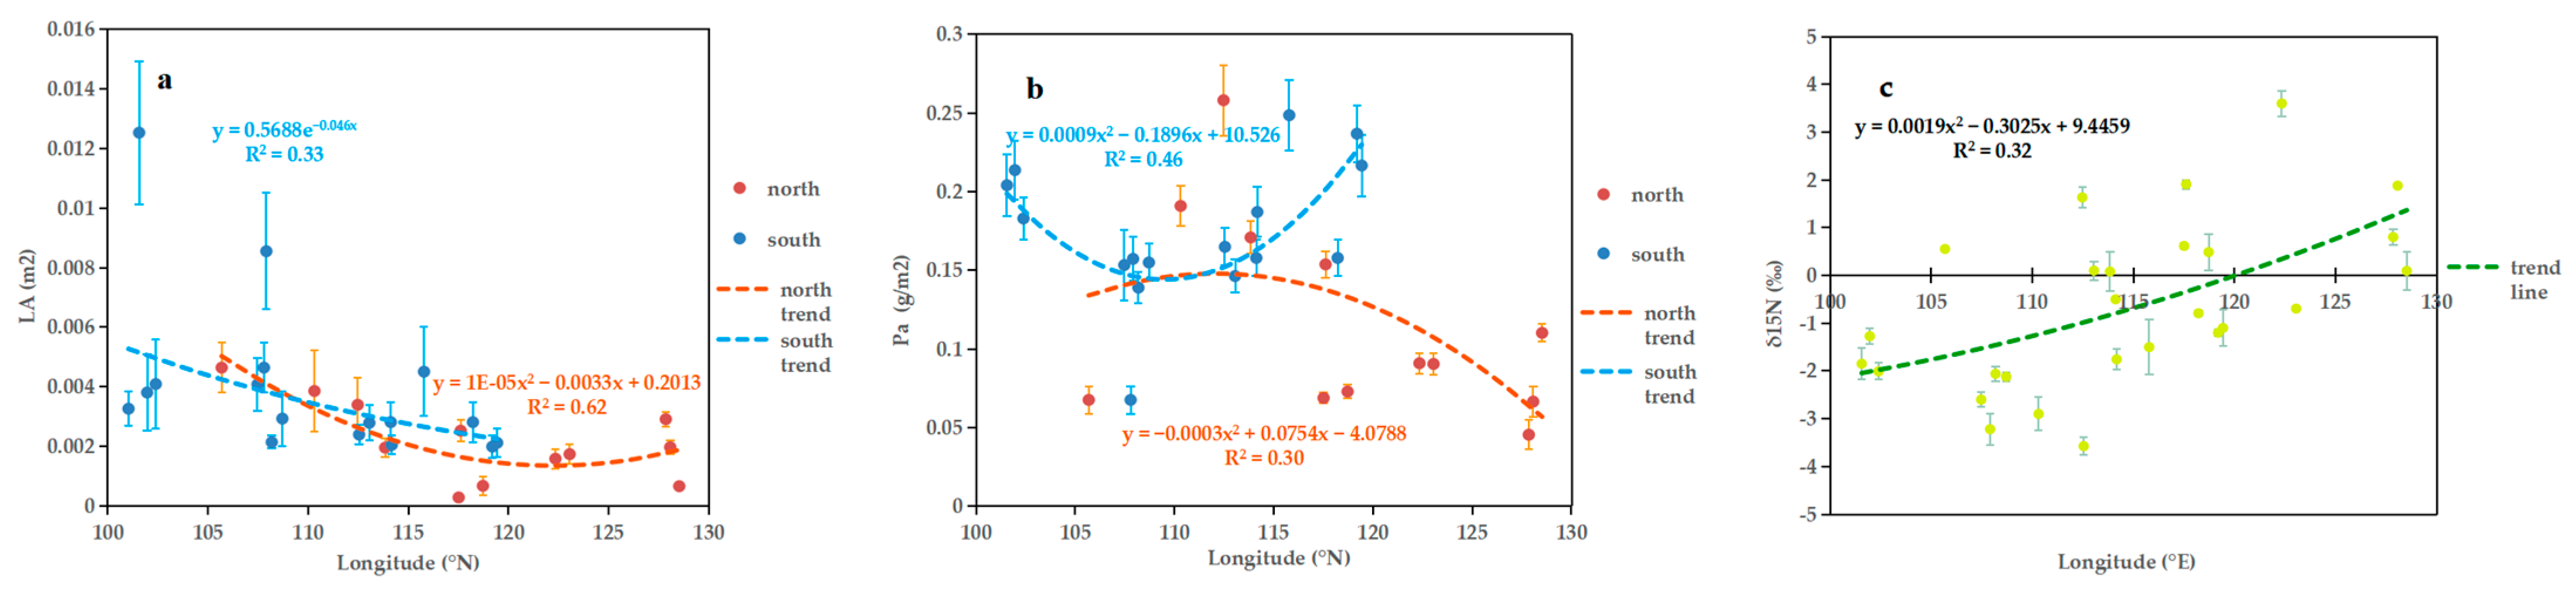
2.1. Geographical Variation
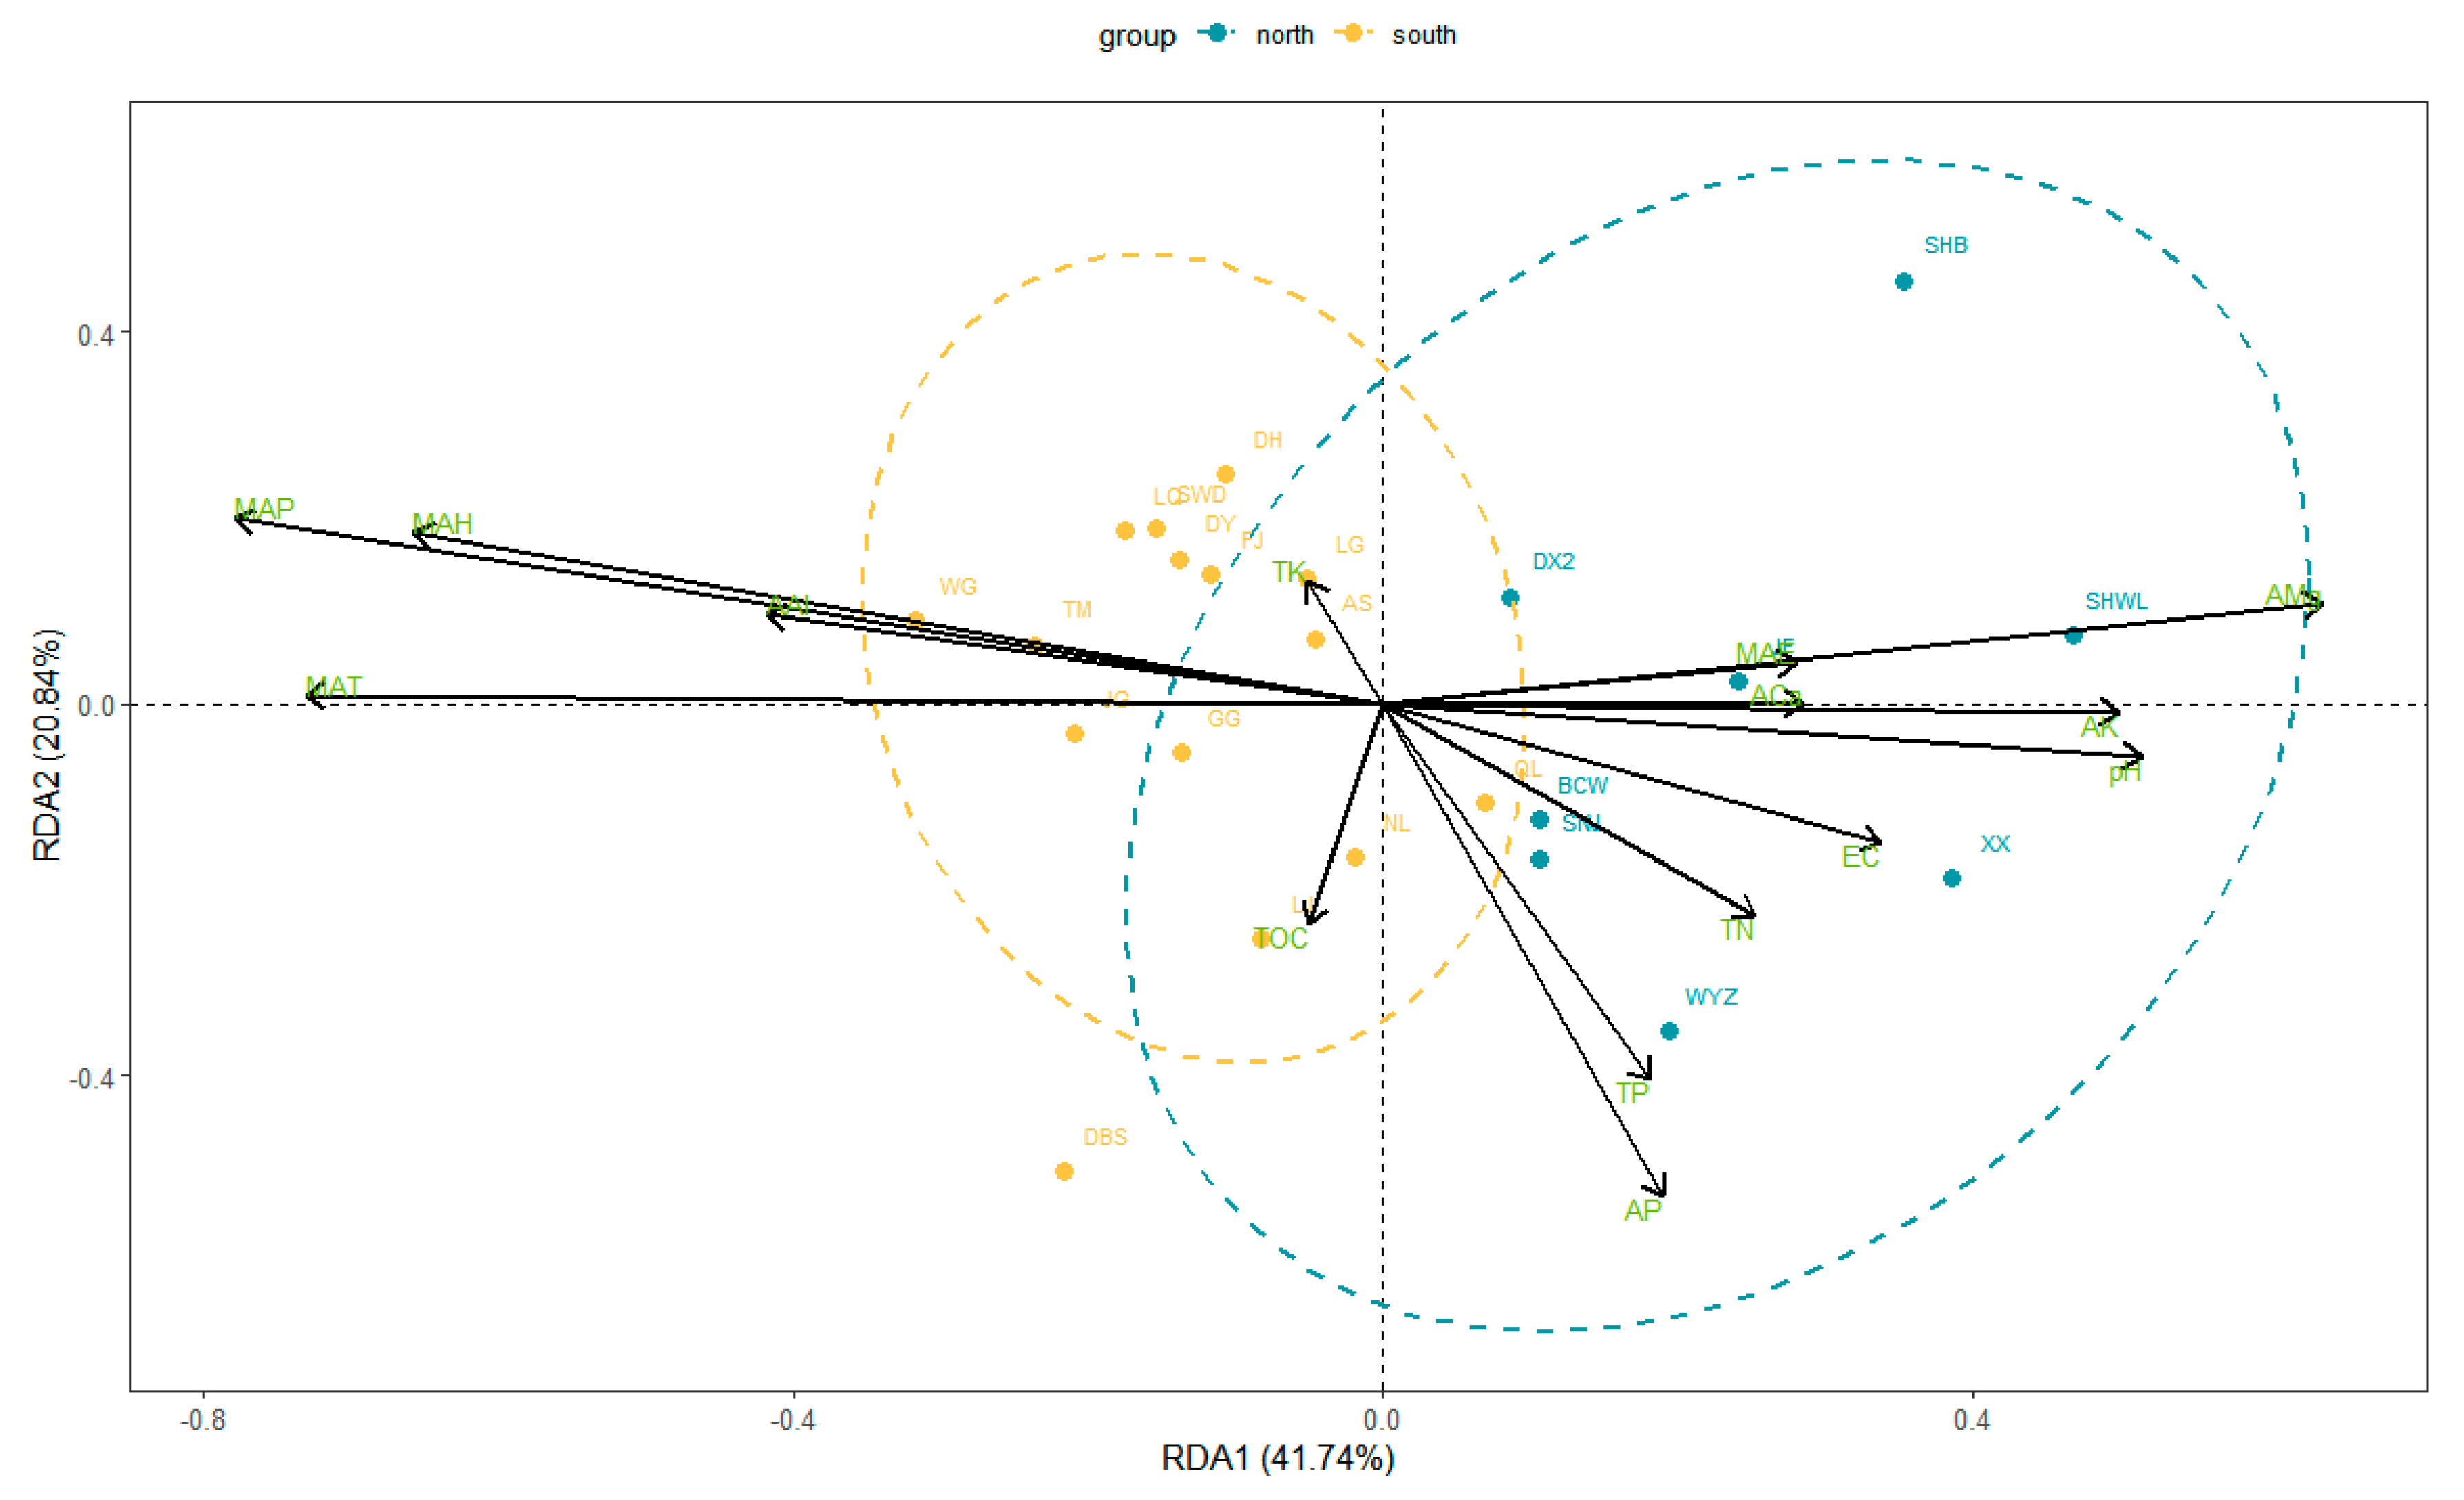
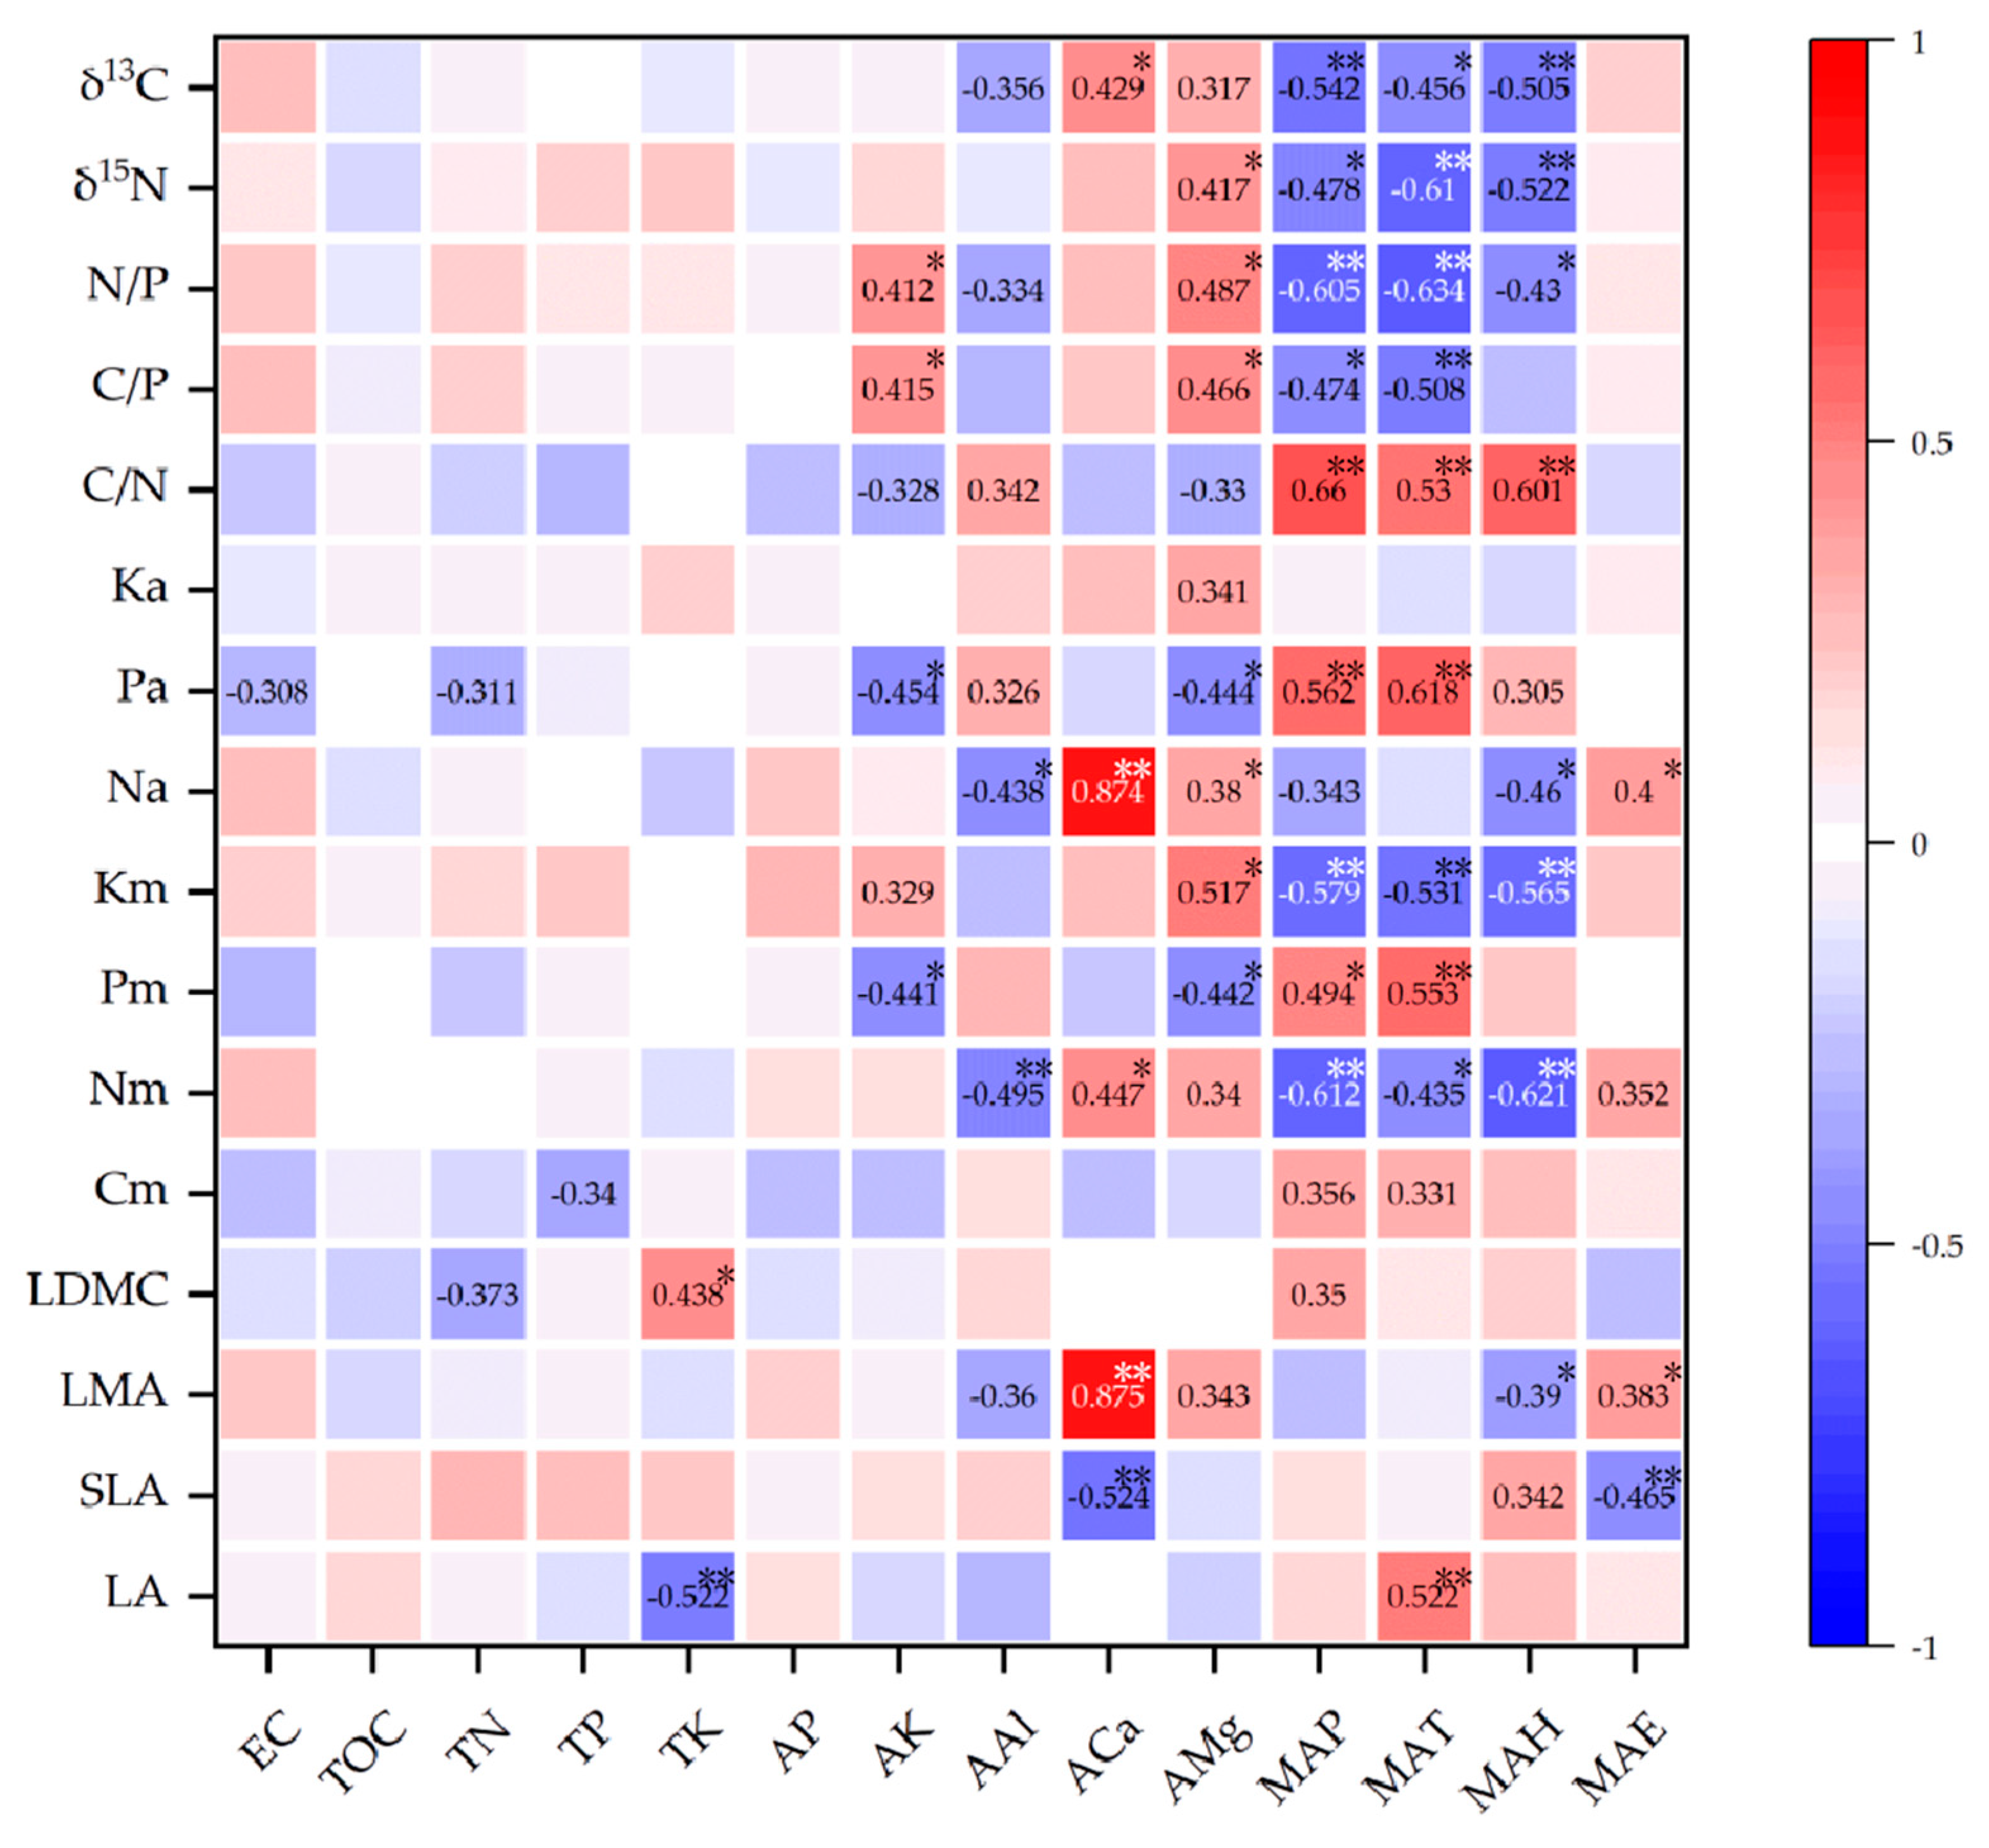
2.2. Environmental Factors Affecting Functional Traits of Leaves
3. Discussion
3.1. Geographical Variation in Leaf Functional Traits
3.2. Factors Influencing Leaf Functional Traits
3.2.1. Climate Factors
3.2.2. Soil Mineral Elements
4. Conclusions
5. Materials and Methods
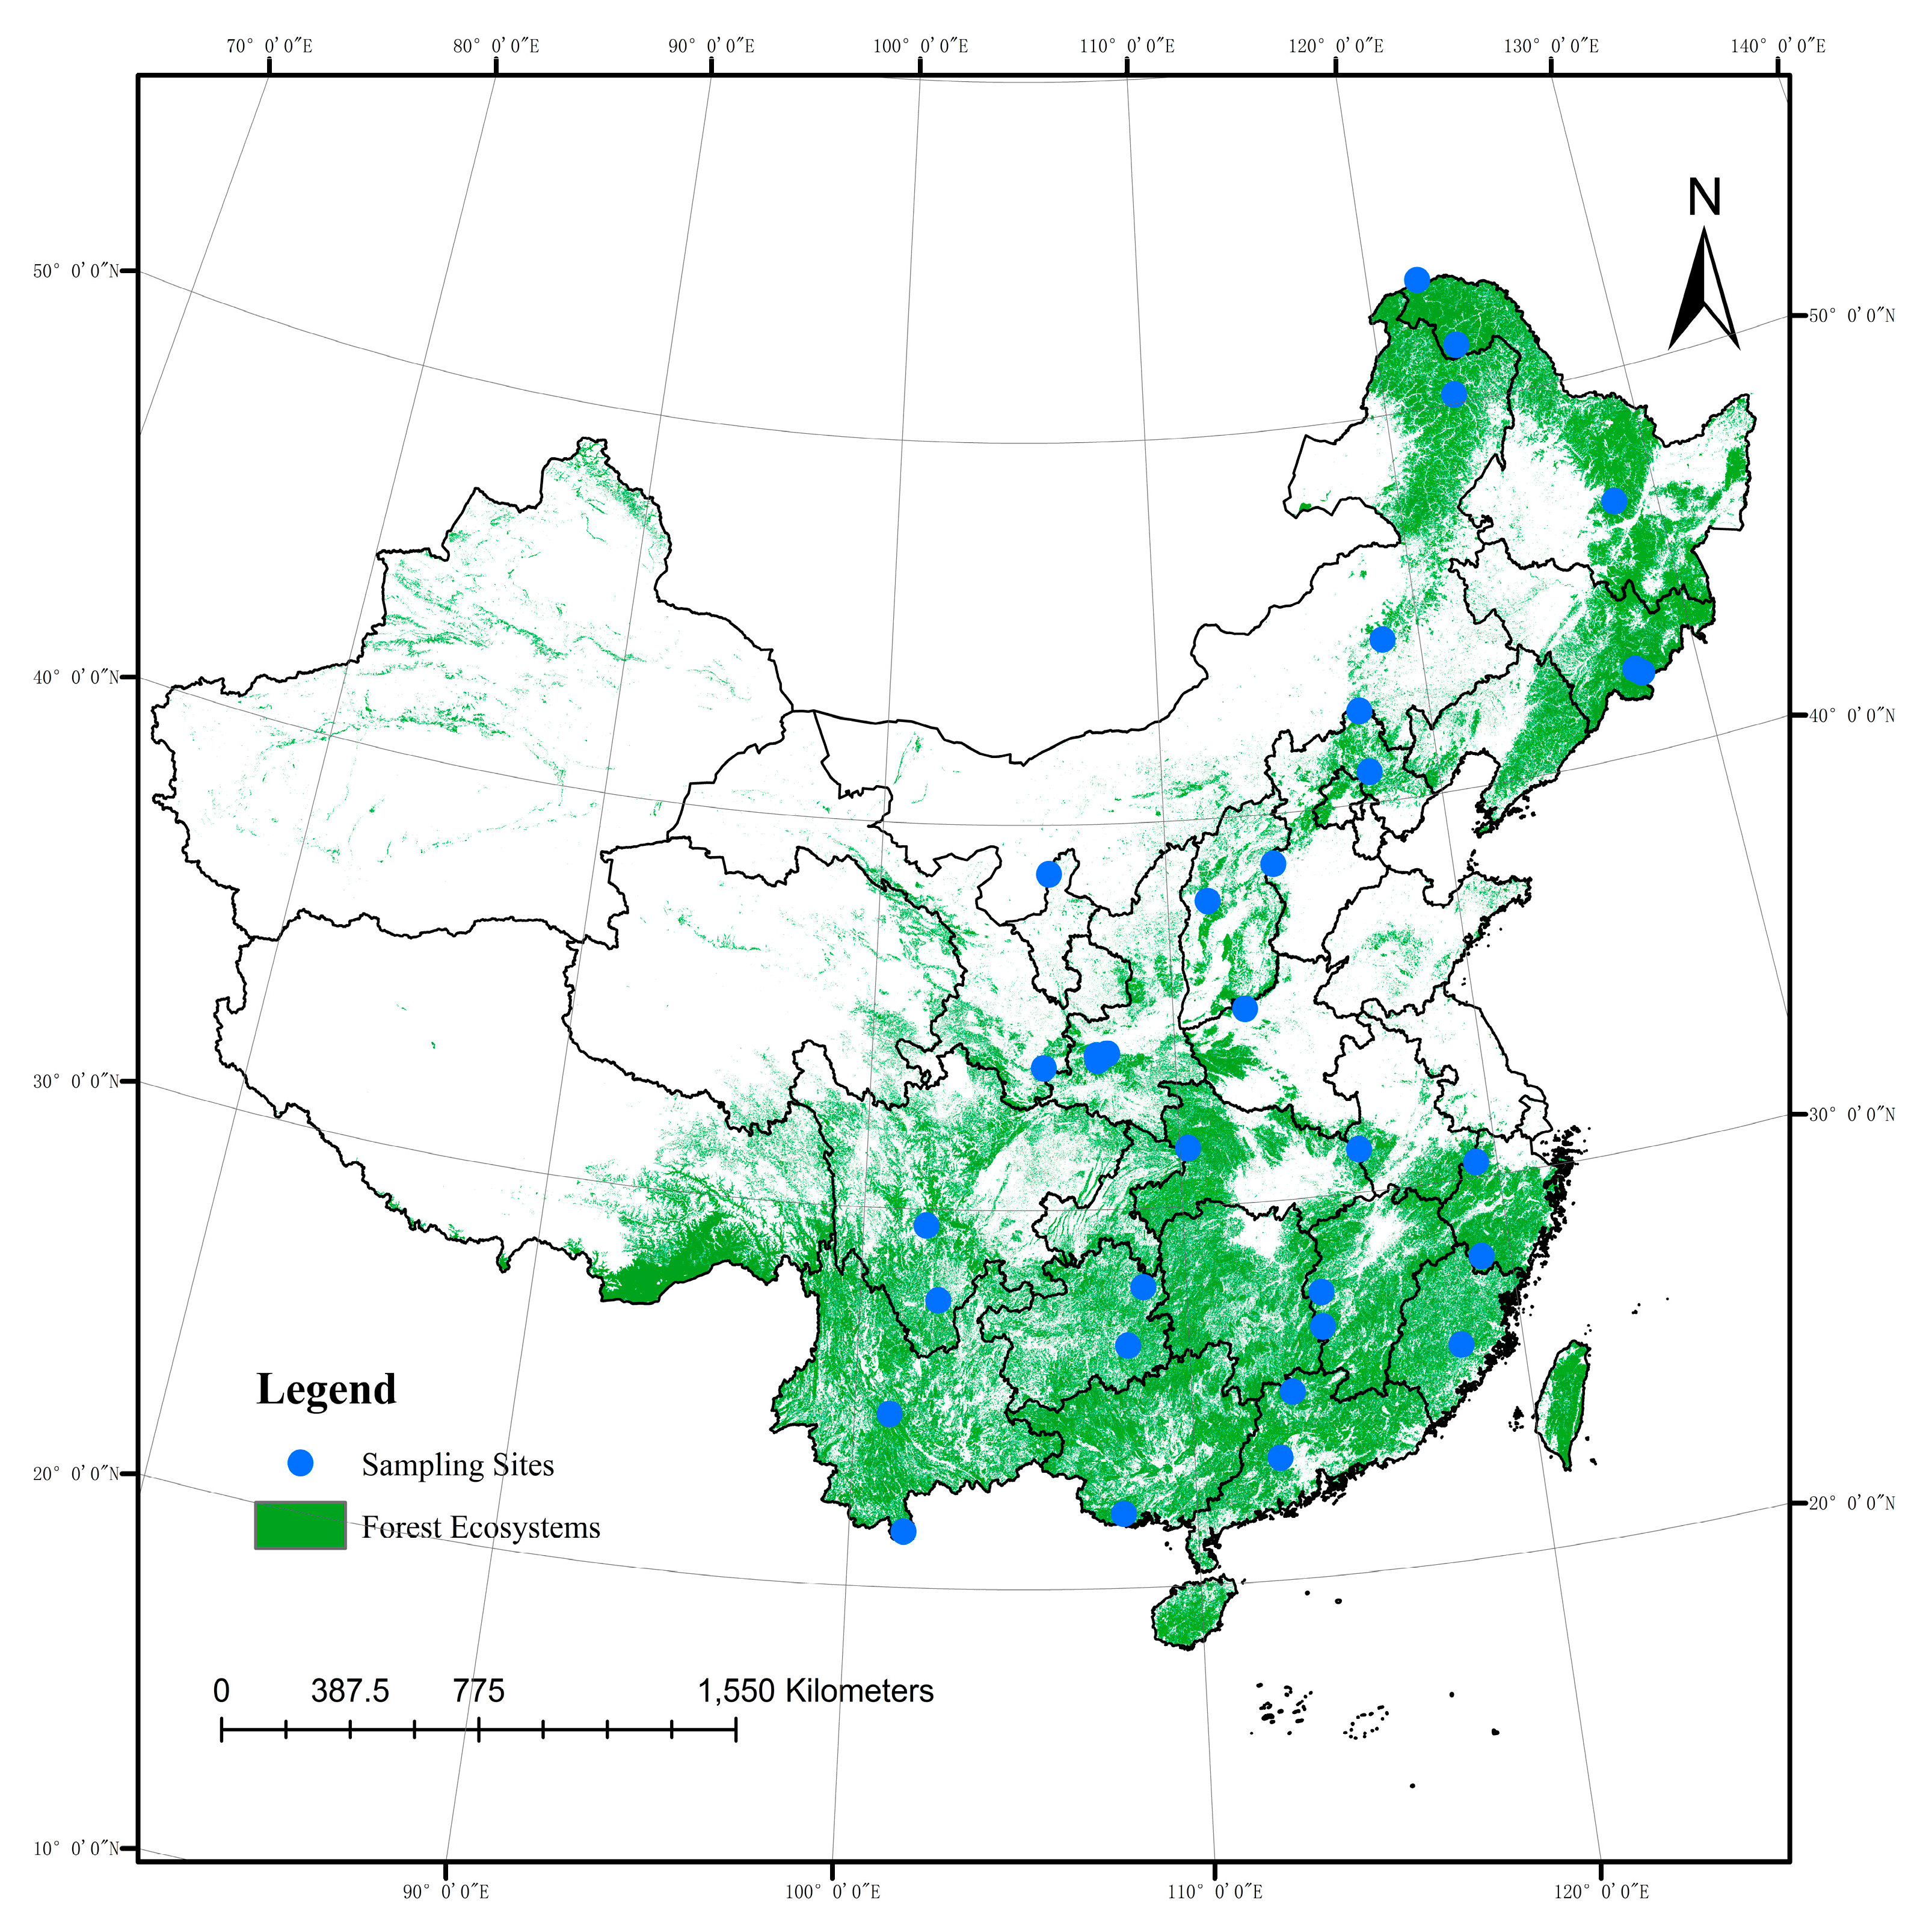
5.1. Soil and Leaf Sampling
5.2. Soil and Leaf Analysis
5.3. Statistical Analyses
Author Contributions
Funding
Data Availability Statement
Conflicts of Interest
References
- Luo, L.; Shen, G.Z.; Xie, Z.Q.; Yu, J. Leaf functional traits of four typical forests along the altitudinal gradients in Mt. Shennongjia. Acta Ecol. Sin. 2011, 31, 6420–6428. [Google Scholar]
- Cochrane, A.; Hoyle, G.L.; Yates, C.J.; Neeman, T.; Nicotra, A.B. Variation in plant functional traits across and within four species of western Australian Banksia (Proteaceae) along a natural climate gradient. Austral Ecol. 2016, 41, 886–896. [Google Scholar] [CrossRef]
- Xiao, H.G.; Wang, C.Y.; Liu, J.; Wang, L.; Du, D.L. Insights into the differences in leaf functional traits of heterophyllous Syringa oblata under different light intensities. J. For. Res. 2015, 26, 613–621. [Google Scholar] [CrossRef]
- Gong, H.D.; Gao, J. Soil and climatic drivers of plant SLA (specific leaf area). Glob. Ecol. Conserv. 2019, 20, e00696. [Google Scholar] [CrossRef]
- Reichstein, M.; Michael, B.; Mahecha, M.D.; Kattge, J.; Baldocchi, D.D. Linking plant and ecosystem functional biogeography. Proc. Natl. Acad. Sci. USA 2014, 111, 13697–13702. [Google Scholar] [CrossRef] [Green Version]
- Violle, C.; Reich, P.B.; Pacala, S.W. The emergence and promise of functional biogeography. Proc. Natl. Acad. Sci. USA 2014, 111, 13690–13696. [Google Scholar] [CrossRef] [PubMed] [Green Version]
- Chave, J.; Coomes, D.; Jansen, S.; Lewis, S.L.; Swenson, N.G.; Zanne, A.E. Towards a worldwide wood economics spectrum. Ecol. Lett. 2009, 12, 351–366. [Google Scholar] [CrossRef] [PubMed]
- Moles, A.T.; Ackerly, D.D.; Tweddle, J.C.; Dickie, J.B.; Smith, R.; Leishman, M.R.; Mayfield, M.M.; Pitman, A.; Wood, J.T.; Westoby, M. Global patterns in seed size. Global Ecol. Biogeogr. 2007, 16, 109–116. [Google Scholar] [CrossRef]
- Moles, A.T.; Warton, D.I.; Warman, L.; Swenson, N.G.; Laffan, S.W.; Zanne, A.E.; Pitman, A.; Hemmings, F.A.; Leishman, M.R. Global patterns in plant height. J. Ecol. 2009, 97, 923–932. [Google Scholar] [CrossRef]
- Reich, P.B.; Oleksyn, J. Global patterns of plant leaf N and P in relation to temperature and latitude. Proc. Natl. Acad. Sci. USA 2004, 101, 11001–11006. [Google Scholar] [CrossRef] [Green Version]
- Hansen, M.C.; DeFries, R.S.; Townshend, J.R.G.; Carroll, M.; Dimiceli, C.; Sohlberg, R.A. Global percent tree cover at a spatial resolution of 500 meters: First results of the MODIS vegetation continuous fields algorithm. Earth Interact. 2003, 7, 1–15. [Google Scholar] [CrossRef]
- Moles, A.T.; Perkins, S.E.; Shawn, W.; Laffan, S.W.; Flores-Moreno, H.; Awasthy, M.; Tindall, M.L.; Sack, L.; Pitman, A.; Kattge, J.; et al. Which is a better predictor of plant traits: Temperature or precipitation? J. Veg. Sci. 2014, 25, 1167–1180. [Google Scholar] [CrossRef]
- Bondeau, A.; Cramer, W.; Smith, P.C.; Schaphoff, S.; Lucht, W.; Zaehle, S.; Gerten, D. Modelling the role of agriculture for the 20th century global terrestrial carbon balance. Glob. Ecol. Biogeogr. 2007, 13, 679–706. [Google Scholar] [CrossRef]
- Verheijen, L.M.; Brovkin, V.; Aerts, R.; Bönisch, G.; Cornelissen, J.H.C.; Kattge, J.; Reich, P.B.; Wright, I.J.; van Bodegom, P.M. Impacts of trait variation through observed trait climate relationships on performance of an Earth system model: A conceptual analysis. Biogeosciences 2013, 10, 5497–5515. [Google Scholar] [CrossRef] [Green Version]
- Yao, T.T.; Meng, T.T.; Ni, J.; Yan, S.; Feng, X.H.; Wang, G.H. Leaf functional trait variation and its relationship with plant phylogenic background and the climate in Xinjiang Junggar Basin, NW China. Chin. J. Biodivers. Sci. 2010, 18, 188. [Google Scholar] [CrossRef]
- Wei, M.; Wang, S.; Wu, B.D.; Jiang, K.; Zhou, J.W.; Wang, C.Y. Variability of leaf functional traits of invasive tree Rhus typhina L. in North China. Chin. J. Cent. South Univ. 2020, 27, 155–163. [Google Scholar] [CrossRef]
- Freschet, G.T.; Cornelissen, J.H.; Van Logtestijn, R.S.; Aerts, R. Evidence of the plant economics spectrum in a subarctic flora. J. Ecol. 2010, 98, 362–373. [Google Scholar] [CrossRef] [Green Version]
- Sundqvist, M.K.; Giesler, R.; Wardle, D.A. Within- and across species responses of plant traits and litter decomposition to elevation across contrasting vegetation types in subarctic tundra. PLoS ONE 2011, 6, e27056. [Google Scholar] [CrossRef] [Green Version]
- Mason, N.W.; Richardson, S.J.; Peltzer, D.A.; de Bello, F.; Wardle, D.A.; Allen, R.B. Changes in coexistence mechanisms along a long-term soil chronosequence revealed by functional trait diversity. J. Ecol. 2012, 100, 678–689. [Google Scholar] [CrossRef] [Green Version]
- Gong, H.D.; Cui, Q.J.; Gao, J. Latitudinal, soil and climate effects on key leaf traits in northeastern China. Glob. Ecol. Conserv. 2020, 22, e00904. [Google Scholar] [CrossRef]
- Zhang, S.H.; Zhang, Y.; Xiong, K.N.; Yu, Y.H.; Min, X.Y. Changes of leaf functional traits in karst rocky desertification ecological environment and the driving factors. Glob. Ecol. Conserv. 2020, 24, e01381. [Google Scholar] [CrossRef]
- Wright, I.J.; Reich, P.B.; Westoby, M.; Ackerly, D.D.; Baruch, Z.; Bongers, F.; Ackerly, D.D.; Baruch, Z.; Bongers, F.; Cavender-Bares, J.; et al. The worldwide leaf economics spectrum. Nature 2004, 428, 821–827. [Google Scholar] [CrossRef]
- Li, S.; Gou, W.; Wang, H.; White, J.F.; Wu, G.; Su, P. Trade-Off Relationships of Leaf Functional Traits of Lycium ruthenicum in Response to Soil Properties in the Lower Reaches of Heihe River, Northwest China. Diversity 2021, 13, 453. [Google Scholar] [CrossRef]
- Cernusak, L.A.; Ubierna, N.; Winter, K.; Holtum, J.A.M.; Marshall, J.D.; Farquhar, G.D. Environmental and physiological determinants of carbon isotope discrimination in terrestrial plants. New Phytol. 2013, 200, 950–965. [Google Scholar] [CrossRef] [PubMed]
- Sellin, A.; Tullus, A.; Niglas, A.; Õunapuu, E.; Karusion, A.; Lõhmus, K. Humidity-driven changes in growth rate, photosynthetic capacity, hydraulic properties and other functional traits in silver birch (Betula pendula). Ecol. Res. 2013, 28, 523–535. [Google Scholar] [CrossRef]
- Richards, J.H.; Henn, J.J.; Sorenson, Q.M.; Adams, M.A.; Smith, D.D.; McCulloh, K.A.; Givnish, T.J. Mistletoes and their eucalypt hosts differ in the response of leaf functional traits to climatic moisture supply. Oecologia 2021, 195, 759–771. [Google Scholar] [CrossRef] [PubMed]
- Guerin, G.R.; Gallagher, R.V.; Wright, I.J.; Andrew, S.C.; Falster, D.S.; Wenk, E.; Munroe, S.E.M.; Lowe, A.J.; Sparrow, B. Environmental associations of abundance-weighted functional traits in Australian plant communities. Basic Appl. Ecol. 2022, 58, 98–109. [Google Scholar] [CrossRef]
- Dong, Y.; Liu, Y. Response of Korean pine’s functional traits to geography and climate. PLoS ONE 2017, 12, e0184051. [Google Scholar] [CrossRef]
- Pan, F.; Liang, Y.; Wang, K.; Zhang, W. Responses of fine root functional traits to soil nutrient limitations in a karst ecosystem of Southwest China. Forests 2018, 9, 743. [Google Scholar] [CrossRef] [Green Version]
- Qi, D.; Wieneke, X.; Zhou, X.; Jiang, X.; Xue, P. Succession of plant community composition and leaf functional traits in responding to karst rocky desertification in the Wushan County in Chongqing, China. Community Ecol. 2017, 18, 157–168. [Google Scholar] [CrossRef] [Green Version]
- Monika, R.; Kusum, A.; Ayyandar, A.; Juha, M.A.; Ujjwal, K.; Barbara, S.; Levente, H.; Erika, M.; Rajiv, P. Relative contribution of plant traits and soil properties to the functioning of a temperate forest ecosystem in the Indian Himalayas. Catena 2020, 194, 10467. [Google Scholar] [CrossRef]
- Wang, X.P.; Ye, M.R.; Zhang, X.P.; Xu, R.S.; Xu, D.Q. Changes in leaf functional traits of Houttuynia cordata in response to soil environmental factors in Anqing city of Anhui Province in China. Environ. Pollut. Bioavail. 2019, 31, 240–251. [Google Scholar] [CrossRef] [Green Version]
- Ordoñez, J.C.; Van Bodegom, P.M.; Witte, J.P.M.; Wright, I.J.; Reich, P.B.; Aerts, R. A global study of relationships between leaf traits, climate and soil measures of nutrient fertility. Glob. Ecol. Biogeogr. 2009, 18, 137–149. [Google Scholar] [CrossRef]
- Chen, Y.; Han, W.; Tang, L.; Tang, Z.; Fang, J. Leaf nitrogen and phosphorus concentrations of woody plants differ in responses to climate, soil and plant growth form. Ecography 2013, 36, 178–184. [Google Scholar] [CrossRef]
- Liu, R.; Liang, S.; Long, W.; Jiang, Y. Variations in leaf functional traits across ecological scales in riparian plant communities of the Lijiang river, Guilin, Southwest China. Trop. Conserv. Sci. 2018, 11, 1940082918804680. [Google Scholar] [CrossRef] [Green Version]
- Duan, X.; Jia, Z.; Li, J.; Wu, S. The influencing factors of leaf functional traits variation of Pinus densiflora Sieb. et Zucc. Glob. Ecol. Conserv. 2022, 38, e02177. [Google Scholar] [CrossRef]
- Zeilinger, S.; Gupta, V.K.; Dahms, T.E.S.; Silva, R.N.; Singh, H.B.; Upadhyay, R.S.; Gomes, E.V.; Tsui, C.K.M.; Nayak, S.C. Friends or foes? Emerging insights from fungal interactions with plants. FEMS Microbiol. Rev. 2015, 40, 182–207. [Google Scholar] [CrossRef] [Green Version]
- Zheng, L.M.; Song, W.C. Phosphorus Limitation of Trees Influences Forest Soil Fungal Diversity in China. Forests 2022, 13, 223. [Google Scholar] [CrossRef]
- Hu, M.Y.; Zhang, L.; Luo, T.X.; Shen, W. Variations in leaf functional traits of Stipa purpurea along a rainfall gradient in Xizang, China. Chin. J. Plant Ecol. 2012, 36, 136. [Google Scholar] [CrossRef]
- Song, L.L.; Tian, Q.; Li, G.; Li, Z.X.; Liu, X.Y.; Gui, J.; Li, Y.C.; Cui, Q.; Zhao, Y. Variation in characteristics of leaf functional traits of alpine vegetation in the Three-River Headwaters Region, China. Ecol. Indic. 2022, 145, 109557. [Google Scholar] [CrossRef]
- Zhang, C.; Zeng, F.; Zeng, Z.; Du, H.; Su, L.; Zhang, L.; Zhang, H. Impact of Selected Environmental Factors on Variation in Leaf and Branch Traits on Endangered Karst Woody Plants of Southwest China. Forests 2022, 13, 1080. [Google Scholar] [CrossRef]
- Liu, G.; Freschet, G.T.; Pan, X.; Cornelissen, J.H.; Li, Y.; Dong, M. Coordinated variation in leaf and root traits across multiple spatial scales in Chinese semi-arid and arid ecosystems. New Phytol. 2010, 188, 543–553. [Google Scholar] [CrossRef] [PubMed]
- Wang, J.; Zhu, J.; AI, X.R.; Yao, L.; Huang, X.; Wu, M.L.; Hong, J.F. Effects of topography on leaf functional traits across plant life forms in Xingdou Mountain, Hubei, China. Chin. J. Plant Ecol. 2019, 43, 447. [Google Scholar] [CrossRef]
- Duan, Y.Y.; Song, L.J.; Niu, S.Q.; Huang, T.; Yang, G.H.; Hao, W.F. Variation in leaf functional traits of different-aged Robinia pseudoacacia communities and relationships with soil nutrients. Chin. J. Appl. Ecol. 2017, 28, 28–36. [Google Scholar] [CrossRef]
- Zhang, K.R.; Cheng, X.L.; Dang, H.S.; Zhang, Q.F. Biomass:N:K:Ca:Mg:P ratios in forest stands world-wide: Biogeographical variations and environmental controls. Glob. Ecol. Biogeogr. 2020, 29, 2176–2189. [Google Scholar] [CrossRef]
- Amundson, R.; Austin, A.T.; Schuur, E.A.; Yoo, K.; Matzek, V.; Kendall, C.; Uebersax, A.; Brenner, D.L.; Baisden, W.T. Global patterns of the isotopic composition of soil and plant nitrogen. Glob. Biogeochem. Cy. 2003, 17, 1031–1038. [Google Scholar] [CrossRef]
- Rumsey, D.J. Statistics for Dummies, 2nd ed.; Wiley Publishing: Hoboken, NJ, USA, 2011; p. 284. [Google Scholar]
- Luo, Y.K.; Hu, H.F.; Zhao, M.Y.; Li, H.; Liu, S.S.; Fang, J.Y. Latitudinal pattern and the driving factors of leaf functional traits in 185 shrub species across eastern China. J. Plant Ecol. 2019, 12, 67–77. [Google Scholar] [CrossRef]
- Wright, I.J.; Reich, P.B.; Cornelissen, J.H.C.; Falster, D.S.; Garnier, E.; Hikosaka, K.; Lamont, B.B.; Lee, W.; Oleksyn, J.; Osada, N.; et al. Assessing the generality of global leaf trait relationships. New Phytol. 2005, 166, 485e496. [Google Scholar] [CrossRef]
- Becklin, K.M.; Pallo, M.L.; Galen, C. Willows indirectly reduce arbuscular mycorrhizal fungal colonization in understorey communities. J. Ecol. 2012, 100, 343–351. [Google Scholar] [CrossRef]
- Ferlian, O.; Goldmann, K.; Eisenhauer, N.; Tarkka, M.T.; Buscot, F.; Heintz-Buschart, A. Distinct effects of host and neighbour tree identity on arbuscular and ectomycorrhizal fungi along a tree diversity gradient. ISME Commun. 2021, 1, 40. [Google Scholar] [CrossRef]
- Toju, H.; Kishida, O.; Katayama, N.; Takagi, K. Networks Depicting the Fine-Scale Co-Occurrences of Fungi in Soil Horizons. PLoS ONE 2016, 11, e0165987. [Google Scholar] [CrossRef] [PubMed]
- Luo, S.; Schmid, B.; De Deyn, G.B.; Yu, S.X. Soil microbes promote complementarity effects among co-existing trees through soil nitrogen partitioning. Funct. Ecol. 2018, 32, 1879–1889. [Google Scholar] [CrossRef] [Green Version]
- Boberg, J.B.; Finlay, R.D.; Stenlid, J.; Ekblad, A.; Lindahl, B.D. Nitrogen and carbon reallocation in fungal mycelia during decomposition of boreal forest litter. PLoS ONE 2014, 9, e92897. [Google Scholar] [CrossRef]
- Du, E.; van Doorn, M.; de Vries, W. Spatially divergent trends of nitrogen versus phosphorus limitation across European forests. Sci. Total Environ. 2021, 771, 145391. [Google Scholar] [CrossRef] [PubMed]
- Song, W.C.; Zhou, Y.J. Linking leaf δ15N and δ13C with soil fungal biodiversity, ectomycorrhizal and plant pathogenic abundance in forest ecosystems of China. Catena 2021, 200, 105176. [Google Scholar] [CrossRef]
- He, X.H.; Xu, M.G.; Qiu, G.Y.; Zhou, J.B. Use of 15N stable isotope to quantify nitrogen transfer between mycorrhizal plants. J. Plant Ecol. 2009, 2, 107–118. [Google Scholar] [CrossRef] [Green Version]
- Angst, G.; Mueller, K.E.; Eissenstat, D.M.; Trumbore, S.; Freeman, K.H.; Hobbie, S.E.; Chorover, J.; Oleksyn, J.; Reich, P.B.; Mueller, C.W. Soil organic carbon stability in forests: Distinct effects of tree species identity and traits. Glob. Chang. Biol. 2019, 25, 1529–1546. [Google Scholar] [CrossRef]
- Song, W.C.; Tong, X.J.; Liu, Y.H.; Li, W.K. Microbial community, newly sequestered soil organic carbon, and δ15N variations driven by tree roots. Front. Microbiol. 2020, 11, 314. [Google Scholar] [CrossRef] [Green Version]
- Schulze, E.D.; Nicolle, D.; Boerner, A.; Lauerer, M.; Aas, G. Stable carbon and nitrogen isotope ratios of Eucalyptus and Acacia species along a seasonal rainfall gradient in Western Australia. Trees 2014, 28, 1125–1135. [Google Scholar] [CrossRef]
- Luo, Q.Q.; Zhou, Z.C.; Deng, Z.F.; Yu, L.H.; Sun, J.J.; Xu, G.B. Variation law of phenotypic traits and nitrogen and phosphorus stoichiometric characteristics of leaf of natural populations of Taxus wallichiana var. mairei. Chin. J. Plant Res. Environ. 2021, 10, 27–35. [Google Scholar] [CrossRef]
- Zhang, K.; Hou, J.H.; He, N.P. Leaf functional trait distribution and controlling factors of Pinus tabuliformis. Acta Ecol. Sin. 2017, 37, 736–749. [Google Scholar] [CrossRef]
- Liu, M.X. Studies on physiological and leaf morphological traits for photosynthesis on different slopes in a subalpine meadow. Acta Ecol. Sin. 2017, 37, 8526–8536. [Google Scholar] [CrossRef] [Green Version]
- Li, S.J.; Zhang, Y.F.; Chen, T. Relationships between foliar stable carbon isotope composition and environmental factors and leaf element contents of Pinus tabulaeformis in northwestern China. Chin. J. Plant Ecol. 2011, 35, 596–604. [Google Scholar] [CrossRef]
- Zhu, Y.H.; Kang, H.Z.; Xie, Q.; Wang, Z.; Yin, S.; Liu, C.J. Pattern of leaf vein density and climate relationship of Quercus variabilis populations remains unchanged with environmental changes. Trees 2012, 26, 597–607. [Google Scholar] [CrossRef]
- Hudson, J.M.; Henry, G.H.; Cornwell, W.K. Taller and larger: Shifts in Arctic tundra leaf traits after 16 years of experimental warming. Glob. Chang. Biol. 2011, 17, 1013–1021. [Google Scholar] [CrossRef]
- Noguchi, K.; Terashima, I. Responses of spinach leaf mitochondria to low N availability. Plant Cell Environ. 2006, 29, 710–719. [Google Scholar] [CrossRef] [Green Version]
- Rao, Z.G.; Guo, W.K.; Cao, J.T.; Shi, F.X.; Jiang, H.; Li, C.Z. Relationship between the stable carbon isotopic composition of modern plants and surface soils and climate: A global review. Earth-Sci. Rev. 2017, 165, 110–119. [Google Scholar] [CrossRef]
- Rumman, R.; Atkin, O.K.; Bloomfield, K.J.; Eamus, D. Variation in bulk-leaf 13C discrimination, leaf traits and water-use efficiency-trait relationships along a continental-scale climate gradient in Australia. Glob. Chang. Biol. 2017, 24, 1186–1200. [Google Scholar] [CrossRef]
- Su, B.; Han, X.G.; Li, L.H.; Huang, J.H.; Bai, Y.F.; Qu, C.M. Responses of δ13C value and water use efficiency of plant species to environmental gradients along the grassland zone of Northeast China Transect. Acta Phytoecol. Sin. 2000, 24, 648–655. [Google Scholar]
- Marshall, J.D.; Zhang, J.W. Carbon isotope discrimination and water use efficiency in native plants of the North Central Rockies. Ecology 2018, 75, 1887–1895. [Google Scholar] [CrossRef]
- Anderson, W.T.; Bernasconi, S.M.; Mckenzie, J.A.; Saurer, M. Oxygen and carbon isotopic record of climatic variability in tree ring cellulose (Picea abies): An example from central Switzerland (1913–1995). J. Geophys. Res. 1998, 103, 31625–31636. [Google Scholar] [CrossRef]
- Xing, K.X.; Niinemets, Ü.; Rengel, Z.; Onoda, Y.; Xia, J.Z.; Chen, H.Y.; Zhao, M.F.; Han, W.X.; Li, H.B. Global patterns of leaf construction traits and their covariation along climate and soil environmental gradients. New Phytol. 2021, 232, 1648–1660. [Google Scholar] [CrossRef] [PubMed]
- Poorter, H.; Niinemets, U.; Poorter, L.; Wright, I.J.; Villar, R. Causes and consequences of variation in leaf mass per area (LMA): A meta-analysis. New Phytol. 2010, 182, 565e588. [Google Scholar] [CrossRef] [PubMed]
- Liu, J.F.; Zhang, Y.T.; Ni, Y.Y.; Huang, Y.N.; Jiang, Z.P. Latitudinal trends in foliar δ13C and δ15N of Quercus variabilis and their influencing factors. Chin. J. Appl. Ecol. 2018, 29, 1373–1380. [Google Scholar] [CrossRef]
- Dong, L.L.; Liu, S.R.; Shi, Z.M.; Feng, Q.H. Relationships between leaf traits of Castanopsis species and the environmental factors in the North-South transect of eastern China. Jpn. J. For. Res. 2009, 22, 463–469. [Google Scholar]
- Diefendorf, A.F.; Mueller, K.E.; Wing, S.L.; Koch, P.L.; Freeman, K.H.; John, M.H. Global patterns in leaf 13C discrimination and implications for studies of past and future climate. Proc. Natl. Acad. Sci. USA 2010, 107, 5738–5743. [Google Scholar] [CrossRef] [Green Version]
- Tieszen, L.L.; Boutton, T.W. Stable Carbon Isotopes in Terrestrial Ecosystem Research; Springer: New York, NY, USA, 1989; pp. 167–195. [Google Scholar]
- Du, B.M.; Kang, H.Z.; Zhu, Y.H.; Zhou, X.; Yin, S.; Burgess, P.J.; Liu, C.J. Variation of Oriental Oak (Quercus variabilis) Leaf δ13C across Temperate and Subtropical China: Spatial Patterns and Sensitivity to Precipitation. Forests 2015, 6, 2296–2306. [Google Scholar] [CrossRef] [Green Version]
- Li, M.X.; Peng, C.H.; Wang, M.; Yang, Y.Z.; Zhang, K.R.; Li, P.; Yang, Y.; Ni, J.; Zhu, Q.A. Spatial patterns of leaf δ13C and its relationship with plant functional groups and environmental factors in China. J. Geophys. Res-Biogeosci. 2017, 122, 1564–1575. [Google Scholar] [CrossRef]
- No’am, G.S.; Sinclair, T.R. Global environment change and simulated forage quality of wheat II. Water and nitrogen stress. Field Crops Res. 1995, 40, 29–37. [Google Scholar]
- Wright, I.J.; Reich, P.B.; Westoby, M. Strategy shifts in leaf physiology, structure and nutrient content between species of high- and low-rainfall and high- and low-nutrient habitats. Funct. Ecol. 2001, 15, 423–434. [Google Scholar] [CrossRef] [Green Version]
- Song, W.C.; Tong, X.J.; Zhang, J.S.; Meng, P.; Li, J. Autotrophic and heterotrophic components of soil respiration caused by rhizosphere priming effects in a plantation. Plant Soil Environ. 2017, 63, 295–299. [Google Scholar] [CrossRef] [Green Version]
- Song, W.C.; Tong, X.J.; Zhang, J.S.; Meng, P.; Li, J. How a root-microbial system regulates the response of soil respiration to temperature and moisture in a plantation. Pol. J. Environ. Stud. 2018, 27, 2749–2756. [Google Scholar] [CrossRef] [PubMed]
- Liu, C.C.; Liu, Y.G.; Guo, K. Ecophysiological adaptations to drought stress of seedlings of four plant species with different growth forms in karst habitats. Chin. J. Plant Ecol. 2011, 35, 1070–1082. [Google Scholar] [CrossRef]
- Zhang, Z.F.; You, Y.M.; Huang, Y.Q.; Li, X.K.; Zhang, J.C.; Zhang, D.N.; He, C.X. Effects of drought stress on Cyclobalanopsis glauca seedlings under simulating karst environment condition. Acta Ecol. Sin. 2012, 32, 6318–6325. [Google Scholar] [CrossRef]
- Lourenoç, J., Jr.; Newman, E.A.; Ventura, A.J.; Milanez, C.R.; Thomaz, L.D.; Wandekoken, D.T.; Enquist, B.J. Soil-associated drivers of plant traits and functional composition in Atlantic Forest coastal tree communities. Ecosphere 2021, 12, e03629. [Google Scholar] [CrossRef]
- Li, L. Research on the Relationship between Evapotranspiration and Groundwater Based on Remote Sensing Technology. Master’s Thesis, China University of Geosciences, Beijing, China, 2013. [Google Scholar]
- Huo, L.L.; Chen, D.D.; Li, Q.; Zhang, G.L.; He, F.Q.; Shu, M.; Zhao, L. Study on the Relationship between Functional Traits of Grassland Plants and Evapotranspiration in the Sanjiangyuan. Acta Agrestia Sin. 2022, 30, 2182–2190. [Google Scholar] [CrossRef]
- Müller, M.; Schickhoff, U.; Scholten, T.; Drollinger, S.; Böhner, J.; Chaudhary, R.P. How do soil properties affect alpine treelines? General principles in a global perspective and novel findings from Rolwaling Himal, Nepal. Prog. Phys. Geogr. Earth Environ. 2015, 40, 135–160. [Google Scholar] [CrossRef] [Green Version]
- Piao, H.C.; Li, S.L.; Yan, Z.F.; Li, C. Understanding nutrient allocation based on leaf nitrogen isotopes and elemental ratios in the karst region of Southwest China. Agric. Ecosyst. Environ. 2020, 294, 106864. [Google Scholar] [CrossRef]
- Fujii, K.; Shibata, M.; Kitajima, K.; Ichie, T.; Kitayama, K.; Turner, B.L. Plant–soil interactions maintain biodiversity and functions of tropical forest ecosystems. Ecol. Res. 2018, 33, 149–160. [Google Scholar] [CrossRef]
- Sasse, J.; Martinoia, E.; Northen, T. Feed Your Friends: Do Plant Exudates Shape the Root Microbiome? Trends Plant Sci. 2018, 23, 25–41. [Google Scholar] [CrossRef] [Green Version]
- Chalot, M.; Brun, A. Physiology of organic nitrogen acquisition by ectomycorrhizal fungi and ectomycorrhizas. FEMS Microbiol. Rev. 1998, 22, 21–44. [Google Scholar] [CrossRef] [PubMed]
- Wu, H.L.; Xiang, W.H.; Ouyang, S.; Forrester, D.I.; Zhou, B.; Chen, L.X.; Ge, T.D.; Lei, P.F.; Chen, L.; Zeng, Y.L.; et al. Linkage between tree species richness and soil microbial diversity improves phosphorus bioavailability. Funct. Ecol. 2019, 33, 1549–1560. [Google Scholar] [CrossRef]
- Laliberté, E.; Lambers, H.; Burgess, T.I.; Wright, S.J. Phosphorus limitation, soil-borne pathogens and the coexistence of plant species in hyperdiverse forests and shrublands. New Phytol. 2015, 206, 507–521. [Google Scholar] [CrossRef] [PubMed] [Green Version]
- Wang, P.D.; Chen, Y.J.; Sun, Y.T.; Tan, S.; Zhang, S.Y.; Wang, Z.H.; Zhou, J.Z.; Zhang, G.; Shu, W.S.; Luo, C.L.; et al. Distinct biogeography of different fungal guilds and their associations with plant species richness in forest ecosystems. Front. Ecol. Evol. 2019, 7, 216. [Google Scholar] [CrossRef]
- Paliy, O.; Shankar, V. Application of multivariate statistical techniques in microbial ecology. Mol. Ecol. 2016, 25, 1032–1057. [Google Scholar] [CrossRef] [PubMed] [Green Version]
- Lepš, J.; Šmilauer, P. Multivariate Analysis of Ecological Data Using CANOCO; Cambridge Press: Cambridge, UK, 2003. [Google Scholar]
- Legendre, P.; Gallagher, E.D. Ecologically meaningful transformations for ordination of species data. Oecologia 2001, 129, 271–280. [Google Scholar] [CrossRef]


| Category | Abbreviation | Meaning | Unit |
|---|---|---|---|
| Leaf functional traits | LA | leaf area | m2 |
| SLA | specific leaf area | m2·kg | |
| LMA | leaf mass per area | kg·m−2 | |
| LDMC | leaf dry matter content | mg·g−1 | |
| Cm | carbon mass | g·kg−1 | |
| Nm | nitrogen mass | g·kg−1 | |
| Pm | phosphorus mass | g·kg−1 | |
| Km | potassium mass | g·kg−1 | |
| Na | nitrogen mass per area | g·m−2 | |
| Pa | phosphorus mass per area | g·m−2 | |
| Ka | potassium mass per area | g·m−2 | |
| C/N | carbon-to-nitrogen ratio | - | |
| C/P | carbon-to-phosphorus ratio | - | |
| N/P | nitrogen-to-phosphorus ratio | - | |
| δ15N | nitrogen isotope abundance | ‰ | |
| δ13C | carbon isotope abundance | ‰ | |
| Soil characteristics | pH | potential of hydrogen | - |
| EC | electrical conductivity | μS·cm−2 | |
| TOC | total organic carbon | ppm | |
| TN | total nitrogen | ppm | |
| TP | total phosphorus | ppm | |
| TK | total potassium | ppm | |
| AP | available phosphorus | ppm | |
| AK | available potassium | ppm | |
| AAl | available aluminum | ppm | |
| ACa | available calcium | ppm | |
| AMg | available magnesium | ppm | |
| Climatic variables | MAP | mean annual precipitation | mm |
| MAT | mean annual temperature | °C | |
| MAH | mean annual humidity | % | |
| MAE | mean annual evapotranspiration | mm |
Publisher’s Note: MDPI stays neutral with regard to jurisdictional claims in published maps and institutional affiliations. |
© 2022 by the authors. Licensee MDPI, Basel, Switzerland. This article is an open access article distributed under the terms and conditions of the Creative Commons Attribution (CC BY) license (https://creativecommons.org/licenses/by/4.0/).
Share and Cite
Zhou, X.; Xin, J.; Huang, X.; Li, H.; Li, F.; Song, W. Linking Leaf Functional Traits with Soil and Climate Factors in Forest Ecosystems in China. Plants 2022, 11, 3545. https://doi.org/10.3390/plants11243545
Zhou X, Xin J, Huang X, Li H, Li F, Song W. Linking Leaf Functional Traits with Soil and Climate Factors in Forest Ecosystems in China. Plants. 2022; 11(24):3545. https://doi.org/10.3390/plants11243545
Chicago/Turabian StyleZhou, Xingyu, Jiaxun Xin, Xiaofei Huang, Haowen Li, Fei Li, and Wenchen Song. 2022. "Linking Leaf Functional Traits with Soil and Climate Factors in Forest Ecosystems in China" Plants 11, no. 24: 3545. https://doi.org/10.3390/plants11243545