Article

The Effects of Elevated Tropospheric Ozone on Carbon Fixation and Stable Isotopic Signatures of Durum Wheat Cultivars with Different Biomass and Yield Stability

1
State Key Laboratory of Pollution Control and Resources Reuse, College of Environmental Science and Engineering, Tongji University, Shanghai 200092, China
2
Key Laboratory of Yangtze River Water Environment, Ministry of Education, Tongji University, Shanghai 200092, China
3
Department of Agriculture, Food and Environment, University of Pisa, Via del Borghetto, 80, 56124 Pisa, Italy
4
CIRSEC, Centre for Climate Change Impact, University of Pisa, Via del Borghetto, 80, 56124 Pisa, Italy
*
Authors to whom correspondence should be addressed.
These authors contributed equally to this work.
Plants 2022, 11(22), 3185; https://doi.org/10.3390/plants11223185
Submission received: 14 October 2022 / Revised: 9 November 2022 / Accepted: 19 November 2022 / Published: 21 November 2022
(This article belongs to the Special Issue Advances in Cereal Science and Cereal Quality)

Abstract

:
Tropospheric ozone (O3) enrichment caused by human activities can reduce important crop yields with huge economic loss and affect the global carbon cycle and climate change in the coming decades. In this study, two Italian cultivars of durum wheat (Claudio and Mongibello) were exposed to O3 (80 ppb, 5 h day−1 for 70 consecutive days), with the aim to investigate the changes in yield and biomass, ecophysiological traits, and stable carbon and nitrogen isotope values in plants, and to compare the stable isotope responses under environmental stressors. Both cultivars showed a relative O3 tolerance in terms of photosynthetic performance, but in cultivar Mongibello, O3 was detrimental to the grain yield and plant biomass. The δ13C values in the leaves of plants identified that the impact of O3 on CO2 fixation by RuBisCO was dominant. The δ15N value showed significant differences between treatments in both cultivars at seven days from the beginning of the exposure, which could be considered an early indicator of ozone pollution. Under increasingly frequent extreme climates globally, the relationships among stable isotope data, ecophysiological traits, and agronomic parameters could help breed future cultivars.

1. Introduction

Tropospheric ozone (O3) is a major secondary air pollutant [1]. Despite efforts to reduce the emission of O3 precursors (e.g., nitrogen oxides and volatile organic compounds), concentrations of this pollutant are still elevated in many areas worldwide and are expected to rise further due to both anthropogenic activities and climate change [2,3]. Background O3 instantaneous levels in the Northern Hemisphere are estimated to increase from 35–50 ppb to 42–84 ppb in 2100, depending on the seasonal and spatial variability (1 ppb = 1.96 µg m−3, at 25 °C and 101.325 kPa) [4,5,6]. This increase is expected in hot-spot regions such as East Asia and the Mediterranean [7,8,9], although uncertain or even opposite tendencies have been predicted in other regions [10,11,12].
Ozone can severely affect plants by entering through the open stomata and producing reactive oxygen species (ROS), which react with all biological macromolecules [13,14,15]. Although plants can detoxify ROS [16], O3-induced oxidative stress commonly alters physiological processes such as carbon assimilation by inducing partial stomatal closure or less efficient stomatal control, reducing foliar pigment content, impairing the electron transport chain, contracting the efficiency of Calvin Cycle enzymes like RuBisCO, lowering the availability of photosynthates for reallocation, and increasing respiration rates [12,17]. Consequently, crop yield and grain quality would decline. For example, yield loss due to O3 has been predicted to range from 3 to 4% for rice, from 3 to 5% for maize, from 6 to 16% for soybean and from 7 to 12% for wheat [18].
Wheat is one of the most important stable crops worldwide and one of the most O3-sensitive crops [19]. Triticum durum Desf. (durum wheat) is a major member of the genus Triticum, being largely used for its relatively high gluten content [20,21]. It is mainly grown in the Mediterranean area, the Northern Plains between the USA and Canada, and in the desert of southwest of the USA and Northern Mexico, Turkey, Syria, North Africa, and other Asian countries [22,23]. Although most studies have focused on O3 effects on common wheat (T. aestivum L.), durum wheat has also been reported as O3 sensitive (e.g., Chen et al. [24]), even if somewhat contrasting results have been highlighted depending on concentration and duration of O3 exposure, as well as on genotypic differences in O3 tolerance (e.g., Gerosa et al. [25]).
Breeding of higher grain yield in wheat (and other crops) has been frequently related to increased stomatal conductance (gs), which generally fosters higher photosynthetic rates and cools down plants. However, the higher gs can also potentially increase cultivar O3-sensitivity, as they absorb higher amounts of the pollutant [17]. Although O3-induced effects on plants are commonly investigated by discrete gas exchange measurements [17,26], photosynthetic/transpiration responses to environmental stress conditions may be better elucidated through the analysis of the stable carbon (δ13C) and nitrogen (δ15N) isotope compositions [27,28]. The physiological mechanism underlying 13C enrichment in stressed plants is usually attributed to a decrease in gs and an increase in water use efficiency [29]. The δ15N values in plant tissues are instead primarily associated with the isotopic composition of the nitrogen (N) sources (soil, precipitation, N2 fixation, fertilization) and forms (NH4+, NO3-, organic N). It could be further influenced by the N-fixing bacteria and mycorrhizal fungi [30], and the δ15N values will change during N uptake, translocation, assimilation, and reallocation within the plant [31]. Although all these processes are influenced by environmental conditions [29], only a few studies have reported the effects of O3 stress on plant δ13C and δ15N (e.g., Saurer et al. [27]). Since 13C and 15N contents vary with leaf age and plant development, studies investigating variations of these parameters in response to O3 should include leaves at different phenological stages [29].
In our previously published research [24], we investigated the responses of two Italian durum wheat cultivars, i.e., Claudio and Mongibello, exposed to chronic O3 exposure (80 ppb, 5 h day−1, for 70 consecutive days), reporting that Claudio showed a higher O3 tolerance than Mongibello, and characterizing the cultivar-specific phenolic profiles. The present work represents a follow-up aimed at investigating the relationships between the ecophysiological responses and the δ13C and δ15N variations and elucidating the effects of O3 pollution on biomass and yield parameters of the investigated durum wheat cultivars. Outcomes from the present study could be useful for breeding wheat cultivars with a high tolerance to environmental stress.

2. Results and Discussion

2.1. Biomass and Yield Variations Induced by Ozone

Variations of biomass and yield parameters induced by O3 are shown in Table 1. The interaction cultivar (Cv) × O3 was significant for total aboveground biomass, ear and grain dry weight (DW), thousand-grain weight, and the number of grains and spikelets per ear. A significant O3 effect was reported on leaf and stem DW and the number of grains per spikelet. No significant effects were reported on the number of ears per plant. Total aboveground biomass, ear and grain DW, and thousand-grain weight were higher in controls of Mongibello than in Claudio (+32, +49, +54 and +51%, respectively). In Claudio and even more in Mongibello, O3 decreased total aboveground biomass (−30 and −40%, respectively), ear DW (−29 and −40%, respectively), and the number of grains per ear (−29 and −40%). Only in Mongibello, O3 also significantly decreased grain DW, thousand-grain weight, and the number of spikelets per ear (−38, −37 and −15%, respectively). Similarly, between cultivars, O3 reduced leaf and stem DW and the number of grains per spikelet (–32, –37 and –28%, as average, respectively).
The different behavior of these two cultivars in relation to O3 exposure showed that Mongibello was more sensitive, while Claudio was more resistant. Claudio showed a reduction in the ear DW but not in grain DW, although there was a decrease in the number of grains per ear. Therefore, Claudio produced ears with less but larger caryopsis, and the thousand-grain weight under O3 was also not significantly different from that in controls. Moreover, only in Mongibello O3 was detrimental to the most important agronomic parameter, the grain yield. This may be due to the greater sensitivity between inflorescence emission and anthesis during the critic period and decreased photosynthetic activity in Mongibello [32]. Another possible reason is that the photosynthetic pigments may not be exploited as antioxidants, and the delay in the activation of the xanthophyll de-epoxidation cycle has greater photoinhibition-related damages [33,34,35]. Similar conclusions were also carried out by Pleijel et al. [19], who reported that O3 (35.6 ± 10.6 ppb) had significant negative effects on grain yield (−8%), grain mass (−4%), harvest index (−2%), total aboveground biomass (−5%), starch concentration (−3%), starch yield (−11%), and protein yield (−6%) of 19 wheat cultivars, compared with charcoal filtered air (13.7 ± 8.8 ppb of O3). A more quantitative relationship between O3 concentrations and wheat yields was observed by Harmens et al. [15], who reported that wheat yield and thousand-grain weight declined linearly with increasing phytotoxic O3 dose above a flux threshold of Y (PODY). However, the wheat in different regions worldwide showed variant responses to O3. Pleijel et al. [36] compared the influence of O3 on the grain yield, average grain mass, and harvest index of wheat in Europe, Asia, and North America. They found that North American wheat was less sensitive than European and Asian ones, which responded similarly. The variation in responses across all three continents was smallest for the harvest index, followed by grain mass and yield.

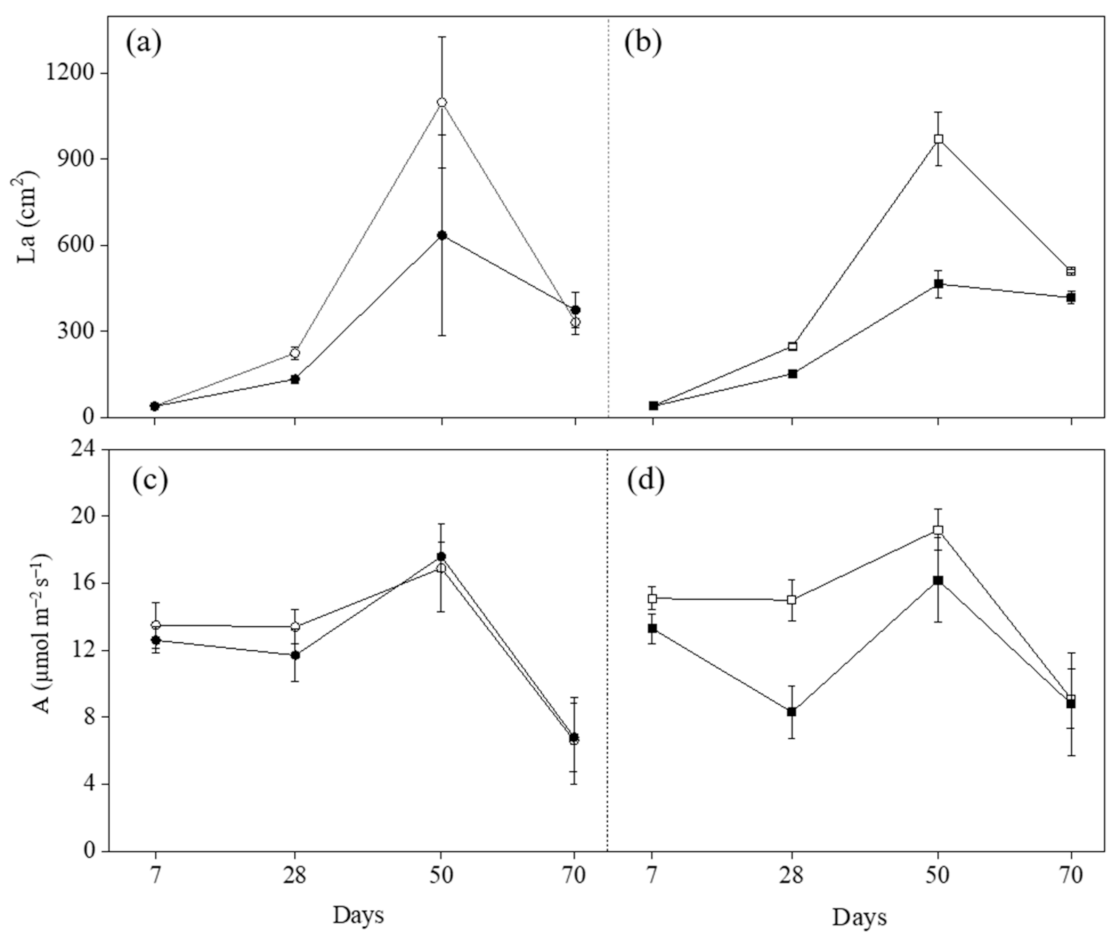
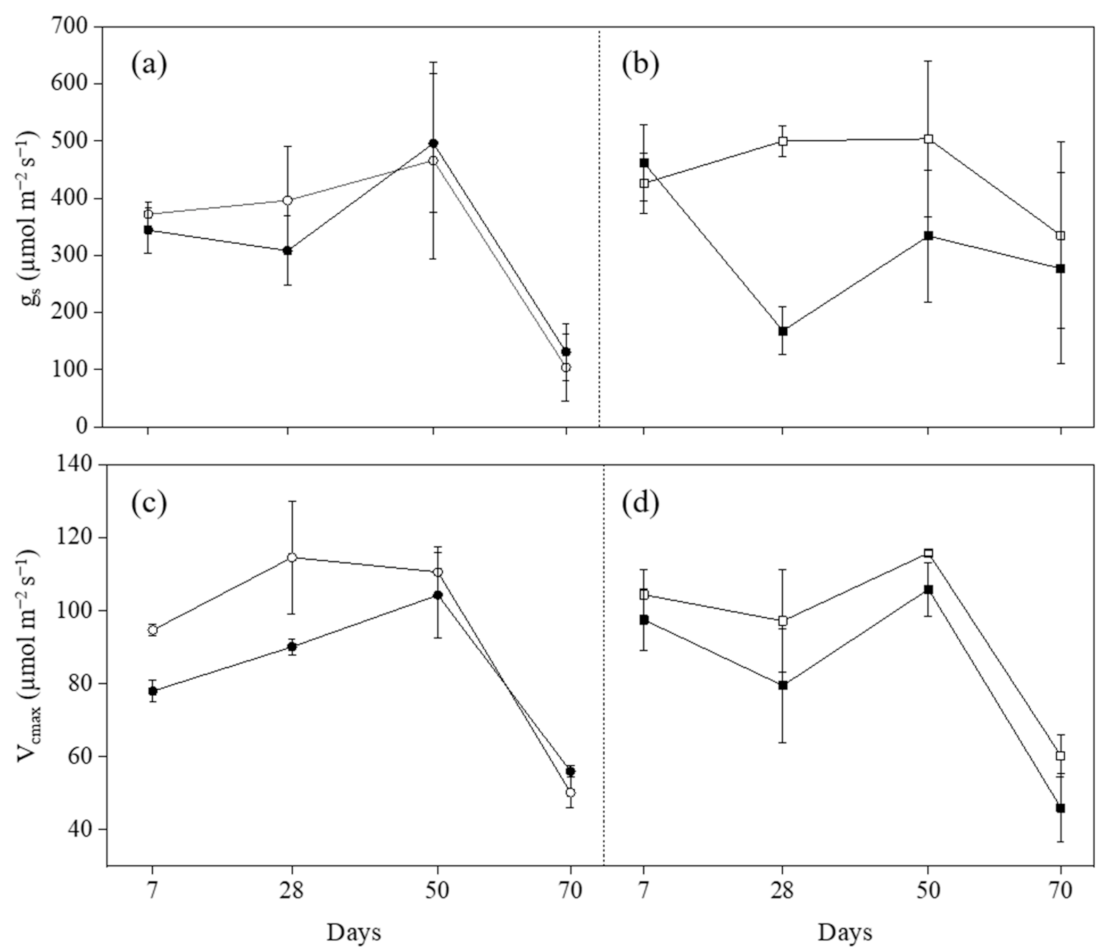
2.2. Leaf Area (La) and Ecophysiological Parameters
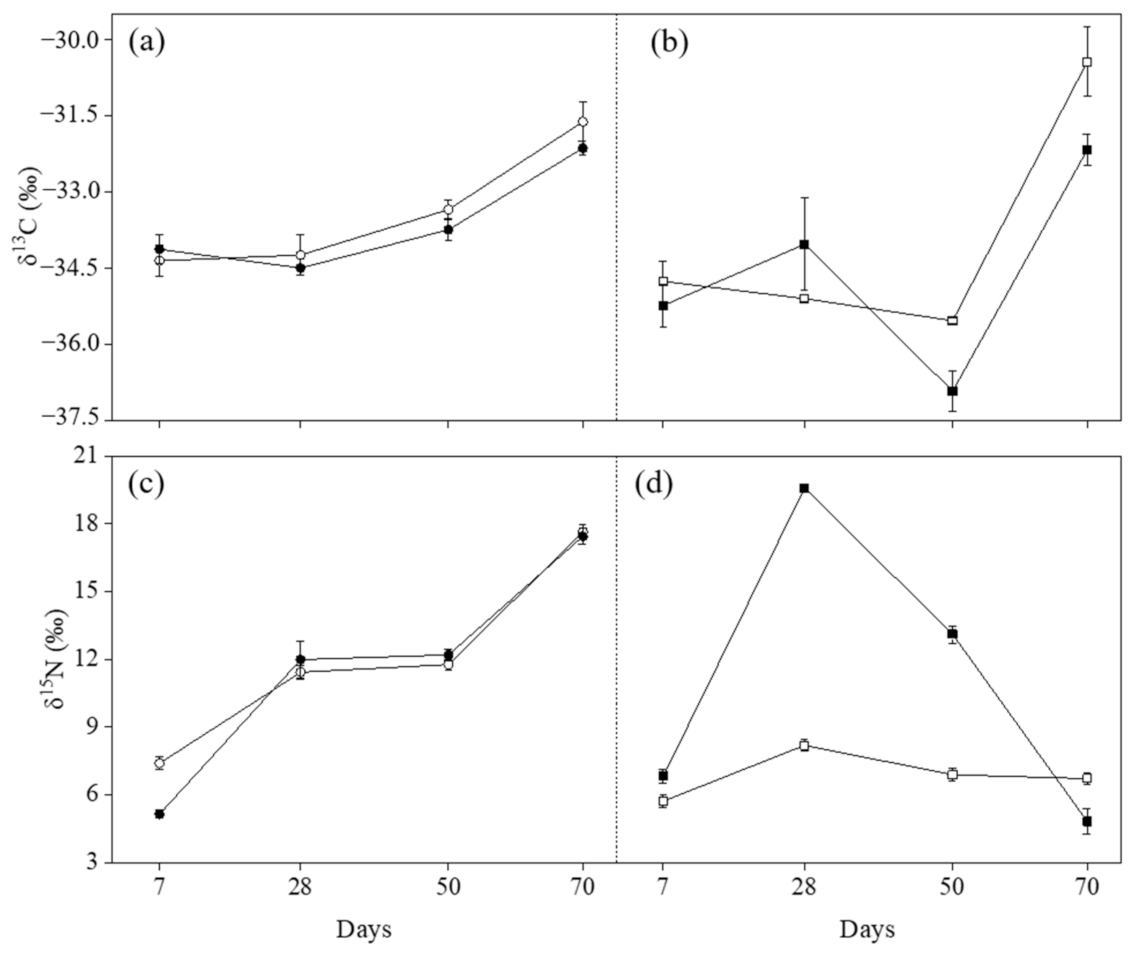
The effects of Cv, O3, growth stage (Gs), and their interactions on leaf area (La), CO2 assimilation rate (A), gs, and maximum RuBP-saturated rate of carboxylation (Vcmax) are reported in Table 2. No significant Cv effect and Cv × O3 × Gs interaction were found for these four indicators, whereas significant O3 × Gs interactions were reported on La and A. Meanwhile, significant Cv × Gs interactions were observed on La, gs, and Vcmax, and a significant Cv × O3 interaction was reported on A. The singular O3 and Gs effects showed significant effects on all of the four indicators.
Variations of La and A induced by O3 are shown in Figure 1, and variations of gs and Vcmax are shown in Figure 2. Ozone significantly decreased La at 50 days from the beginning of exposure (FBE) in both cultivars (−42% in Claudio and −52% in Mongibello; Table 3). The differences in La between Claudio and Mongibello at all growth stages were not significant in controls or exposed to O3 (Table 3). The La in both cultivars increased at 28 and 50 days FBE and decreased at 70 days FBE due to the senescence of plants. A significant reduction of A was observed at 28 and 50 days FBE in Mongibello exposed to O3 (−45% and −16%, respectively; Table 3), and A was lower at 70 days FBE in both cultivars compared with the other three growth stages [24]. Similarly to A, O3 decreased gs at 28 and 50 days FBE in Mongibello (−66% and −34%, respectively; Table 3). The gs in Claudio decreased at 70 days FBE compared with the previous growth stage in both groups (controls and O3-treated groups), while the difference in Mongibello was only observed in controls (Table 3). The significant differences between treatments were shown at 7 and 28 days FBE in Claudio and 28 days FBE in Mongibello for Vcmax (Table 3). In Claudio, the Vcmax in O3-treated plants was 18% and 21% lower than that in controls at 7 and 28 days FBE, respectively, and in Mongibello, the Vcmax in O3-treated plants was 18% lower than that in controls at 28 days FBE. The Vcmax decreased at 70 days FBE in both treatments for both cultivars.
Notably, positive correlations were found among the ecophysiological traits in both Claudio and Mongibello (Figure 3). The correlation coefficients for A with gs and Vcmax were 0.96 and 0.87 in Claudio, and 0.78 and 0.88 in Mongibello, while that for gs with Vcmax were 0.90 and 0.59 in Claudio and Mongibello, respectively. The correlation coefficients for La with A, gs, and Vcmax were relatively small, and they were 0.45, 0.43, and 0.34 in Claudio and 0.37, 0.19, and 0.09 in Mongibello.
La, A, gs, and Vcmax are all widely used photo-oxidative stress markers [37]. In this study, the reductions of La in both cultivars were only observed at 50 days FBE, and the reductions of A and gs were only observed in Mongibello at 28 and 50 days FBE. The reductions of Vcmax were shown at 7 and 28 days FBE in Claudio and 28 days FBE in Mongibello. All these traits later recovered the same levels of control. These results indicate a relative O3 tolerance of durum wheat in photosynthetic performance, and the photosynthetic performance between the two cultivars was similar. Similar conclusions were reached in previous studies on other cultivars of wheat [24,25,38,39]. However, the temporary decrease of photosynthetic activity during the critic period (at 7, 28, and 50 days FBE) was demonstrated, and as mentioned above, this may be an important reason for the O3-induced reductions of some biomass and yield parameters in wheat cultivars.

2.3. δ13C Values

Ozone induced an increase of δ13C values at 28 days FBE (+1.070‰) and a significant decrease of δ13C values at 50 and 70 days FBE in Mongibello (−1.387‰ and −1.739‰, respectively; Figure 4b; Table 3), while the δ13C differences between treatments in Claudio at all of the growth stages and in Mongibello at seven days FBE were not significant (Figure 4a,b; Table 3). The δ13C values changed gently at 7, 28, and 50 days FBE in both cultivars, but the values increased significantly at 70 days FBE with the senescence of plants (Figure 4a,b). Significant Cv × O3 × Gs interactions were found for both δ13C and δ15N (actually, only the Cv × O3 effect on δ13C was not significant; Table 4).
12CO2 is preferred to plants compared with 13CO2 during photosynthetic CO2 assimilation, and both CO2 diffusion across the stomata and CO2 fixation by RuBisCO could contribute to the discrimination of 13CO2 in favor of 12CO2 in C3 plants [27,40]. The metabolic capacity decreases with the senescence of plants, and the δ13C values in the plants had an upward trend through time, especially at 70 days FBE (Figure 4a,b). The δ13C value in the air (δ13Cair) is about −8‰, and that in the C3 plants (δ13Cplant) ranges from −36‰ to −22‰ [41,42], the plant is isotopically lighter than atmospheric CO2, and their relationship could be quantitatively described using the following equation [27,43,44].
δ13Cplant = δ13Caira−(ba)(pi/pa)
where a is the fractionation occurring due to diffusion, and the value is about +4.4‰; b is the net fractionation caused by carboxylation (mainly by RuBisCO), and the value is about +27‰; pi is the partial pressure of CO2 in the mesophyll; pa is the partial pressure of CO2 in ambient air.
As is shown in Equation (1), when the gs limits photosynthesis, the pi/pa value is relatively low, leading to a relatively small fractionation and less δ13C negative values compared to controls [44]. The other situation is that when the impact on CO2 fixation by RuBisCO is dominant, the increase in pi/pa value will result in larger fractionation and more negative δ13C values [43]. Therefore, the carbon isotopic composition of plants is a good indicator to show how some environmental conditions (e.g., air pollutants, water availability, temperature) affect the uptake and fixation of CO2. In this study, A and gs at 28 and 50 days FBE in Mongibello decreased significantly, and these traits returned to control values (Figure 1d and Figure 2b). Vcmax showed significant reductions only at 28 days FBE (Figure 2d). However, the grain yield and biomass of plants still decreased significantly (Table 1). The δ13C values could better explain this phenomenon under the long-term accumulated O3 exposure condition, and the impact of O3 on CO2 fixation by RuBisCO was dominant. In other words, the process of CO2 fixation by RuBisCO is more sensitive to O3 than the stomatal conductance in Mongibello. Correlation analysis further verified this conclusion (Figure 3). In Mongibello, the correlation coefficients for δ13C with Vcmax and A were –0.80 and –0.71, respectively, while that for δ13C with the stomatal conductance was only –0.33. In Claudio, the correlation for δ13C with Vcmax (–0.73) was stronger than with gs (–0.67), and the correlation coefficient for δ13C with A was –0.64. Therefore, the δ13C values well explained why the temporary decrease of photosynthetic activity during the critic period (at 28 and 50 days FBE) affected the O3-induced reductions of some yield parameters.

2.4. δ15N Values

In Claudio, O3 only induced a significant reduction of δ15N values at seven days FBE (−2.252‰; Table 3), and the δ15N values increased through time in controls and O3-treated plants, especially at 28 and 70 days FBE (Figure 4c). In Mongibello, significant differences in δ15N values between treatments were observed at all of the growth stages (Table 3). O3 increased the δ15N values at 7, 28, and 50 days FBE (+1.105‰, +11.402‰, and +6.224‰, respectively) and decreased the values at 70 days FBE (−1.895‰). The δ15N values in both treatments increased at 28 days FBE and then decreased at 50 and 70 days FBE, which was especially noticeable in O3-treated plants (Figure 4d).
The δ15N value is also a commonly applicable ecotoxicological indicator of O3 pollution early on, as significant differences between treatments were observed in both cultivars at seven days FBE (Table 3). Claudio recovered later, while O3-treated Mongibello showed a significant increase in the δ15N values at 7, 28, and 50 days FBE compared with the control treatment (Figure 4c,d; Table 3). Previous studies proved the most significant changes in the isotope ratios in the non-protein nitrogen fraction, followed by the soluble protein and the structural protein fractions [45,46], and this enrichment could be explained by accelerated N metabolism. Furthermore, wheat leaves exposed to O3 increased their permeability to soluble substances such as amino acids and proteins before the visible injury, caused by membrane alterations [47]. Such a leakage led to the enrichment of the proportion of N-containing substances with larger δ15N values according to general isotope effects [48]. In addition, plants react to O3 stress by narrowing their stomatal openings at the following growth stages, N fixation is changed from the air more towards the soil, which has higher δ15N values compared with N in the air [49]. The correlation coefficient of –0.48 for δ15N with the gs in Mongibello could verify this inference (Figure 3). It should also be noted that O3 exposure was not the only reason causing the stable isotope responses. Other stresses, such as heat and drought, might give similar responses to those shown in this study. Therefore, more information is needed to determine wheat’s characteristic stable isotope responses of wheat under different stress conditions.
The stable isotope data in plants is a good indicator and recorder of historical environmental information. Under increased frequent extreme climates globally [50], the δ13C and δ15N values in wheat can tell humans what kind of climatic conditions they have encountered, and the relationships among stable isotope data, ecophysiological traits, and agronomic parameters could help screen more tolerant crops quickly and efficiently in the early stage and eventually benefit breeding future cultivars.

3. Materials and Methods

3.1. Plant Material and Ozone Exposure

Details of plant material and O3 exposure used in the experimental activity are already reported by Chen et al. [24]. In short, seeds of durum wheat cultivars Claudio and Mongibello were sown in plastic pots, which were then maintained in a greenhouse under charcoal-filtered air until the stage of “first leaf unfolded/second leaves unfolded” (BBCH-Code [BBCH-C] 11–12, i.e., 20-day-old seedlings) [51]. Uniform-sized seedlings were then distributed among four had hoc built perspex fumigation chambers (595 × 540 × 1975 mm; two chambers per treatment; twelve seedings per chamber (three plants for each collection period)) and exposed to charcoal-filtered air (controls, assumed as 0 ppb of O3) or a target concentration of 80 ± 10 ppb of O3 (ca. 160 µg m−3 at 20 °C and 101.3 kPa, 5 h day−1, in the form of a square wave between 10:00 and 15:00 h) for 70 consecutive days. For further details about fumigation facilities, plant management, and environmental conditions, see Landi et al. [52] and Chen et al. [24].
Ecophysiological analyses and leaf (the third fully expanded mature leaves) collections for δ13C and δ15N investigations of control and O3-treated plants were performed at seven (BBCH-C 13), 28 (BBCH-C 23–32), 50 (BBCH-C 59) and 70 (BBCH-C 65–69) days FBE. For each combination of cultivar, O3 treatment, and time, two completely expanded leaves were collected, mixed, divided into aliquots, instantly frozen in liquid nitrogen, and stored at −80 °C until δ13C and δ15N analyses. At the end of the exposure, biomass and yield parameters were also assessed (see Section 3.4).

3.2. Leaf Area (La) and Ecophysiological Analyses

La was measured using a Leaf Area Meter (YMJ-G, Fengtu, Shandong, China). Ecophysiological analyses were carried out between 11:00 and 13:00 h (i.e., when maximum gas exchanges usually occur) on one completely expanded leaf per plant [24]. The A and the Vcmax were measured under light-saturated conditions (photosynthetic active radiation of about 1200 μmol photons m−2 s−1), ambient CO2 concentration (ca. 390 μmol mol−1) and 60% of relative humidity, using an Infrared Gas Analyzer (CIRAS-1; PP-Systems, Hitchin, Hertfordshire, UK). The acclimation time for the leaves before the measurements were 40 min. One fully expanded mature leaf per plant and three plants per treatment were chosen for the measurements. Stomatal conductance was measured using a Stomatal Conductance Meter (FS-3080C, Fangsheng, Heibei, China).

3.3. δ13C and δ15N

The C isotopic composition of a sample is expressed on the δ13C scale, defined as Equation (2).
δ C 13 = C 13 / C 12 s a m p l e C 13 / C 12 s t a n d a r d C 13 / C 12 s t a n d a r d × 1000
where 13C/12C is the ratio of the number of 13C atoms to the number of 12C atoms in the sample or standard. Vienna Pee Dee Belemnite (V-PDB) was the standard, defined as 0‰ [53].
The N isotopic composition of a sample is expressed on the δ15N scale, defined as Equation (3).
δ N 15 = N 15 / N 14 s a m p l e N 15 / N 14 s t a n d a r d N 15 / N 14 s t a n d a r d × 1000
where 15N/14N is the ratio of the number of 15N atoms to the number of 14N atoms in the sample or standard. The atmospheric air was used as the standard, defined as 0‰ [54].
For each combination of cultivar, O3 treatment, and time, 400 μg of leaves were collected and wrapped in a tin foil cup. Triplicates of δ13C and δ15N analyses of each sample were performed by an Element Analyzer-Isotope Ratio Mass Spectrometer (EA-IRMS, Thermo Fisher, Waltham, MA, USA). The EA was set as follows: the helium pressure (99.999%) was 250 kPa, and the flow rate was 100 mL min−1. The reference flow rate of the Thermal Conductivity Detector was 80 mL/min−1, and the temperature of the Oxidation Furnace and Reduction Furnace was 960 °C and 680 °C, respectively. The chromatographic column was a packed column whose temperature was 55 °C. The pressure of oxygen (99.999%) was 300 kPa, and the flow rate was 180 mL min−1. The oxygen injection time was 1 s. The IRMS was operated at an accelerating potential of 10 kV. Ions were generated by an electron impact of 70 eV. The emitted energy for δ13C analysis was 1.5 mA, and it was 2.0 mA for δ15N analysis.
The reference materials for the calibration of 13C were caffeine (IAEA-600), carbamide (UREA), and L-glutamic acid (USGS 41). Their stable carbon isotope ratios relative to V-PDB were −1.17‰, −48.63‰, and 37.626‰, respectively. The reference materials for calibration of 15N were caffeine (IAEA-600), potassium nitrate (IAEA-NO-3), carbamide (UREA), and L-glutamic acid (USGS 41). Their stable nitrogen isotope ratios relative to atmospheric air were 37.83‰, 4.70‰, −0.30‰, and 47.6‰, respectively. All reference materials were from Sigma-Aldrich (Shanghai, China).

3.4. Determinations of Biomass and Yield Parameters

The leaves, stems, ears, and grains of the durum wheat in fully ripe and developed condition were placed in an oven at 103 °C for 24 h and weighed to calculate the biomass (g DW). The biomass sum of the leaves, stems, and ears was calculated to obtain the total above-ground biomass (g DW). The number (n) of ears plant−1, grains ear−1, spikelets ear−1, and grains spikelet−1 were obtained by manual counting. Thousand-grain weight (g) of the durum wheat was given by:
Thousand   grain   weight   g = Grain   weight   plant 1 g   DW Ears   plant 1 n × Grains   ear 1 n × 1000

3.5. Statistics

The normal distribution of data was preliminary analyzed following the Shapiro–Wilk test. The effects of the cultivar (Cv), growth stage (Gs), O3 exposure (O3), and their interactions on ecophysiological traits and δ13C and δ15N values were tested using a three-way analysis of variance (ANOVA). The effects of Cv and O3 and their interaction on biomass and yield parameters investigated at the end of the exposure were tested using a two-way ANOVA. The Tukey HSD test was used as the post hoc test. Relations among ecophysiological traits and δ13C and δ15N values were evaluated using Pearson’s correlations. Effects with p ≤ 0.05 were considered statistically significant. Statistical analyses were carried out in SPSS version 25 (IBM, New York, NY, USA).

4. Conclusions

The tropospheric O3 enrichment caused by human activities in the coming decades can reduce the yields of important crops with a huge economic loss worldwide. Though O3 is unlikely to be the only stress during plants’ growth and development, the variation of stable carbon (δ13C) and nitrogen (δ15N) isotope values in the leaves is a useful tool to understand the response of the carbon sequestration mechanism of plants, and it was also found to be a potential marker for the ecophysiological traits of plants at all the stages of growth. In this study, the durum wheat cultivar Mongibello showed a significant reduction in grain yield and plant biomass, and the cultivar Claudio showed a relative O3 tolerance. The δ13C values explained the mechanism of the O3-induced reductions of some yield parameters, and the δ15N values played an important role in the early indication of oxidative stress.

Author Contributions

Conceptualization, L.M., C.N. and G.L.; methodology, L.M. and C.C.; software, C.C.; validation, L.C.; formal analysis, C.B.; investigation, L.M. and C.C.; resources, C.N. and G.L.; data curation, J.L.; writing—original draft preparation, C.C.; writing—review and editing, L.M. and L.C.; visualization, G.Y.; supervision, G.C.; project administration, W.Z.; funding acquisition, L.M., C.N. and G.L. All authors have read and agreed to the published version of the manuscript.

Funding

This research was funded by the National Science and Technology Major Project of China (2018YFC1803100) and the Natural Science Foundation of China (21377098).

Institutional Review Board Statement

Not applicable.

Informed Consent Statement

Not applicable.

Data Availability Statement

The data presented in this study are available on request from the corresponding authors.

Acknowledgments

This research was also supported by the University of Pisa, Italy. Thanks are due to Andrea Parrini for his technical support to carry out the experiments and to Elisa Pellegrini for helpful discussion of results.

Conflicts of Interest

The authors declare no conflict of interest.

References

  1. Monks, P.S.; Archibald, A.T.; Colette, A.; Cooper, O.; Coyle, M.; Derwent, R.; Fowler, D.; Granier, C.; Law, K.S.; Mills, G.E.; et al. Tropospheric ozone and its precursors from the urban to the global scale from air quality to short-lived climate forcer. Atmos. Chem. Phys. 2015, 15, 8889–8973. [Google Scholar] [CrossRef] [Green Version]
  2. Lefohn, A.S.; Malley, C.S.; Smith, L.; Wells, B.; Hazucha, M.; Simon, H.; Naik, V.; Mills, G.; Schultz, M.G.; Paoletti, E.; et al. Tropospheric ozone assessment report: Global ozone metrics for climate change, human health, and crop/ecosystem research. Elem. Sci. Anthr. 2018, 6, 28. [Google Scholar] [CrossRef] [PubMed] [Green Version]
  3. Sage, R.F. Global change biology: A primer. Glob. Chang. Biol. 2020, 26, 3–30. [Google Scholar] [CrossRef] [PubMed]
  4. Field, C.B.; Barros, V.R.; Mach, K.J.; Mastrandrea, M.D.; Aalst, M.V.; Adger, W.N.; Arent, D.J.; Barnett, J.; Betts, R.; Bilir, T.E.; et al. International Panel on Climate Change (IPCC) Climate change 2014: Impacts, adaptation, and vulnerability. Part A: Global and sectoral aspects. In Contribution of Working Group II to the Fifth Assessment Report of the Intergovernmental Panel on Climate Change; Cambridge University Press: Cambridge, UK, 2014; pp. 1–32. [Google Scholar]
  5. Yang, N.; Cotrozzi, L.; Zhang, Y.; Wang, X.; Ouyang, Z.; Zheng, F. First defense mechanisms of ornamental species suitable for urban green spaces in China exposed to ozone. Urban For. Urban Green. 2018, 36, 68–75. [Google Scholar] [CrossRef]
  6. Cotrozzi, L.; Pellegrini, E.; Nali, C.; Lorenzini, G. Climate change, ozone and plant life. Agrochimica 2019, 62, 181–188. [Google Scholar]
  7. Verstraeten, W.W.; Neu, J.L.; Williams, J.E.; Bowman, K.W.; Worden, J.R.; Boersma, K.F. Rapid increases in tropospheric ozone production and export from China. Nat. Geosci. 2015, 8, 690–695. [Google Scholar] [CrossRef]
  8. Ochoa-Hueso, R.; Munzi, S.; Alonso, R.; Arroniz-Crespo, M.; Avila, A.; Bermejo, V.; Bobbink, R.; Branquinho, C.; Concostrina-Zubiri, L.; Cruz, C.; et al. Ecological impacts of atmospheric pollution and interactions with climate change in terrestrial ecosystems of the Mediterranean Basin: Current research and future directions. Environ. Pollut. 2017, 227, 194–206. [Google Scholar] [CrossRef] [Green Version]
  9. Ridley, D.A.; Cain, M.; Methven, J.; Arnold, S.R. Sensitivity of tropospheric ozone to chemical kinetic uncertainties in air masses influenced by anthropogenic and biomass burning emissions. Geophys. Res. Lett. 2017, 44, 7472–7481. [Google Scholar] [CrossRef]
  10. Watson, L.; Lacressonnière, G.; Gauss, M.; Engardt, M.; Andersson, C.; Josse, B.; Marécal, V.; Nyiri, A.; Sobolowski, S.; Siour, G.; et al. Impact of emissions and +2 °C climate change upon future ozone and nitrogen dioxide over Europe. Atmos. Environ. 2016, 142, 271–285. [Google Scholar] [CrossRef]
  11. Sicard, P.; Anav, A.; De Marco, A.; Paoletti, E. Projected global ground-level ozone impacts on vegetation under different emission and climate scenarios. Atmos. Chem. Phys. 2017, 17, 12177–12196. [Google Scholar] [CrossRef] [Green Version]
  12. Ainsworth, E.A. Understanding and improving global crop response to ozone pollution. Plant. J. 2017, 90, 886–897. [Google Scholar] [CrossRef] [PubMed]
  13. Ahmed Bhuiyan, M.; Rashid Khan, H.U.; Zaman, K.; Hishan, S.S. Measuring the impact of global tropospheric ozone, carbon dioxide and sulfur dioxide concentrations on biodiversity loss. Environ. Res. 2018, 160, 398–411. [Google Scholar] [CrossRef] [PubMed]
  14. Nuvolone, D.; Petri, D.; Voller, F. The effects of ozone on human health. Environ. Sci. Pollut. Res. Int. 2018, 25, 8074–8088. [Google Scholar] [CrossRef]
  15. Harmens, H.; Hayes, F.; Mills, G.; Sharps, K.; Osborne, S.; Pleijel, H. Wheat yield responses to stomatal uptake of ozone: Peak vs. rising background ozone conditions. Atmos. Environ. 2018, 173, 1–5. [Google Scholar] [CrossRef] [Green Version]
  16. Burkey, K.O.; Neufeld, H.S.; Souza, L.; Chappelka, A.H.; Davison, A.W. Seasonal profiles of leaf ascorbic acid content and redox state in ozone-sensitive wildflowers. Environ. Pollut. 2006, 143, 427–434. [Google Scholar] [CrossRef] [PubMed]
  17. Chang-Espino, M.; González-Fernández, I.; Alonso, R.; Araus, J.L.; Bermejo-Bermejo, V. The effect of increased ozone levels on the stable carbon and nitrogen isotopic signature of wheat cultivars and landraces. Atmosphere 2021, 12, 883. [Google Scholar] [CrossRef]
  18. Van Dingenen, R.; Dentener, F.J.; Raes, F.; Krol, M.C.; Emberson, L.; Cofala, J. The global impact of ozone on agricultural crop yields under current and future air quality legislation. Atmos. Environ. 2009, 43, 604–618. [Google Scholar] [CrossRef]
  19. Pleijel, H.; Broberg, M.C.; Uddling, J.; Mills, G. Current surface ozone concentrations significantly decrease wheat growth, yield and quality. Sci. Total Environ. 2018, 613–614, 687–692. [Google Scholar] [CrossRef]
  20. Šramková, Z.; Gregová, E.; Šturdík, E. Chemical composition and nutritional quality of wheat grain. Acta Chim. Slovaca 2009, 2, 115–138. [Google Scholar]
  21. Cotrozzi, L.; Lorenzini, G.; Nali, C.; Pisuttu, C.; Pampana, S.; Pellegrini, E. Transient waterlogging events impair shoot and root physiology and reduce grain yield of durum wheat cultivars. Plants 2021, 10, 2357. [Google Scholar] [CrossRef]
  22. Kadkol, G.P.; Sissons, M. Durum wheat: Overview. Encycl. Food Grain 2016, 1, 117–124. [Google Scholar]
  23. Li, L.; Niu, Y.; Ruan, Y.; DePauw, R.; Singh, A.; Gan, Y. Agronomic advancement in tillage, crop rotation, soil health, and genetic gain in durum wheat cultivation: A 17-year Canadian story. Agronomy 2018, 8, 193. [Google Scholar] [CrossRef] [Green Version]
  24. Chen, C.; Chen, S.; Jha, R.K.; Cotrozzi, L.; Nali, C.; Lorenzini, G.; Ma, L. Phenol metabolism of two cultivars of durum wheat (Triticum durum Desf.) as affected by ozone and flooding stress. J. Agron. Crop Sci. 2020, 206, 338–351. [Google Scholar] [CrossRef]
  25. Gerosa, G.; Marzuoli, R.; Finco, A.; Monga, R.; Fusaro, I.; Faoro, F. Contrasting effects of water salinity and ozone concentration on two cultivars of durum wheat (Triticum durum Desf.) in Mediterranean conditions. Environ. Pollut. 2014, 193, 13–21. [Google Scholar] [CrossRef]
  26. Cotrozzi, L.; Remorini, D.; Pellegrini, E.; Guidi, L.; Nali, C.; Lorenzini, G.; Massai, R.; Landi, M. Living in a Mediterranean city in 2050: Broadleaf or evergreen ‘citizens’? Environ. Sci. Pollut. Res. Int. 2018, 25, 8161–8173. [Google Scholar] [CrossRef] [PubMed]
  27. Saurer, M.; Fuhrer, J.; Siegenthaler, U. Influence of ozone on the stable carbon isotope composition, δ13C, of leaves and grain of spring wheat (Triticum aestivum L.). Plant. Physiol. 1991, 97, 313–316. [Google Scholar] [CrossRef] [PubMed] [Green Version]
  28. Araus, J.L.; Cabrera-Bosquet, L.; Serret, M.D.; Bort, J.; Nieto-Taladriz, M.T. Comparative perofrmance of δ13C, δ18O and δ15N for phenotyping durum wheat adaptation to a dryland environment. Funct. Plant Biol. 2013, 40, 595–608. [Google Scholar] [CrossRef]
  29. Spangenberg, J.E.; Schweizer, M.; Zufferey, V. Shifts in carbon and nitrogen stable isotope composition and epicuticular lipids in leaves reflect early water-stress in vineyards. Sci. Total Environ. 2020, 739, 140343. [Google Scholar] [CrossRef]
  30. Högberg, P. Tansley review no 95—15N natural abundance in soil-plant systems. New Phytol. 1997, 137, 179–203. [Google Scholar] [CrossRef]
  31. Evans, R.D. Physiological mechanisms influencing plant nitrogen isotope composition. Trends Plant Sci. 2001, 6, 121–126. [Google Scholar] [CrossRef]
  32. Reichenauer, T.G.; Goodman, B.A.; Kostecki, P.; Soja, G. Ozone sensitivity in Triticum durum and T. aestivum with respect to leaf injury, photosynthetic activity and free radical content. Physiol. Plant. 2010, 104, 681–686. [Google Scholar] [CrossRef]
  33. Rai, R.; Agrawal, M.; Agrawal, S.B. Effects of ambient O3 on wheat during reproductive development: Gas exchange, photosynthetic pigments, chlorophyll fluorescence, and carbohydrates. Photosynthetica 2011, 49, 285–294. [Google Scholar] [CrossRef]
  34. Feng, Z.; Jiang, L.; Calatayud, V.; Dai, L.; Paoletti, E. Intraspecific variation in sensitivity of winter wheat (Triticum aestivum L.) to ambient ozone in northern China as assessed by ethylenediurea (EDU). Environ. Sci. Pollut. Res. Int. 2018, 25, 29208–29218. [Google Scholar] [CrossRef] [PubMed]
  35. Latowski, D.; Grzyb, J.; Strzałka, K. The xanthophyll cycle—Molecular mechanism and physiological significance. Acta Physiol. Plant. 2004, 26, 197–212. [Google Scholar] [CrossRef]
  36. Pleijel, H.; Broberg, M.C.; Uddling, J. Ozone impact on wheat in Europe, Asia and North America—A comparison. Sci. Total Environ. 2019, 664, 908–914. [Google Scholar] [CrossRef]
  37. Fenollosa, E.; Munné-Bosch, S. Photoprotection and photo-oxidative stress markers as useful tools to unravel plant invasion success. In Advances in Plant Ecophysiology Techniques; Sánchez-Moreiras, A., Reigosa, M., Eds.; Springer: Cham, Switzerland, 2018; pp. 153–175. [Google Scholar]
  38. Herbinger, K.; Tausz, M.; Wonisch, A.; Soja, G.; Sorger, A.; Grill, D. Complex interactive effects of drought and ozone stress on the antioxidant defence systems of two wheat cultivars. Plant. Physiol. Biochem. 2002, 40, 691–696. [Google Scholar] [CrossRef]
  39. Monga, R.; Marzuoli, R.; Alonso, R.; Bermejo, V.; González-Fernández, I.; Faoro, F.; Gerosa, G. Varietal screening of ozone sensitivity in Mediterranean durum wheat (Triticum durum, Desf.). Atmos. Environ. 2015, 110, 18–26. [Google Scholar] [CrossRef]
  40. Hare, V.J.; Loftus, E.; Jeffrey, A.; Ramsey, C.B. Atmospheric CO2 effect on stable carbon isotope composition of terrestrial fossil archives. Nat. Commun. 2018, 9, 252. [Google Scholar] [CrossRef] [Green Version]
  41. Lomax, B.H.; Knight, C.A.; Lake, J.A. An experimental evaluation of the use of C3 δ13C plant tissue as a proxy for the paleoatmospheric δ13CO2 signature of air. Geochem. Geophys. Geosystems 2012, 13, Q0AI03. [Google Scholar] [CrossRef] [Green Version]
  42. Zhang, T.; Wang, X. Stable carbon isotope and long-chain alkane compositions of the major plants and sediment organic matter in the Yellow River estuarine wetlands. J. Ocean. Univ. China 2019, 18, 735–742. [Google Scholar] [CrossRef]
  43. Iniguez, C.; Capo-Bauca, S.; Niinemets, U.; Stoll, H.; Aguilo-Nicolau, P.; Galmes, J. Evolutionary trends in RuBisCO kinetics and their co-evolution with CO2 concentrating mechanisms. Plant. J. 2020, 101, 897–918. [Google Scholar] [CrossRef] [PubMed] [Green Version]
  44. Twohey, R.J., III; Roberts, L.M.; Studer, A.J. Leaf stable carbon isotope composition reflects transpiration efficiency in Zea mays. Plant J. 2019, 97, 475–484. [Google Scholar] [CrossRef] [PubMed] [Green Version]
  45. Hofmann, D.; Jung, K.; Bender, J.; Gehre, M.; Schuurmann, G. Using natural isotope variations of nitrogen in plants as an early indicator of air pollution stress. J. Mass Spectrom. 1997, 32, 855–863. [Google Scholar] [CrossRef]
  46. Pandey, A.K.; Ghosh, A.; Agrawal, M.; Agrawal, S.B. Effect of elevated ozone and varying levels of soil nitrogen in two wheat (Triticum aestivum L.) cultivars: Growth, gas-exchange, antioxidant status, grain yield and quality. Ecotoxicol. Environ. Saf. 2018, 158, 59–68. [Google Scholar] [CrossRef]
  47. Alwi, N.A.; Ali, A. Dose-dependent effect of ozone fumigation on physiological characteristics, ascorbic acid content and disease development on bell pepper (Capsicum annuum L.) during storage. Food Bioprocess Technol. 2014, 8, 558–566. [Google Scholar] [CrossRef]
  48. Trandel, M.A.; Vigardt, A.; Walters, S.A.; Lefticariu, M.; Kinsel, M. Nitrogen isotope composition, nitrogen amount, and fruit yield of tomato plants affected by the soil-fertilizer types. ACS Omega 2018, 3, 6419–6426. [Google Scholar] [CrossRef]
  49. Chen, C.; Li, J.; Wang, G.; Shi, M. Accounting for the effect of temperature in clarifying the response of foliar nitrogen isotope ratios to atmospheric nitrogen deposition. Sci. Total Environ. 2017, 609, 1295–1302. [Google Scholar] [CrossRef]
  50. Anand, A.; Kaur, G.; Bammidi, S.; Mathur, D.; Battu, P.; Sharma, K.; Tyagi, R.; Pannu, V.; Bhanushali, D.; Limaye, N. Primer for mainstreaming Mind-Body techniques for extreme climates-insights and future directions. Medicines 2020, 7, 12. [Google Scholar] [CrossRef] [Green Version]
  51. Lancashire, P.D.; Bleiholder, H.; Boom, T.V.D.; Langeluddeke, P.; Stauss, R.; Weber, E.; Witzenberger, A. A uniform decimal code for growth stages of crops and weeds. Ann. Appl. Biol. 1991, 119, 561–601. [Google Scholar] [CrossRef]
  52. Landi, M.; Cotrozzi, L.; Pellegrini, E.; Remorini, D.; Tonelli, M.; Trivellini, A.; Nali, C.; Guidi, L.; Massai, R.; Vernieri, P.; et al. When “thirsty” means “less able to activate the signalling wave trigged by a pulse of ozone”: A case of study in two Mediterranean deciduous oak species with different drought sensitivity. Sci. Total Environ. 2019, 657, 379–390. [Google Scholar] [CrossRef]
  53. Davidson, J.A.; Cantrell, C.A.; Tyler, S.C.; Shetter, R.E.; Cicerone, R.J.; Calvert, J.G. Carbon kinetic isotope effect in the reaction of CH4 with HO. J. Geophys. Res. Atmos. 1987, 92, 2195–2199. [Google Scholar] [CrossRef]
  54. Esmeijer-Liu, A.J.; Kurschner, W.M.; Lotter, A.F.; Verhoeven, J.T.; Goslar, T. Stable carbon and nitrogen isotopes in a peat profile are influenced by early stage diagenesis and changes in atmospheric CO2 and N deposition. Water Air Soil Pollut. 2012, 223, 2007–2022. [Google Scholar] [CrossRef] [PubMed]
Figure 1. Leaf area (La) (a,b) and CO2 assimilation rate (A) (c,d) in durum wheat cultivars Claudio (circle, left) and Mongibello (square, right) exposed to 0 (open) or 80 (closed) ppb of ozone (5 h day−1) at different growth stages (7, 28, 50, 70 days from the beginning of exposure). Data are shown as mean ± standard deviation (n = 3). A vertical dashed line separates the cultivars.
Plants 11 03185 g001
Figure 2. Stomatal conductance (gs) (a,b) and maximum RuBP-saturated rate of carboxylation (Vcmax) (c,d) in durum wheat cultivars Claudio (circle, left) and Mongibello (square, right) exposed to 0 (open) or 80 (closed) ppb of ozone (5 h day−1) at different growth stages (7, 28, 50, 70 days from the beginning of exposure). Data are shown as mean ± standard deviation (n = 3). A vertical dashed line separates the cultivars.
Plants 11 03185 g002
Figure 3. Pearson’s correlation matrix describing relationships among δ13C, δ15N, leaf area (La), CO2 assimilation rate (A), stomatal conductance (gs), and maximum RuBP-saturated rate of carboxylation (Vcmax) in durum wheat cultivars Claudio (a) and Mongibello (b) exposed to 0 or 80 ppb of ozone (5 h day−1) at different growth stages (7, 28, 50, 70 days from the beginning of exposure).
Plants 11 03185 g003
Figure 4. δ13C (a,b) and δ15N (c,d) values in durum wheat cultivars Claudio (circle, left) and Mongibello (square, right) exposed to 0 (open) or 80 (closed) ppb of ozone (5 h day−1) at different growth stages (7, 28, 50, 70 days from the beginning of exposure). Data are shown as mean ± standard deviation (n = 3). A vertical dashed line separates the cultivars.
Plants 11 03185 g004
Table 1. Biomass and yield parameters in wheat cultivars Claudio and Mongibello exposed to 0 (control) or 80 ppb of ozone (O3, 5 h day−1) for 70 consecutive days.
ClaudioMongibellop
ControlO3ControlO3CvO3Cv × O3
(df: 1)(df: 1)(df: 1)
Leaf biomass (g DW plant−1)2.1 ± 1.31.5 ± 0.42.3 ± 1.01.5 ± 0.40.833<0.0010.833
Stem biomass (g DW plant−1)3.5 ± 1.22.4 ± 0.74.3 ± 1.42.5 ± 0.70.523<0.0010.542
Total aboveground biomass (g DW plant−1)10.11 ± 4.11 b7.1 ± 2.3 a13.3 ± 5.1 c8.0 ± 2.4 a<0.001<0.0010.015
Ears plant−1 (n)3.7 ± 1.34.0 ± 1.34.2 ± 1.13.7 ± 1.10.8880.8880.577
Ear weight (g DW plant−1)4.5 ± 1.6 b3.2 ± 1.2 a6.7 ± 2.6 c4.0 ± 1.3 ab<0.001<0.0010.014
Grain weight (g DW plant−1)2.4 ± 1.1 a2.2 ± 1.0 a3.7 ± 0.9 b2.3 ± 0.6 a0.0180.0070.026
Thousand grain weight (g)24.7 ± 3.0 a20.3 ± 1.4 a37.4 ± 3.5 b23.4 ± 1.4 a<0.001<0.0010.024
Grains ear−1 (n)42.0 ± 9.0 c30.0 ± 6.1 b40.0 ± 7.9 c24.0 ± 9.0 a0.003<0.0010.013
Spikelets ear−1 (n)16.4 ± 2.3 b15.5 ± 1.9 b16.0 ± 1.8 b13.6 ± 2.0 a0.018<0.0010.025
Grains spikelet−1 (n)2.8 ± 0.62.0 ± 0.62.5 ± 0.61.8 ± 0.90.536<0.0010.551
Note: Data are shown as mean ± standard deviation. p-values of two-way ANOVA for the effects of the cultivar (Cv), ozone exposure (O3), and their interactions on yield parameters of wheat are shown. Significant values (p ≤ 0.05) are shown in bold. According to the Tukey HSD post hoc test, different letters in each row indicate significant differences (p ≤ 0.05). Abbreviations: df, degrees of freedom; DW, dry weight.
Table 2. p-values of three-way ANOVA for the effects of the cultivar (Cv; Claudio and Mongibello), growth stage (Gs; 7, 28, 50 and 70 days), ozone treatment (O3; 0 and 80 ppb, 5 h day−1) and their interactions on leaf area (La), CO2 assimilation rate (A), stomatal conductance (gs) and maximum RuBP-saturated rate of carboxylation (Vcmax) of durum wheat.
dfLaAgsVcmax
Cv10.8940.1600.1030.687
O31<0.0010.0020.017<0.001
Gs3<0.001<0.001<0.001<0.001
Cv × O310.4780.0190.0530.724
Cv × Gs30.0500.1950.0210.003
O3 × Gs3<0.0010.0460.0570.120
Cv × O3 × Gs30.8660.3510.2580.160
Note: Significant values (p ≤ 0.05) are shown in bold. Abbreviation: df, degrees of freedom.
Table 3. Three-way ANOVA analysis describing significant differences among leaf area (La), CO2 assimilation rate (A), stomatal conductance (gs), maximum RuBP-saturated rate of carboxylation (Vcmax), δ15N and δ13C in durum wheat cultivars Claudio (CLAU) and Mongibello (MONG) exposed to 0 (CTR) or 80 (O3) ppb of ozone (5 h day−1) at different growth stages (7, 28, 50, 70 days from the beginning of exposure).
p Values
LaAgsVcmaxδ15Nδ13C
CTR7 daysCLAUMONG0.9910.2780.5150.178<0.0010.216
28 daysCLAUMONG0.7900.2780.2140.019<0.0010.012
50 daysCLAUMONG0.1590.1220.6460.466<0.001<0.001
70 daysCLAUMONG0.0550.0940.0080.161<0.0010.001
O37 daysCLAUMONG1.0000.6320.1600.009<0.0010.002
28 daysCLAUMONG0.8330.0250.0970.142<0.0010.154
50 daysCLAUMONG0.0670.3410.0570.8220.004<0.001
70 daysCLAUMONG0.6340.1770.0840.165<0.0010.907
CLAU7 daysCTRO30.9910.5390.7350.024<0.0010.487
28 daysCTRO30.3170.2490.2910.0010.0670.431
50 daysCTRO3<0.0010.6320.7170.3780.1550.226
70 daysCTRO30.6420.8910.7440.4160.5300.116
MONG7 daysCTRO30.9820.2230.6630.3350.0010.147
28 daysCTRO30.292<0.001<0.0010.017<0.0010.002
50 daysCTRO3<0.0010.0470.0460.169<0.001<0.001
70 daysCTRO30.3070.8370.4840.051<0.001<0.001
CLAUCTR7 days28 days0.0470.9450.7720.008<0.0010.727
7 days50 days<0.0010.0250.2600.031<0.0010.004
7 days70 days0.003<0.0010.003<0.001<0.001<0.001
28 days50 days<0.0010.0220.3990.5740.2590.009
28 days70 days0.237<0.0010.001<0.001<0.001<0.001
50 days70 days<0.001<0.001<0.001<0.001<0.001<0.001
O37 days28 days0.2970.5390.6630.095<0.0010.259
7 days50 days<0.0010.0020.0730.001<0.0010.238
7 days70 days0.001<0.0010.0140.004<0.001<0.001
28 days50 days<0.001<0.0010.0290.0520.4830.025
28 days70 days0.0110.0020.038<0.001<0.001<0.001
50 days70 days0.006<0.001<0.001<0.001<0.001<0.001
MONGCTR7 days28 days0.0270.9450.3730.314<0.0010.298
7 days50 days<0.0010.0080.3480.115<0.0010.022
7 days70 days<0.001<0.0010.275<0.0010.002<0.001
28 days50 days<0.0010.0070.9610.013<0.0010.184
28 days70 days0.006<0.0010.053<0.001<0.001<0.001
50 days70 days<0.001<0.0010.047<0.0010.564<0.001
O37 days28 days0.2120.0020.0010.016<0.0010.001
7 days50 days<0.0010.0540.1280.242<0.001<0.001
7 days70 days<0.0010.0040.031<0.001<0.001<0.001
28 days50 days0.001<0.0010.0510.001<0.001<0.001
28 days70 days0.0060.7320.193<0.001<0.001<0.001
50 days70 days0.596<0.0010.492<0.001<0.001<0.001
Note: Significant values (p ≤ 0.05) are shown in bold.
Table 4. p-values of three-way ANOVA for the effects of the cultivar (Cv; Claudio and Mongibello), growth stage (Gs; 7, 28, 50 and 70 days), ozone treatment (O3; 0 and 80 ppb, 5 h day−1) and their interactions on δ13C and δ15N values of durum wheat.
dfδ13Cδ15N
Cv1<0.001<0.001
O310.001<0.001
Gs3<0.001<0.001
Cv ×O310.090<0.001
Cv × Gs3<0.001<0.001
O3 × Gs3<0.001<0.001
Cv ×O3 × Gs30.001<0.001
Note: Significant values (p ≤ 0.05) are shown in bold. Abbreviation: df, degrees of freedom.
Publisher’s Note: MDPI stays neutral with regard to jurisdictional claims in published maps and institutional affiliations.

