Article

Biochemical and Transcriptional Responses in Cold-Acclimated and Non-Acclimated Contrasting Camelina Biotypes under Freezing Stress

1
Department of Plant Breeding and Biotechnology, Sari Agricultural Sciences and Natural Resources University (SANRU), Sari 68984, Iran
2
Genetics and Agricultural Biotechnology Institute of Tabarestan (GABIT), Sari Agricultural Sciences and Natural Resources University, Sari 68984, Iran
3
Department of Agronomy and Plant Breeding, Faculty of Agriculture, Razi University, Kermanshah 67144, Iran
4
Agro-Food Science Techtransfer and Innovation Centre, Faculty for Agro-, Food- and Environmental Science, Debrecen University, H-4032 Debrecen, Hungary
5
Department of Agronomy, Institute of Agronomy, Hungarian University of Agriculture and Life Sciences, 2100 Gödöllő, Hungary
6
Department of Plant Physiology and Plant Ecology, Institute of Agronomy, Hungarian University of Agriculture and Life Sciences, 1118 Budapest, Hungary
*
Authors to whom correspondence should be addressed.
Plants 2022, 11(22), 3178; https://doi.org/10.3390/plants11223178
Submission received: 12 October 2022 / Revised: 7 November 2022 / Accepted: 16 November 2022 / Published: 21 November 2022

Abstract

:
Cold-acclimated and non-acclimated contrasting Camelina (Camelina sativa L.) biotypes were investigated for changes in stress-associated biomarkers, including antioxidant enzyme activity, lipid peroxidation, protein, and proline content. In addition, a well-known freezing tolerance pathway participant known as C-repeat/DRE-binding factors (CBFs), an inducer of CBF expression (ICE1), and a cold-regulated (COR6.6) genes of the ICE-CBF-COR pathway were studied at the transcriptional level on the doubled-haploid (DH) lines. Freezing stress had significant effects on all studied parameters. The cold-acclimated DH34 (a freezing-tolerant line) showed an overall better performance under freezing stress than non-acclimated plants. The non-cold-acclimated DH08 (a frost-sensitive line) showed the highest electrolyte leakage after freezing stress. The highest activity of antioxidant enzymes (glutathione peroxidase, superoxide dismutase, and catalase) was also detected in non-acclimated plants, whereas the cold-acclimated plants showed lower enzyme activities upon stress treatment. Cold acclimation had a significantly positive effect on the total protein and proline content of stressed plants. The qRT-PCR analysis revealed significant differences in the expression and cold-inducibility of CsCBF1-3, CsICE1, and CsCOR6.6 genes among the samples of different treatments. The highest expression of all CBF genes was recorded in the non-acclimated frost-tolerant biotype after freezing stress. Interestingly a significantly higher expression of COR6.6 was detected in cold-acclimated samples of both frost-sensitive and -tolerant biotypes after freezing stress. The presented results provide more insights into freezing tolerance mechanisms in the Camelina plant from both a biochemical point of view and the expression of the associated genes.

1. Introduction

Camelina, also known as Siberian oilseed, is an emerging oilseed crop with remarkable constituents and agronomical advantages [1,2]. Enhancing the abiotic stress tolerance in camelina is now the subject of intensive breeding programs to identify the tolerant cultivars with increased yield and productivity [3,4,5].
Plants respond to low temperatures and frost by adopting various mechanisms to cope with or combat stress. With this regard, understanding the plant’s molecular (transcriptome) and physiological (e.g., antioxidant defense system) processes in response to low-temperature stress provides new opportunities for crop breeding to address these types of stresses [6,7].
Recent experimental reports have provided extensive information on different genes and their associated systems for low-temperature-stress tolerance in plants [8,9]. Many studies have been conducted on various factors affecting the networks responsible for tolerating low temperatures, and especially in Arabidopsis, which is a very close relative to Camelina.
The main cold-responsive signaling pathway in plants is known as the ICE-CBF-COR cascade, which consists of several genes in plant species [10]. The cold-activated ICE genes induce and regulate the expression of the C-repeat binding factor (CBF) in plants. The Arabidopsis genome encodes six paralogs of CBFs, with their most important three transcription factors, including CBF1/DREB1B, CBF2/DREB1C, and CBF3/DREB1A, being responsible for tolerating low temperatures [11]. All three CBF genes are parallel to each other and have high sequence similarity [12]. CBF/DREB1 transcription factors have been reported to play a key role in modulating the response to cold stress in Arabidopsis and have been tested to increase cold resistance in susceptible plants [13]. Overexpression of Arabidopsis CBF genes in B. napus induced the expression of CBF target genes and increased frost resistance in both adapted and non-adapted plants to low temperatures [14]. Expression of the Arabidopsis CBF1 gene in tomatoes has also been shown to be involved in cold tolerance [15]. The role of CBF orthologous genes in abiotic stress tolerance has been identified in a wide range of model and other crop plants such as Arabidopsis [16], rapeseed [17], rice [18], maize [19], wheat [20], barley [21], tomato [22], tobacco [23], cotton [24], and Capsella bursa-pastoris [25]. The widespread presence of the DREB1/CBF regulatory system and their association with stress tolerance in plants make them a suitable biomarker system for studying cold stress conditions [26]. The cold-responsive (COR) genes as CBF targets are the last players of the ICE-CBF-COR cascade, with their important role in cold stress tolerances [27]. Cold acclimation or priming with low temperatures has been showing positive results in adaptation and stress tolerance [28]. A comprehensive review of genetics and physiological changes in cold stress in plants has been published recently in which the complex processes of cold stress tolerance are summarized and well addressed [29].
The cold stress and unexpected low temperatures are causing significant damage to agricultural production all over the world [30]. These damages can be assessed by investigating the physiological and phytochemical changes in stressed plants. Meanwhile, one of the fundamental prerequisites to dealing with freezing stress is to introduce tolerant cultivars. This can be facilitated by studying and learning the mechanisms of stress responses in tolerant plants. Therefore, this study was conducted to assess the effects of freezing stress on cold-acclimated and non-acclimated winter and spring biotypes of camelina at the phytochemical and molecular levels to test the hypothesis that cold-acclimatized lines may exhibit more tolerance to freezing stress due to the pre-activation of molecular and physiological processes involved in low-temperature adaptation.

2. Results

The following results show the effect of freezing stress (−5 °C) on a freezing-tolerant (FT) and a freezing-sensitive (FS) biotype of Camelina plants with cold acclimation (AC) and without cold acclimation (NA) before stress treatment.

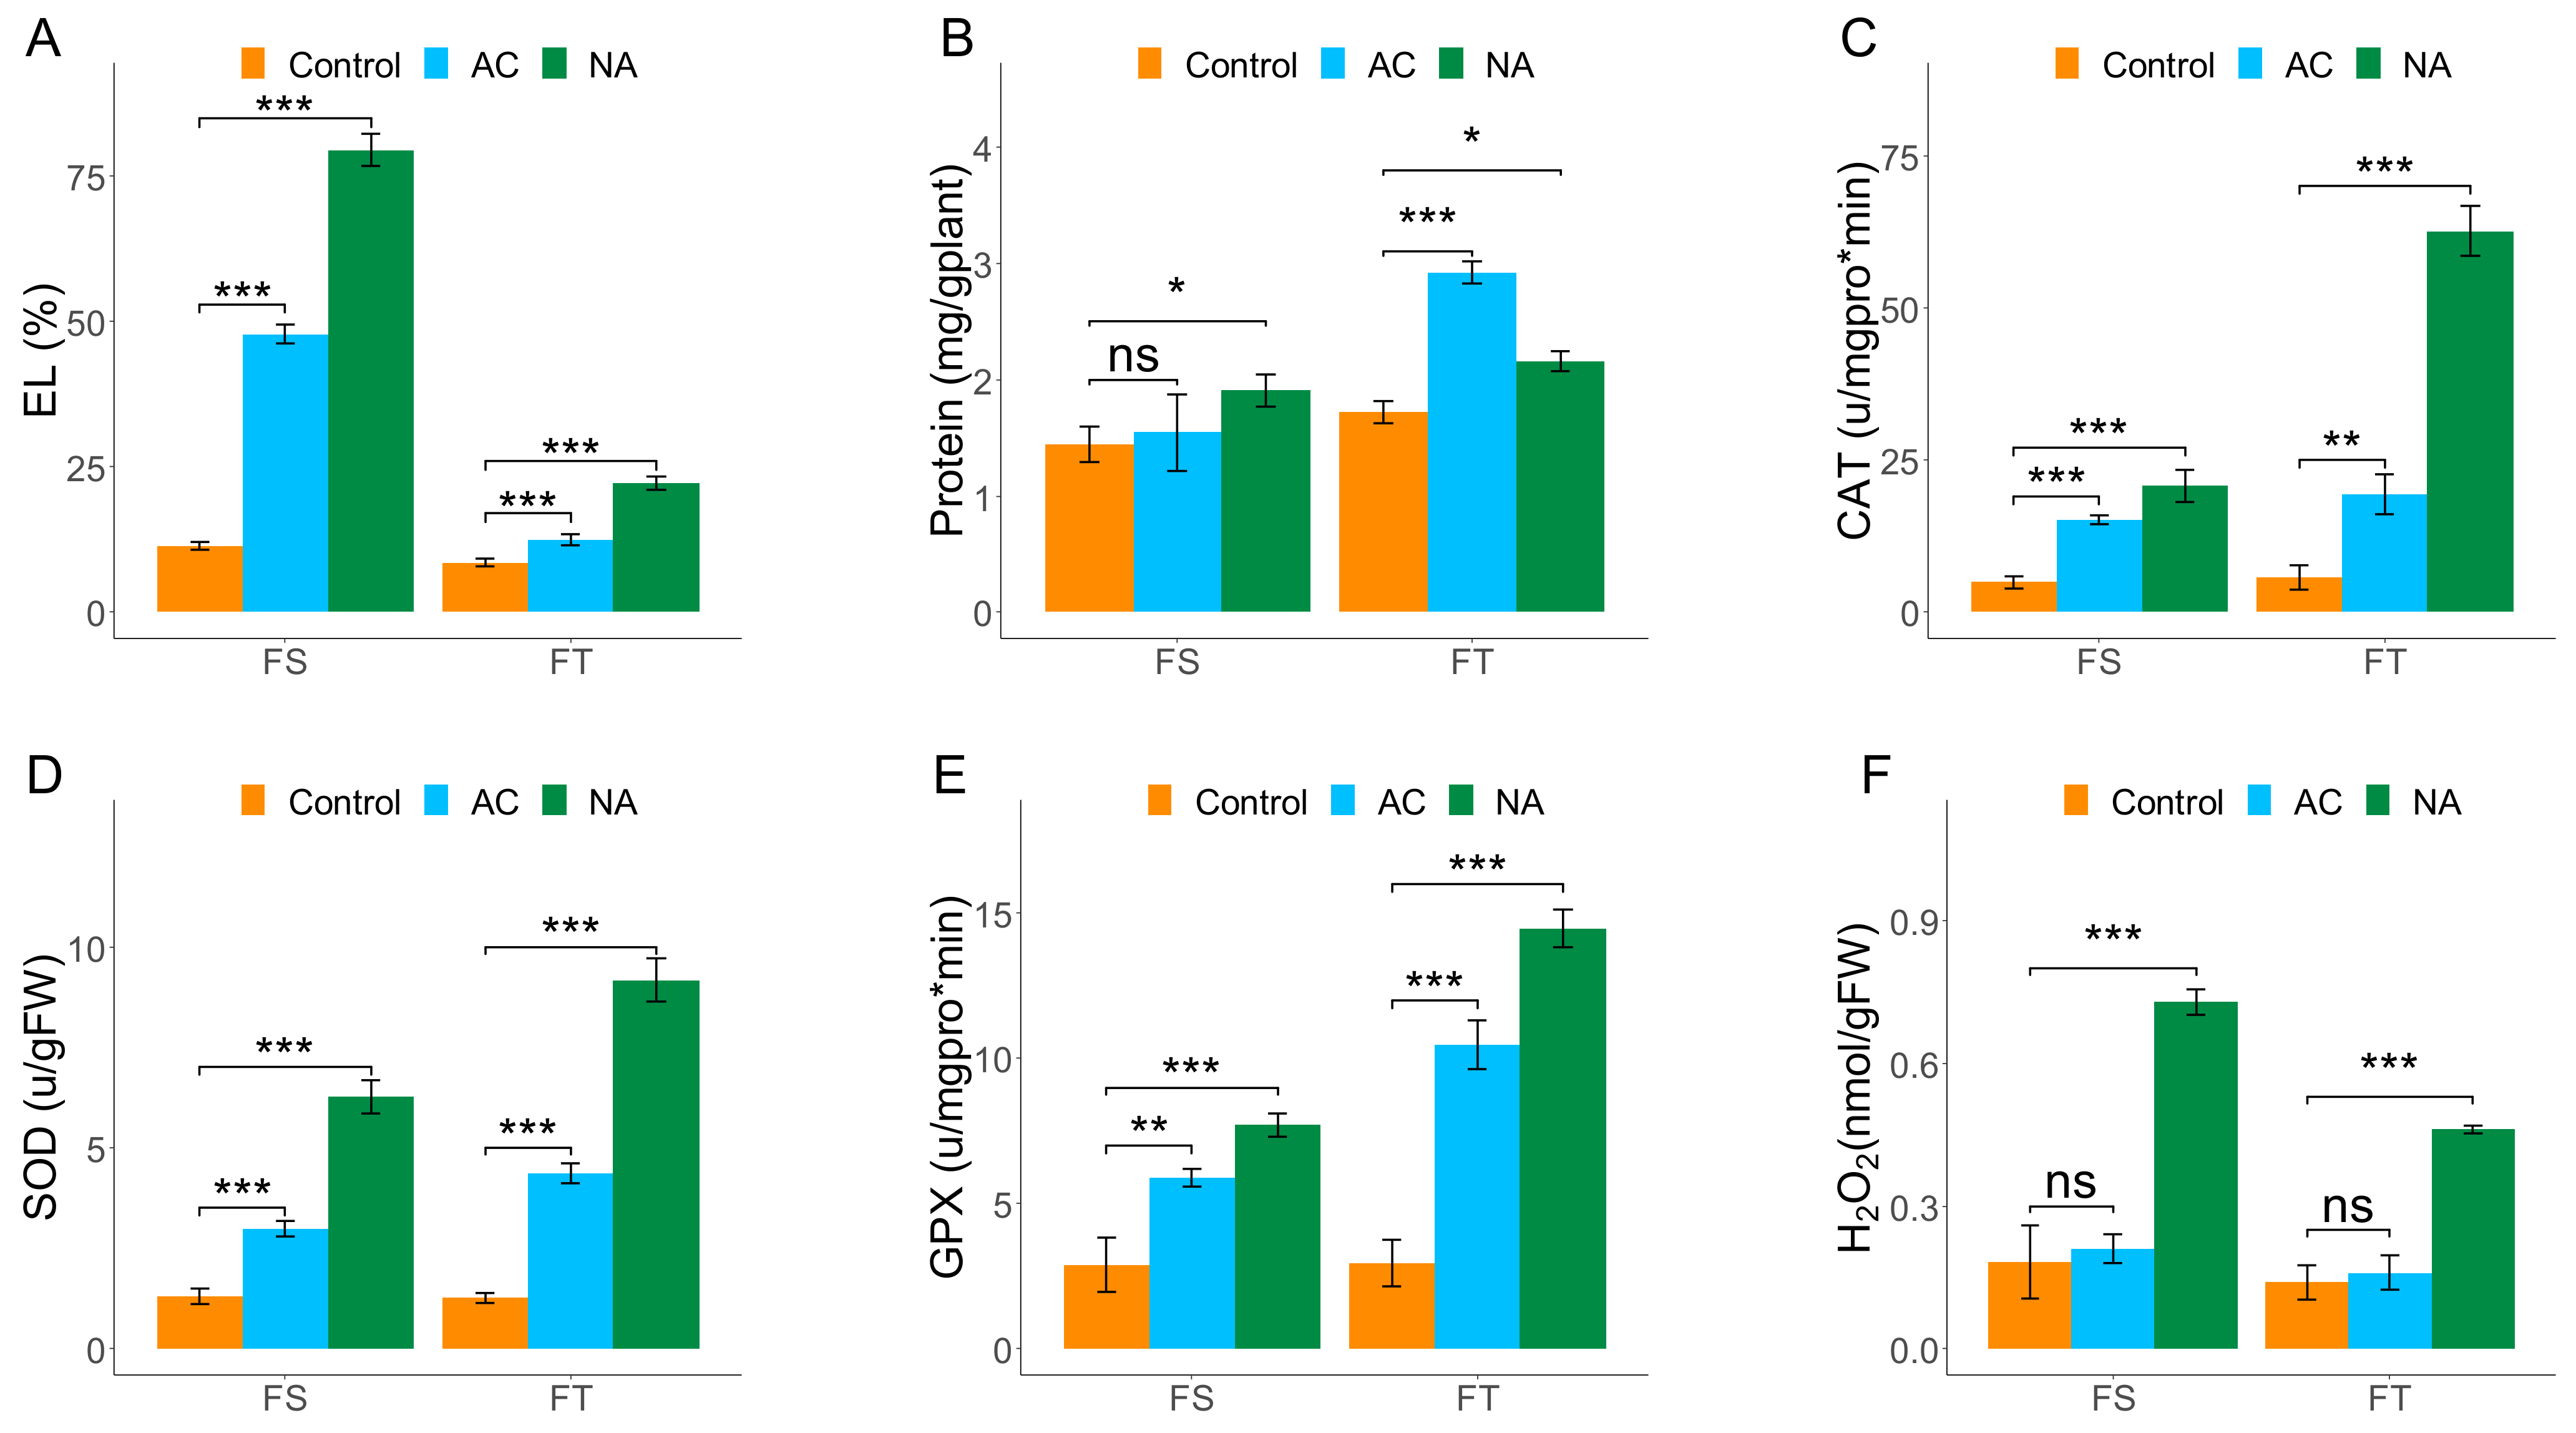
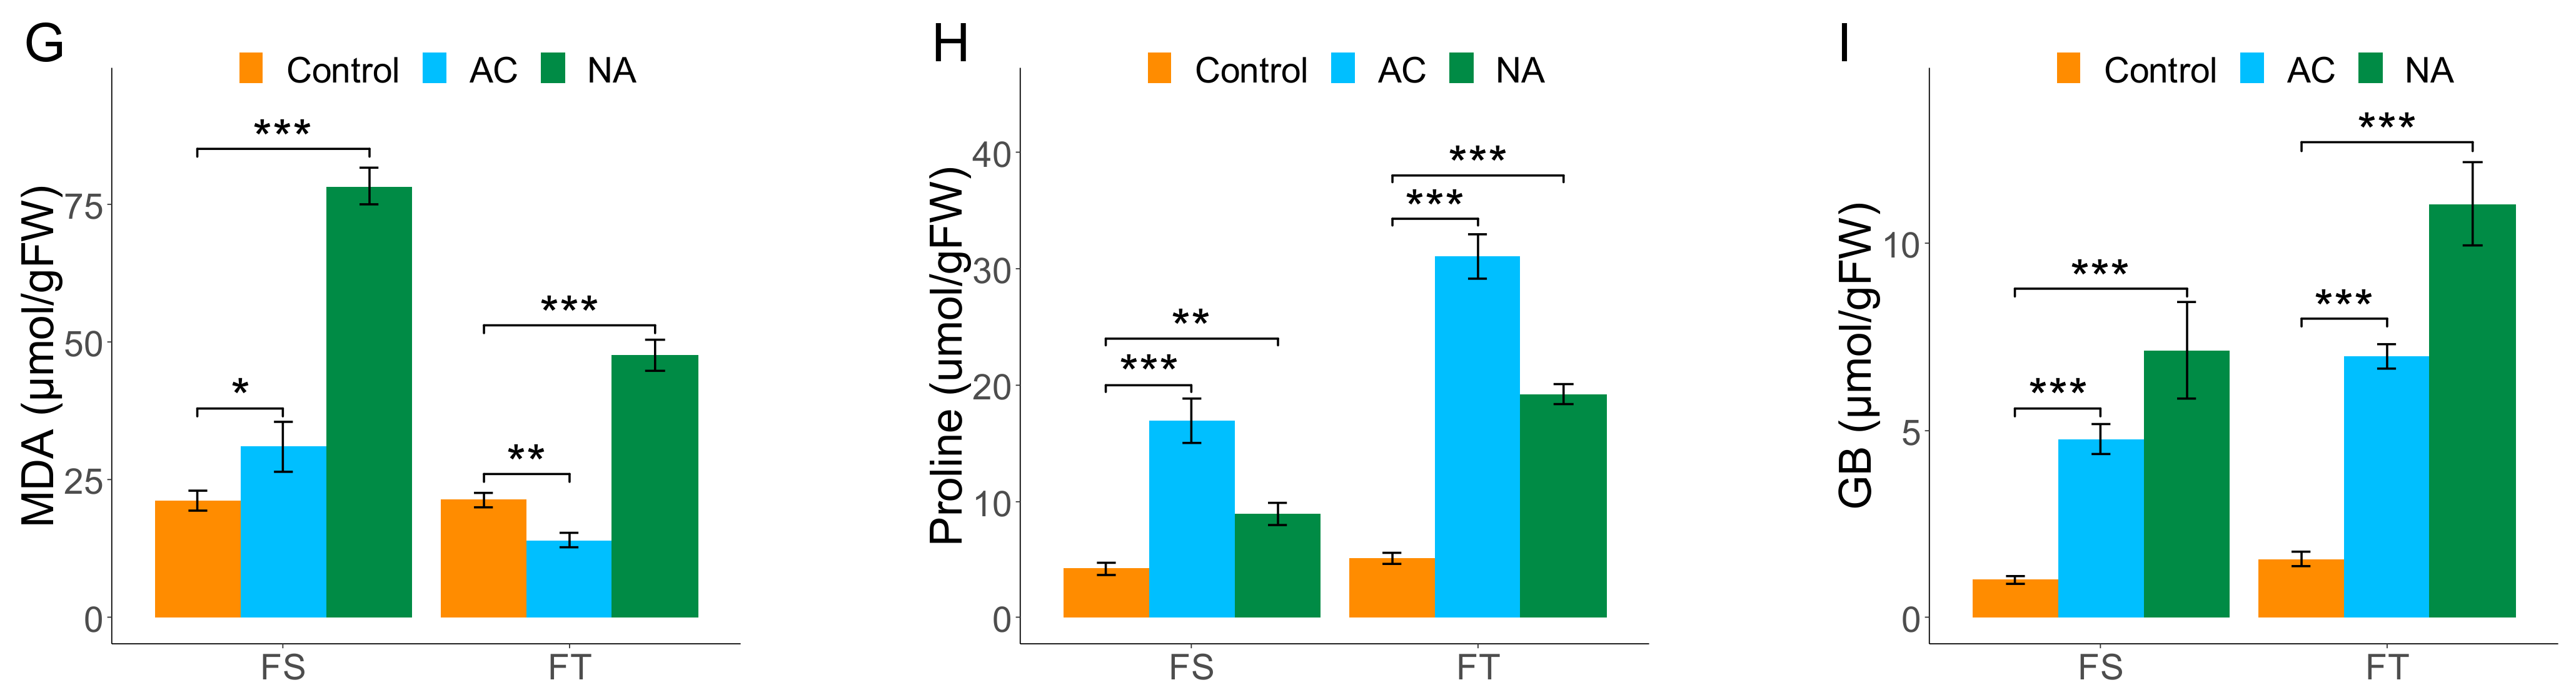
2.1. Biochemical Assessments

The EL determination assay was successfully applied to verify the tolerance degree of the FT and FS genotypes of Camelina. The EL significantly (p < 0.001) increased in FT and FS Camelina DH lines after freezing stress when compared to their controls. However, the EL percentage was lower in the FT line and in cold-acclimated (AC) treatment (Figure 1a). Less EL indicates higher cellular membrane stability and freezing tolerance. A comparison of the protein content in the Camelina biotypes showed that the soluble proteins in the FT line after the acclimation condition were significantly more than that of in control and the non-acclimated plants (Figure 1b). The catalase enzyme (CAT) activity increased significantly after freezing stress, with its highest level being detected in the non-acclimated FT Camelina biotype. (Figure 1c). Interestingly, similar findings were observed for the superoxide dismutase (SOD) and guaiacol peroxidase (GPX), where both enzymes’ activity was induced by freezing stress (Figure 1d,e). The highest hydrogen peroxide (H2O2) and malondialdehyde (MDA) contents were recorded in samples of non-acclimated plants of both FT ad FS lines after freezing stress (Figure 1f,g). However, the H2O2 and MDA levels in the FS biotype were substantially more in comparison to the FT line (Figure 1f,g). Furthermore, proline content was also increased in both FS and FT biotypes of Camelina exposed to freezing stress. However, the acclimation for two days before the freezing stress resulted in higher proline content in comparison to the non-acclimated plants (Figure 1h). The content of glycine betaine (GB) was also significantly increased when both lines were exposed to freezing stress. The acclimation treatment did now show any significant effect on the GB content of stressed plants in comparison to their non-stressed counterparts (Figure 1i).

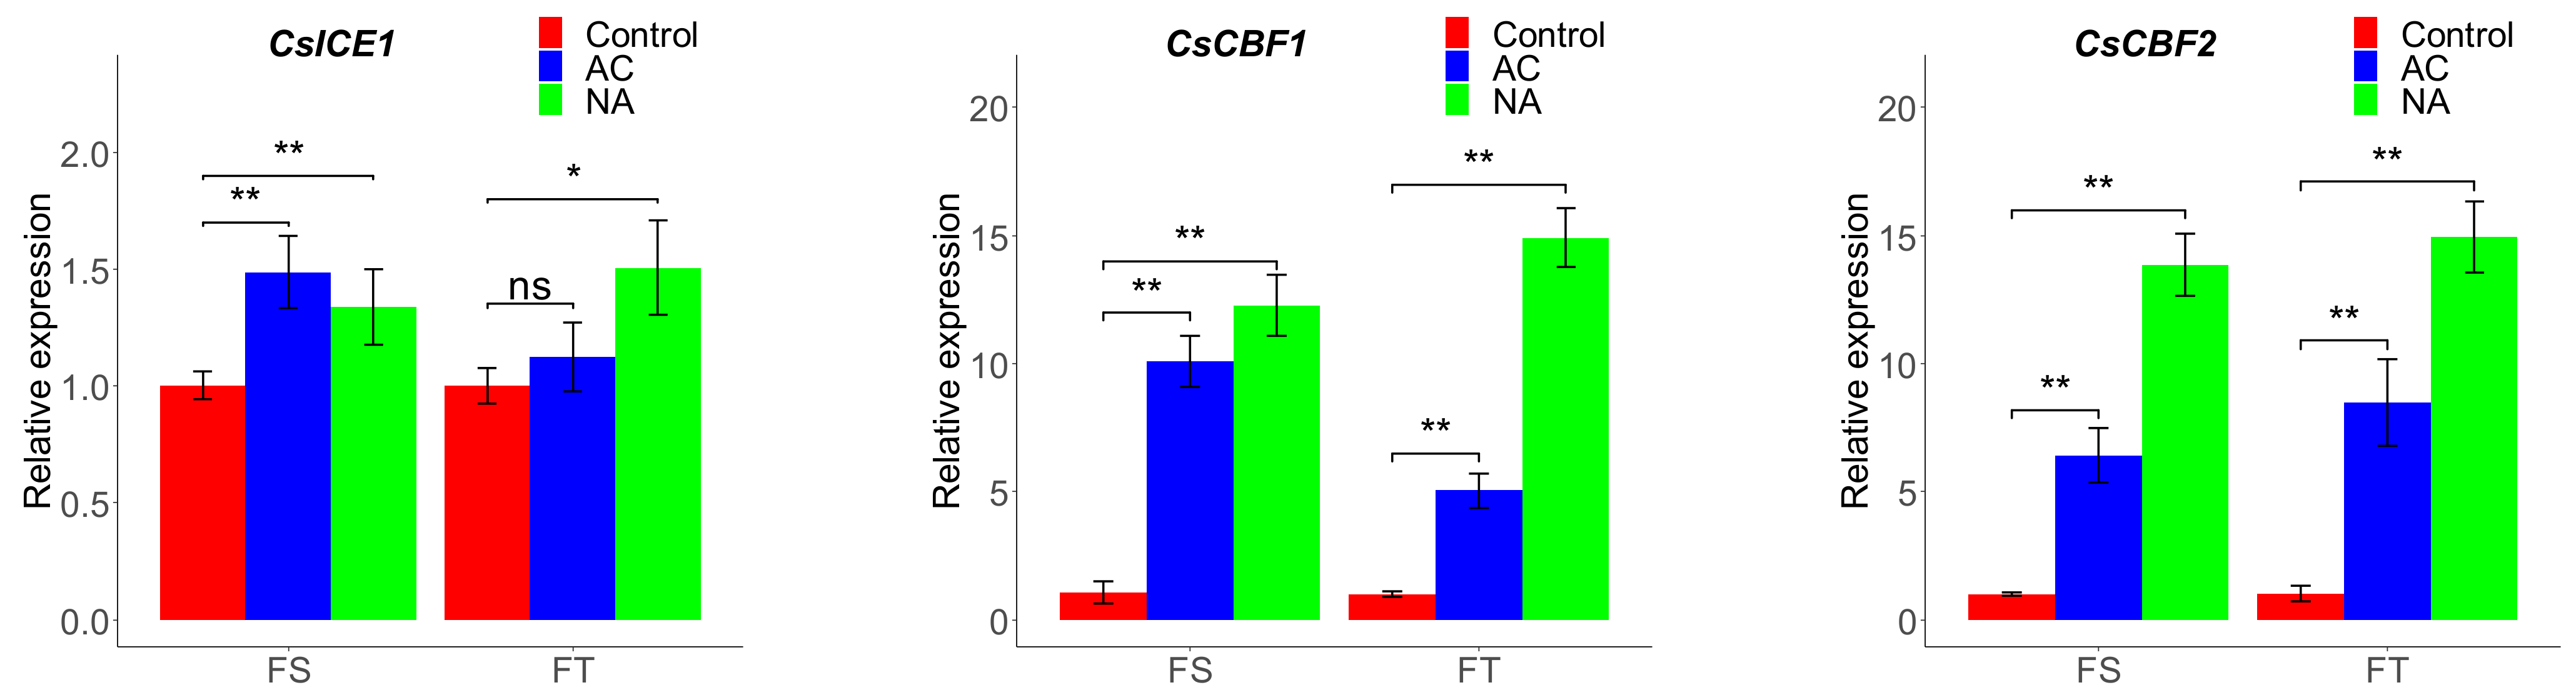
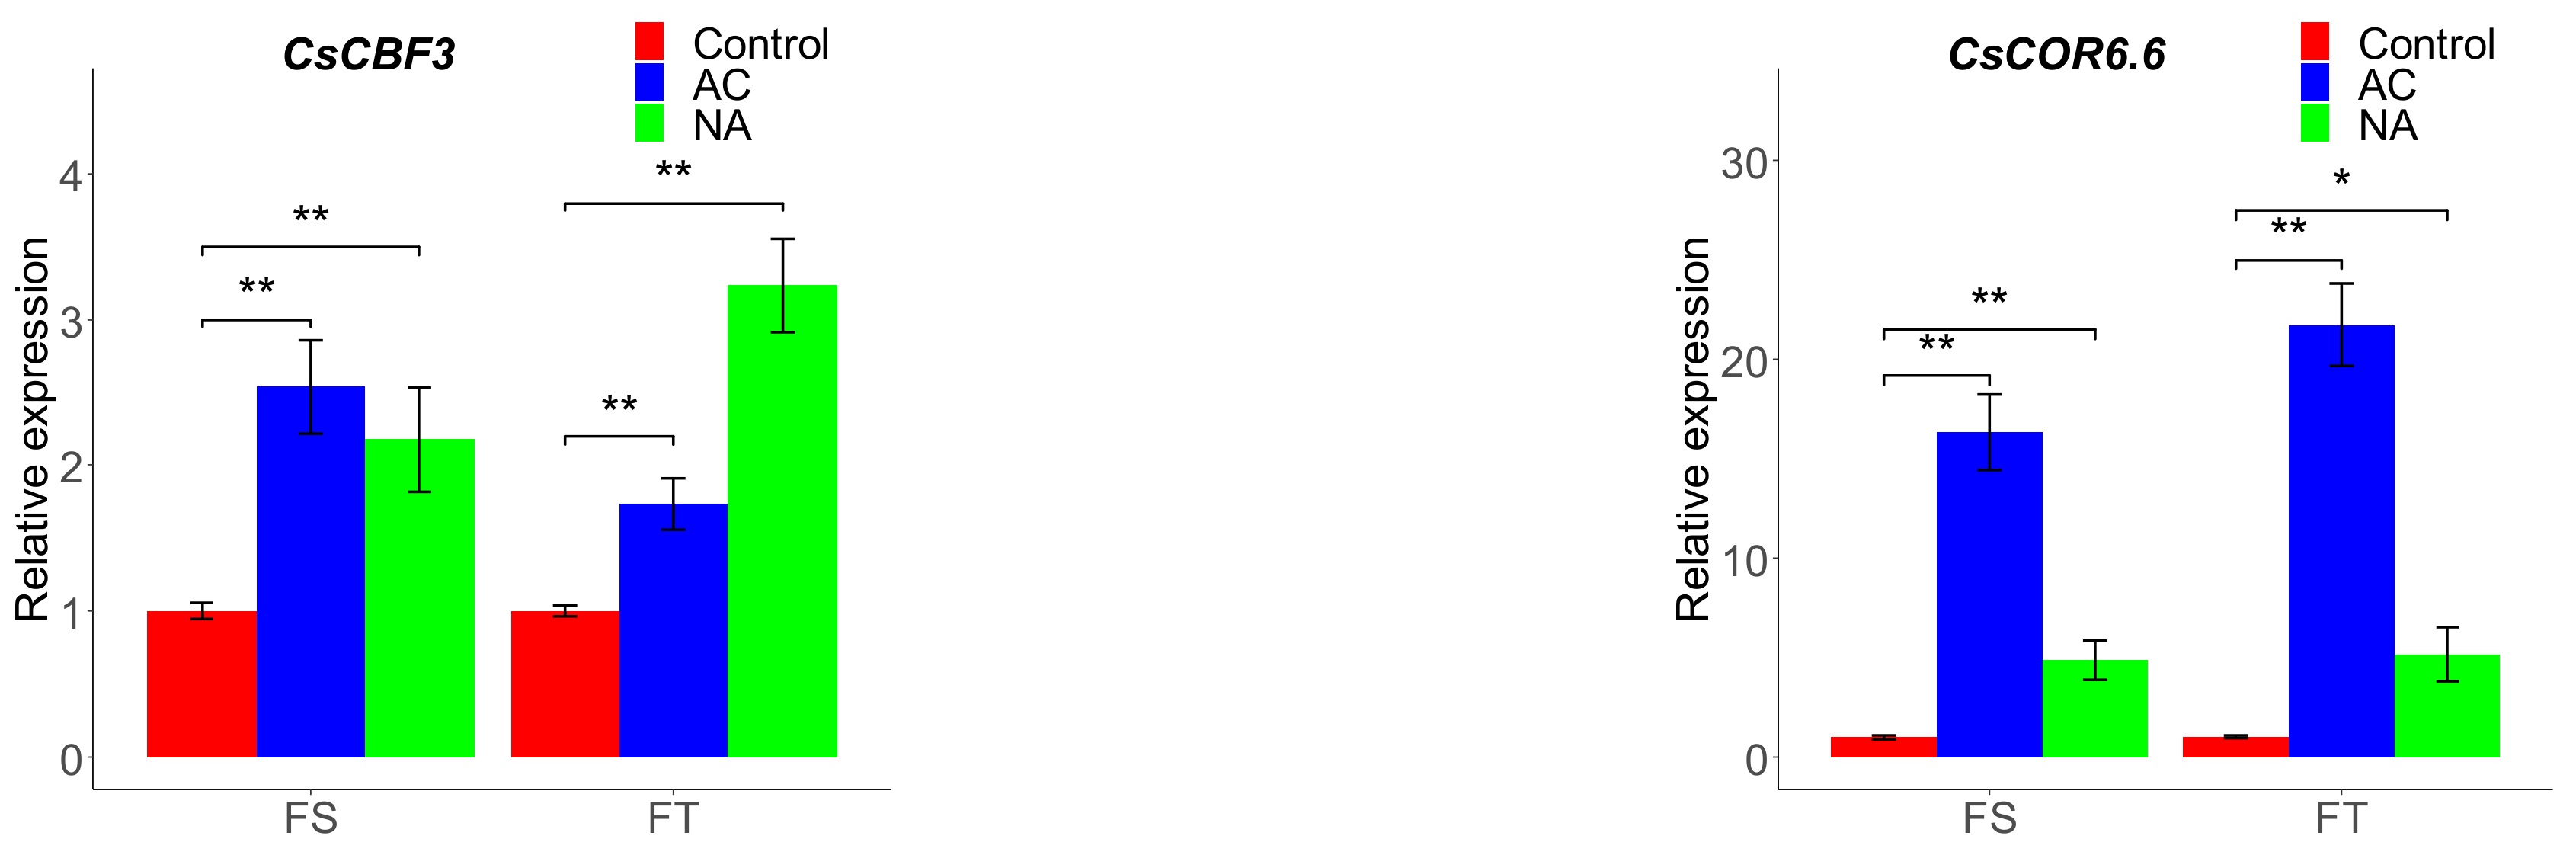
2.2. Expression Profiling of ICE, CBF, and COR Genes

A set of selected genes from the ICE-CBF-COR pathway with their confirmed association with freezing tolerance (in Arabidopsis and other plants) were investigated for their relative expression upon freezing stress in cold-acclimated (AC) and non-acclimated (NA) Camelina biotypes by real-time quantitative PCR. The expression pattern of CsICE1, CsCBF1, CsCBF2, CsCBF3, and CsCOR6.6 genes in the freezing-sensitive (FS) and freezing-tolerant (FT) biotypes are shown in Figure 2. A significantly higher (p < 0.05) expression of the CsICE1 gene was detected in both biotypes after exposure to freezing stress (Figure 2a). However, the CsICE1 expression level in the acclimated (AC) FT biotype was not statistically significant (p < 0.05) when compared to the control. The expression of all CBF genes was induced in both biotypes exposed to freezing stress (Figure 2). The FS biotype showed more induction of CsCBF1 and CsCBF3 than the FT biotype in acclimated samples, which was quite the opposite in the case of the CsCBF2 expression pattern. Both biotypes had their maximum expression of all CBF genes after freezing stress and in non-acclimated samples at levels significantly higher than the controls (p < 0.01). Interestingly, the CsCOR6.6 gene in the two contrasting Camelina biotypes showed its maximum expression level in cold-acclimated samples exposed to freezing stress (Figure 2). Even though the expression of the COR gene in non-acclimated samples was significantly higher than its level in the control plant, the relatively higher values in AC-treated samples indicate the inducibility of this gene upon cold acclimation rather than the direct freezing stress.

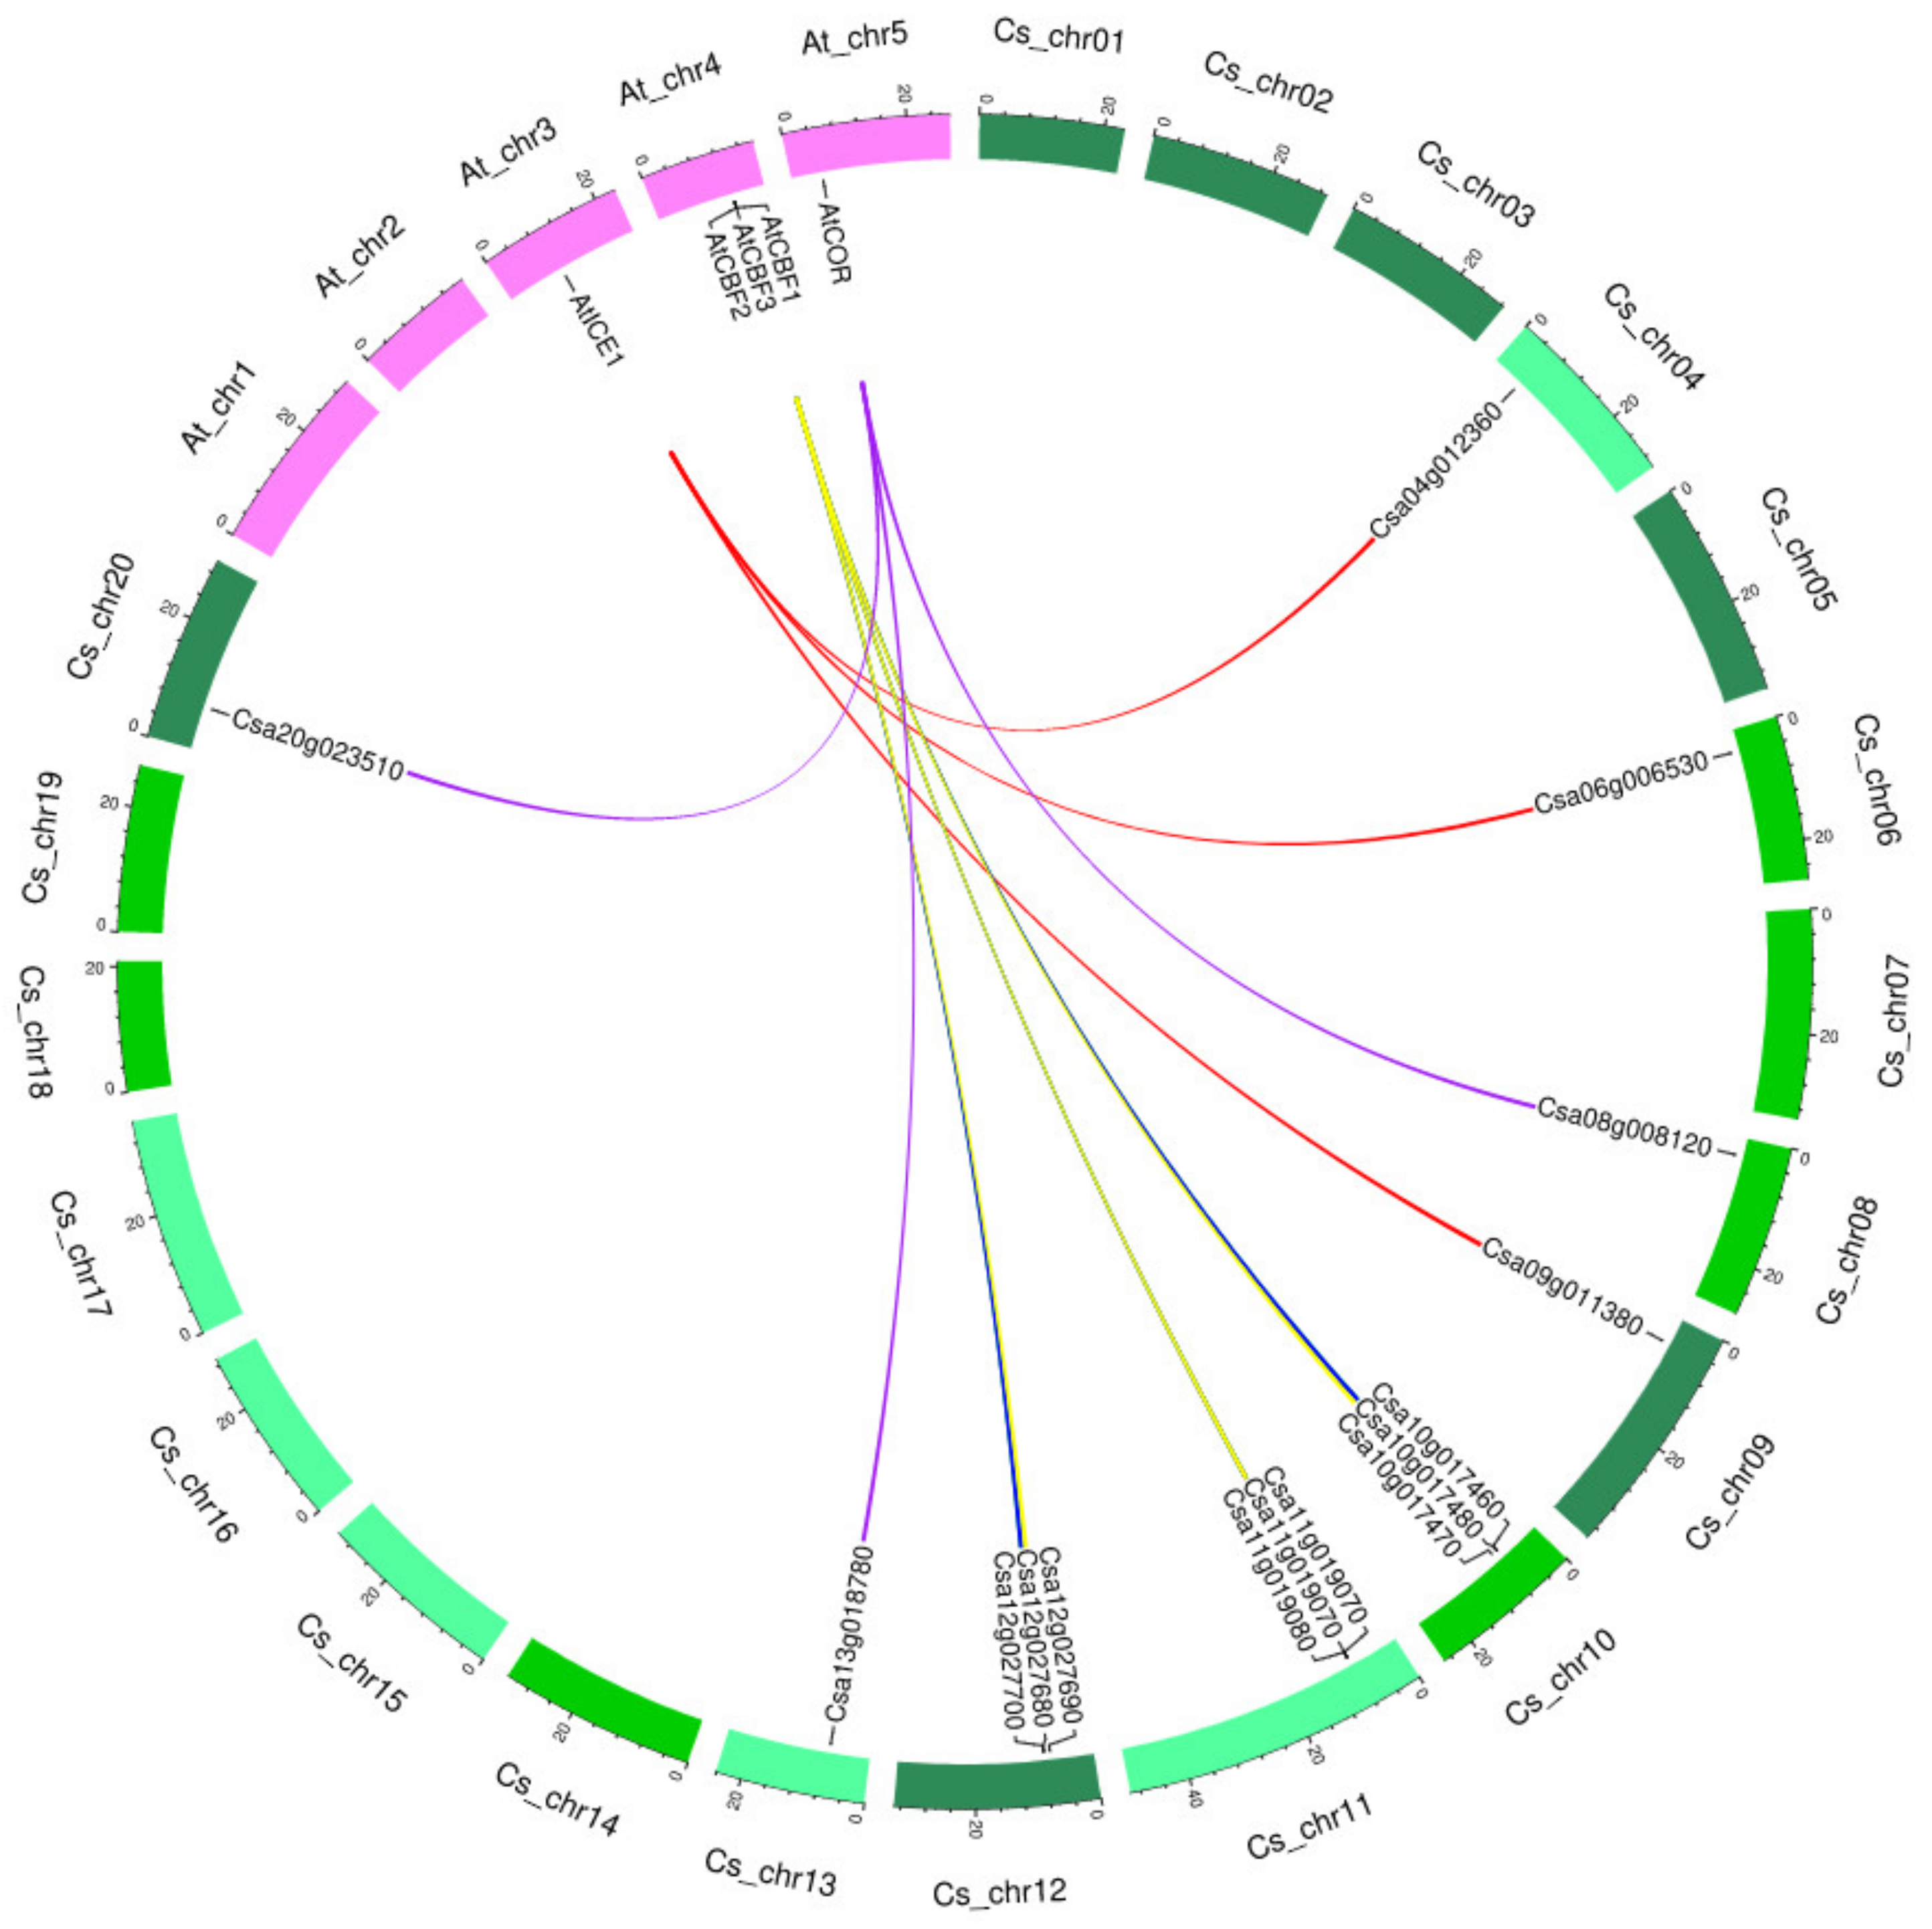
2.3. Identification of Syntelogs and Gene Duplication Analysis

Since C. sativa is an allohexaploid plant, there is more than one copy of the selected ICE-CBF-COR genes in Camelina in comparison to the one copy number in closely related plant species A. thaliana genome. We identified three copies of CsICE1, CsCBF2, CsCBF3, and CsCOR6.6 genes and only two copies of CsCBF1 in the Camelina genome (Table 1). Arabidopsis AtCBF1-3 genes are located on chromosome number 4, whereas the CsCBF1 and CsCBF3 genes in the Camelina genome are distributed on chromosomes number 10, 11, and 12 and CsCBF2 discovered on chromosomes 10 and 12 only. The AtICE1 was found on chromosome number 3 in Arabidopsis but on chromosomes 4, 6, and 9 in Camelina. The AtCOR6.6 gene in Arabidopsis was on chromosome 5, and chromosomes 8, 13, and 20 in Camelina.
The synteny of the selected ICE-CBF-COR genes in A. thaliana and C. sativa is represented in Figure 3. Synteny analysis of the CsICE1, CsCBF1, CsCBF2, CsCBF3, and CsCOR6.6 genes in comparison to A. thaliana genome showed that gene copies of C. sativa were located on G1, G2, and G3 sub-genomes of C. sativa (presented in different green colors in Figure 3). For example, AtICE1, which is located on chromosome 4 in A. thaliana, was detected on chromosomes 4 (G1), 6 (G2), and 9 (G3) of C. sativa, reflecting the more copy numbers of these genes as a result of gene duplications.

3. Discussion

Freezing stress is one of the main severe environmental factors affecting the growth and yield of crops and a major limiting factor in introducing new crops/cultivars around the world. Camelina is a re-emerging oilseed crop with the potential to grow in a wide range of climates as a winter or spring crop [31]. Accordingly, there are two biotypes of Camelina plants (e.g., spring and winter biotypes) with different responses to low temperatures [5,32], which are categorized by morphology [33] and/or allele-specific molecular markers [34]. The winter biotype of Camelina is typically known as freezing tolerant (FT), and the spring/summer biotype is commonly referred to as freezing sensitive (FS). The two biotypes are equipped with different mechanisms to cope with or/and respond to low temperatures [32]. Among the biomarkers to assess the freezing tolerance in various plant species, electrolyte leakage (EL) quantification is a common and reliable method to estimate freezing tolerance in plant species [35]. A favorable freezing tolerance was observed in Camelina seedlings with acclimation treatment due to a lower level of electrolyte leakage (EL). The significantly higher and cold stress-responsive EL rate in FS Camelina biotype in comparison to FT can be considered a decisive factor in screening studies to identify tolerant lines [36]. The lower EL level in cold-acclimated seedlings can correspond to the lower level of damage in freezing-stressed plants, reflecting the activation of defensive factors, including biochemical and transcriptomic responses. Changes in the structure and function of cell membranes are the first effects of stress and often are related to oxidative damage. Plants produce a series of antioxidant systems that play their role in detoxifying reactive oxygen species (ROS) [37]. The relatively lower antioxidant enzymes activity of catalase (CAT), superoxide dismutase (SOD), guaiacol peroxidase (GPX), and glycine betaine (GB) in cold-acclimated seedlings, compared to their non-acclimated counterparts, indicates the reduced extent of the cell damages or need for their activities in freezing-stressed Camelina plants. Antioxidant enzymes also play a key role during freezing stress to avoid the accumulation of hydrogen peroxide [38]. As expected, the H2O2 level was significantly lower in cold-acclimated samples in our study. The role of glycine betaine (GB) in freezing tolerance was investigated years ago in Arabidopsis [39]. In our samples, we could not find considerable patterns in GB content to be recognized among the contrasting biotypes.
The deteriorating effect of low temperatures on membrane structure and the consequent water imbalance in plant tissues are long known [40]. Plant cells can sense cold stress by altering membrane fluidity [41]. After the sensation of cold temperatures by plants, numerous signals, such as Ca2+, ROS, abscisic acid, salicylic acid, and other phytohormones, are generated and released [42]. These may initiate the induction or the regulation of several genes’ expressions. Understanding the gene expression under stress conditions can provide a better fundamental insight into environmental stress resilience in plants. The activated signals can influence the expression pattern of various genes, such as protein kinase, transcription factor, and COR genes, as well as their subsequent physiological activities [41].
Low temperatures significantly alter the ICE/CBF/COR signaling pathway, including inducer of CBF expression (ICE), C-repeat binding factor (CBF), and cold-regulated (COR) genes, which play a significant role in freezing sensing and plants responses to cold stress [27]. In Arabidopsis, there are three CBF genes, including CBF1, CBF2, and CBF3 (also known as DREB1B, DREB1C, and DREB1A, respectively) that induce the low-temperature response signaling pathway [41]. Plant CBF genes are involved in cold tolerance by inducing the expression of downstream genes, such as COR genes, through metabolic changes and physiological processes [43,44,45]. CBF genes themselves are regulated by other transcription factors, including ICE1, MYB15, and CAMTA3 [46,47]. The ICE-CBF-COR signaling cascade is one of the most well-known transcriptionally regulated pathways of Arabidopsis in response to cold stress, involving various genes, including COR15A, COR15B, COR47, and so on [48]. In our study, relative expression of the CsICE1 gene in Camelina biotypes was slightly but significantly induced by freezing stress, indicating its possible involvement in chilling tolerance in the Camelina plant. Anderson et al. [49] reported that CBF1/2 is an upstream regulator of GOLS3 and COR15A genes, which are participants of ROS scavenging processes in stressed Camelina guard cells. Horvath et al. [50] claimed that CBF gene expression was induced in both spring and winter in Camelina biotypes under freezing stress and, therefore, not responsible for the freezing tolerance in the camelina winter biotypes.
It was also noticed that CBF1, CBF12, CBF13, and ICE1 genes are reported to be induced in Arabidopsis for only a short time (15 min) under cold stress conditions [51]. On the other hand, Wang et al. [32] reported the upregulation of CBF genes in a winter biotype of Camelina (named Joelle), which was somewhat similar to our results, where the expression of all three CBF genes was highest in FT (Winter biotype) after frost stress. As stated by Wang et al. [32], freezing tolerance in Camelina biotypes is complicated when considering the cold acclimation and vernalization processes, especially in winter biotypes.
In the synteny analysis, it was found that there were three copies for most of the studied genes in Camelina, and it may be a reason for the higher freezing tolerance of Camelina (a hexaploid plant) rather than A. thaliana (a diploid plant) in general. Distribution of CsICE1, CsCBF1, CsCBF2, CsCBF3, and CsCOR6.6 genes on C. sativa and A. thaliana chromosomes confirmed hexaploidy of Camelina and revealed orthologous relationships between these two closely related plant species.
Furthermore, our previous genetic analysis [5] indicated that freezing tolerance in Camelina is rather controlled by additive effects of genes. The finding of this study and the results of Wang et al. [32] indicated that there may be different pathways/genes involved in cold acclimation-induced freezing tolerance in Camelina. In the current study, we assessed the overall expression of the existing selected genes on the Camelina genome. It may be of high interest to investigate the expression of each copy of the homologous genes separately in future studies to find out if their different positions on different chromosomes may influence their expression inducibility. The genome–environment associations and more innovative approaches, such as genomic estimated adaptive value models, may shed more light on predicting stress tolerance in crops such as Camelina [52,53,54,55]. Further studies on genetic variations in the freezing tolerance of camelina biotypes can lead to developing freezing-related SNP markers in the winter biotype of camelina for rapid screening of new breeding lines.

4. Materials and Methods

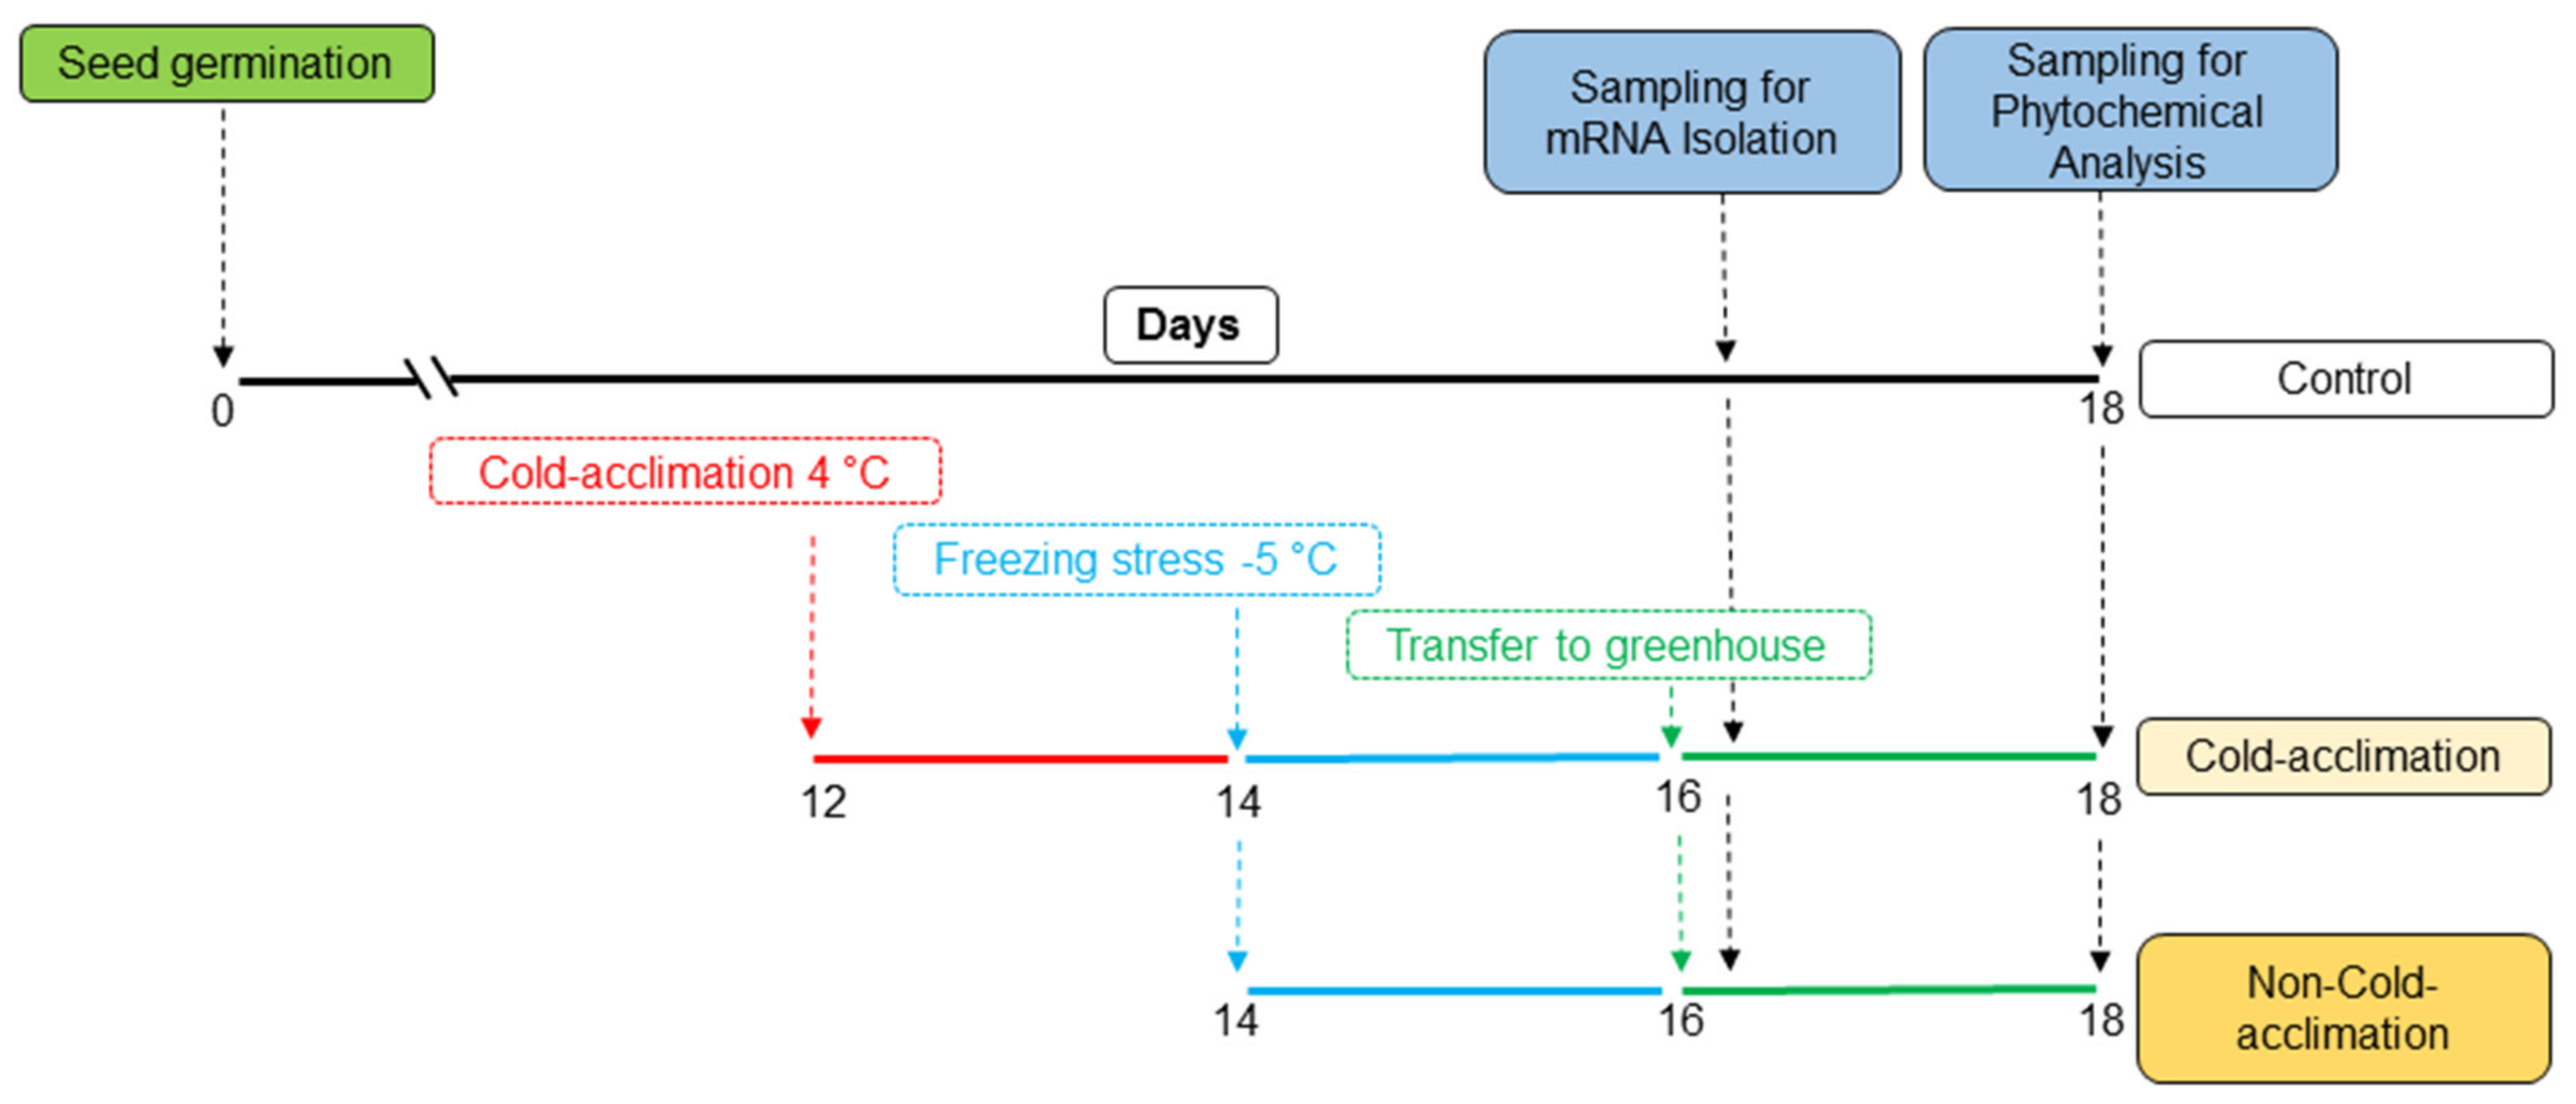
4.1. Plant Materials and Experimental Treatments

Based on substantial screening test results among the several doubled-haploid lines, DH8 and DH34 lines with low and high tolerance to freezing stress, respectively, were selected [5,34]. The selected lines were subjected to two pre-treatments, including cold acclimation and non-acclimation, prior to freezing stress, along with controls in triplicates. The schematic diagram of the experimental design is presented in Figure 4. Seeds were germinated in peat moss-containing pots ( 8 cm × 10 cm) in a temperature-controlled greenhouse with day/night temperatures of 22/18 °C, respectively (five seedlings were kept in every pot and considered as one biological replicate). The cold-acclimation treatment (4 °C) was started on day 12 after germination and for two days in a temperature-controlled phytotron growth chamber (Conviron E-15; Conviron Controlled Environments Ltd., Winnipeg, Canada) with similar photoperiod and light intensity. The freezing stress (48 h at −5 °C) was applied to both cold-acclimated and non-cold-acclimated plants by placing them in a freezer device (JTUL150, Jal Tajhiz Co, Iran) under short-day condition (8 h light/16 h dark) at day 16 after germination. The treated and control plants were subjected to sampling on days 16 and 18 after germination (Figure 4). The instantly frozen samples in liquid N were kept at −80 and −20 °C for RNA extraction and biochemical analyses, respectively.

4.2. Electrolyte Leakage (EL)

The EL value was assayed according to the original method of Kim et al. [6], with modifications adopted in the screening experiment [36].

4.3. Preparation of Enzyme Extracts and Antioxidant Enzymes Activity

The plant extracts were obtained by grinding 0.4 g of frozen leaf samples in liquid nitrogen in a mortar and pestle to a fine powder. The powdered specimens were then transferred into 2 mL Eppendorf tubes to which 1800 μL of 0.1 M phosphate buffer (pH 7.0) containing 0.1 M EDTA was added, briefly vortexed, and centrifuged for 15 min at 14,000 rpm at 4 °C. The supernatant was transferred to clean Eppendorf tubes and stored on ice for the enzyme activity assays [56].
The catalase (CAT; EC: 1.11.1.6) enzyme activity was measured according to the method of Chance and Maehly [57]. Concisely, the 3 mL reaction mixture contained 10 mM H2O2, 50 mM potassium phosphate buffer (pH 7.0), and 100 μL of enzyme extracts. The decomposition of H2O2 was recorded at 240 nm. The results were expressed as EU (μM of H2O2 decomposed per minute) mg−1 protein.
For superoxide dismutase (SOD; EC 1.15.1.1) activity, a method described by Giannopolitis and Ries [58] was applied. The reaction mixture contained 50 mM potassium phosphate buffer (pH 7.8), 12 μM methionine, 75 μM p-nitro blue tetrazolium chloride (NBT), 1 μM riboflavin, and 300 mL of enzyme extract. One unit of SOD activity was defined as the amount of enzyme required to obtain a 50% inhibition rate of NBT reduction that was recorded at 560 nm, and SOD activity was reported as enzyme unit per mg protein.
Guaiacol peroxidase (GPX; EC:1.11.1.9) activity was quantified according to the Chance and Maehly method [51]. The 3 mL reaction solution contained 50 mM phosphate buffer (pH 7.0), 10 mM H2O2, 20 mM guaiacol, and 600 μL of enzyme extract. The change in absorbance at 470 nm was recorded for 1 min.

4.4. Total Soluble Protein

To estimate the total protein content of the samples, 0.1 mL of enzyme extract was mixed with 4.9 mL of Bradford reagent and incubated for 15 min after gentle vortexing. The absorbance was read at 595 nm using a spectrophotometer (1800 UV–VIS, Shimadzu Inc., Kyoto, Japan) in triplicates. Bradford solution without the extract was used as blank. Serum bovine albumin (BSA) was used as a standard protein (0, 4, 8, 12, 16, and 20 μL) to establish the calibration curve and quantification [59].

4.5. Glycine Betaine (GB)

The glycine betaine was assayed following the Grieve and Grattan [60] method. First, 250 mg of leaf tissue was ground and mixed with 10 mL of distilled water. After filtration, 1 mL extract was mixed with 1 mL sulfuric acid. A 0.5 mL of this mixture was mixed with 0.2 mL potassium tri-iodide solution and then cooled in an ice bath for 16 h. The organic layer was centrifuged at 10,000 rpm for 10 min at 0 °C. Two ml of ice-cold distilled water and 20 mL 1,2-dichloromethane were added to the mixture, and absorbance was measured at 365 nm after 2 h. The GB concentration was calculated using a standard curve and expressed in μM g−1 fresh weight of the leaf.

4.6. Proline Content

Proline concentration was quantified by following the method of Bates et al. [61]. Fresh plant leaf samples (0.5 g) were homogenized in a chilled mortar and pestle with three ml of 5-sulfosalicylic acid (3%). Leaf extract (2 mL) was gently mixed with 2 mL of acid ninhydrin and 2 mL of glacial acetic acid in test tubes before incubation for 1 h in hot water (100 °C). Toluene (4 mL) was added to the test tubes filled with the reaction mixture and vigorously shaken for 15–20 s. The absorbance was recorded at 520 nm, and proline content was calculated using a standard curve.

4.7. Hydrogen Peroxide (H2O2)

The H2O2 content of the leaves was measured spectrophotometrically at 560 nm following the colorimetric reaction [62]. In brief, 0.25 g of plant leaf samples were homogenized in 1 mL of 10% phosphoric acid, and the supernatant was used for the quantification of H2O2. Sample extracts (50 µL) were mixed with a reaction mixture (950 µL) containing 100 µM Xylenol Orange, 250 µM ammonium ferrous sulfate, 100 µM sorbitol, and 25 µM sulfuric acid. Different concentrations of H2O2 (0.25–10 µM) were used to draw the calibration curve, and the results were expressed as µM g−1 FW.

4.8. Estimation of Lipid Peroxidation (MDA)

Malondialdehyde (MDA), a biomarker of lipid peroxidation, was quantified by thiobarbituric acid (TBA) assay following the original method of Heath and Packer [63]. Leaf samples of 0.5 g were extracted with 2 mL of 0.1% trichloroacetic acid (TCA) in a cold mortar with a pestle. To stop further peroxidation, 20% butylated hydroxytoluene in absolute ethanol (40 μL) was added to the solution [64] before vortexing and centrifugation at 15,000 rpm (15 min at 4 °C). Supernatant (0.25 mL) was added to 20% TCA (1 mL) containing 0.5% TBA, mixed and centrifuged for 5 s before incubation for 30 min at 96 °C. The reaction was terminated by cooling on ice and centrifugation at 8000 rpm (3 min). To calculate the MDA concentration (nM g−1 fresh weight (FW)), non-specific absorption at 600 nm was subtracted from the absorption at 532 nm by using the absorbance coefficient (156 mM−1 cm−1) of extinction.

4.9. Total RNA Extraction and cDNA Synthesis

Total RNA was extracted by a CTAB-based protocol [65] from deep frozen leaves of two-week-old camelina seedlings after grinding to a fine powder in N2. RNA quantity was measured in a NanoDrop 1000 spectrophotometer (Thermo Fisher Scientific, Waltham, MA, USA) at 260 nm. The RNA integrity was assessed on an EcoSafe-stained 1% agarose gel after treating the samples with DNase I enzyme (Thermo Fisher Scientific). Complimentary DNAs were produced by reverse transcription of total RNA (5 μg) as a template and M-MuLV RT enzyme supplied in Maxima Reverse Transcriptase kit (Thermo Fisher Scientific) with oligo (dT)20 primers according to the manufacturer’s guidelines. Primers of selected camelina freezing tolerance genes and a control ef1 housekeeping gene (Table S1) were tested by PCR amplification using Go Taq DNA polymerase (Promega, Madison, WI, USA). PCR products with expected sizes were visualized on 1.5% (w/v) ethidium bromide-stained agarose gel in 1 × TBE buffer.

4.10. Real-Time PCR Conditions (RT-qPCR) and Gene Expression Analysis

Quantitative Real-Time PCR reactions were performed using SYBR Green I technology in a C1000 ™ Thermal Cycler (Bio-Rad, Hercules, CA, USA) using Maxima SYBR Green/ROX qPCR Master Mix (Thermo Fisher Scientific, Cat. No: K0221) in 96-well low-profile optical plates. The final volume of the qPCR reaction was 10 μL, including 1 μL of cDNA, 4 μL of Mater Mix, 0.5 μL (100 μM) of F&R primers, and 4 μL of PCR-grade water. A melting curve analysis was conducted (65–95 °C) at the end of PCR reactions to confirm the PCR product specificity. The PCR efficiency was determined and approved based on the Cq values of the standard dilutions of cDNAs for all primer pairs. A camelina ef1 gene was used as endogenous control after its stability was tested and approved for normality of residuals (Shapiro–Wilk’s test) and homogeneity of variances (Bartlett’s test) using R-Studio software (Version 3.5.1.) [66].

4.11. Synteny Analysis

The ICE1, CBF1, CBF2, CBF3, and COR6.6 paralogous information, including chromosomes location, the sequence, and the size of the genes, were retrieved from Ensembl Plants [67] using BioMart and CamRegBase; http://camregbase.org/ accessed on 1 March 2022 [68] database, then analyzed and drawn in shinyCircos R/Shiny software environment [69].

4.12. Statistical Analysis

The biochemical data were analyzed by Student’s t-test using R 4.1.2 (accessed on 1 March 2022) [70] and shown as mean values with standard deviations (±SD) among three biological replicates. Gene expression data were presented as fold changes of the examined genes calculated by the 2−∆∆Ct method [71].

5. Conclusions

The re-emerging and important camelina oilseed plant is potent for breeding toward cold-resistant cultivars, especially when winter biotypes have already been developed and cultivated. Our results based on the biochemical and transcriptome analyses indicated that the low-temperature acclimation prior to frost stress can significantly alter and rather enhance the performance of plants upon exposure to freezing stress. This became evident when almost all stress-associated biomarkers declined in cold-acclimated plants when compared to the non-acclimated ones upon stress treatment. The investigated candidate genes of Camelina under cold-acclimated and non-acclimated conditions demonstrate the role of the ICE-CBF-COR pathway in the freezing tolerance of Camelina. The results of this study indicate the importance of plant acclimation at low temperatures prior to freezing stress and reveal the capability of Camelina biotypes to cope with unfavorable environmental conditions. These results may be useful in genetic engineering and breeding programs to utilize the components of the important ICE-CBF-COR pathway in freezing tolerance objectives in connection to Camelina breeding.

Supplementary Materials

The following supporting information can be downloaded at: https://www.mdpi.com/article/10.3390/plants11223178/s1, Table S1: Target genes and oligonucleotide primers applied in RT-qPCR.

Author Contributions

Conceptualization, J.S. and S.K.K.; methodology, J.S., A.D., and N.B.; validation, A.D., J.S., and I.M.; formal analysis, J.S. and I.M.; investigation, J.S., S.K.K., and A.D.; resources, A.D., A.K., and S.K.K.; data curation, J.S. and A.D.; writing—original draft preparation, J.S. and I.M.; writing—review and editing, J.S., D.K., A.D., I.M., P.G.K., A.K., and I.P.; visualization, J.S. and I.M. All authors have read and agreed to the published version of the manuscript.

Funding

The APC was funded by the Hungarian University of Agriculture and Life Sciences (MATE).

Acknowledgments

The authors would like to thank the Genetics and Agricultural Biotechnology Institute of Tabarestan (GABIT) and Sari Agricultural Sciences and Natural Resources University, Sari, Iran, for the financial support of the study (grant no. AD1399).

Conflicts of Interest

The authors declare no conflict of interest.

References

  1. Campbell, M. Camelina—An Alternative Oil Crop. In Biokerosene; Kaltschmitt, M., Neuling, U., Eds.; Springer: Berlin/Heidelberg, Germany, 2018; pp. 259–275. [Google Scholar] [CrossRef]
  2. Soorni, J.; Shobbar, Z.S.; Kahrizi, D.; Zanetti, F.; Sadeghi, K.; Rostampour, S.; Kovács, P.G.; Kiss, A.; Mirmazloum, I. Correlational analysis of agronomic and seed quality traits in Camelina sativa doubled haploid lines under rain-fed condition. Agronomy 2022, 12, 359. [Google Scholar] [CrossRef]
  3. Choi, S.H.; Park, N.; Lee, K.Y.; Missaoui, A.M.; Lee, G.J. Novel genes in response to varying water deficit in oil crop Camelina sativa. Euphytica 2019, 215, 86. [Google Scholar] [CrossRef]
  4. Nishchenko, L.V.; Hasanuzzaman, M. Enhancement of Abiotic Stress Tolerance in Camelina sativa: Conventional Breeding and Biotechnology. In The Plant Family Brassicaceae; Hasanuzzaman, M., Ed.; Springer: Singapore, 2020; pp. 195–202. [Google Scholar] [CrossRef]
  5. Soorni, J.; Kazemitabar, S.K.; Kahrizi, D.; Dehestani, A.; Bagheri, N. Genetic analysis of freezing tolerance in camelina [Camelina sativa (L.) Crantz] by diallel cross of winter and spring biotypes. Planta 2021, 253, 9. [Google Scholar] [CrossRef]
  6. Kim, H.S.; Oh, J.M.; Luan, S.; Carlson, J.E.; Ahn, S.J. Cold stress causes rapid but differential changes in properties of plasma membrane H+-ATPase of camelina and rapeseed. J. Plant Physiol. 2013, 170, 828–837. [Google Scholar] [CrossRef]
  7. Hayat, F.; Sun, Z.; Ni, Z.; Iqbal, S.; Xu, W.; Gao, Z.; Qiao, Y.; Tufail, M.A.; Jahan, M.S.; Khan, U.; et al. Exogenous melatonin improves cold tolerance of strawberry (Fragaria × ananassa Duch.) through modulation of DREB/CBF-COR pathway and antioxidant defense system. Horticulturae 2022, 8, 194. [Google Scholar] [CrossRef]
  8. Barrero-Gil, J.; Salinas, J. Post-translational regulation of cold acclimation response. Plant Sci. 2013, 205–206, 48–54. [Google Scholar] [CrossRef] [Green Version]
  9. Peng, X.; Wu, Q.; Teng, L.; Tang, F.; Pi, Z.; Shen, S. Transcriptional regulation of the paper mulberry under cold stress as revealed by a comprehensive analysis of transcription factors. BMC Plant Biol. 2015, 15, 108. [Google Scholar] [CrossRef] [Green Version]
  10. Mehrotra, S.; Verma, S.; Kumar, S.; Kumari, S.; Mishra, B.N. Transcriptional regulation and signalling of cold stress response in plants: An overview of current understanding. Environ. Exp. Bot. 2020, 180, 104243. [Google Scholar] [CrossRef]
  11. Rapacz, M.; Jurczyk, B.; Krępski, T.; Płażek, A. C-repeat binding transcription factors from Miscanthus × giganteus and their expression at a low temperature. Ind. Crop Prod. 2018, 113, 283–287. [Google Scholar] [CrossRef]
  12. Shi, Y.; Huang, J.; Sun, T.; Wang, X.; Zhu, C.; Ai, Y.; Gu, H. The precise regulation of different COR genes by individual CBF transcription factors in Arabidopsis thaliana. J. Integr. Plant Biol. 2017, 59, 118–133. [Google Scholar] [CrossRef] [PubMed] [Green Version]
  13. Hu, Y.; Jiang, L.; Wang, F.; Yu, D. Jasmonate regulates the inducer of CBF expression–C-repeat binding factor/DRE binding factor1 cascade and freezing tolerance in Arabidopsis. Plant Cell 2013, 25, 2907–2924. [Google Scholar] [CrossRef] [PubMed] [Green Version]
  14. Jaglo, K.R.; Kleff, S.; Amundsen, K.L.; Zhang, X.; Haake, V.; Zhang, J.Z.; Thomashow, M.F. Components of the Arabidopsis C-repeat/dehydration-responsive element binding factor cold-response pathway are conserved in Brassica napus and other plant species. Plant Physiol. 2001, 127, 910–917. [Google Scholar] [CrossRef] [PubMed]
  15. Hsieh, T.H.; Lee, J.T.; Yang, P.T.; Chiu, L.H.; Charng, Y.; Wang, Y.C.; Chan, M.T. Heterology expression of the Arabidopsis C-repeat/dehydration response element binding factor 1 gene confers elevated tolerance to chilling and oxidative stresses in transgenic tomato. Plant Physiol. 2002, 129, 1086–1094. [Google Scholar] [CrossRef] [PubMed] [Green Version]
  16. Thomashow, M.F.; Gilmour, S.J.; Stockinger, E.J.; Jaglo-Ottosen, K.R.; Zarka, D.G. Role of the Arabidopsis CBF transcriptional activators in cold acclimation. Physiol. Plant 2001, 112, 171–175. [Google Scholar] [CrossRef]
  17. Savitch, L.V.; Allard, G.; Seki, M.; Robert, L.S.; Tinker, N.A.; Huner, N.P.; Shinozaki, K.; Singh, J. The effect of overexpression of two Brassica CBF/DREB1-like transcription factors on photosynthetic capacity and freezing tolerance in Brassica napus. Plant Cell Physiol. 2005, 46, 1525–1539. [Google Scholar] [CrossRef]
  18. Ito, Y.; Katsura, K.; Maruyama, K.; Taji, T.; Kobayashi, M.; Seki, M.; Shinozaki, K.; Yamaguchi-Shinozaki, K. Functional analysis of rice DREB1/CBF-type transcription factors involved in cold-responsive gene expression in transgenic rice. Plant Cell Physiol. 2006, 47, 141–153. [Google Scholar] [CrossRef] [Green Version]
  19. Qin, F.; Sakuma, Y.; Li, J.; Liu, Q.; Li, Y.Q.; Shinozaki, K.; Yamaguchi-Shinozaki, K. Cloning and functional analysis of a novel DREB1/CBF transcription factor involved in cold-responsive gene expression in Zea mays L. Plant Cell Physiol. 2004, 45, 1042–1052. [Google Scholar] [CrossRef] [Green Version]
  20. Vágújfalvi, A.; Aprile, A.; Miller, A.; Dubcovsky, J.; Delugu, G.; Galiba, G.; Cattivelli, L. The expression of several Cbf genes at the Fr-A2 locus is linked to frost resistance in wheat. Mol. Gen. Genet. 2005, 274, 506–514. [Google Scholar] [CrossRef]
  21. Liu, L.; Li, S.; Guo, J.; Li, N.; Jiang, M.; Li, X. Low temperature tolerance is depressed in wild-type and abscisic acid-deficient mutant barley grown in Cd-contaminated soil. J. Hazard. Mater. 2022, 15, 128489. [Google Scholar] [CrossRef]
  22. Zhang, X.; Fowler, S.G.; Cheng, H.; Lou, Y.; Rhee, S.Y.; Stockinger, E.J.; Thomashow, M.F. Freezing-sensitive tomato has a functional CBF cold response pathway, but a CBF regulon that differs from that of freezing-tolerant Arabidopsis. Plant J. 2004, 39, 905–919. [Google Scholar] [CrossRef]
  23. Hui-Ming, G.U.O.; Zhao-Chun, L.I.; Zhang, H.; Yue-Zhi, X.I.N.; CHENG, H.M. Cloning of cotton CBF gene for cold tolerance and its expression in transgenic tobacco. Acta Agron. Sin. 2011, 37, 286–293. [Google Scholar] [CrossRef]
  24. Huang, B.O.; Jin, L.; Liu, J. Molecular cloning and functional characterization of a DREB1/CBF-like gene (GhDREB1L) from cotton. Sci. China Life Sci. 2007, 50, 7–14. [Google Scholar] [CrossRef] [PubMed] [Green Version]
  25. Wang, X.; Liu, S.; Liu, X.; Chen, Z.; Liu, X.; Pang, Y.; Sun, X.; Tang, K. Molecular cloning and characterization of a CBF gene from Capsella bursa-pastoris. DNA Seq. 2004, 15, 180–187. [Google Scholar] [CrossRef] [PubMed]
  26. Noman, A.; Kanwal, H.; Khalid, N.; Sanaullah, T.; Tufail, A.; Masood, A.; Sabir, S.U.R.; Aqeel, M.; He, S. Perspective research progress in cold responses of Capsella bursa-pastoris. Front. Plant Sci. 2017, 8, 1388. [Google Scholar] [CrossRef] [PubMed] [Green Version]
  27. Hwarari, D.; Guan, Y.; Ahmad, B.; Movahedi, A.; Min, T.; Hao, Z.; Lu, Y.; Chen, J.; Yang, L. ICE-CBF-COR signaling cascade and its regulation in plants responding to cold stress. Int. J. Mol. Sci. 2022, 23, 1549. [Google Scholar] [CrossRef] [PubMed]
  28. Li, X.; Cai, J.; Liu, F.; Dai, T.; Cao, W.; Jiang, D. Cold priming drives the sub-cellular antioxidant systems to protect photosynthetic electron transport against subsequent low temperature stress in winter wheat. Plant Physiol. Biochem. PPB 2014, 82, 34–43. [Google Scholar] [CrossRef] [PubMed]
  29. Ritonga, F.N.; Chen, S. Physiological and Molecular Mechanism Involved in Cold Stress Tolerance in Plants. Plants 2020, 9, 560. [Google Scholar] [CrossRef] [PubMed]
  30. Yerlikaya, B.A.; Ömezli, S.; Aydoğan, N. Environment, Climate, Plant and Vegetation Growth. In Climate Change Forecasting and Modeling for the Year of 2050; Springer: Cham, Switzerland, 2020; pp. 109–122. [Google Scholar] [CrossRef]
  31. Walia, M.K.; Zanetti, F.; Gesch, R.W.; Krzyżaniak, M.; Eynck, C.; Puttick, D.; Alexopoulou, E.; Royo-Esnal, A.; Stolarski, M.J.; Isbell, T.; et al. Winter camelina seed quality in different growing environments across Northern America and Europe. Ind. Crops Prod. 2021, 169, 113639. [Google Scholar] [CrossRef]
  32. Wang, H.; Doğramacı, M.; Anderson, J.V.; Horvath, D.P.; Chao, W.S. Transcript profiles differentiate cold acclimation-induced processes in a summer and winter biotype of Camelina. Plant Mol. Biol. Rep. 2022, 40, 359–375. [Google Scholar] [CrossRef]
  33. Wittenberg, A.; Anderson, J.V.; Berti, M.T. Winter and summer annual biotypes of camelina have different morphology and seed characteristics. Ind. Crops Prod. 2019, 135, 230–237. [Google Scholar] [CrossRef]
  34. Chao, W.S.; Wang, H.; Horvath, D.P.; Anderson, J.V. Selection of endogenous reference genes for qRT-PCR analysis in Camelina sativa and identification of FLOWERING LOCUS C allele-specific markers to differentiate summer-and winter-biotypes. Ind. Crops Prod. 2019, 129, 495–502. [Google Scholar] [CrossRef]
  35. Thalhammer, A.; Pagter, M.; Hincha, D.K.; Zuther, E. Measuring Freezing Tolerance of Leaves and Rosettes: Electrolyte Leakage and Chlorophyll Fluorescence Assays. In Plant Cold Acclimation; Hincha, D., Zuther, E., Eds.; Methods in Molecular Biology; Humana Press: New York, NY, USA, 2020; Volume 2156. [Google Scholar] [CrossRef]
  36. Soorni, J.; Kazemitabar, S.K.; Kahrizi, D.; Dehestani, A.; Bagheri, N. Screening of camelina (Camelina sativa L.) doubled haploid lines for freezing tolerance in the seedling stage. Genetika 2017, 49, 173–181. [Google Scholar] [CrossRef]
  37. Arslan, Ö.; Eyidoğan, F.; Ekmekçi, Y. Freezing tolerance of chickpea: Biochemical and molecular changes at vegetative stage. Biol. Plant 2018, 62, 140–148. [Google Scholar] [CrossRef]
  38. Dreyer, A.; Dietz, K.J. Reactive oxygen species and the redox-regulatory network in cold stress acclimation. Antioxidants 2018, 7, 169. [Google Scholar] [CrossRef] [PubMed] [Green Version]
  39. Xing, W.; Rajashekar, C.B. Glycine betaine involvement in freezing tolerance and water stress in Arabidopsis thaliana. Environ. Exp. Bot. 2001, 46, 21–28. [Google Scholar] [CrossRef]
  40. Kaur, G.; Kumar, S.; Thakur, P.; Malik, J.A.; Bhandhari, K.; Sharma, K.D.; Nayyar, H. Involvement of proline in response of chickpea (Cicer arietinum L.) to chilling stress at reproductive stage. Sci. Hortic. 2011, 128, 174–181. [Google Scholar] [CrossRef]
  41. Chinnusamy, V.; Zhu, J.; Zhu, J.K. Cold stress regulation of gene expression in plants. Trends Plant Sci. 2007, 12, 444–451. [Google Scholar] [CrossRef]
  42. Knight, M.R.; Knight, H. Low-temperature perception leading to gene expression and cold tolerance in higher plants. N. Phytol. 2012, 195, 737–751. [Google Scholar] [CrossRef]
  43. Novillo, F.; Alonso, J.M.; Ecker, J.R.; Salinas, J. CBF2/DREB1C is a negative regulator of CBF1/DREB1B and CBF3/DREB1A expression and plays a central role in stress tolerance in Arabidopsis. Proc. Natl. Acad. Sci. USA 2004, 101, 3985–3990. [Google Scholar] [CrossRef] [Green Version]
  44. Novillo, F.; Medina, J.; Salinas, J. Arabidopsis CBF1 and CBF3 have a different function than CBF2 in cold acclimation and define different gene classes in the CBF regulon. Proc. Natl. Acad. Sci. USA 2007, 104, 21002–21007. [Google Scholar] [CrossRef] [Green Version]
  45. Bai, L.; Liu, Y.; Mu, Y.; Anwar, A.; He, C.; Yan, Y.; Li, Y.; Yu, X. Heterotrimeric G-protein γ subunit CsGG3.2 positively regulates the expression of CBF genes and chilling tolerance in cucumber. Front. Plant Sci. 2018, 9, 488. [Google Scholar] [CrossRef] [PubMed] [Green Version]
  46. Jia, Y.; Ding, Y.; Shi, Y.; Zhang, X.; Gong, Z.; Yang, S. The cbfs triple mutants reveal the essential functions of CBFs in cold acclimation and allow the definition of CBF regulons in Arabidopsis. N. Phytol. 2016, 212, 345–353. [Google Scholar] [CrossRef] [PubMed] [Green Version]
  47. Zhao, C.; Zhang, Z.; Xie, S.; Si, T.; Li, Y.; Zhu, J.K. Mutational evidence for the critical role of CBF genes in cold acclimation in Arabidopsis. Plant Physiol. 2016, 171, 2744–2759. [Google Scholar] [CrossRef] [Green Version]
  48. Wang, X.; Wang, L.; Wang, Y.; Liu, H.; Hu, D.; Zhang, N.; Zhang, S.; Cao, H.; Cao, Q.; Zhang, Z.; et al. Arabidopsis PcaP2 plays an important role in chilling tolerance and ABA response by activating CBF-and SnRK2-mediated transcriptional regulatory network. Front. Plant Sci. 2018, 9, 215. [Google Scholar] [CrossRef] [PubMed] [Green Version]
  49. Anderson, J.V.; Neubauer, M.; Horvath, D.P.; Chao, W.S.; Berti, M.T. Analysis of Camelina sativa transcriptomes identified specific transcription factors and processes associated with freezing tolerance in a winter biotype. Ind. Crops Prod. 2022, 177, 114414. [Google Scholar] [CrossRef]
  50. Horvath, D.; Anderson, J.V.; Chao, W.S.; Zheng, P.; Buchwaldt, M.; Parkin, I.A.; Dorn, K. Genes associated with chloroplasts and hormone-signaling, and transcription factors other than CBFs are associated with differential survival after low temperature treatments of Camelina sativa biotypes. PloS ONE 2019, 14, 0217692. [Google Scholar] [CrossRef]
  51. Tuteja, N.; Gill, S.S.; Tiburcio, A.F.; Tuteja, R. Improving Crop Resistance to Abiotic Stress; John Wiley & Sons: Hoboken, NJ, USA; Cambridge University Press: Cambridge, UK, 2012; 1534. [Google Scholar] [CrossRef]
  52. Cortés, A.J.; López-Hernández, F.; Blair, M.W. Genome–Environment Associations, an Innovative Tool for Studying Heritable Evolutionary Adaptation in Orphan Crops and Wild Relatives. Front. Genet. 2022, 13, 910386. [Google Scholar] [CrossRef]
  53. Cortés, A.J.; López-Hernández, F.; Osorio-Rodriguez, D. Predicting thermal adaptation by looking into populations’ genomic past. Front. Genet. 2020, 11, 564515. [Google Scholar] [CrossRef]
  54. Buitrago-Bitar, M.A.; Cortés, A.J.; López-Hernández, F.; Londoño-Caicedo, J.M.; Muñoz-Florez, J.E.; Muñoz, L.C.; Blair, M.W. Allelic Diversity at Abiotic Stress Responsive Genes in Relationship to Ecological Drought Indices for Cultivated Tepary Bean, Phaseolus acutifolius A. Gray, and Its Wild Relatives. Genes 2021, 12, 556. [Google Scholar] [CrossRef]
  55. López-Hernández, F.; Cortés, A.J. Last-Generation Genome–Environment Associations Reveal the Genetic Basis of Heat Tolerance in Common Bean (Phaseolus vulgaris L.). Front. Genet. 2019, 10, 22. [Google Scholar] [CrossRef] [Green Version]
  56. Sairam, R.K.; Rao, K.V.; Srivastava, G.C. Differential response of wheat genotypes to long term salinity stress in relation to oxidative stress, antioxidant activity and osmolyte concentration. Plant Sci. 2002, 163, 1037–1046. [Google Scholar] [CrossRef]
  57. Chance, B.; Maehly, A.C. [136] Assay of catalases and peroxidases. Methods Enzymol. 1955, 2, 764–775. [Google Scholar] [CrossRef]
  58. Giannopolitis, C.N.; Ries, S.K. Superoxide dismutases: II. Purification and quantitative relationship with water-soluble protein in seedlings. Plant Physiol. 1977, 59, 315–318. [Google Scholar] [CrossRef] [PubMed] [Green Version]
  59. Bradford, M.M. A rapid and sensitive method for the quantitation of microgram quantities of protein utilizing the principle of protein-dye binding. Anal. Biochem. 1976, 72, 248–254. [Google Scholar] [CrossRef]
  60. Grieve, C.M.; Grattan, S.R. Rapid assay for determination of water soluble quaternary ammonium compounds. Plant Soil. 1983, 70, 303–307. [Google Scholar] [CrossRef]
  61. Bates, L.S.; Waldren, R.P.; Teare, I.D. Rapid determination of free proline for water-stress studies. Plant Soil 1973, 39, 205–207. [Google Scholar] [CrossRef]
  62. Kellős, T.; Tímár, I.; Szilágyi, V.; Szalai, G.; Galiba, G.; Kocsy, G. Stress hormones and abiotic stresses have different effects on antioxidants in maize lines with different sensitivity. Plant Biol. 2008, 10, 563–572. [Google Scholar] [CrossRef]
  63. Heath, R.L.; Packer, L. Photoperoxidation in isolated chloroplasts: I. Kinetics and stoichiometry of fatty acid peroxidation. Arch. Biochem. Biophys. 1968, 125, 189–198. [Google Scholar] [CrossRef]
  64. Oszlányi, R.; Mirmazloum, I.; Pónya, Z.; Szegő, A.; Jamal, S.; Bat-Erdene, O.; Papp, I. Oxidative stress level and dehydrin gene expression pattern differentiate two contrasting cucumber F1 hybrids under high fertigation treatment. Int. J. Biol. Macromol. 2020, 161, 864–874. [Google Scholar] [CrossRef]
  65. Jaakola, L.; Pirttilä, A.M.; Halonen, M.; Hohtola, A. Isolation of high quality RNA from bilberry (Vaccinium myrtillus L.) fruit. Mol. Biotechnol. 2001, 19, 201–203. [Google Scholar] [CrossRef]
  66. Rstudio Team. Rstudio: Integrated Development Environment for R; Rstudio, Inc.: Boston, MA, USA, 2015; Available online: http://www.rstudio.com/ (accessed on 1 March 2022).
  67. Bolser, D.M.; Staines, D.M.; Perry, E.; Kersey, P.J. Ensembl plants: Integrating tools for visualizing, mining, and analyzing plant genomic data. In Plant Genomics Databases; Humana Press: New York, NY, USA, 2017; pp. 1–31. [Google Scholar] [CrossRef]
  68. Gomez-Cano, F.; Carey, L.; Lucas, K.; García Navarrete, T.; Mukundi, E.; Lundback, S.; Schnell, D.; Grotewold, E. CamRegBase: A gene regulation database for the biofuel crop Camelina sativa. Database 2020, 2020, baaa075. [Google Scholar] [CrossRef] [PubMed]
  69. Yu, Y.; Ouyang, Y.; Yao, W. ShinyCircos: An R/Shiny application for interactive creation of Circos plot. Bioinformatics 2018, 34, 1229–1231. [Google Scholar] [CrossRef] [PubMed] [Green Version]
  70. R Core Team. R: A Language and Environment for Statistical Computing; R Foundation for Statistical Computing: Vienna, Austria, 2022; Available online: http://www.R-project.org (accessed on 1 March 2022).
  71. Livak, K.J.; Schmittgen, T.D. Analysis of relative gene expression data using real-time quantitative PCR and the 2−ΔΔCT method. Methods 2001, 25, 402–408. [Google Scholar] [CrossRef] [PubMed]
Figure 1. The effect of freezing stress on biochemical properties of two Camelina biotypes (freezing sensitive (FS) and freezing tolerant (FT)) with (AC) and without cold acclimation (NA). EL: electrolyte leakage; CAT: catalase; SOD: superoxide dismutase; GPX: guaiacol peroxidase; MDA: malondialdehyde; GB: glycine betaine. The ns, *, **, and *** show non-significant differences or significant differences at p ≤ 5%, 1%, and 0.1%, respectively.
Plants 11 03178 g001aPlants 11 03178 g001b
Figure 2. The CsICE1, CsCBF1, CsCBF2, CsCBF3, and CsCOR6.6 genes in two Camelina biotypes (freezing sensitive (FS) and freezing tolerant (FT)) with (AC) and without cold acclimation (NA) after freezing stress. The ns, *, **, and *** show non-significant differences or significant differences at p ≤ 5%, 1%, and 0.1%, respectively.
Plants 11 03178 g002aPlants 11 03178 g002b
Figure 3. Synteny analysis of the selected ICE-CBF-COR genes in A. thaliana and C. sativa. The At_chr and Cs_chr show the chromosome number in A. thaliana and C. sativa, respectively. Three sub-genomes of C. sativa represent in different green colors.
Plants 11 03178 g003
Figure 4. The schematic diagram illustrating the experiment and treatment design.
Plants 11 03178 g004
Table 1. Comparison of the selected ICE-CBF-COR genes in A. thaliana and C. sativa.
Gene NameAt Gene Stable IDChr (n = 5)Length
bp (aa)
Cs Gene Stable IDChr (n = 20)Length bp (aa)E-ValueIdentity (%)
ICE1AT3G2674432612 (494)Csa09g01138091497 (255)4.67 × 10−396.64
Csa06g00653062171 (499)093.79
Csa04g01236042581 (349)093.57
CBF1 (CsDREB1b)AT4G2549041216 (213)Csa10g017460101218 (212)3.33 × 10−12785.85
Csa12g02768012929 (211)3.27 × 10−12786.26
NA----
CBF2 (CsDREB1c)AT4G254704985 (216)Csa11g019080112540 (217)1.37 × 10−7153.16
Csa10g017480101008 (218)1.11 × 10−13283.49
Csa12g027700121008 (217)8.46 × 10−9480.77
CBF3 (CsDREB1a)AT4G2548041390 (216)Csa12g02769012995 (218)6.83 × 10−12984.16
Csa11g019070111093 (129)7.78 × 10−9785.15
Csa10g01747010953 (218)6.33 × 10−13083.27
COR6.6AT5G1597051024 (66)Csa08g00812081428 (66)9.19 × 10−2493.94
Csa13g018780131619 (66)9.19 × 10−2493.94
Csa20g02351020845 (66)3.14 × 10−2392.42
Publisher’s Note: MDPI stays neutral with regard to jurisdictional claims in published maps and institutional affiliations.

