
Autotetraploidization Gives Rise to Differential Gene Expression in Response to Saline Stress in Rice
 , and
, and 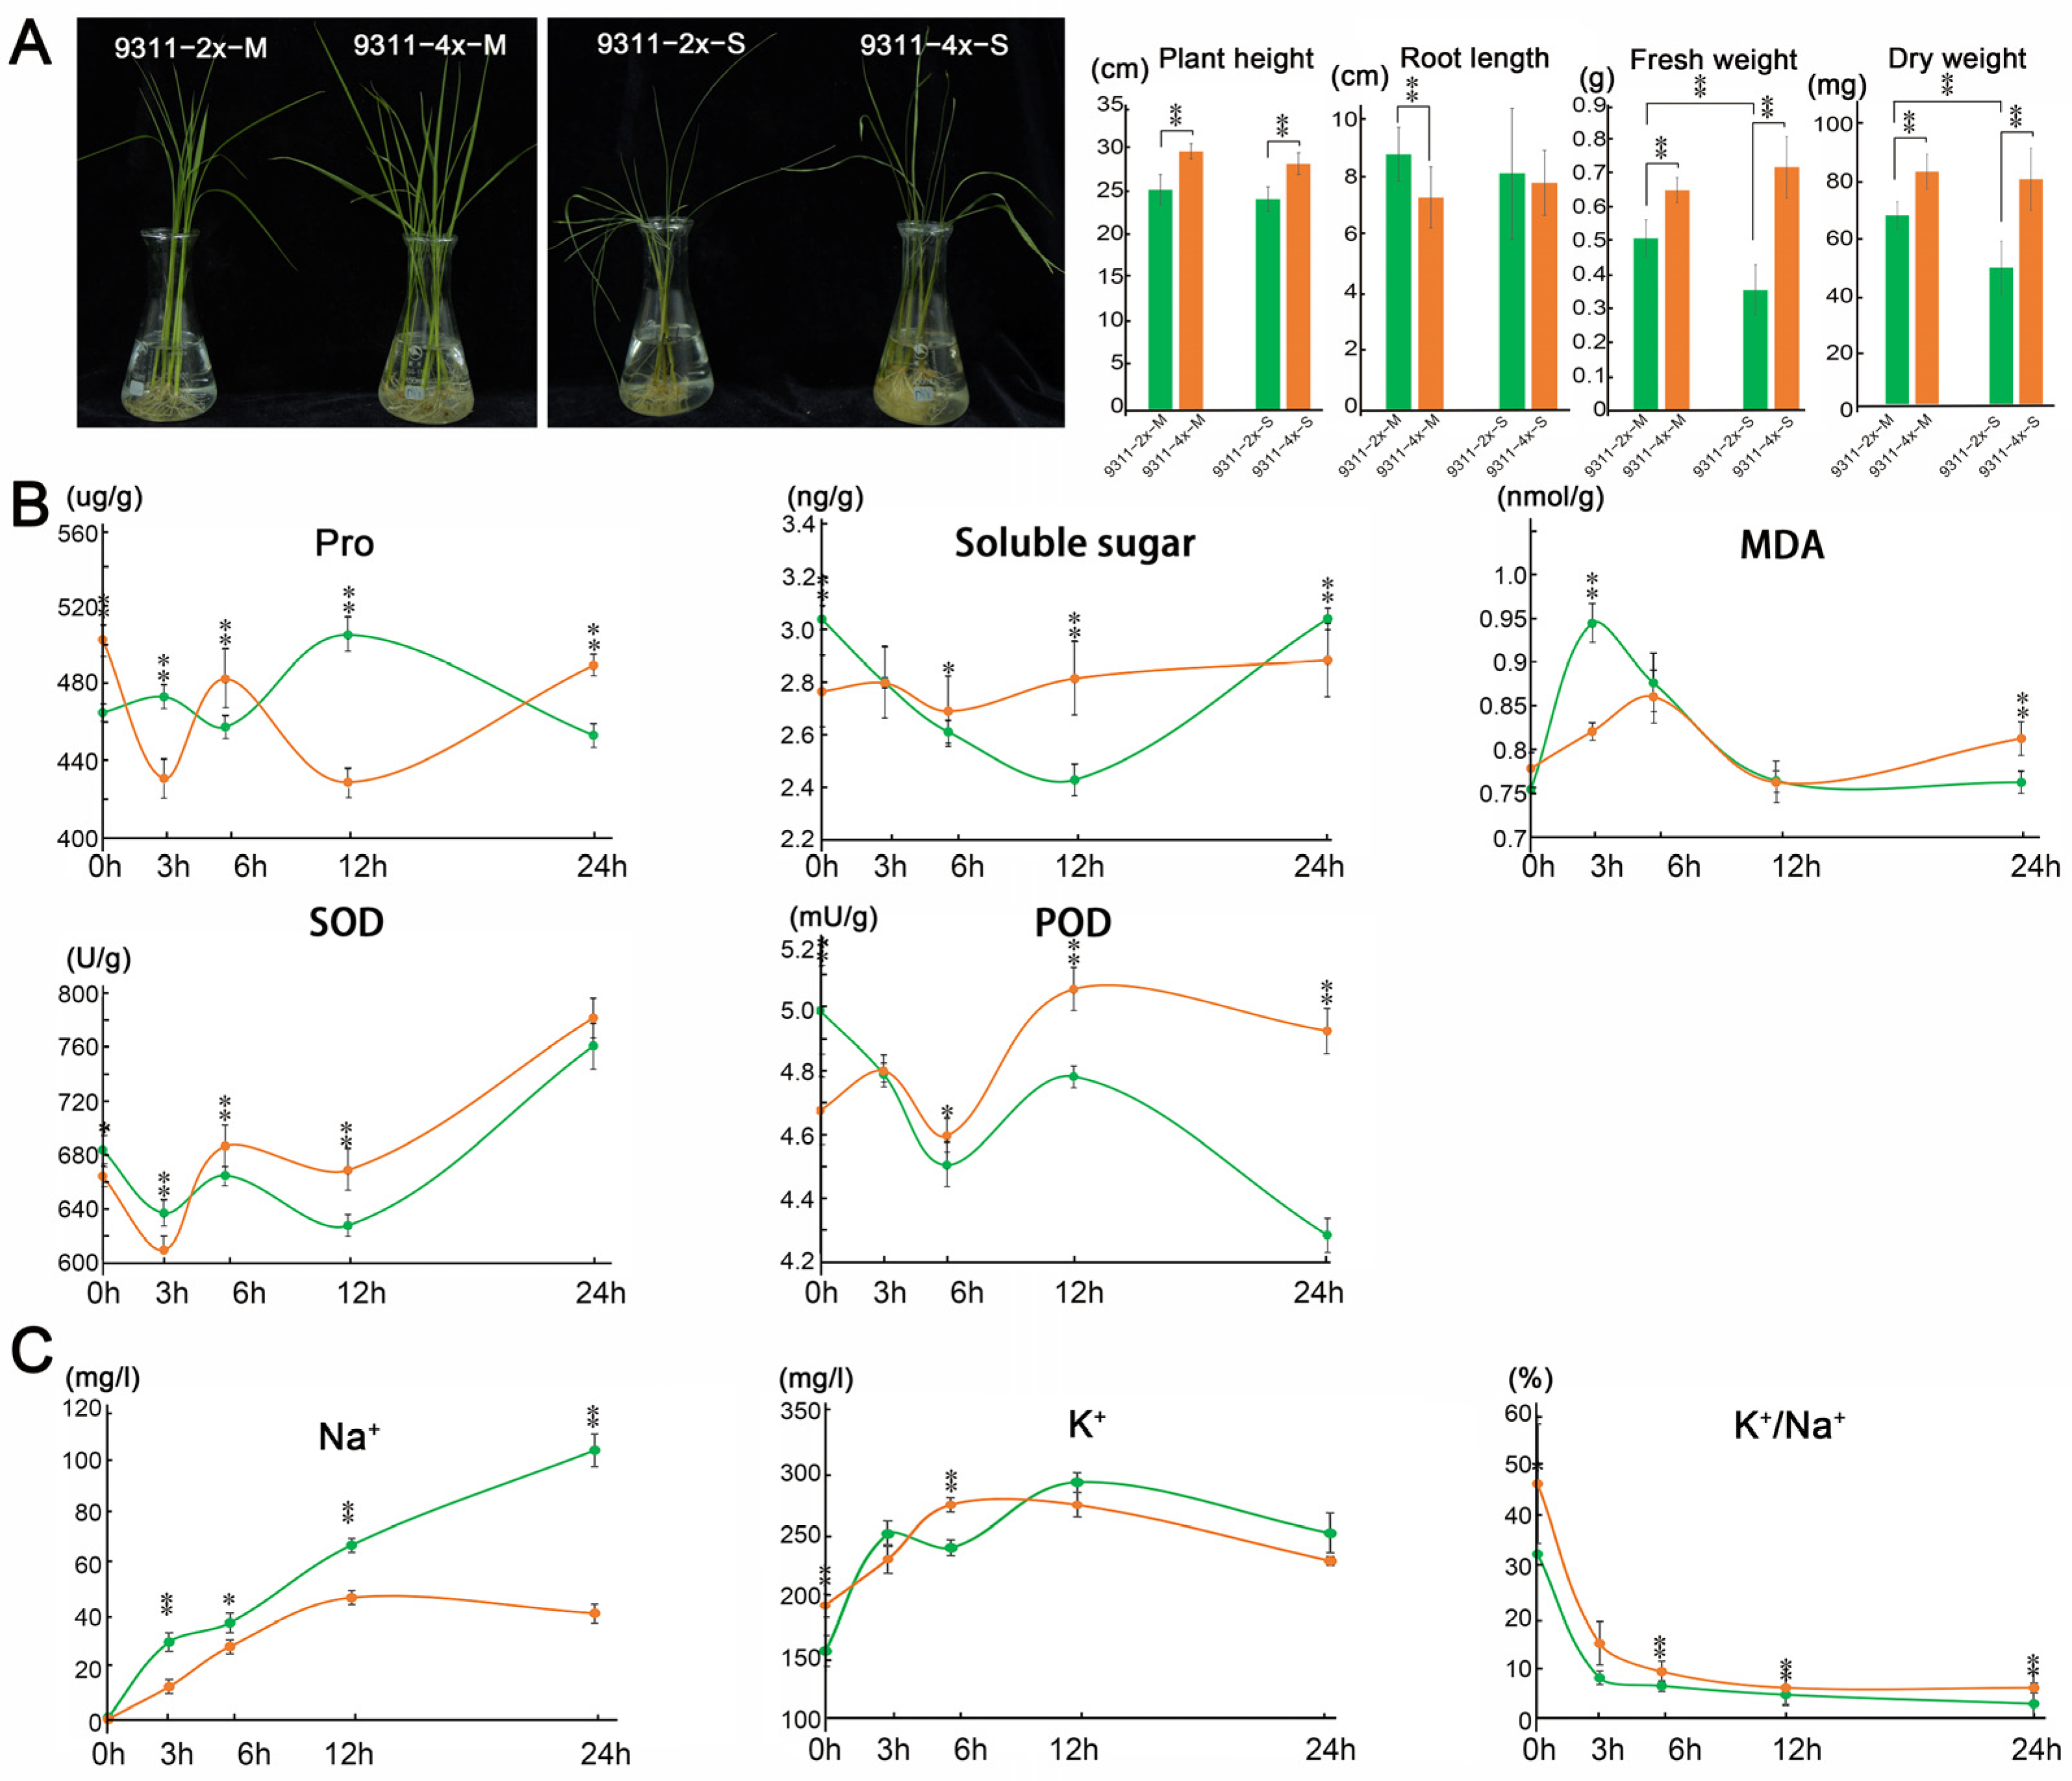
Abstract
:1. Introduction
2. Results
2.1. The Phenotypes and Ionic Content Were Altered Following Saline Stress in 9311-2x and 9311-4x Rice
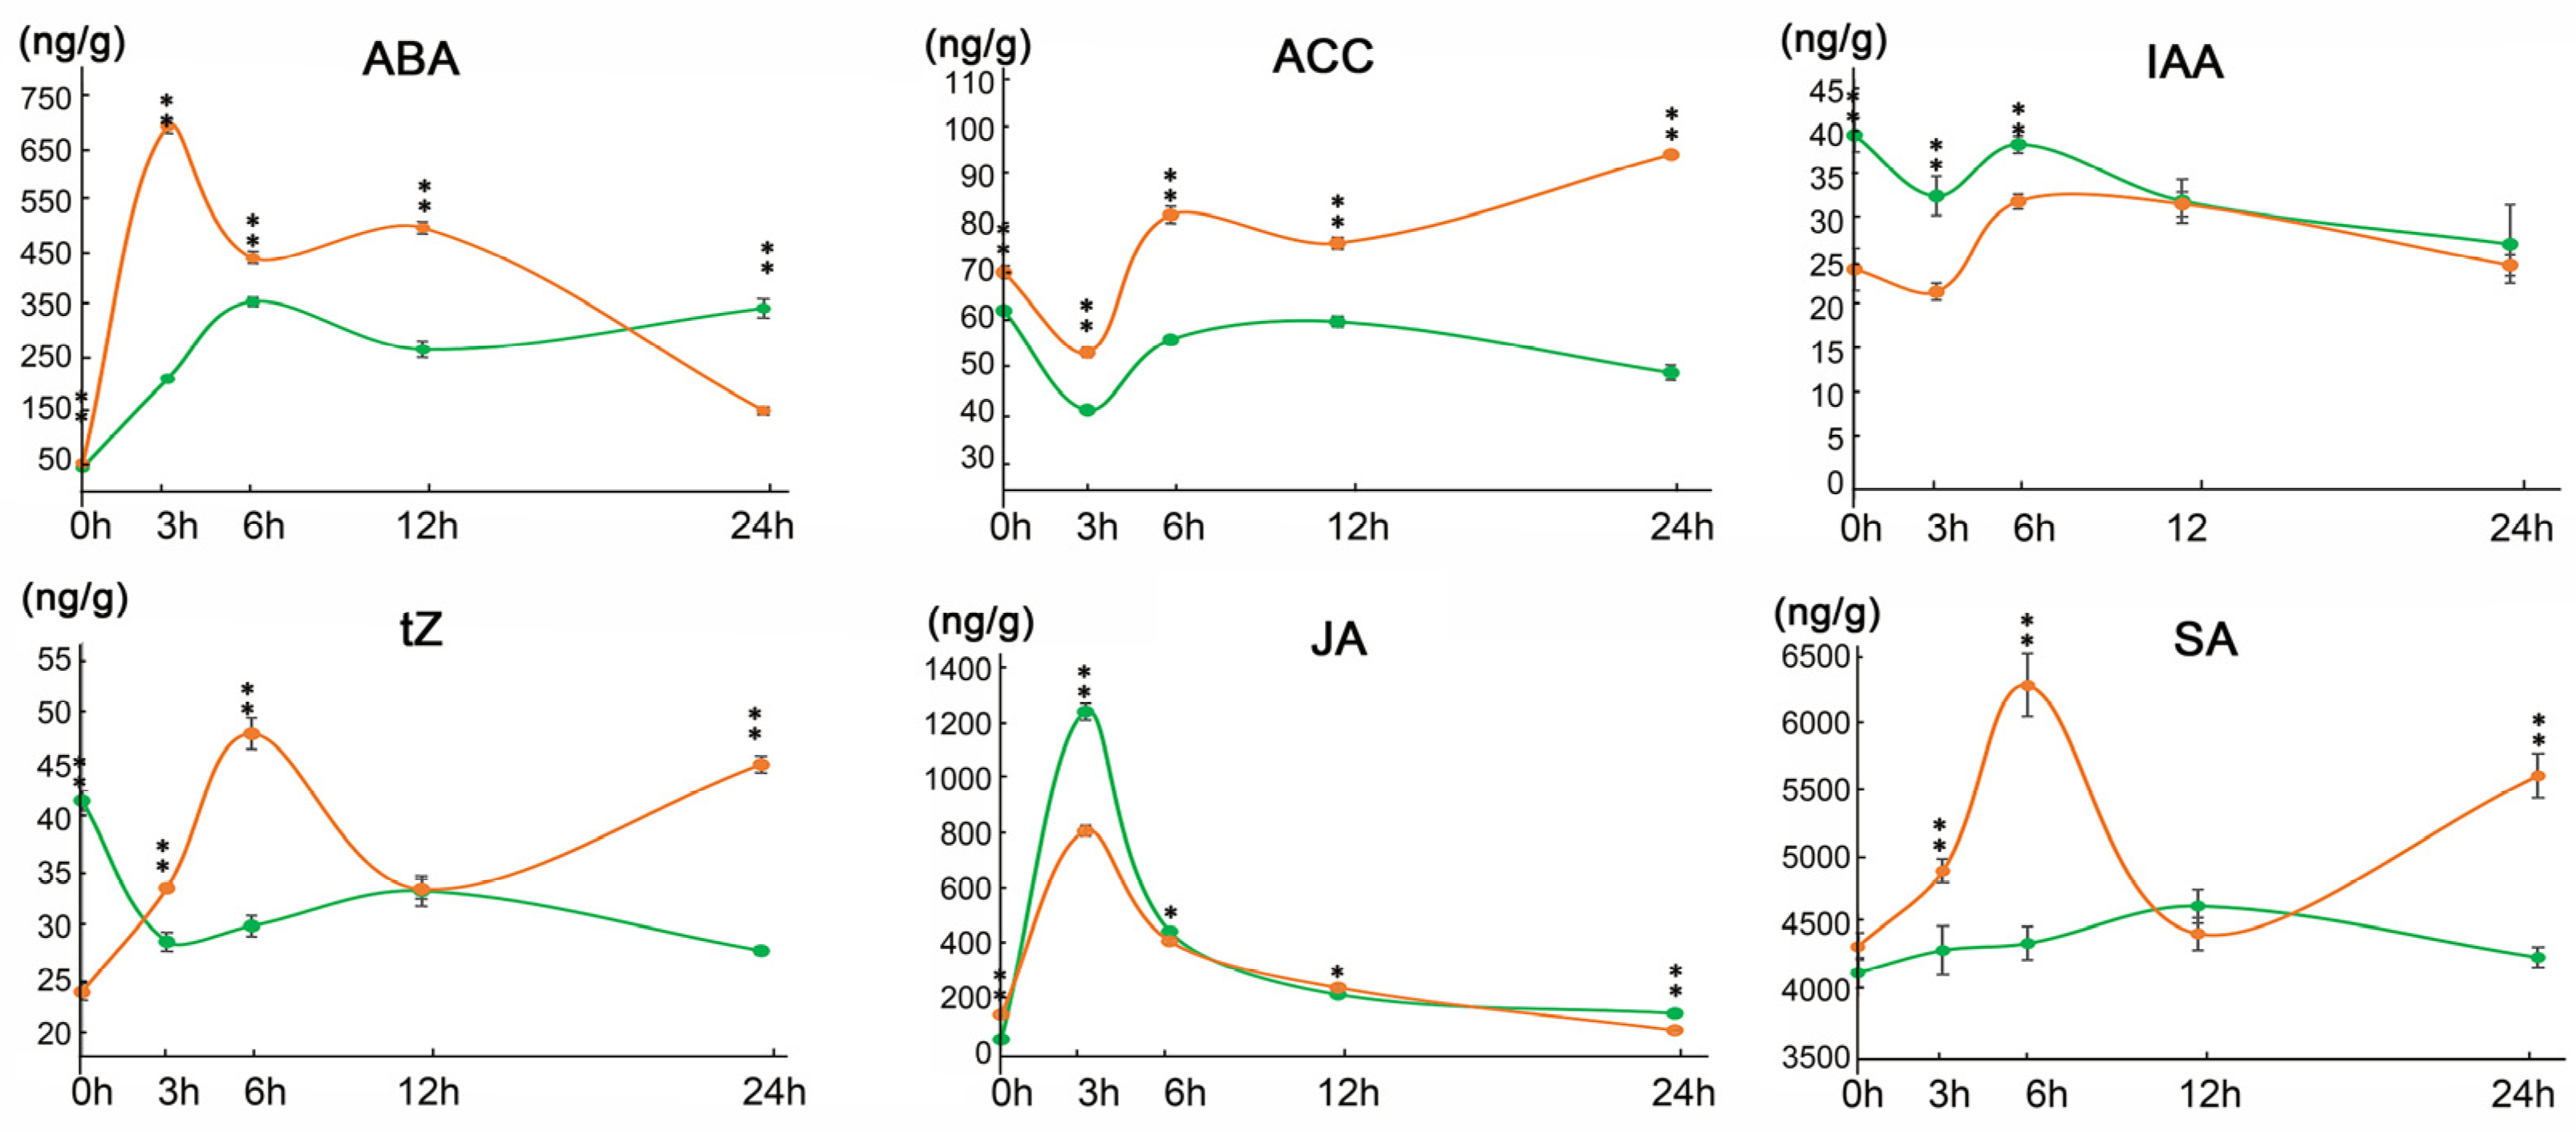
2.2. The Phytohormones Level Were Altered Following Saline Stress in 9311-2x and 9311-4x Rice
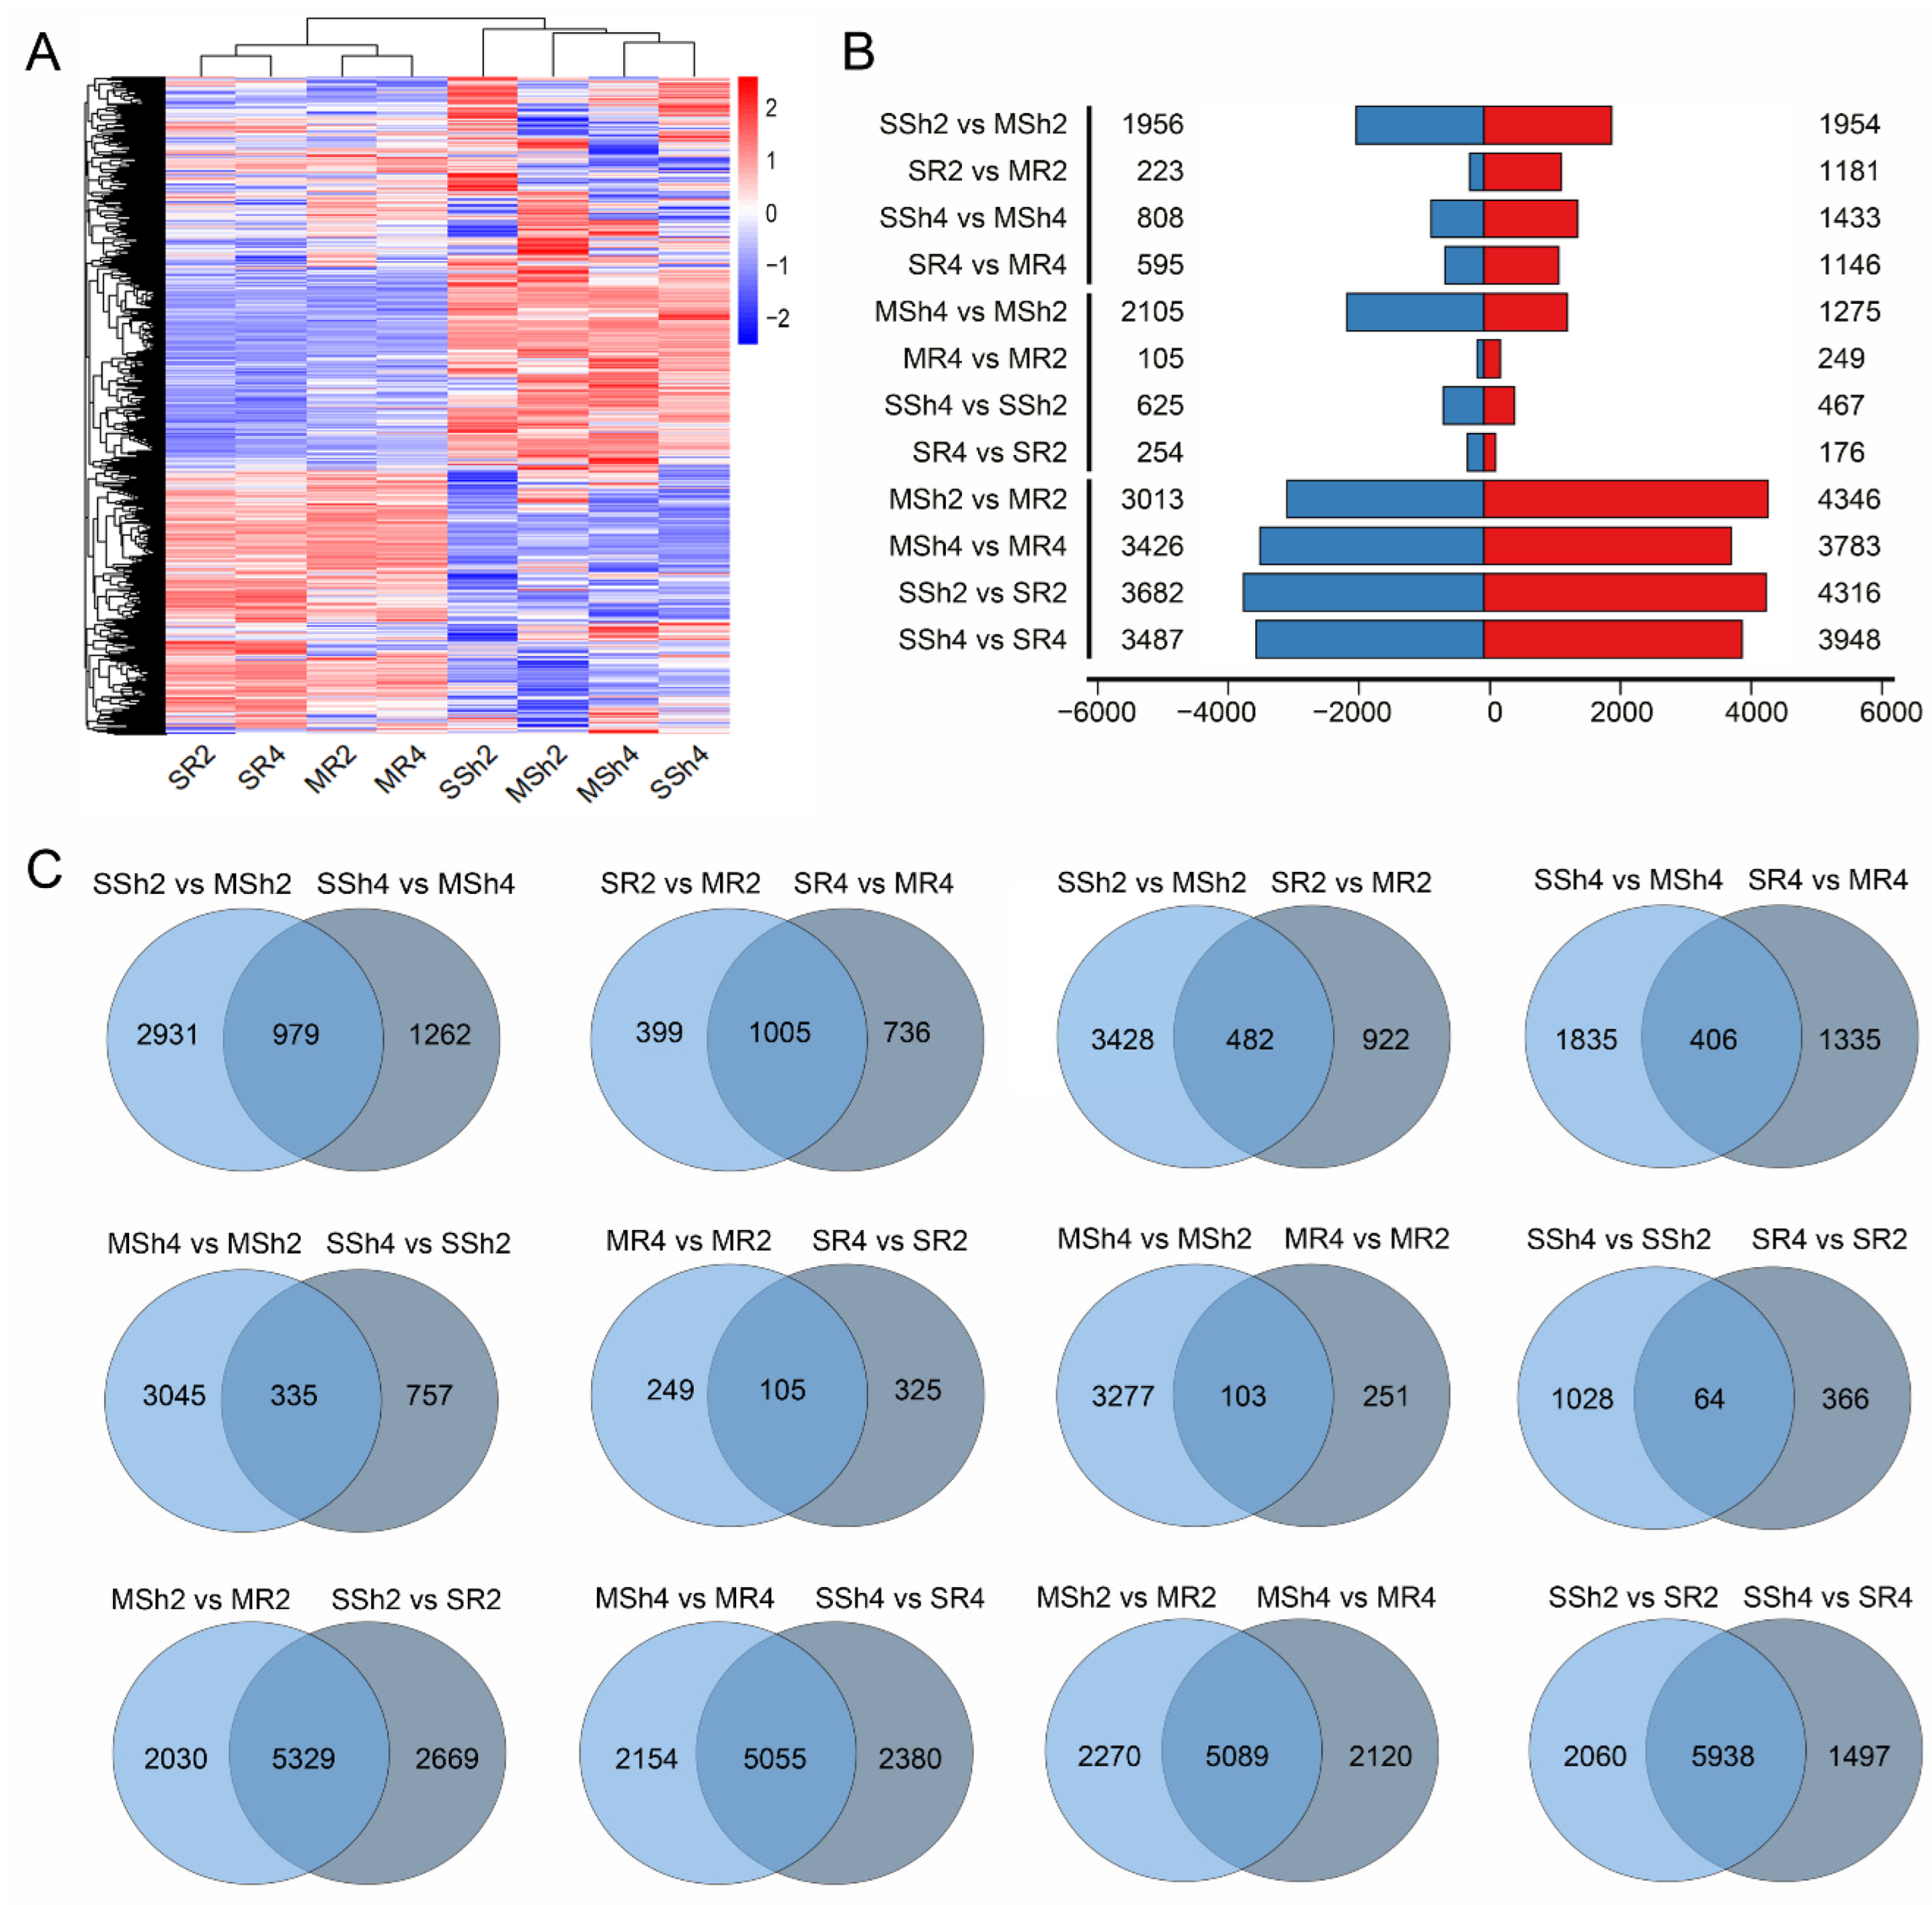
2.3. The Genome-Wide Gene Expression Variation Induced by Saline Stress in 9311-2x and 9311-4x Rice
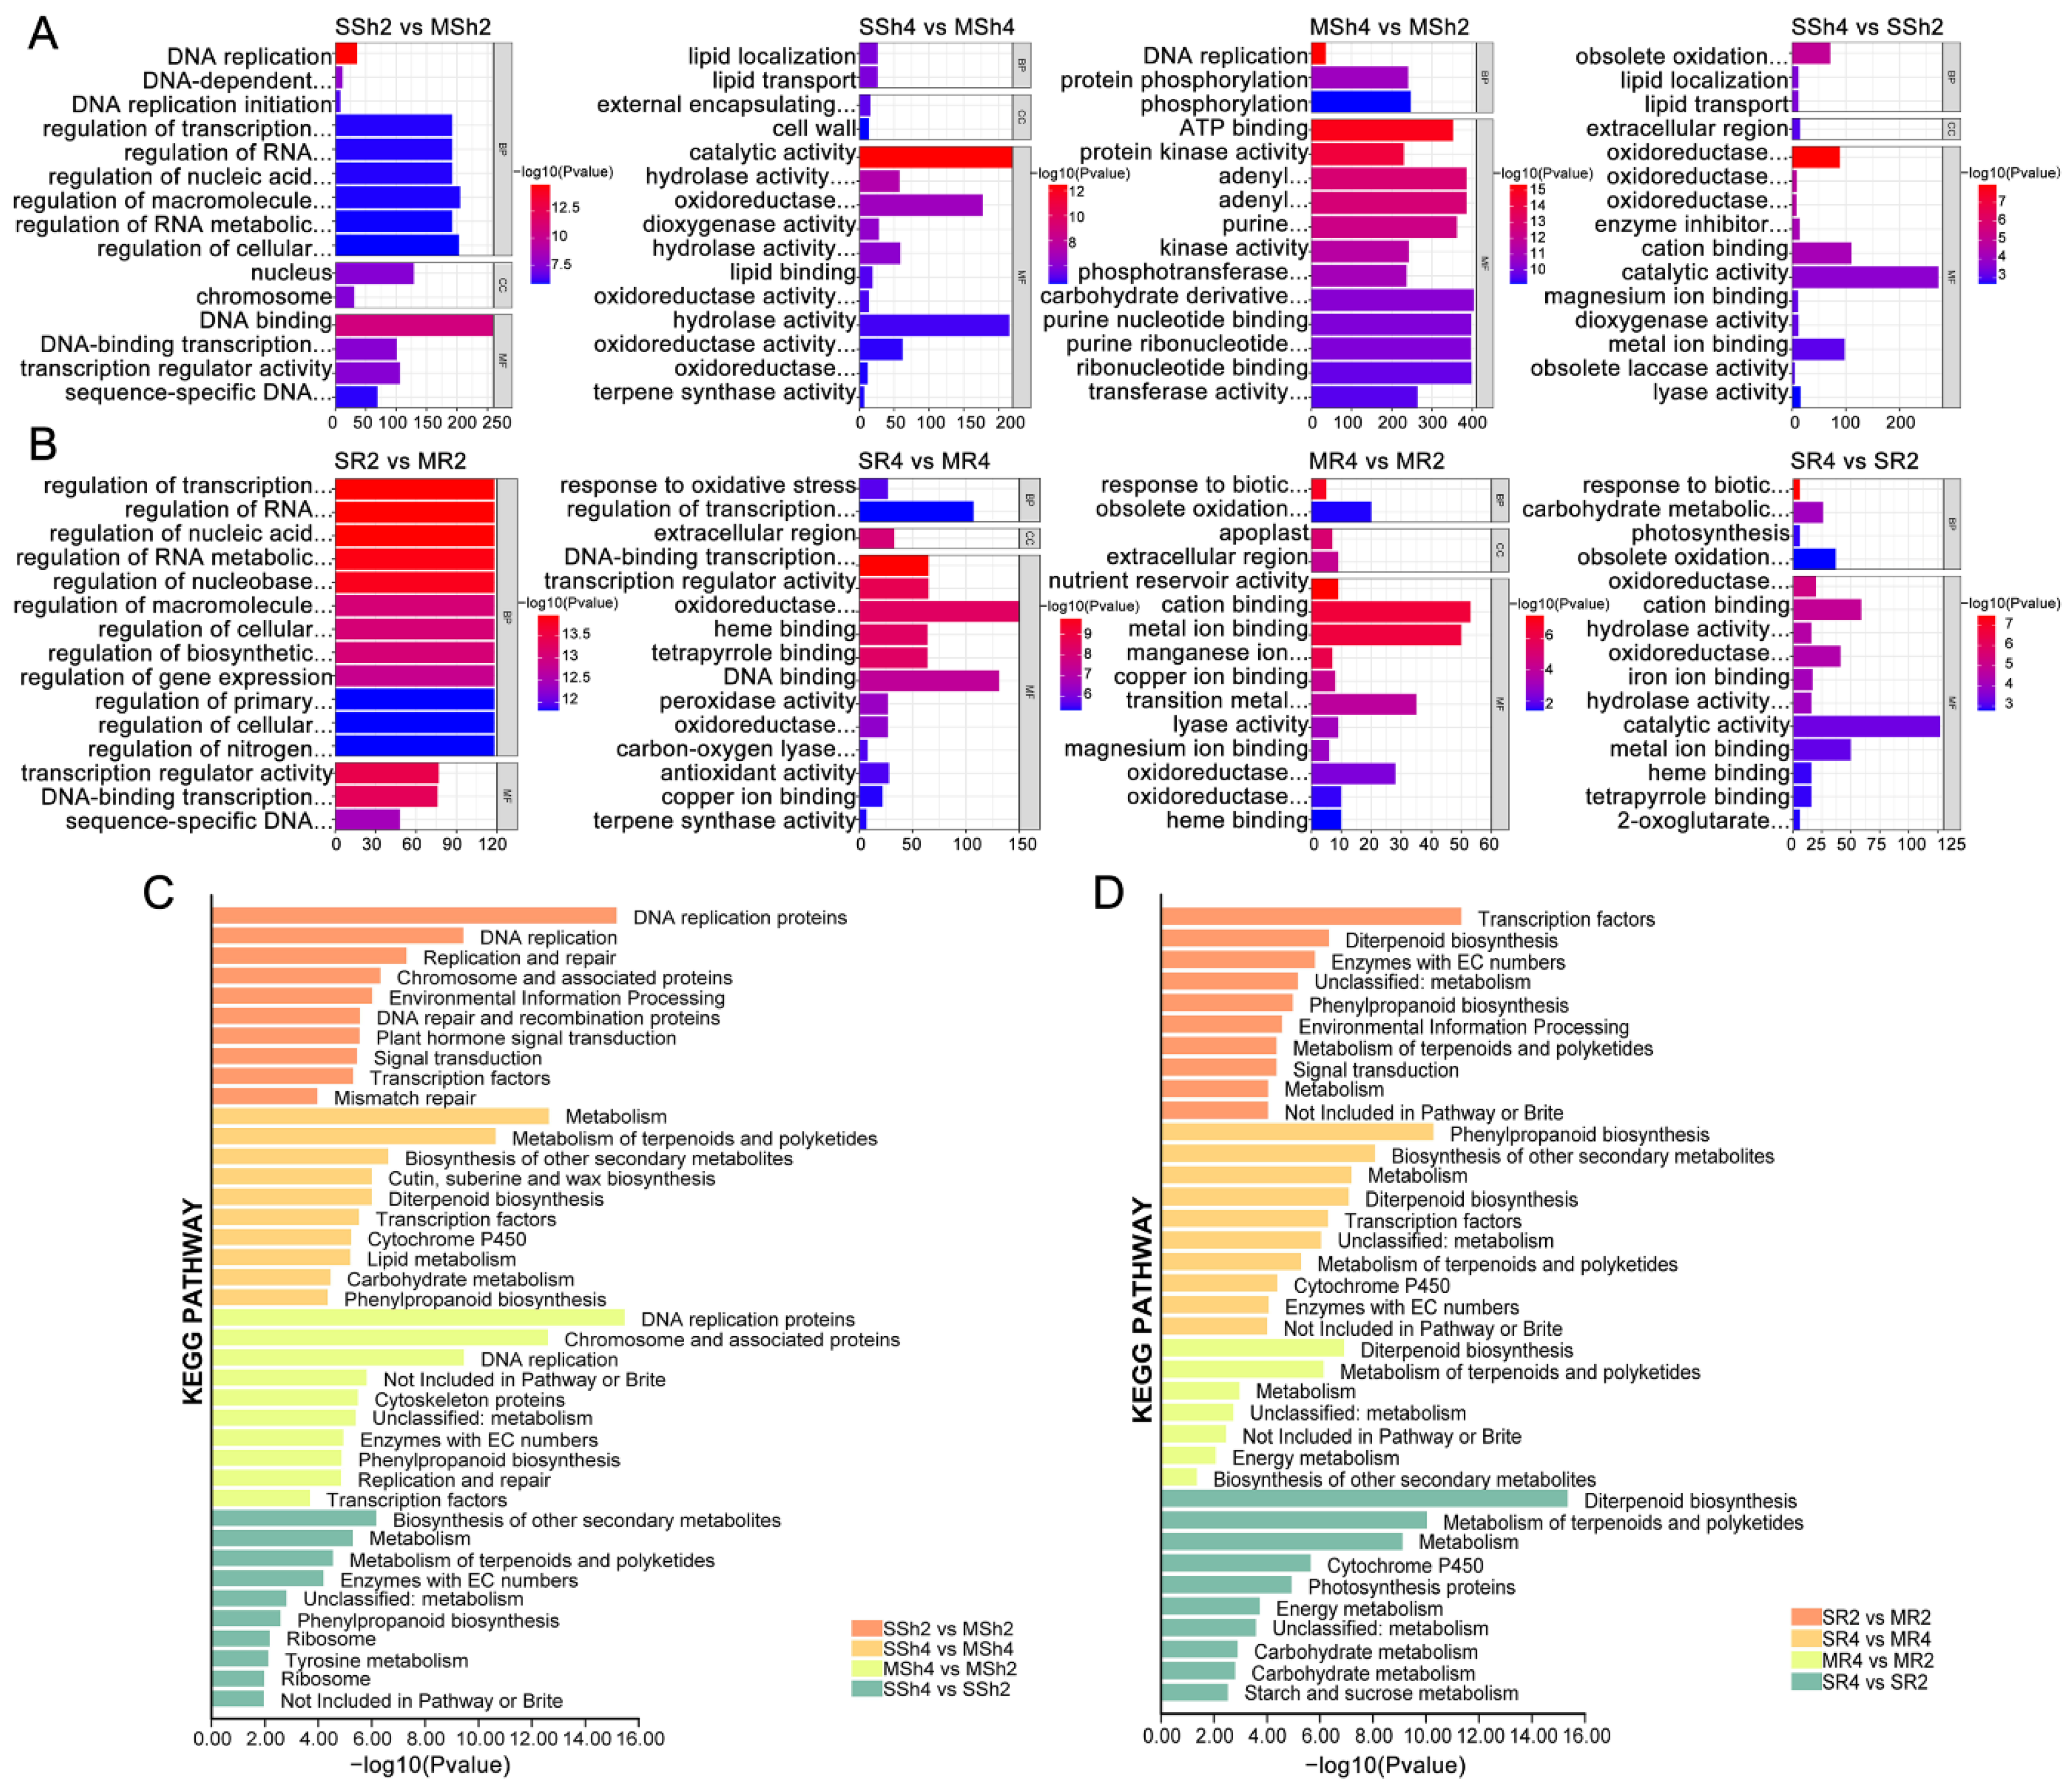
2.4. GO and KEGG Enrichment Analyses of DEGs between 9311-2x and 9311-4x Rice
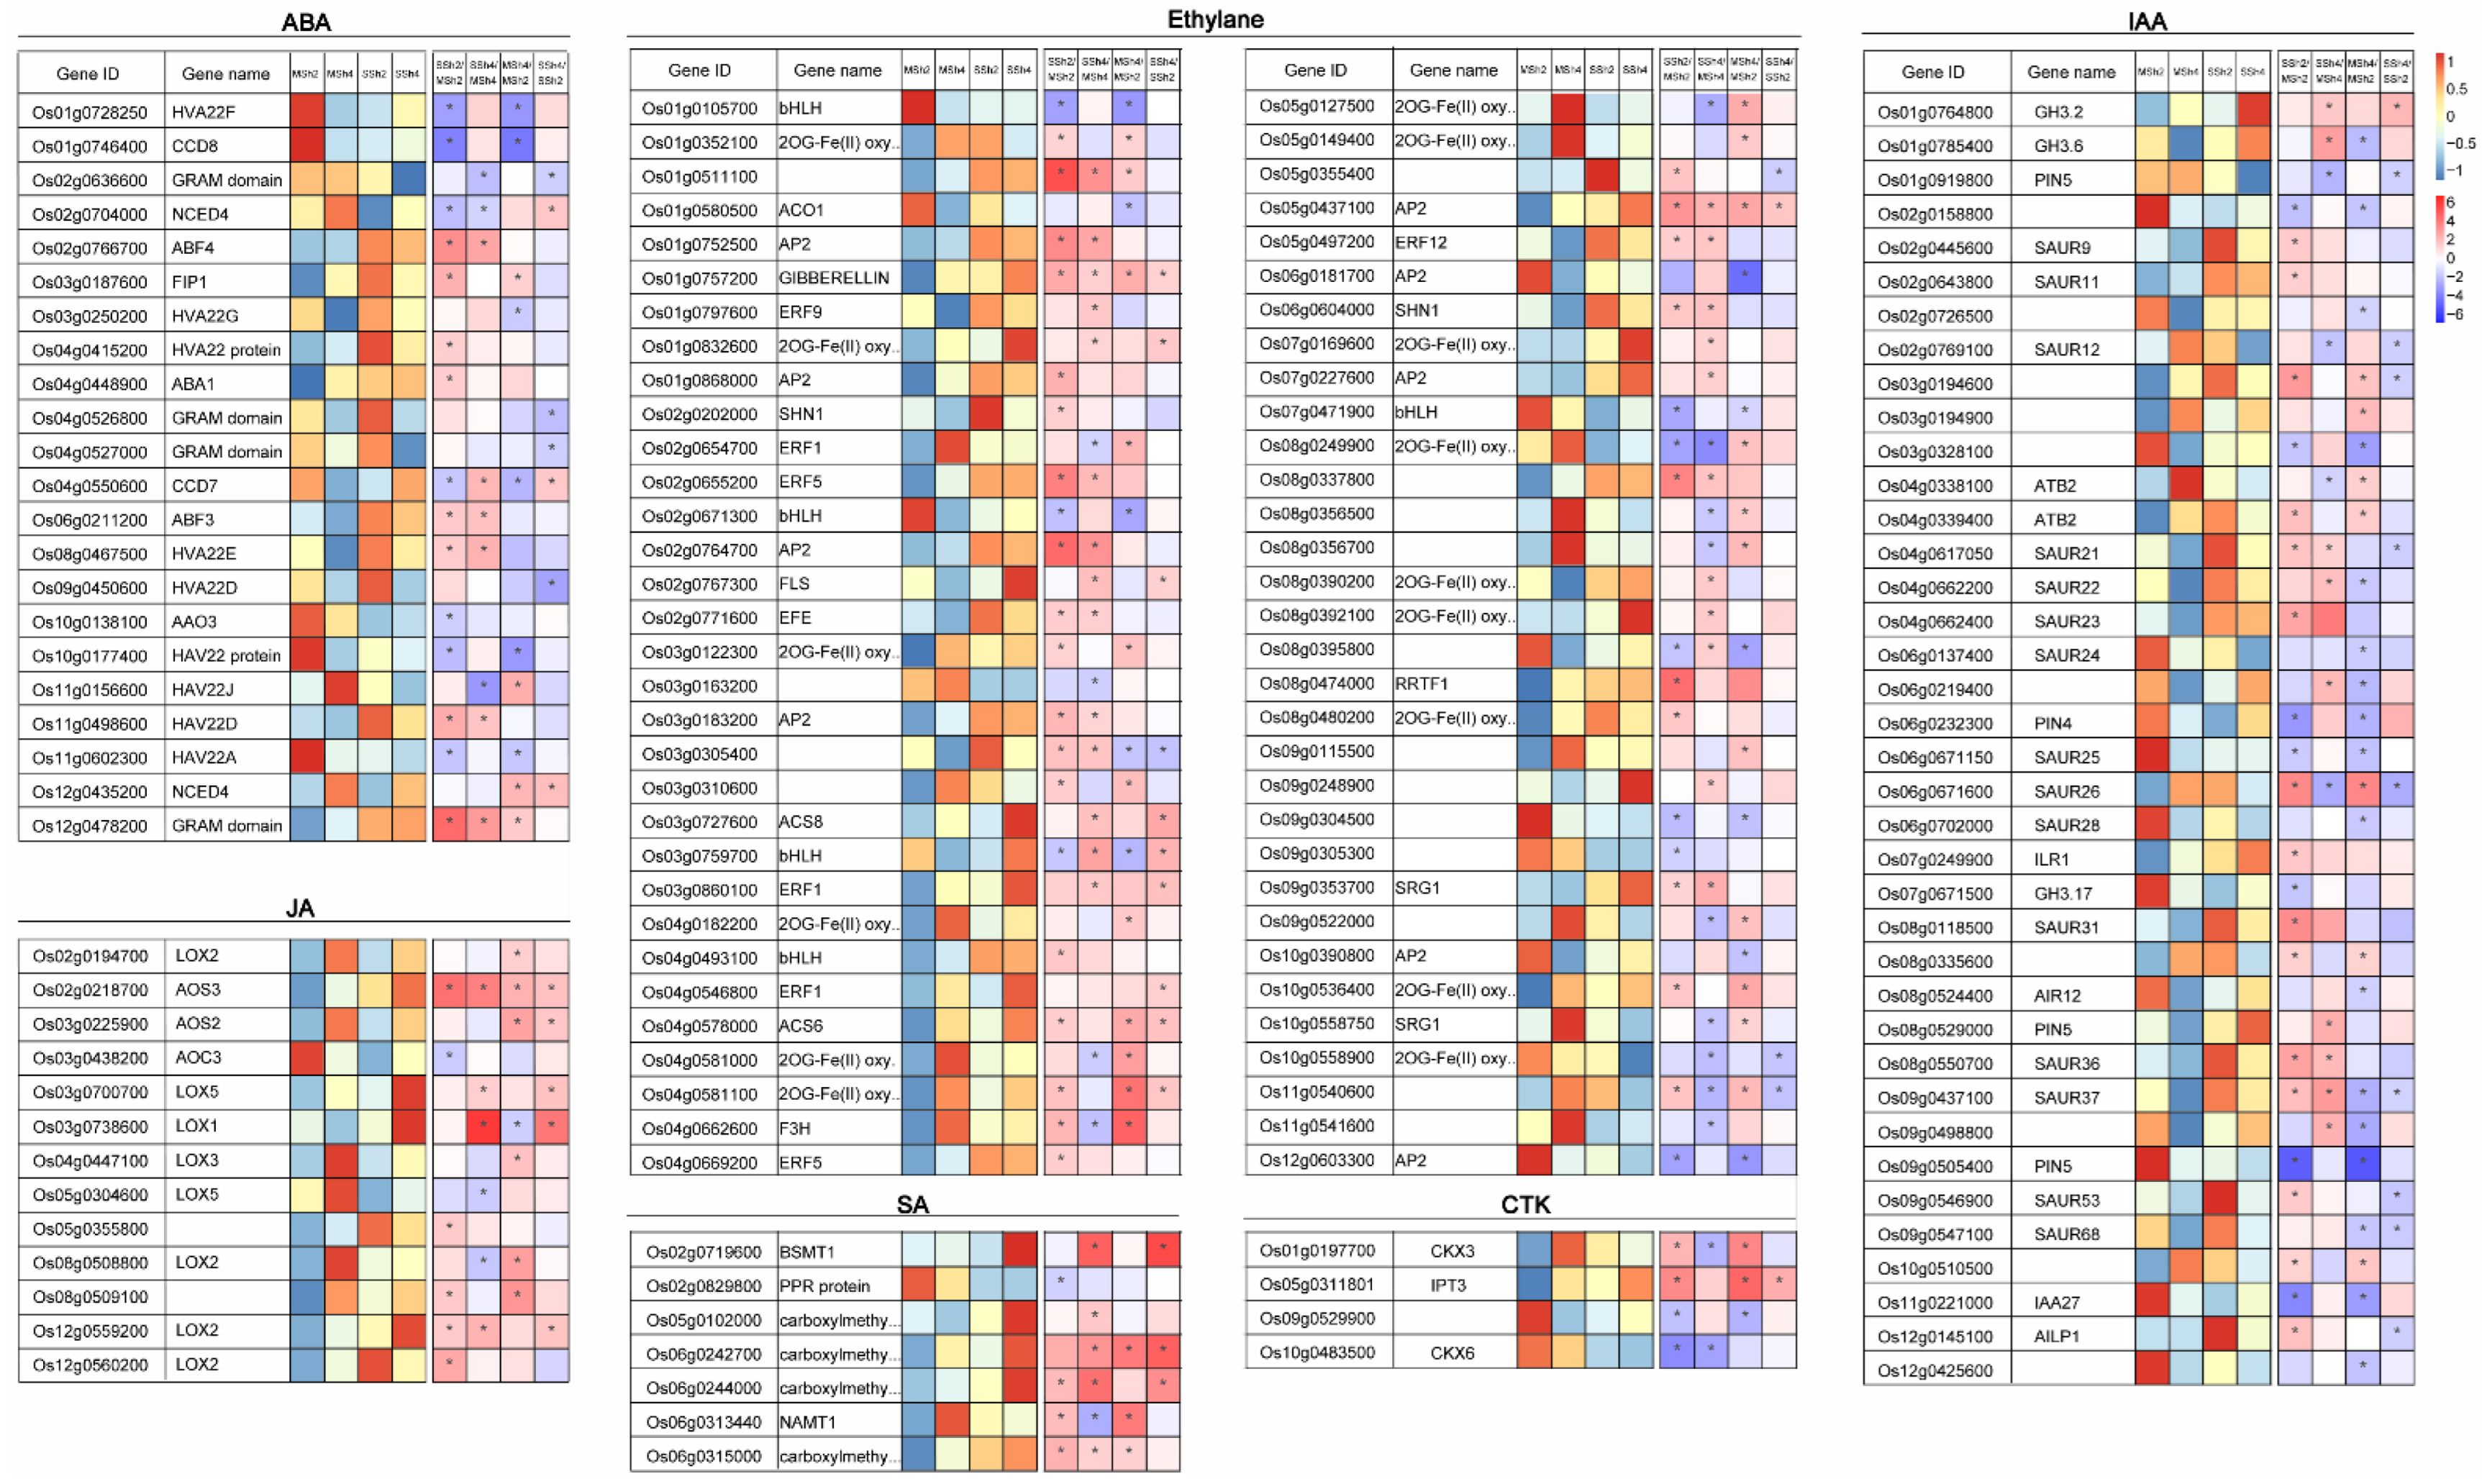
2.5. The Differentially Expressed Genes Related to Phytohormones Level in 9311-2x and 9311-4x Rice
3. Discussion
4. Materials and Methods
4.1. NaCl Treatment
4.2. The Measurements of Ionic Concentration, Small-Molecule Organic Compounds and Enzyme Activity
4.3. Phytohormones Assay
4.4. RNA Isolation and RNA Sequencing
4.5. GO Classification and KEGG Classification Analysis
4.6. qRT-PCR Validation
4.7. Statistical Analysis
5. Conclusions
Supplementary Materials
Author Contributions
Funding
Data Availability Statement
Acknowledgments
Conflicts of Interest
References
- Wu, Y.; Lin, F.; Zhou, Y.; Wang, J.; Sun, S.; Wang, B.; Zhang, Z.; Li, G.; Lin, X.; Wang, X.; et al. Genomic mosaicism due to homoeologous exchange generates extensive phenotypic diversity in nascent allopolyploids. Natl. Sci. Rev. 2021, 8, nwaa277. [Google Scholar] [CrossRef] [PubMed]
- Zhang, C.; Wang, H.; Xu, Y.; Zhang, S.; Wang, J.; Hu, B.; Hou, X.; Li, Y.; Liu, T. Enhanced Relative Electron Transport Rate Contributes to Increased Photosynthetic Capacity in Autotetraploid Pak Choi. Plant Cell Physiol. 2020, 61, 761–774. [Google Scholar] [CrossRef] [PubMed]
- Fawcett, J.A.; Maere, S.; Van de Peer, Y. Plants with double genomes might have had a better chance to survive the Cretaceous-Tertiary extinction event. Proc. Proc. Natl. Acad. Sci. USA 2009, 106, 5737–5742. [Google Scholar] [CrossRef] [PubMed] [Green Version]
- Xiao, L.; Lu, L.; Zeng, W.; Shang, X.; Cao, S.; Yan, H. DNA Methylome and LncRNAome Analysis Provide Insights into Mechanisms of Genome-Dosage Effects in Autotetraploid Cassava. Front. Plant Sci. 2022, 13, 915056. [Google Scholar] [CrossRef] [PubMed]
- Braynen, J.; Yang, Y.; Yuan, J.; Xie, Z.; Cao, G.; Wei, X.; Shi, G.; Zhang, X.; Wei, F.; Tian, B. Comparative transcriptome analysis revealed differential gene expression in multiple signaling pathways at flowering in polyploid Brassica rapa. Cell Biosci. 2021, 11, 17. [Google Scholar] [CrossRef]
- Haldane, J.B.S. The part played by recurrent mutation in evolution. Am. Nat. 1933, 67, 5–19. [Google Scholar] [CrossRef]
- Zhang, J.; Liu, Y.; Xia, E.H.; Yao, Q.Y.; Liu, X.D.; Gao, L.Z. Autotetraploid rice methylome analysis reveals methylation variation of transposable elements and their effects on gene expression. Proc. Natl. Acad. Sci. USA 2015, 112, E7022–E7029. [Google Scholar] [CrossRef] [Green Version]
- Parisod, C.; Holderegger, R.; Brochmann, C. Evolutionary consequences of autopolyploidy. New Phytol. 2010, 186, 5–17. [Google Scholar] [CrossRef]
- Liu, B.; Sun, G. microRNAs contribute to enhanced salt adaptation of the autopolyploid Hordeum bulbosum compared with its diploid ancestor. Plant J. 2017, 91, 57–69. [Google Scholar] [CrossRef] [Green Version]
- Tossi, V.E.; Martinez Tosar, L.J.; Laino, L.E.; Iannicelli, J.; Regalado, J.J.; Escandon, A.S.; Baroli, I.; Causin, H.F.; Pitta-Alvarez, S.I. Impact of polyploidy on plant tolerance to abiotic and biotic stresses. Front. Plant Sci. 2022, 13, 869423. [Google Scholar] [CrossRef]
- Da, L. Polyploidy and novelty in flowering plants. Am. Nat. 1983, 122, 121–125. [Google Scholar] [CrossRef]
- Chao, D.Y.; Dilkes, B.; Luo, H.B.; Douglas, A.; Yakubova, E.; Lahner, B.; Salt, D.E. Polyploids Exhibit Higher Potassium Uptake and Salinity Tolerance in Arabidopsis. Science 2013, 341, 658–659. [Google Scholar] [CrossRef] [PubMed] [Green Version]
- Nassar, N.M.; Graciano-Ribeiro, D.; Fernandes, S.D.C.; Araujo, P.C. Anatomical alterations due to polyploidy in cassava, Manihot esculenta Crantz. Genet. Mol. Res. 2008, 7, 276–283. [Google Scholar] [CrossRef] [PubMed]
- Wang, N.; Fan, X.; Lin, Y.; Li, Z.; Wang, Y.; Zhou, Y.; Meng, W.; Peng, Z.; Zhang, C.; Ma, J. Alkaline Stress Induces Different Physiological, Hormonal and Gene Expression Responses in Diploid and Autotetraploid Rice. Int. J. Mol. Sci. 2022, 23, 5561. [Google Scholar] [CrossRef] [PubMed]
- Wang, Z.M.; Wang, M.Y.; Liu, L.; Meng, F.J. Physiological and Proteomic Responses of Diploid and Tetraploid Black Locust (Robinia pseudoacacia L.) Subjected to Salt Stress. Int. J. Mol. Sci. 2013, 14, 20299–20325. [Google Scholar] [CrossRef] [PubMed] [Green Version]
- del Pozo, J.C.; Ramirez-Parra, E. Deciphering the molecular bases for drought tolerance in Arabidopsis autotetraploids. Plant Cell Environ. 2014, 37, 2722–2737. [Google Scholar] [CrossRef]
- Shabala, S. Learning from halophytes: Physiological basis and strategies to improve abiotic stress tolerance in crops. Ann. Bot. 2013, 112, 1209–1221. [Google Scholar] [CrossRef]
- Fang, S.; Hou, X.; Liang, X. Response Mechanisms of Plants Under Saline-Alkali Stress. Front. Plant Sci. 2021, 12, 667458. [Google Scholar] [CrossRef]
- Oster, J.; Shainberg, I.; Abrol, I. Reclamation of salt-affected soils. Agric. Drain. 1999, 38, 659–691. [Google Scholar] [CrossRef]
- Qiu, Q.S.; Guo, Y.; Quintero, F.J.; Pardo, J.M.; Schumaker, K.S.; Zhu, J.K. Regulation of vacuolar Na+/H+ exchange in Arabidopsis thaliana by the salt-overly-sensitive (SOS) pathway. J. Biol. Chem. 2004, 279, 207–215. [Google Scholar] [CrossRef]
- An, M.; Wang, X.; Chang, D.; Wang, S.; Hong, D.; Fan, H.; Wang, K. Application of compound material alleviates saline and alkaline stress in cotton leaves through regulation of the transcriptome. BMC Plant Biol. 2020, 20, 462. [Google Scholar] [CrossRef] [PubMed]
- Munns, R.; Tester, M. Mechanisms of salinity tolerance. Annu. Rev. Plant Biol. 2008, 59, 651–681. [Google Scholar] [CrossRef] [PubMed] [Green Version]
- Wang, R.; Jing, W.; Xiao, L.; Jin, Y.; Shen, L.; Zhang, W. The Rice High-Affinity Potassium Transporter1;1 Is Involved in Salt Tolerance and Regulated by an MYB-Type Transcription Factor. Plant Physiol. 2015, 168, 1076–1090. [Google Scholar] [CrossRef] [Green Version]
- Tester, M.; Davenport, R. Na+ tolerance and Na+ transport in higher plants. Ann. Bot. 2003, 91, 503–527. [Google Scholar] [CrossRef] [PubMed]
- Deinlein, U.; Stephan, A.B.; Horie, T.; Luo, W.; Xu, G.; Schroeder, J.I. Plant salt-tolerance mechanisms. Trends Plant Sci. 2014, 19, 371–379. [Google Scholar] [CrossRef] [Green Version]
- Sun, J.; He, L.; Li, T. Response of seedling growth and physiology of Sorghum bicolor (L.) Moench to saline-alkali stress. PLoS ONE 2019, 14, e0220340. [Google Scholar] [CrossRef] [PubMed] [Green Version]
- Hazman, M.; Hause, B.; Eiche, E.; Nick, P.; Riemann, M. Increased tolerance to salt stress in OPDA-deficient rice ALLENE OXIDE CYCLASE mutants is linked to an increased ROS-scavenging activity. J. Exp. Bot. 2015, 66, 3339–3352. [Google Scholar] [CrossRef] [PubMed] [Green Version]
- Szymanska, K.P.; Polkowska-Kowalczyk, L.; Lichocka, M.; Maszkowska, J.; Dobrowolska, G. SNF1-Related Protein Kinases SnRK2.4 and SnRK2.10 Modulate ROS Homeostasis in Plant Response to Salt Stress. Int. J. Mol. Sci. 2019, 20, 143. [Google Scholar] [CrossRef] [Green Version]
- Niu, M.; Xie, J.; Chen, C.; Cao, H.; Sun, J.; Kong, Q.; Shabala, S.; Shabala, L.; Huang, Y.; Bie, Z. An early ABA-induced stomatal closure, Na+ sequestration in leaf vein and K+ retention in mesophyll confer salt tissue tolerance in Cucurbita species. J. Exp. Bot. 2018, 69, 4945–4960. [Google Scholar] [CrossRef] [Green Version]
- Chen, K.; Li, G.J.; Bressan, R.A.; Song, C.P.; Zhu, J.K.; Zhao, Y. Abscisic acid dynamics, signaling, and functions in plants. J. Integr. Plant Biol. 2020, 62, 25–54. [Google Scholar] [CrossRef]
- Yang, S.; Yu, Q.; Zhang, Y.; Jia, Y.; Wan, S.; Kong, X.; Ding, Z. ROS: The Fine-Tuner of Plant Stem Cell Fate. Trends Plant Sci. 2018, 23, 850–853. [Google Scholar] [CrossRef] [PubMed]
- Han, J.P.; Koster, P.; Drerup, M.M.; Scholz, M.; Li, S.; Edel, K.H.; Hashimoto, K.; Kuchitsu, K.; Hippler, M.; Kudla, J. Fine-tuning of RBOHF activity is achieved by differential phosphorylation and Ca2+ binding. New Phytol. 2019, 221, 1935–1949. [Google Scholar] [CrossRef] [PubMed]
- Peng, J.; Li, Z.; Wen, X.; Li, W.; Shi, H.; Yang, L.; Zhu, H.; Guo, H. Salt-induced stabilization of EIN3/EIL1 confers salinity tolerance by deterring ROS accumulation in Arabidopsis. PLoS Genet. 2014, 10, e1004664. [Google Scholar] [CrossRef] [Green Version]
- Zhang, M.; Smith, J.A.; Harberd, N.P.; Jiang, C. The regulatory roles of ethylene and reactive oxygen species (ROS) in plant salt stress responses. Plant Mol. Biol. 2016, 91, 651–659. [Google Scholar] [CrossRef]
- Liu, W.; Li, R.J.; Han, T.T.; Cai, W.; Fu, Z.W.; Lu, Y.T. Salt stress reduces root meristem size by nitric oxide-mediated modulation of auxin accumulation and signaling in Arabidopsis. Plant Physiol. 2015, 168, 343–356. [Google Scholar] [CrossRef] [Green Version]
- Lv, B.; Yan, Z.; Tian, H.; Zhang, X.; Ding, Z. Local Auxin Biosynthesis Mediates Plant Growth and Development. Trends Plant Sci. 2019, 24, 6–9. [Google Scholar] [CrossRef] [PubMed]
- Nishiyama, R.; Watanabe, Y.; Fujita, Y.; Le, D.T.; Kojima, M.; Werner, T.; Vankova, R.; Yamaguchi-Shinozaki, K.; Shinozaki, K.; Kakimoto, T.; et al. Analysis of cytokinin mutants and regulation of cytokinin metabolic genes reveals important regulatory roles of cytokinins in drought, salt and abscisic acid responses, and abscisic acid biosynthesis. Plant Cell 2011, 23, 2169–2183. [Google Scholar] [CrossRef] [Green Version]
- Hyoung, S.; Cho, S.H.; Chung, J.H.; So, W.M.; Cui, M.H.; Shin, J.S. Cytokinin oxidase PpCKX1 plays regulatory roles in development and enhances dehydration and salt tolerance in Physcomitrella patens. Plant Cell Rep. 2020, 39, 419–430. [Google Scholar] [CrossRef]
- Abouelsaad, I.; Renault, S. Enhanced oxidative stress in the jasmonic acid-deficient tomato mutant def-1 exposed to NaCl stress. J. Plant Physiol. 2018, 226, 136–144. [Google Scholar] [CrossRef]
- Kurotani, K.; Hayashi, K.; Hatanaka, S.; Toda, Y.; Ogawa, D.; Ichikawa, H.; Ishimaru, Y.; Tashita, R.; Suzuki, T.; Ueda, M.; et al. Elevated levels of CYP94 family gene expression alleviate the jasmonate response and enhance salt tolerance in rice. Plant Cell Physiol. 2015, 56, 779–789. [Google Scholar] [CrossRef]
- Ahanger, M.A.; Aziz, U.; Alsahli, A.A.; Alyemeni, M.N.; Ahmad, P. Influence of Exogenous Salicylic Acid and Nitric Oxide on Growth, Photosynthesis, and Ascorbate-Glutathione Cycle in Salt Stressed Vigna angularis. Biomolecules 2019, 10, 42. [Google Scholar] [CrossRef] [PubMed] [Green Version]
- Yu, Z.; Duan, X.; Luo, L.; Dai, S.; Ding, Z.; Xia, G. How Plant Hormones Mediate Salt Stress Responses. Trends Plant Sci. 2020, 25, 1117–1130. [Google Scholar] [CrossRef] [PubMed]
- Kaur, H.; Sirhindi, G.; Bhardwaj, R.; Alyemeni, M.N.; Siddique, K.H.M.; Ahmad, P. 28-homobrassinolide regulates antioxidant enzyme activities and gene expression in response to salt- and temperature-induced oxidative stress in Brassica juncea. Sci. Rep. 2018, 8, 8735. [Google Scholar] [CrossRef] [Green Version]
- Wang, L.; Cao, S.; Wang, P.; Lu, K.; Song, Q.; Zhao, F.J.; Chen, Z.J. DNA hypomethylation in tetraploid rice potentiates stress-responsive gene expression for salt tolerance. Proc. Natl. Acad. Sci. USA 2021, 118, e2023981118. [Google Scholar] [CrossRef]
- Renny-Byfield, S.; Wendel, J.F. Doubling down on genomes: Polyploidy and crop plants. Am. J. Bot. 2014, 101, 1711–1725. [Google Scholar] [CrossRef] [Green Version]
- Yang, P.M.; Huang, Q.C.; Qin, G.Y.; Zhao, S.P.; Zhou, J.G. Different drought-stress responses in photosynthesis and reactive oxygen metabolism between autotetraploid and diploid rice. Photosynthetica 2014, 52, 193–202. [Google Scholar] [CrossRef]
- Ruiz, M.; Quinones, A.; Martinez-Cuenca, M.R.; Aleza, P.; Morillon, R.; Navarro, L.; Primo-Millo, E.; Martinez-Alcantara, B. Tetraploidy enhances the ability to exclude chloride from leaves in carrizo citrange seedlings. J. Plant Physiol. 2016, 205, 1–10. [Google Scholar] [CrossRef]
- Maherali, H.; Walden, A.E.; Husband, B.C. Genome duplication and the evolution of physiological responses to water stress. New Phytol. 2009, 184, 721–731. [Google Scholar] [CrossRef]
- Deng, B.L.; Du, W.C.; Liu, C.L.; Sun, W.W.; Tian, S.; Dong, H.S. Antioxidant response to drought, cold and nutrient stress in two ploidy levels of tobacco plants: Low resource requirement confers polytolerance in polyploids? Plant Growth Regul. 2012, 66, 37–47. [Google Scholar] [CrossRef]
- Soltis, P.S.; Soltis, D.E. Flower diversity and angiosperm diversification. Methods Mol. Biol. 2014, 1110, 85–102. [Google Scholar] [CrossRef]
- Wu, H.; Song, X.; Lyu, S.; Ren, Y.; Liu, T.; Hou, X.; Li, Y.; Zhang, C. Integrated Analysis of Hi-C and RNA-Seq Reveals the Molecular Mechanism of Autopolyploid Growth Advantages in Pak Choi (Brassica rapa ssp. chinensis). Front. Plant Sci. 2022, 13, 905202. [Google Scholar] [CrossRef] [PubMed]
- Li, W.L.; Berlyn, G.P.; Ashton, P.M.S. Polyploids and their structural and physiological characteristics relative to water deficit in Betula papyrifera (Betulaceae). Am. J. Bot. 1996, 83, 15–20. [Google Scholar] [CrossRef]
- Li, W.-D.; Biswas, D.K.; Xu, H.; Xu, C.-Q.; Wang, X.-Z.; Liu, J.-K.; Jiang, G.-M. Photosynthetic responses to chromosome doubling in relation to leaf anatomy in Lonicera japonica subjected to water stress. Funct. Plant Biol. 2009, 36, 783–792. [Google Scholar] [CrossRef] [PubMed]
- Li, Q.; Yang, A.; Zhang, W.H. Comparative studies on tolerance of rice genotypes differing in their tolerance to moderate salt stress. BMC Plant Biol. 2017, 17, 141. [Google Scholar] [CrossRef] [Green Version]
- Liu, D.; Liu, M.; Liu, X.L.; Cheng, X.G.; Liang, Z.W. Silicon Priming Created an Enhanced Tolerance in Alfalfa (Medicago sativa L.) Seedlings in Response to High Alkaline Stress. Front. Plant Sci. 2018, 9, 716. [Google Scholar] [CrossRef] [Green Version]
- Yang, C.; Zhao, L.; Zhang, H.; Yang, Z.; Wang, H.; Wen, S.; Zhang, C.; Rustgi, S.; von Wettstein, D.; Liu, B. Evolution of physiological responses to salt stress in hexaploid wheat. Proc. Natl. Acad. Sci. USA 2014, 111, 11882–11887. [Google Scholar] [CrossRef] [Green Version]
- Wang, H.; Zhang, M.; Guo, R.; Shi, D.C.; Liu, B.; Lin, X.; Yang, C. Effects of salt stress on ion balance and nitrogen metabolism of old and young leaves in rice (Oryza sativa L.). BMC Plant Biol. 2012, 12, 194. [Google Scholar] [CrossRef] [Green Version]
- Wang, H.; Wu, Z.; Han, J.; Zheng, W.; Yang, C. Comparison of ion balance and nitrogen metabolism in old and young leaves of alkali-stressed rice plants. PLoS ONE 2012, 7, e37817. [Google Scholar] [CrossRef]
- Kusano, M.; Tabuchi, M.; Fukushima, A.; Funayama, K.; Diaz, C.; Kobayashi, M.; Hayashi, N.; Tsuchiya, Y.N.; Takahashi, H.; Kamata, A.; et al. Metabolomics data reveal a crucial role of cytosolic glutamine synthetase 1;1 in coordinating metabolic balance in rice. Plant J. 2011, 66, 456–466. [Google Scholar] [CrossRef]
- Parida, A.K.; Das, A.B. Salt tolerance and salinity effects on plants: A review. Ecotoxicol. Environ. Saf. 2005, 60, 324–349. [Google Scholar] [CrossRef]
- Hou, Q.; Ufer, G.; Bartels, D. Lipid signalling in plant responses to abiotic stress. Plant Cell Environ. 2016, 39, 1029–1048. [Google Scholar] [CrossRef] [PubMed] [Green Version]
- Pandian, B.A.; Sathishraj, R.; Djanaguiraman, M.; Prasad, P.V.V.; Jugulam, M. Role of Cytochrome P450 Enzymes in Plant Stress Response. Antioxidants 2020, 9, 454. [Google Scholar] [CrossRef] [PubMed]
- Sharma, A.; Shahzad, B.; Rehman, A.; Bhardwaj, R.; Landi, M.; Zheng, B. Response of Phenylpropanoid Pathway and the Role of Polyphenols in Plants under Abiotic Stress. Molecules 2019, 24, 2452. [Google Scholar] [CrossRef] [PubMed] [Green Version]
- Cai, S.; Chen, G.; Wang, Y.; Huang, Y.; Marchant, D.B.; Wang, Y.; Yang, Q.; Dai, F.; Hills, A.; Franks, P.J.; et al. Evolutionary Conservation of ABA Signaling for Stomatal Closure. Plant Physiol. 2017, 174, 732–747. [Google Scholar] [CrossRef] [Green Version]
- Urano, K.; Maruyama, K.; Jikumaru, Y.; Kamiya, Y.; Yamaguchi-Shinozaki, K.; Shinozaki, K. Analysis of plant hormone profiles in response to moderate dehydration stress. Plant J. 2017, 90, 17–36. [Google Scholar] [CrossRef] [PubMed] [Green Version]
- Lee, S.; Kim, S.G.; Park, C.M. Salicylic acid promotes seed germination under high salinity by modulating antioxidant activity in Arabidopsis. New Phytol. 2010, 188, 626–637. [Google Scholar] [CrossRef] [PubMed]
- Zheng, J.; Ma, X.; Zhang, X.; Hu, Q.; Qian, R. Salicylic acid promotes plant growth and salt-related gene expression in Dianthus superbus L. (Caryophyllaceae) grown under different salt stress conditions. Physiol. Mol. Biol. Plants 2018, 24, 231–238. [Google Scholar] [CrossRef] [PubMed]
- Bates, L.S.; Waldren, R.P.; Teare, I.D. Rapid determination of free proline for water-stress studies. Plant Soil 1973, 39, 205–207. [Google Scholar] [CrossRef]
- Song, S.Y.; Chen, Y.; Chen, J.; Dai, X.Y.; Zhang, W.H. Physiological mechanisms underlying OsNAC5-dependent tolerance of rice plants to abiotic stress. Planta 2011, 234, 331–345. [Google Scholar] [CrossRef]
- Yang, A.; Dai, X.; Zhang, W.H. A R2R3-type MYB gene, OsMYB2, is involved in salt, cold, and dehydration tolerance in rice. J. Exp. Bot. 2012, 63, 2541–2556. [Google Scholar] [CrossRef] [Green Version]
- Irigoyen, J.J.; Emerich, D.W.; Sanchezdiaz, M. Water stress induced changes in concentrations of proline and total soluble sugars in nodulated alfalfa (Medicago sativa) plants. Physiol. Plant. 1992, 84, 55–60. [Google Scholar] [CrossRef]
- Heath, R.L.; Packer, L. Photoperoxidation in isolated chloroplasts: I. kinetics and stoichiometry of fatty acid peroxidation. Arch Biochem. Biophys. 1968, 125, 189–198. [Google Scholar] [CrossRef]
- Paoletti, F.; Aldinucci, D.; Mocali, A.; Caparrini, A. A sensitive spectrophotometric method for the determination of superoxide dismutase activity in tissue extracts. Anal. Biochem. 1986, 154, 536–541. [Google Scholar] [CrossRef]
- Zhou, W.; Leul, M. Uniconazole-induced tolerance of rape plants to heat stress in relation to changes in hormonal levels, enzyme activities and lipid peroxidation. Plant Growth Regul. 1999, 27, 99–104. [Google Scholar] [CrossRef]
- Zhao, Q.; Feng, Q.; Lu, H.; Li, Y.; Wang, A.; Tian, Q.; Zhan, Q.; Lu, Y.; Zhang, L.; Huang, T.; et al. Pan-genome analysis highlights the extent of genomic variation in cultivated and wild rice. Nat. Genet. 2018, 50, 278–284. [Google Scholar] [CrossRef] [Green Version]
- Lin, Y.; Ma, J.; Wu, N.; Qi, F.; Peng, Z.; Nie, D.; Yao, R.; Qi, X.; Slaski, J.; Yang, F.; et al. Transcriptome Study of Rice Roots Status under High Alkaline Stress at Seedling Stage. Agronomy 2022, 12, 925. [Google Scholar] [CrossRef]
- Soltis, D.E.; Albert, V.A.; Leebens-Mack, J.; Bell, C.D.; Paterson, A.H.; Zheng, C.; Sankoff, D.; Depamphilis, C.W.; Wall, P.K.; Soltis, P.S. Polyploidy and angiosperm diversification. Am. J. Bot. 2009, 96, 336–348. [Google Scholar] [CrossRef] [Green Version]
- Van de Peer, Y.; Ashman, T.L.; Soltis, P.S.; Soltis, D.E. Polyploidy: An evolutionary and ecological force in stressful times. Plant Cell 2021, 33, 11–26. [Google Scholar] [CrossRef]


Publisher’s Note: MDPI stays neutral with regard to jurisdictional claims in published maps and institutional affiliations. |
© 2022 by the authors. Licensee MDPI, Basel, Switzerland. This article is an open access article distributed under the terms and conditions of the Creative Commons Attribution (CC BY) license (https://creativecommons.org/licenses/by/4.0/).
Share and Cite
Wang, N.; Wang, S.; Qi, F.; Wang, Y.; Lin, Y.; Zhou, Y.; Meng, W.; Zhang, C.; Wang, Y.; Ma, J. Autotetraploidization Gives Rise to Differential Gene Expression in Response to Saline Stress in Rice. Plants 2022, 11, 3114. https://doi.org/10.3390/plants11223114
Wang N, Wang S, Qi F, Wang Y, Lin Y, Zhou Y, Meng W, Zhang C, Wang Y, Ma J. Autotetraploidization Gives Rise to Differential Gene Expression in Response to Saline Stress in Rice. Plants. 2022; 11(22):3114. https://doi.org/10.3390/plants11223114
Chicago/Turabian StyleWang, Ningning, Shiyan Wang, Fan Qi, Yingkai Wang, Yujie Lin, Yiming Zhou, Weilong Meng, Chunying Zhang, Yunpeng Wang, and Jian Ma. 2022. "Autotetraploidization Gives Rise to Differential Gene Expression in Response to Saline Stress in Rice" Plants 11, no. 22: 3114. https://doi.org/10.3390/plants11223114