Article

Transpirational Leaf Cooling Effect Did Not Contribute Equally to Biomass Retention in Wheat Genotypes under High Temperature

by
Helen Bramley
1,2,*,
S. R. W. M. Chandima J. K. Ranawana
1,3,*,
Jairo A. Palta
1,4,
Katia Stefanova
1 and
Kadambot H. M. Siddique
1
1
The UWA Institute of Agriculture, The University of Western Australia, Perth, WA 6001, Australia
2
Plant Breeding Institute, School of Life and Environmental Sciences, The University of Sydney, Narrabri, NSW 2390, Australia
3
Department of Export Agriculture, Faculty of Animal Science and Export Agriculture, Uva Wellassa University, Badulla 90000, Sri Lanka
4
CSIRO Agriculture, Private Bag No. 5, Wembley, WA 6913, Australia
*
Authors to whom correspondence should be addressed.
Plants 2022, 11(16), 2174; https://doi.org/10.3390/plants11162174
Submission received: 7 July 2022 / Revised: 16 August 2022 / Accepted: 18 August 2022 / Published: 21 August 2022
(This article belongs to the Special Issue Responses of Wheat to Abiotic Stress)

Abstract

:
High temperature and water deficit are the most critical yield-limiting environmental factors for wheat in rainfed environments. It is important to understand the heat avoidance mechanisms and their associations with leaf morpho-physiological traits that allow crops to stay cool and retain high biomass under warm and dry conditions. We examined 20 morpho-physiologically diverse wheat genotypes under ambient and elevated temperatures (Tair) to investigate whether increased water use leads to high biomass retention due to increased leaf cooling. An experiment was conducted under well-watered conditions in two partially controlled glasshouses. We measured plant transpiration (Tr), leaf temperature (Tleaf), vapor pressure deficit (VPD), and associated leaf morpho-physiological characteristics. High water use and leaf cooling increased biomass retention under high temperatures, but increased use did not always increase biomass retention. Some genotypes maintained biomass, irrespective of water use, possibly through mechanisms other than leaf cooling, indicating their adaptation under water shortage. Genotypic differences in leaf cooling capacity did not always correlate with Tr (VPD) response. In summary, the contribution of high water use or the leaf cooling effect on biomass retention under high temperature is genotype-dependent and possibly due to variations in leaf morpho-physiological traits. These findings are useful for breeding programs to develop climate resilient wheat cultivars.

1. Introduction

Crop productivity under the projected increased intensity and frequency of extreme climate events, including high temperature, vapor pressure deficit (VPD), and drought spells, needs genetic improvements targeting specific environmental conditions. Identifying genotypic variability in morpho-physiological responses to environmental conditions and the underlying mechanisms contributing to those variable responses are important prerequisites for genetic improvement.
Wheat is highly sensitive to heat stress [1,2], and increasing air temperature (Tair) threatens wheat production [3,4]. High temperatures can negatively affect plant growth and development and reduce biomass accumulation leading to yield penalties [5,6,7]. Short or long-term exposure to high ambient temperatures (>35 °C) can significantly reduce wheat yield [8,9] due to accelerated senescence [10], shortened grain-filling duration, restricted carbon assimilation [11], pollen sterility [12], floret abortion [13], and infertility [14]. Tolerance to high temperatures has been widely studied and mechanisms identified, especially those supporting better photosynthetic capacity and longer grain-filling periods, such as stay green [15,16], reduced respiratory O2 consumption under day [17] and night warming [18], and remobilization of stem reserves [19]. Moreover, studies have demonstrated that genetic improvements in heat tolerance can be made through the incorporation of some of these traits from wild relatives of wheat [15,16].
Although improving heat tolerance is clearly important for wheat production, other strategies of adaptation may be just as important, but have been less explored [20,21]. For example, less stress under high temperatures may be experienced through mechanisms that help prevent overheating, called “heat avoidance” [22]. Transpiration (Tr) is one such heat avoidance mechanism through its contribution to leaf cooling [23,24,25]. Tr is a complex biophysical process where water evaporates into the surrounding air through stomata. This liquid-to-vapor conversion requires energy supplied by the heat energy absorbed by the leaf [26]. During Tr, considerable heat is dissipated from leaves allowing them to remain several degrees cooler than Tair [27,28,29]. Therefore, genotypes that use more water through Tr may avoid heat stress and be more productive under higher temperatures by maintaining cooler canopies than those that use less water. However, the role of Tr in regulating plant temperature is controversial. Some studies have suggested that the Tr contribution (latent heat loss) for regulating plant temperature is less than other heat dissipation mechanisms, especially under limited water conditions [30,31,32]. Conversely, other studies have suggested that Tr plays a major role in dissipating heat energy and lowering leaf temperature [29,33,34,35]. However, comparing leaf and air temperatures may underestimate the role of Tr in leaf cooling as the absorption coefficients differ for leaf and air, as plants have a relatively higher capacity to absorb light than air [34]. These contrasting views on the role of Tr in ameliorating leaf temperature necessitate closer examination of this phenomenon to determine whether this could be a suitable trait to target for wheat breeding.
Grain yield is a function of biomass and the harvest index (HI). Therefore, grain yield can be increased either by increasing the biomass, or the HI, or both [36]. A high positive correlation between grain yield and accumulated biomass was reported in several crops including rice, wheat, and maize [37,38,39]. Modern cereal breeding programs have highlighted the possibility of increasing grain yield by selecting genotypes with higher biomass production [40,41,42]. However, it is challenging to increase biomass accumulation particularly under sub-optimum growing conditions. Therefore, improvement in grain yield potential through increased biomass production can be achieved under favorable conditions, and maintaining a high HI could be more important than increasing biomass production for higher grain yield under sub-optimum conditions [43]. Biomass has been reported to decrease substantially under high temperature and the decrease in biomass under high temperature may be attributed to accelerated leaf chlorophyll degradation, reduced leaf photosynthesis, and a smaller leaf area index [44]. Moreover, variation in biomass accumulation is associated with differential soil water extraction by roots, variation in evapotranspiration (ET), and differences in net carbon assimilation per unit of water transpired (Transpiration Efficiency) or ratio of biomass to ET [45,46]. Biomass accumulation tends to be linearly related to plant Tr [47,48]. Thus, effective water-use via Tr is important for increasing biomass under water stress [49,50]. However, using more water to maintain cooler canopies and increase biomass accumulation is problematical because most wheat production occurs under rainfed conditions in water-limited environments, where water scarcity is expected to increase [51,52,53]. Therefore, it is critical to determine whether increased water use via Tr always contributes to high biomass accumulation and identify genotypes that can maintain cooler canopies and high biomass irrespective of water use.
Leaf temperature (Tleaf) has been associated with several plant traits, including stomatal conductance (gs) [54], capacity of vascular system to support Tr [55], plant water status [56], rooting depth [57], and yield [58,59]. Cooler canopies are considered to indicate better hydration status and greater capacity to extract water from deeper soil profiles [60], but a direct link between these traits has not been studied. Thus, Tleaf is being widely used as a selection tool for screening heat- and drought-tolerant genotypes, as it reflects genotype fitness in a given environment [55,58,61]. However, the relationship between Tleaf and Tr is complex as both traits are influenced by a multitude of morpho-physiological and environmental variables, including leaf glaucousness, canopy architecture, VPD, radiation, and soil water availability [54,55,62,63,64]. Wheat genotypes may not respond equally to elevated temperature and temperature-coupled environmental changes due to differences in their morpho-physiological attributes. Systematic characterization of the morpho-physiological differences and changes in Tr, Tleaf, and biomass accumulation among wheat genotypes will improve our understanding of these complex relationships.
This study aimed to investigate the relationship between Tr, Tleaf, and biomass production under elevated temperature in a morpho-physiologically diverse set of 20 wheat genotypes. We aimed to determine whether increased water use under high temperature improves maintenance of shoot biomass retention (smaller reduction in biomass) in wheat due to increased leaf cooling. It was expected that elevated temperature would reduce biomass accumulation due to high temperature-induced senescence and genotypes with higher Tr would be cooler and thus, have slower leaf senescence and better biomass retention. It is hypothesized that biomass accumulation is less reduced in genotypes with high water use as canopy cooling inhibits leaf senescence. The study also aimed to elucidate the responses of Tr, Tleaf, and associated morpho-physiological characteristics in warm and dry atmospheric conditions and determine whether variable responses in the instantaneous rate of Tr to VPD affect Tleaf regulation in wheat.

2. Results

2.1. Morpho–Physiological Responses under Elevated Temperature
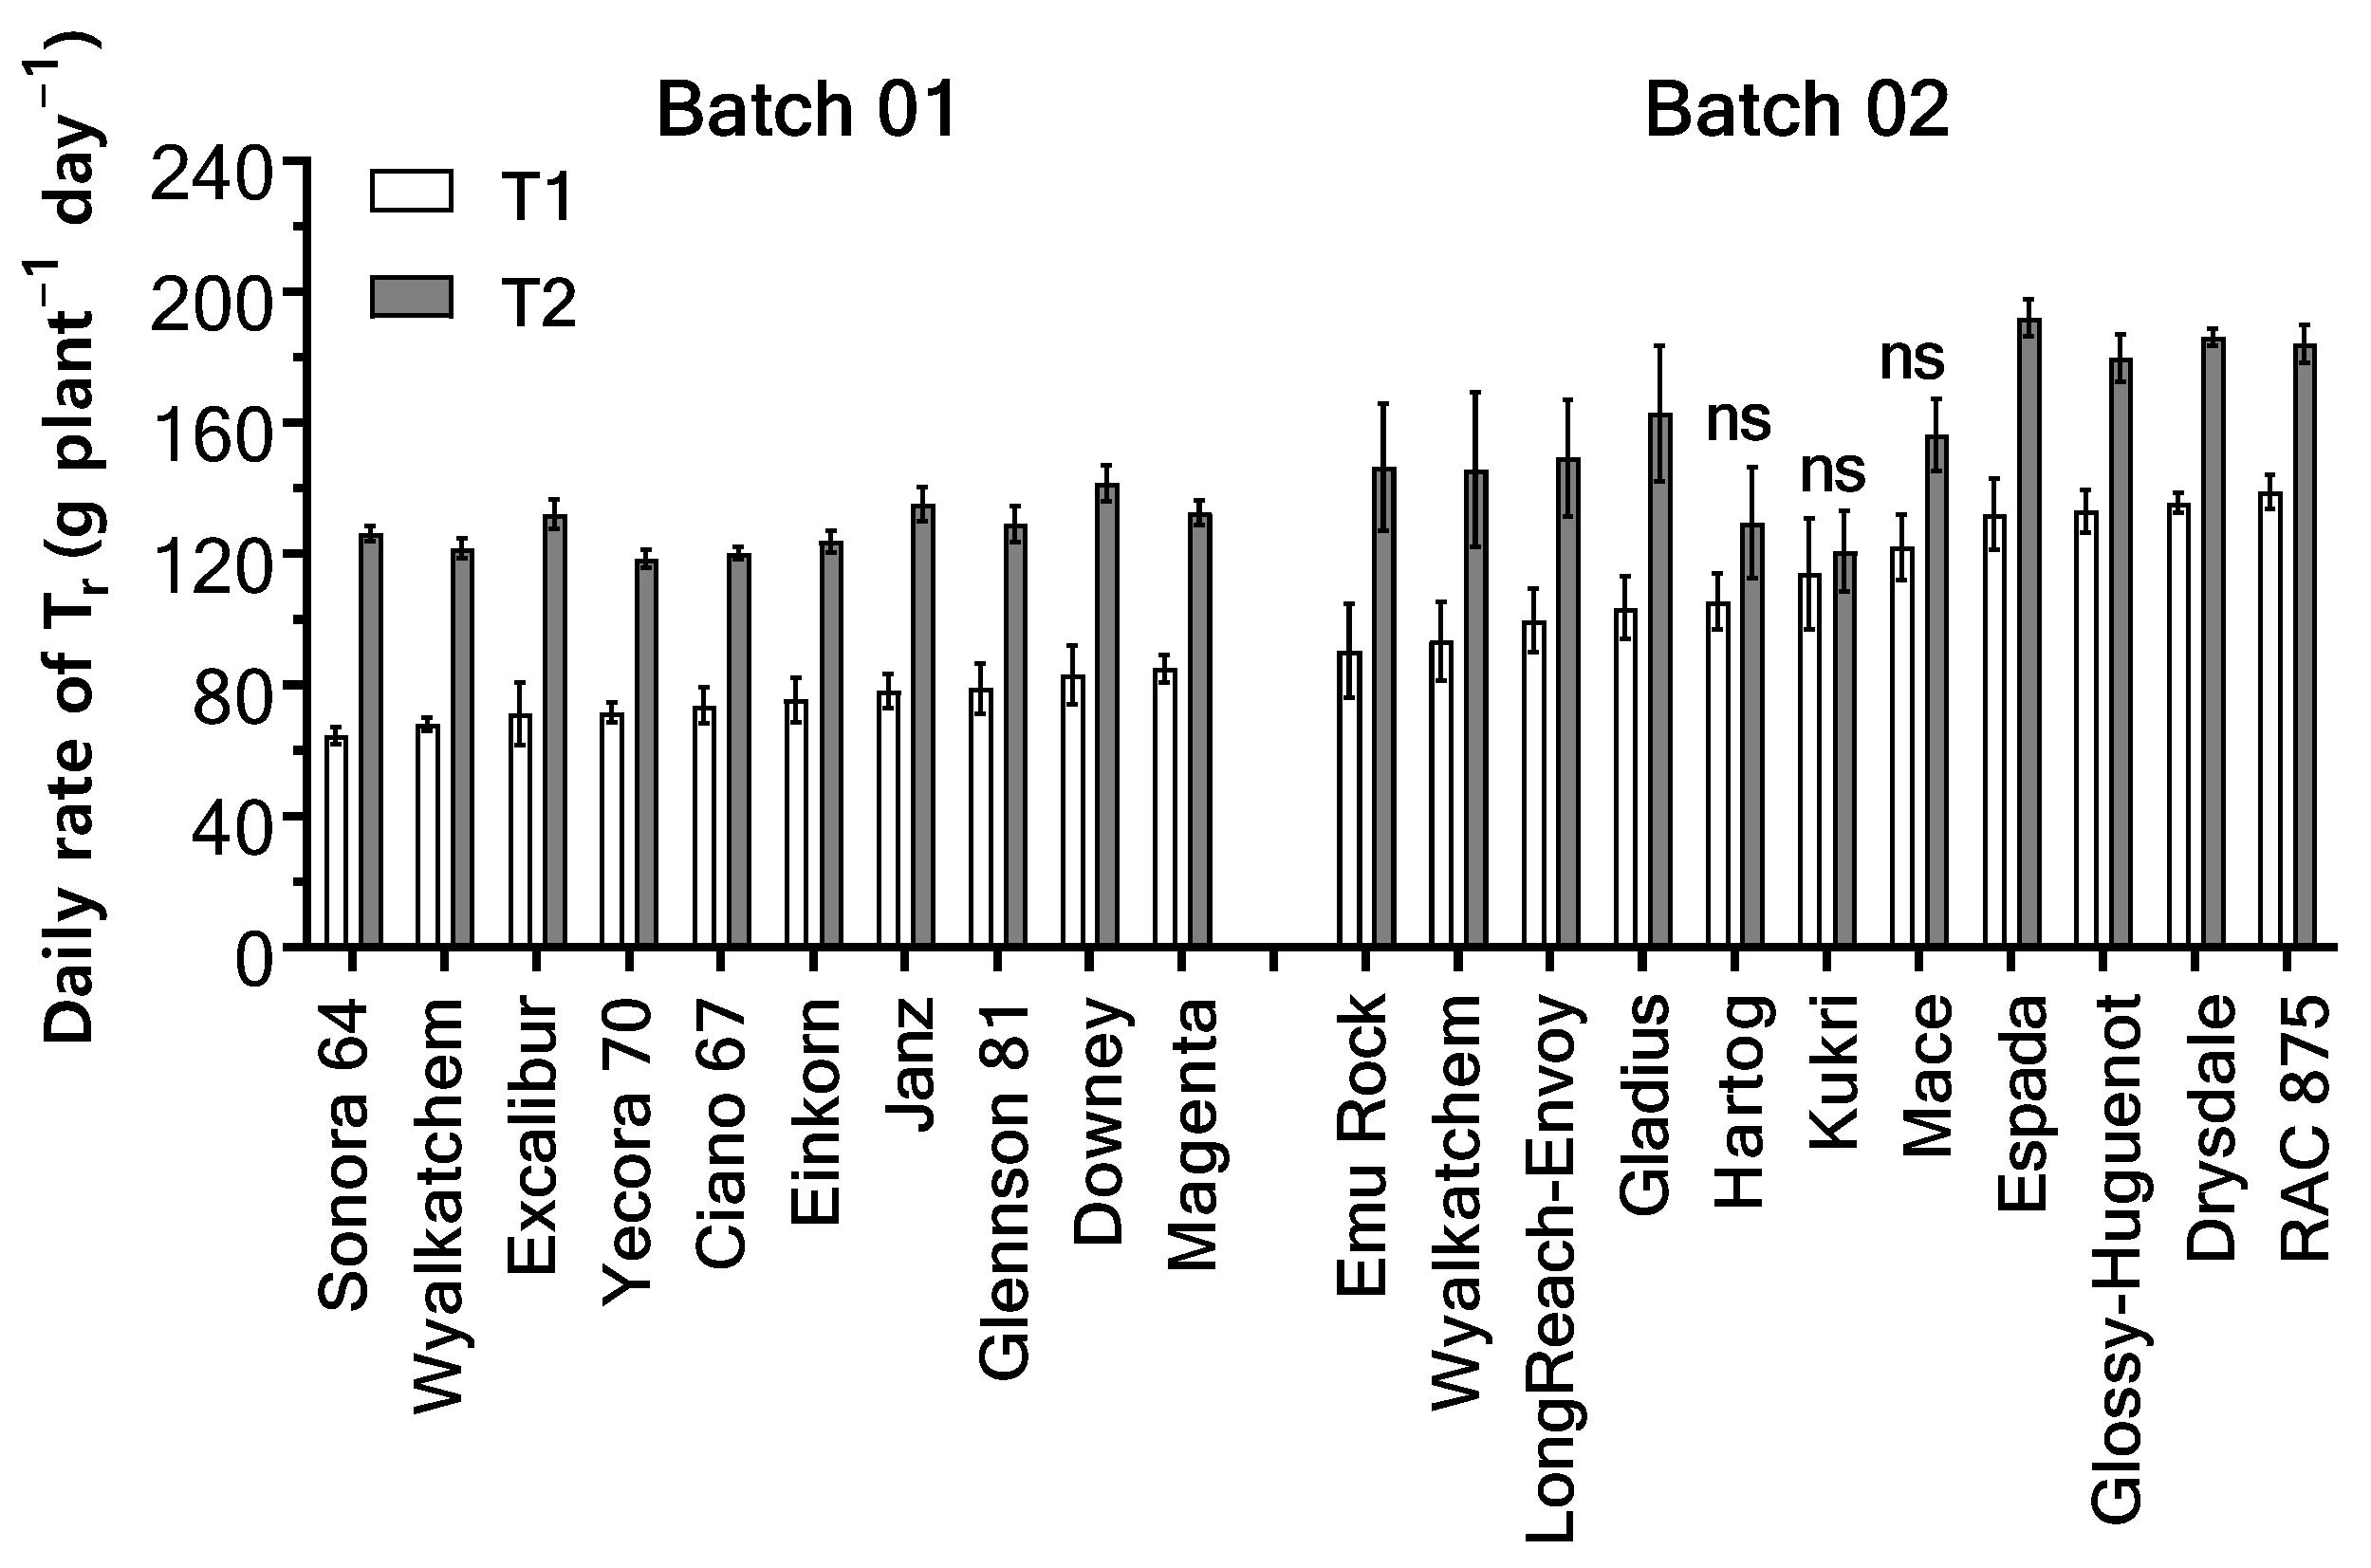
2.1.1. Daily Tr

There was no genotype × temperature regime interaction for daily Tr per plant in Batch 01 (p = 0.731; Figure 1) or Batch 02 (p = 0.604; Figure 1). The average daily Tr differed significantly between genotypes in both batches (Batch 01, p = 0.006; Batch 02, p < 0.0001).
The average daily Tr ranged from 94.8 g plant−1 d−1 in Wyalkatchem to 112.4 g plant−1 d−1 in Downey in Batch 01, and 117.5 g plant−1 d−1 in Kukri to 162.1 g plant−1 d−1 in Espada in Batch 02. The elevated temperature treatment (T2) significantly increased the average daily Tr (p < 0.0001) by 70.8% in Batch 01 genotypes and 38% in Batch 02 genotypes (Figure 1). However, post-hoc analysis revealed no significant difference in daily Tr occurred between ambient (T1) and elevated (T2) temperatures in Hartog, Kukri, and Mace (p > 0.05, Figure 1).

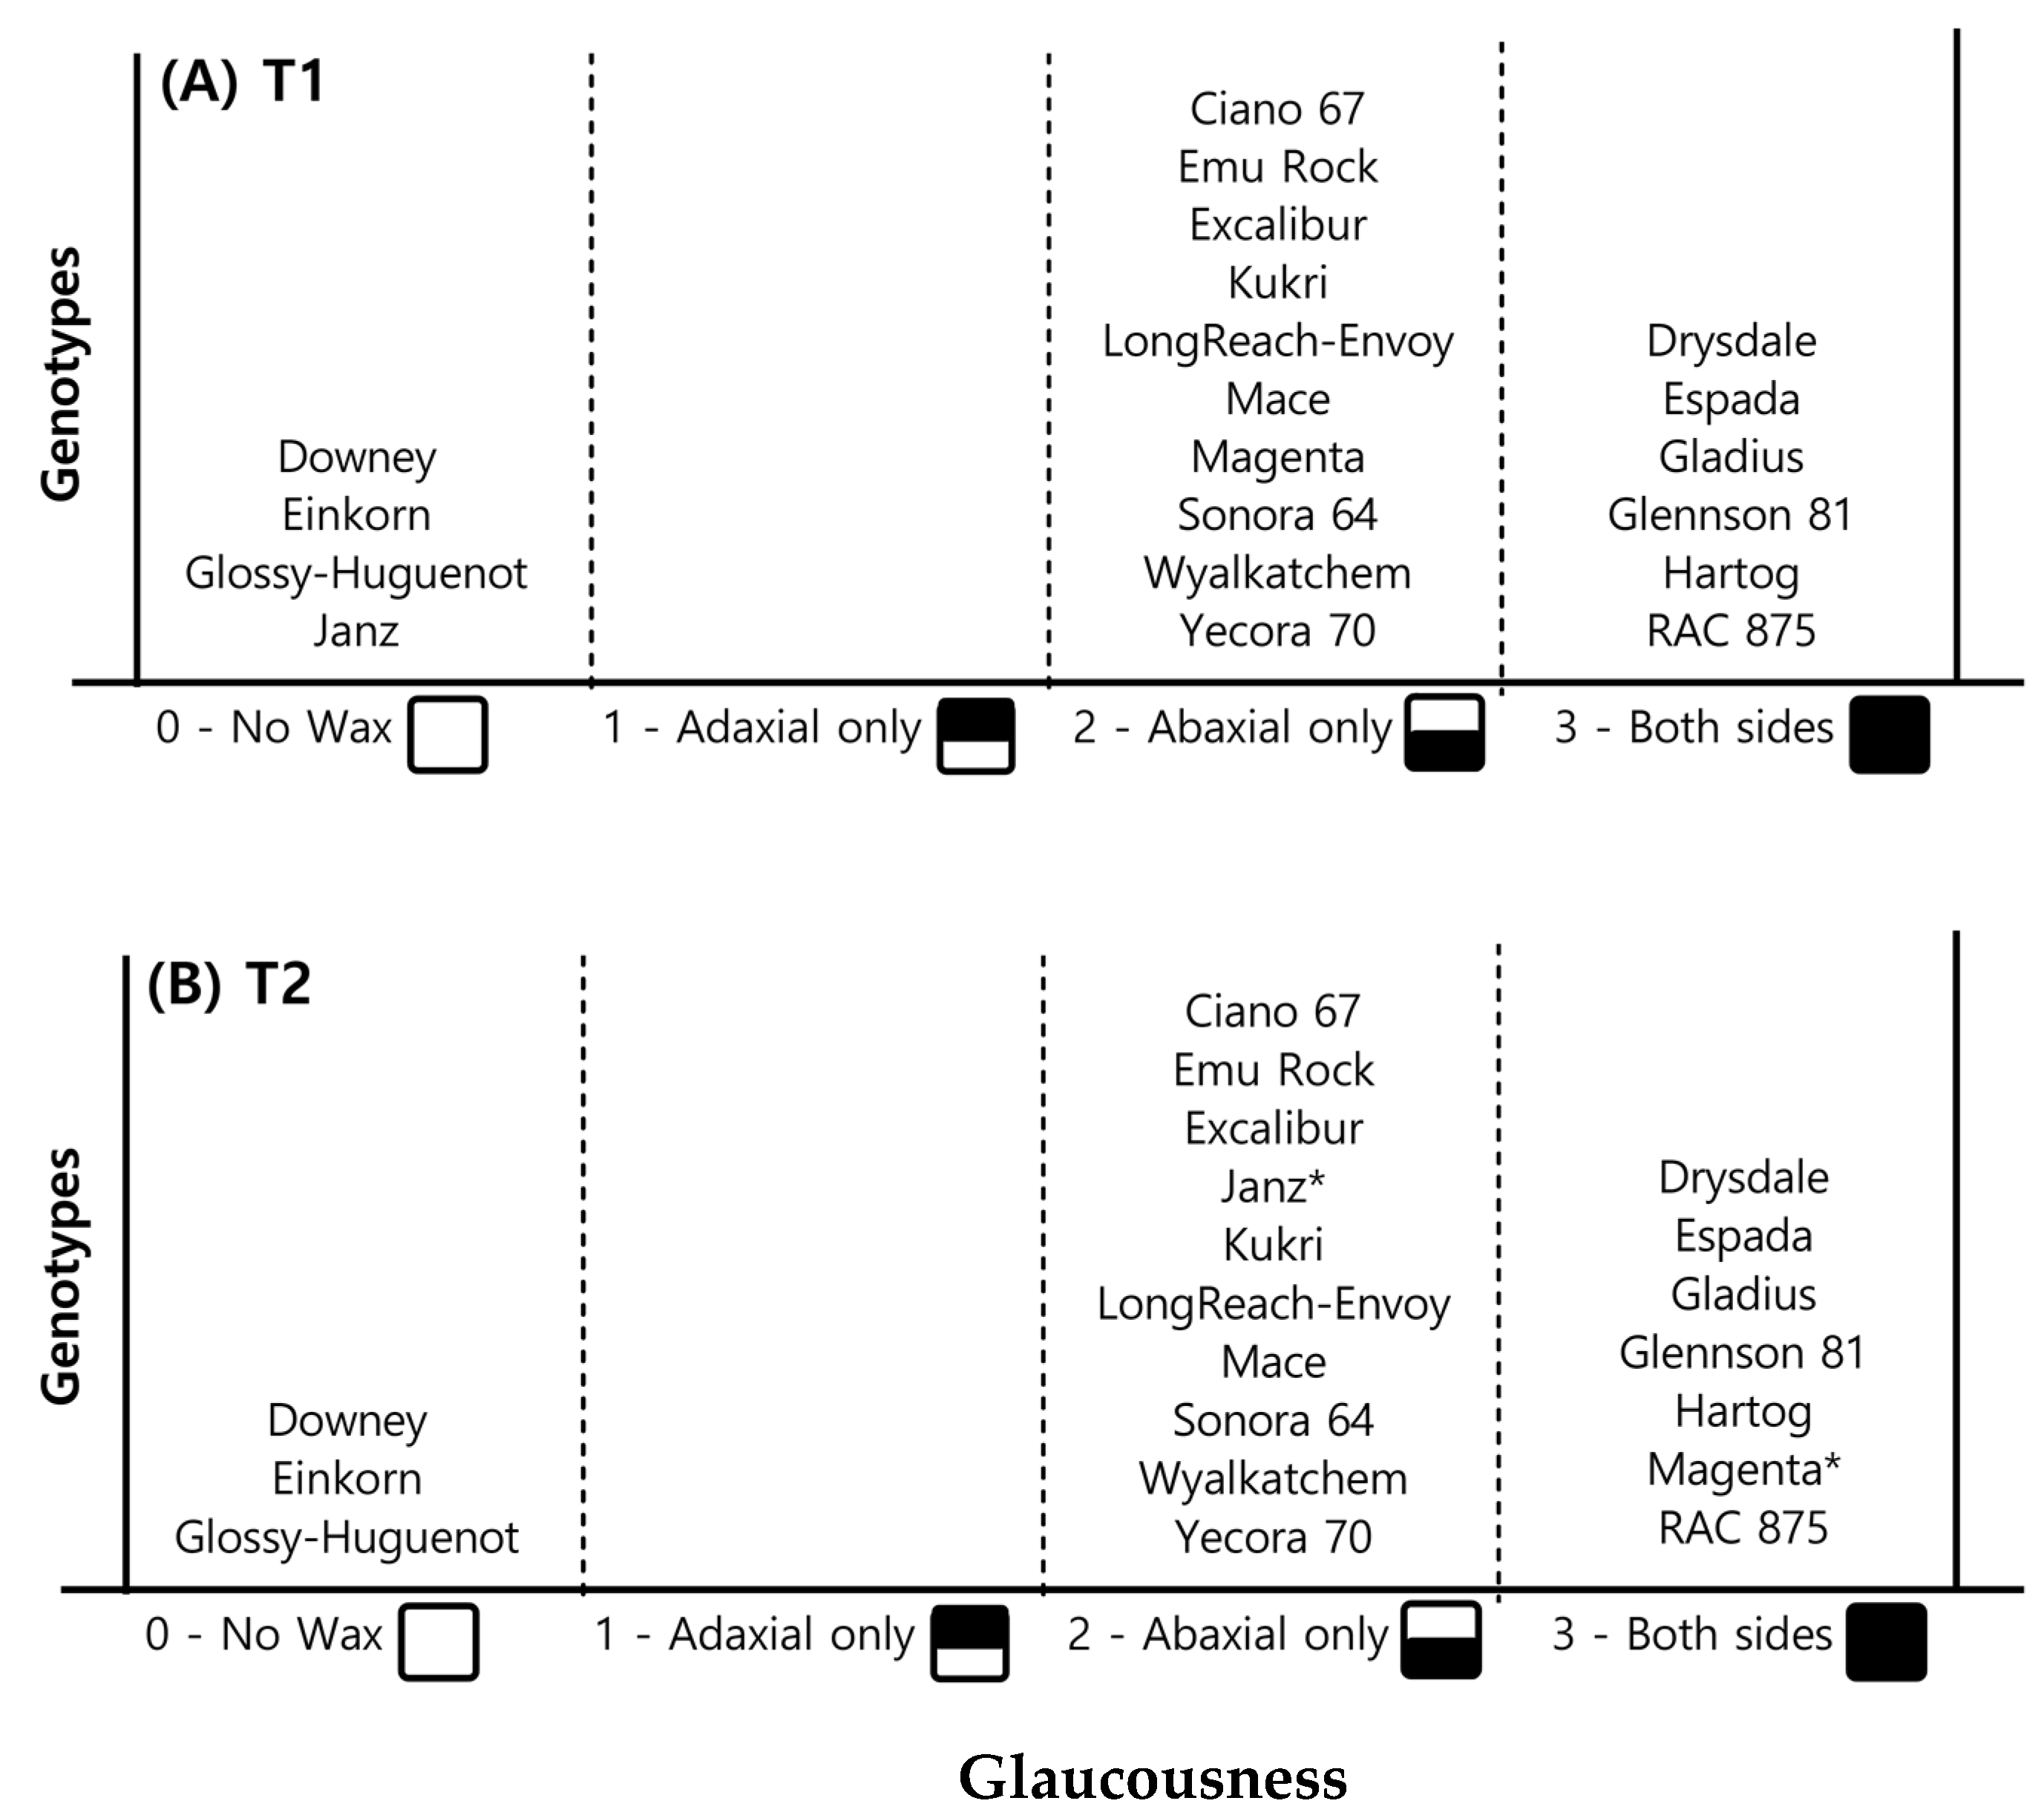
2.1.2. Leaf Glaucousness

There were noticeable differences in the presence/absence of wax and the amount of wax deposition on leaf surfaces among genotypes (Figure 2). The cultivars Downey, Einkorn, Glossy-Huguenot, and Janz had no visual signs of glaucousness, except Janz under T2, where some whitish/blue wax was deposited on the abaxial leaf surface, close to the leaf base. T2 induced whitish/blue wax deposition on the adaxial leaf surface of cultivar Magenta, relative to T1, where it only exhibited glaucousness on the abaxial side of the leaf. Drysdale, Espada, Gladius, Glennson 81, Hartog, and RAC 875 leaves were glaucous on both leaf surfaces under both temperature regimes.
Glaucousness first appeared on the flag leaf sheath and abaxial surface of the leaf lamina close to the base, and wax expression increased with time. More wax deposition was always evident on the abaxial leaf surface than the adaxial leaf surface. Based on visual observations, RAC 875, Espada, and Gladius were identified as heavy wax genotypes.

2.1.3. Pubescence

Cultivar Downey was the only genotype with pubescent leaves among all genotypes, with dense hair covering both abaxial and adaxial leaf surfaces, which was easily detected with a magnifying glass.

2.1.4. Stomatal Density

Total Stomatal Density (Abaxial and Adaxial Combined)

Batch 01 had a significant genotype × temperature regime interaction for total stomatal density (Table 1). In Batch 01, Magenta, Excalibur, and Einkorn had significantly higher stomatal density under T2 than T1 whereas all other genotypes were unaffected. Under both temperature regimes, Einkorn had the highest total stomatal density and Downey had the lowest. Batch 02 did not have a significant genotype × temperature regime interaction for total stomatal density (Table 1) but had significant main effects for genotype and temperature regime. In Batch 02, total stomatal density ranged from 101.4 mm−2 in Espada to 151.9 mm−2 in Glossy-Huguenot under T1 and increased by 11.1% (on average) under T2 relative to T1. No significant correlation occurred between total stomatal density and gs (at the end of the experiment) in either batch.

Abaxial and Adaxial Stomatal Densities

Batch 01 had a significant genotype × temperature regime interaction for abaxial stomatal density (Table 1). The two temperature regimes produced statistically similar abaxial stomatal densities for each genotype, except for an increase in Excalibur and Einkorn and a decrease in Wyalkatchem under T2 compared with T1. Under both temperature regimes, Einkorn had the highest abaxial stomatal density and Downey had the lowest. Batch 02 had significant main effects for genotype and temperature regime, but not their interaction (Table 1), for abaxial stomatal density. In Batch 02, abaxial stomatal density ranged from 47.9 mm−2 in Espada to 71.9 mm−2 in Glossy-Huguenot under T1 and increased by 11.3% (on average) under T2 relative to T1. Unlike Batch 01, Wyalkatchem had statistically similar abaxial stomatal density under both temperature regimes in Batch 02.
Neither batch had significant genotype × temperature regime interactions for adaxial stomatal density (Table 1), with all genotypes similarly affected by temperature. In both batches, the average adaxial stomatal density significantly differed between genotypes ranging from 50.1 mm−2 in Downey to 72.9 mm−2 in Glennson 81 in Batch 01, and 57.7 mm−2 in Espada to 81.6 mm−2 in Glossy-Huguenot in Batch 02. T2 increased the average adaxial stomatal density by 12% in Batch 01 genotypes and 11% in Batch 02 genotypes, relative to T1.

2.2. Growth Parameters

2.2.1. Green Leaf Area

Both batches had significant genotype × temperature regime interactions for green leaf area (Table 2). In general, green leaf area significantly decreased under T2 compared with T1, except for two genotypes (Sonora 64 and Downey) with similar green leaf areas between the two temperature regimes. In Batch 01 under T1, Downey had the largest green leaf area, and Sonora 64 had the smallest, whereas under T2, Downey had the largest green leaf area, and Ciano 67 had the smallest. In Batch 02, green leaf area under T1 ranged from 0.05 m2 plant−1 in Emu Rock to 0.14 m2 plant−1 in LongReach-Envoy, and under T2 ranged from 0.02 m2 plant−1 in Hartog to 0.06 m2 plant−1 in Glossy-Huguenot.
Green leaf area per plant had a significant positive correlation with total water use per plant under both temperature regimes in both batches (Pearson’s correlation coefficient (r) = 0.4–0.6; p < 0.05) with comparatively stronger correlations under elevated temperature (T2).

2.2.2. Specific Leaf Weight

The effect of the genotype on specific leaf weight (measure of leaf thickness) varied depending on the temperature regime in Batch 01 and Batch 02 (Table 2). In Batch 01, specific leaf weight under T1 ranged from 31.6 g m−2 in Einkorn to 49.3 g m−2 in Sonora 64 (thick leaves), and under T2 it ranged from 39.18 g m−2 in Downey to 52.0 g m−2 in Glennson 81. In Batch 02, specific leaf weight under T1 ranged from 45.9 g m−2 in Wyalkatchem and 56.7 g m−2 in Glossy-Huguenot, and under T2 it ranged from 50.2 g m−2 in Gladius to 57.9 g m−2 in LongReach-Envoy.

2.2.3. Shoot Dry Weight

Only the main effects of genotype and temperature regime, but not their interaction, had a significant effect on shoot dry weight in both batches (Table 2). In Batch 01, Magenta and Janz had the highest average shoot dry weights, and Einkorn had the lowest. In Batch 02, Espada had the highest average shoot dry weight, and Wyalkatchem had the lowest. The elevated temperature decreased average shoot dry weights by approximately 20% in both batches.
Shoot dry weight per plant had a significant positive correlation with total water use per plant under both temperature regimes in both batches (Figure 3). However, Batch 02 genotypes had a stronger correlation (Figure 3B) than Batch 01 genotypes (Figure 3A).

2.2.4. Root Dry Weight and Shoot: Root Ratio

Batch 02 did not have a significant genotype × temperature regime interaction for root dry weight but had significant main effects for genotype and temperature regime (Table 3). Glossy-Huguenot had the highest average root dry weight, whereas Emu Rock had the lowest. On average, root dry weight under T2 decreased by 42.5%, relative to T1. The effect of genotype on the shoot: root ratio varied significantly depending on the temperature regime (Table 3). The shoot: root ratio under T1 ranged from 6.2 in LongReach-Envoy to 12.3 in Emu Rock, and under T2 ranged from 6.8 in Glossy-Huguenot to 18.2 in Hartog. In general, shoot: root ratios were higher under T2 than T1. There was no significant correlation between shoot: root ratio and total water use per plant (p = 0.208) in either batch or temperature regime.

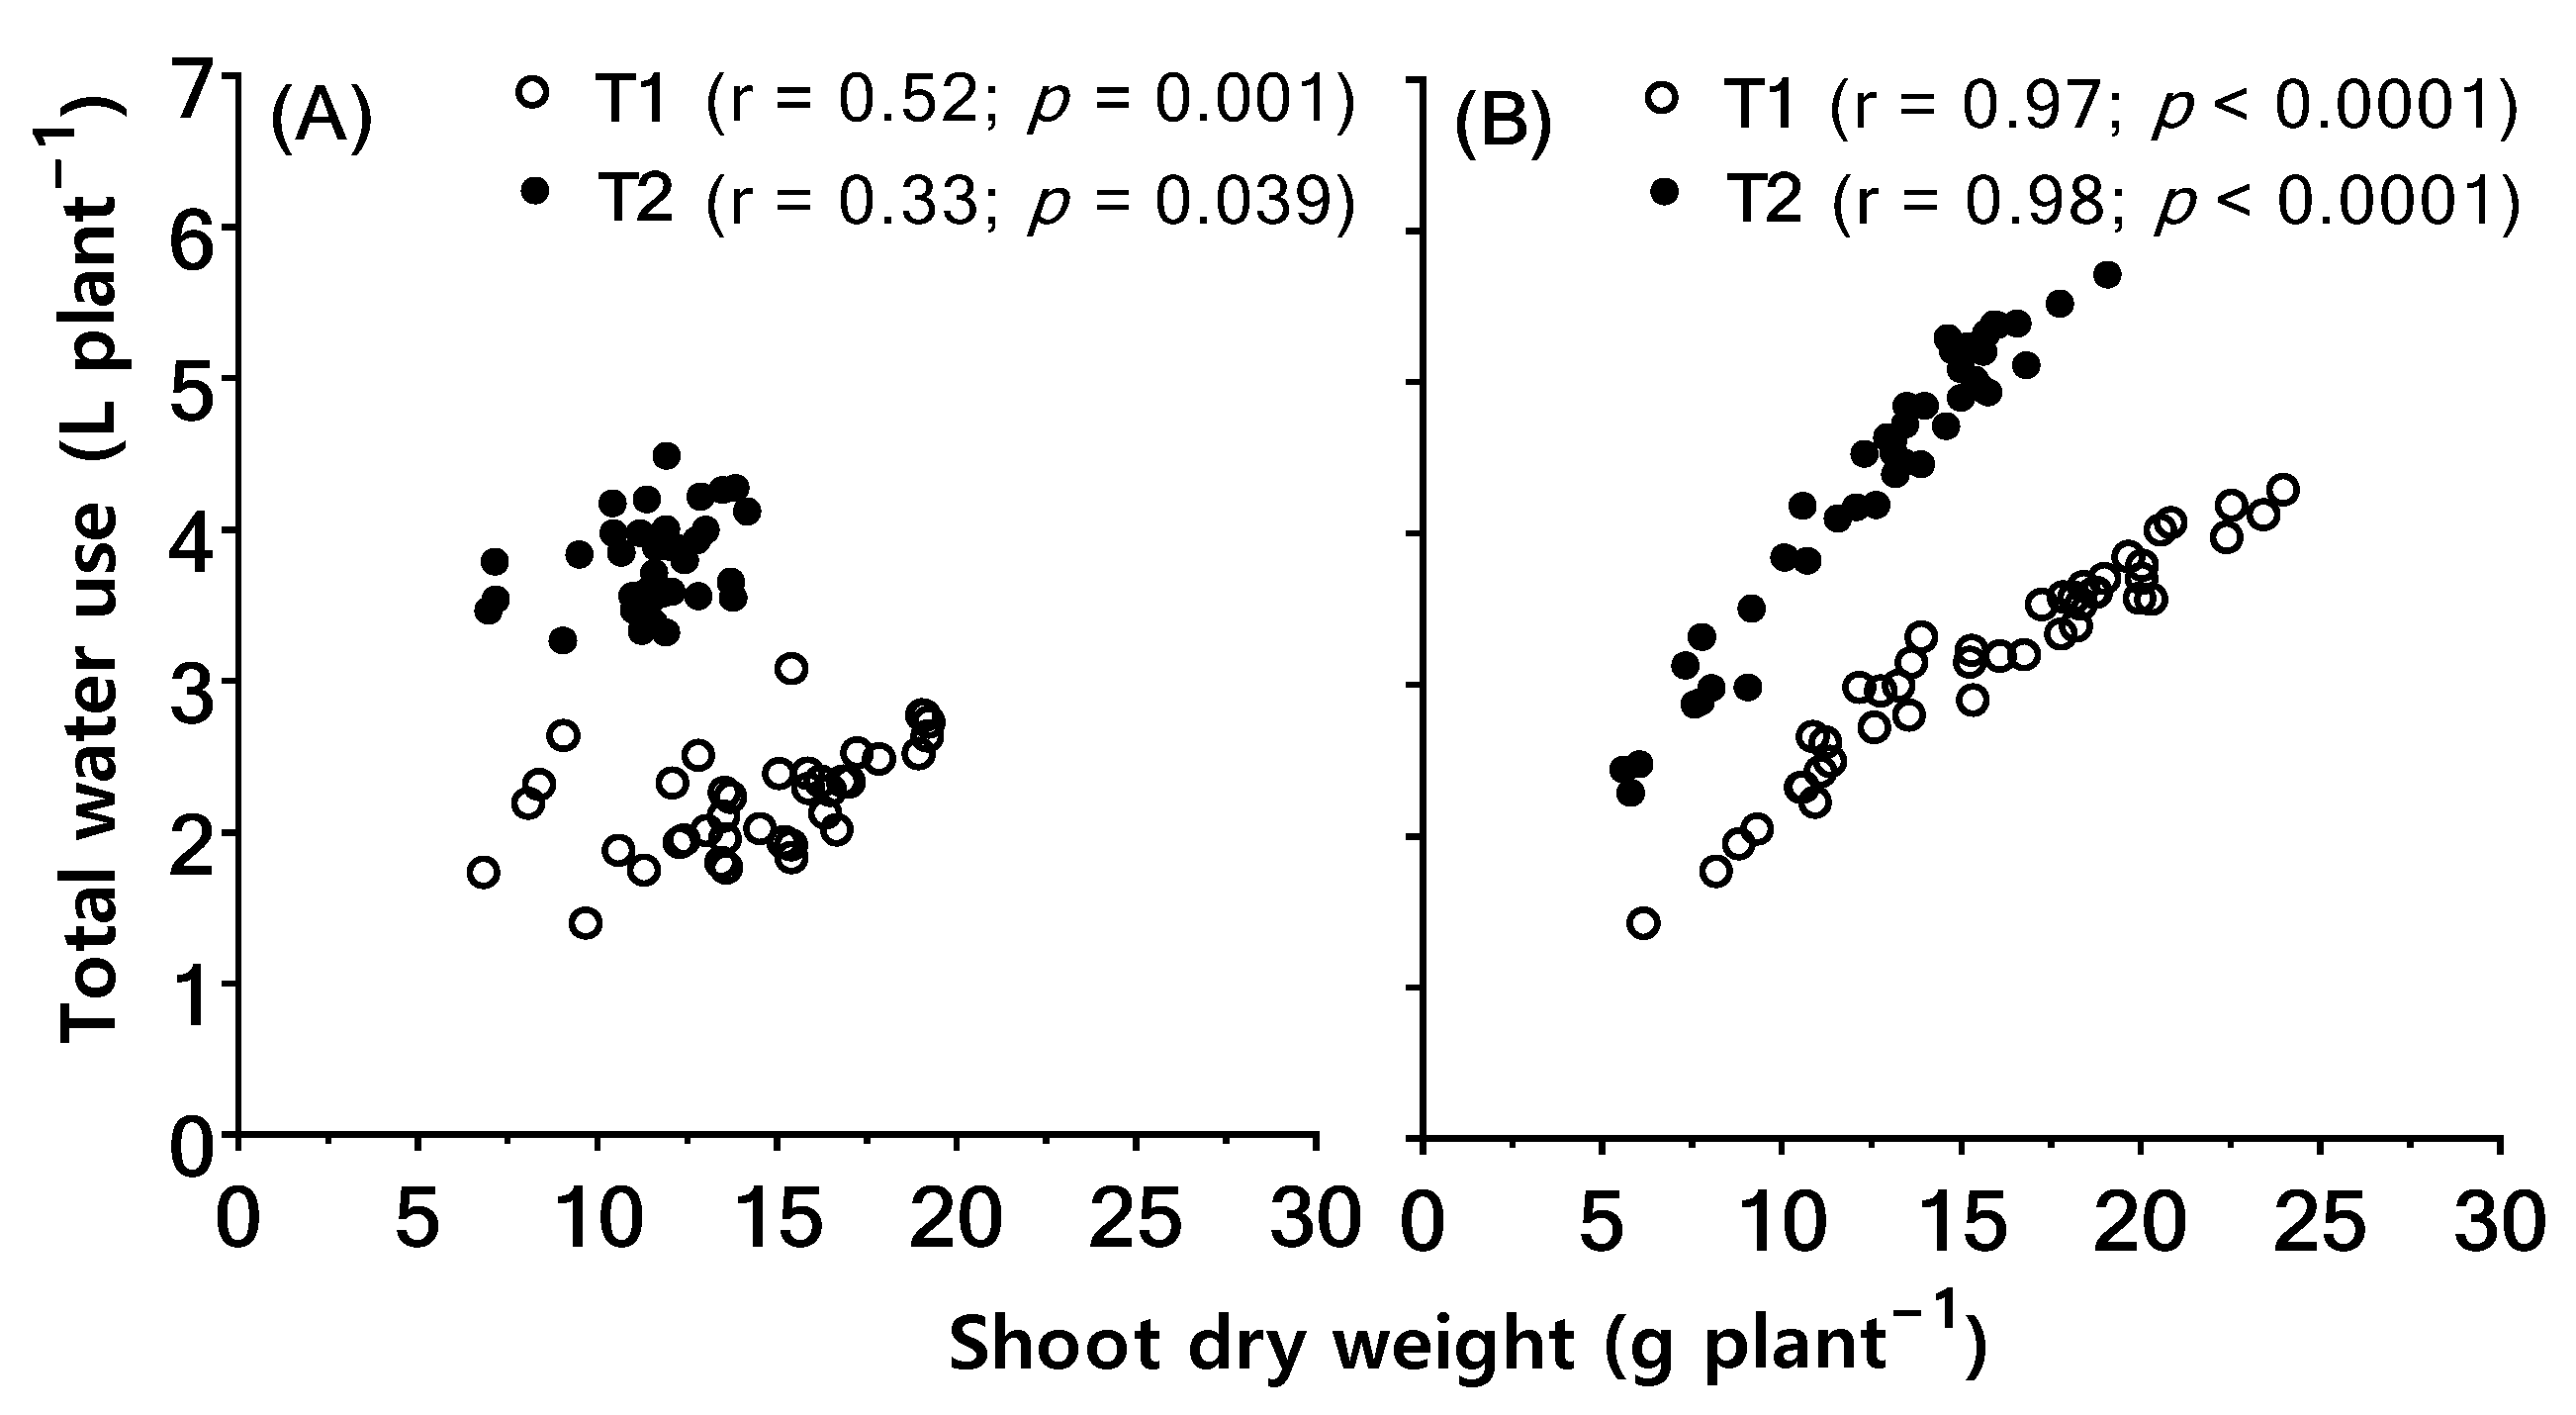
2.3. Associations between Biomass Retention under High Temperature and Total Water Use Per Plant and Leaf-to-Air Temperature Differential (Tair–Tleaf)

Table 4 summarizes the results for the fixed effects in the linear mixed model, where biomass reduction% under T2 relative to T1 was fitted as the response variable. The (Tair–Tleaf) × genotype and total water use × genotype interactions were highly significant (Table 4), indicating that the effects of leaf-to-air temperature differential and total water use per plant on biomass reduction% under high temperature depends on the genotype.
Biomass reduction% had a significant negative correlation with total water use per plant in both batches. However, Batch 02 had a stronger correlation (r = −0.52; p < 0.001) than Batch 01 (r = −0.36; p = 0.021).

2.4. Genotypic Variability in Tleaf Response to Tair

Tleaf had a positive linear correlation with Tair for all genotypes, but the increase in Tleaf per unit increase in Tair (i.e., slope) significantly differed between genotypes (Table 5). The Tleaf (Tair) regression slope ranged from 0.49 °C °C−1 in Einkorn to 1.02 °C °C−1 in Janz.

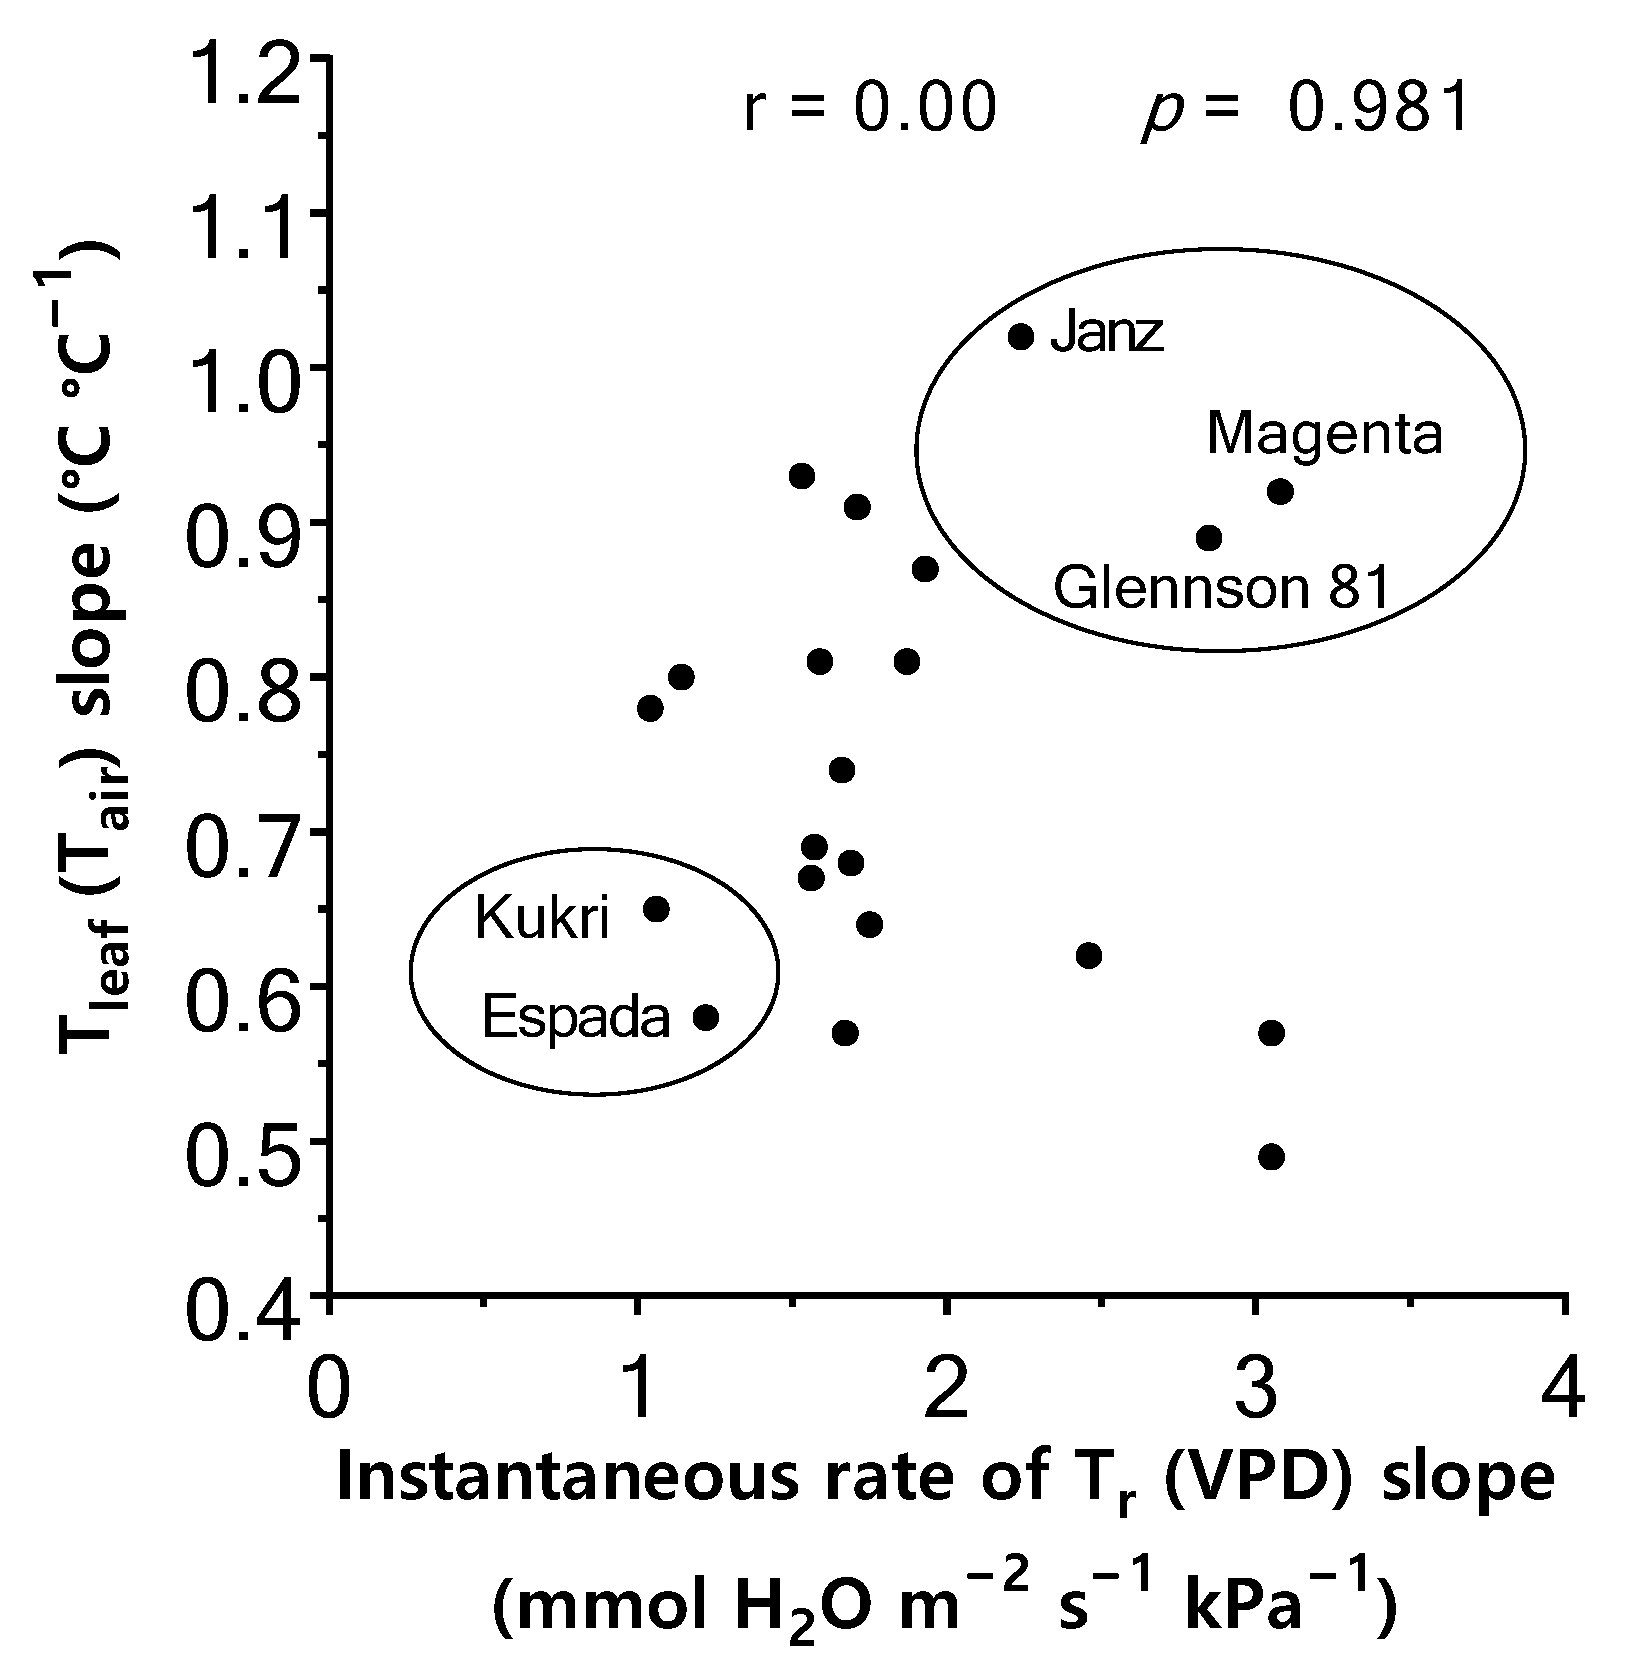
2.5. Relationship between Instantaneous Tr Response to VPD and Tleaf Regulation

The instantaneous Tr increased linearly with VPD, but the response (i.e., slope of the regression) varied among genotypes (p < 0.05), ranging from 1.04 mmol H2O m−2 s−1 kPa−1 in Hartog to 3.08 mmol H2O m−2 s−1 kPa−1 in Magenta (Table S2). Figure 4 shows the relationship between Tleaf (Tair) response and instantaneous Tr (VPD) response in the 20 wheat genotypes studied. The Tleaf response to Tair had no significant correlation with Tr response to VPD when all 20 wheat genotypes were considered together (p = 0.981). Several genotypes did not conform to the general trend, with Tleaf of Janz, Magenta, and Glennson 81 (Figure 4) increasing in parallel with Tair, but their instantaneous Tr increased rapidly with VPD (greater slope of instantaneous Tr vs. VPD regression). In contrast, Tleaf of Espada and Kukri increased slowly with Tair, but their instantaneous Tr increased more slowly with VPD. After removing these five contrasting genotypes, the Tleaf response to Tair had a significant negative correlation with the instantaneous Tr response to VPD (r = −0.60; p = 0.013).

3. Discussion

High temperature and high VPD increased the daily Tr and total water use in both batches of genotypes. The effect of water-use and the leaf-to-air temperature differential (Tair–Tleaf) on shoot biomass retention under high temperature depended on the genotype due to their different morpho-physiological and growth attributes. Traits such as stomatal density, glaucousness, green leaf area, and shoot and root dry weights were also affected by high temperature and VPD. Instantaneous Tr increased with VPD in all genotypes, but the rate of increase (slope of the relationship between instantaneous Tr and VPD) differed between genotypes, indicating genotypic variability in this trait. Genotypic variability in the Tleaf response to Tair was apparent. In some genotypes (e.g., Einkorn, RAC 875, Excalibur), Tleaf increased slowly with Tair, whereas in others (e.g., Janz, Sonora 64, Magenta) Tleaf increased rapidly with Tair. In most genotypes, the Tleaf response to Tair was correlated with the instantaneous Tr response to VPD, indicating that genotypes whose instantaneous Tr increased more with VPD maintained lower Tleaf as Tair increased and vice versa. However, for several contrasting genotypes, the Tleaf response to Tair did not correlate with the instantaneous Tr response to VPD.

3.1. Greater Water Use through Tr Increases Shoot Biomass Retention under High Temperature

Under high temperatures, plant survival and productivity rely on heat tolerance and avoidance mechanisms [65]. Heat avoidance is the ability to maintain internal tissue temperatures below lethal stress levels, which is acquired through transpirational cooling, changes in leaf orientation, solar radiation reflection, and extensive rooting [66,67]. In contrast, heat-tolerant genotypes survive and develop under high temperatures, even with high internal tissue temperatures [67]. Increased biomass retention under high temperatures has been associated with heat tolerance and avoidance mechanisms. This study showed that high water use contributes to increased biomass retention under high temperatures depending on the genotype. CO2 exchange and water escape share a common pathway through the stomata. Thus, this contribution of greater water use to biomass retention under high temperatures may be due to greater CO2 exchange and evaporative cooling.
Higher water use by some genotypes (e.g., Magenta and Janz) did not always result in greater biomass retention. Biomass retention in those genotypes could be regulated by photosynthetic efficiency, biomass accumulation, and respiration. Some genotypes may be more efficient at photosynthesis and biomass accumulation and less sensitive to heat, despite differences in water use. The effect of leaf cooling or leaf-to-air temperature differential on biomass retention under high temperature also varied between genotypes. In some genotypes, biomass retention was not associated with the leaf-to-air temperature differential, suggesting that biomass retention under high temperature may not be linked to water use or its resultant effect on leaf cooling (see Figure S2).
Other possible reasons why Tair–Tleaf was not directly related to biomass retention under high temperature include:
(1)
Environmental factors that may confound the relationship between Tair–Tleaf and Tr, such as VPD, Tair, net radiation, and boundary layer resistance [68]. For instance, Tair–Tleaf may not be constant and may increase with Tair. Ideally, Tleaf measurements in each genotype should be made at the same Tair to prevent differences in Tair confounding the results.
(2)
Biomass retention under high temperature may be related to heat tolerance, independent of Tair–Tleaf or Tr. The internal tolerance mechanisms of some genotypes could enable them to withstand the heat, despite high Tleaf, without reducing biomass. For instance, the production of heat shock proteins that have a protective role against heat stress can be induced in some wheat genotypes exposed to temperatures around 32 °C [69]. In this study, Tair sometimes exceeded 35 °C, suggesting that some genotypes acquired heat tolerance. However, the reverse can also happen, where some genotypes become more heat-sensitive, even with relatively low Tleaf.
(3)
Tair–Tleaf measured once or at different times during the experimental period may not relate to biomass retention or water use during the whole period. The ability to maintain greater Tair–Tleaf throughout the plant’s growing cycle, regardless of growth stage or changes in environmental conditions, is more important (stability) and translates into biomass retention under warmer conditions. This trait may be more prominent in some genotypes than others.

3.2. Water Use through Tr and Associated Morpho-Physiological and Growth Characteristics as Affected by Temperature

High temperatures (8–9 °C rise in average temperature) increased the average daily Tr by 38–71% depending on the batch. Such increases in daily Tr are likely to be driven by the associated higher VPD under high temperature [62,70] and the changes in morpho-physiological characteristics induced by high temperature and VPD. Interestingly, the daily Tr for three genotypes with relatively low daily Tr (Hartog, Kukri, and Mace) did not significantly differ between the two temperature regimes and may have strict control of water use through stomata or other hydraulic properties.
Overall, high temperatures significantly affected morpho-physiological and growth characteristics, including stomatal density, amount of leaf glaucousness, green leaf area, and shoot and root biomass, but the amount or direction of the changes varied between genotypes.
The observed increase in daily Tr under high temperature may be related to changes in stomatal density. Abaxial and adaxial stomatal density varied between genotypes and between temperature regimes. For example, stomatal density in wheat decreased in the flag leaf but increased in the penultimate leaf with increasing temperature [71]. Stomatal density also increased in a range of herbs and trees in response to high temperature and VPD [72,73,74], but decreased under high VPD in some species such as tomato, capsicum, and eggplant [75]. In Batch 01, total stomatal density increased in three of the ten genotypes under high temperature but was similar under both temperature regimes for the other seven genotypes. In Batch 02, total stomatal density increased by 11.1% for all genotypes under high temperature relative to ambient conditions. This increase occurred either by the presence of more stomata on both sides of the leaves (Excalibur, Einkorn, Espada, Mace, Gladius, and Hartog) or only the abaxial (Drysdale and Glossy-Huguenot) or adaxial (Magenta) side. Positive correlations between stomatal density and gs have been reported in various tree, shrub, and herbaceous species [76], but not in rice [77]. We also found no correlation between stomatal density and gs, which may be due to other factors affecting gs, such as stomatal aperture [78].
High temperatures increased the level of wax expression in most but not all genotypes. Although the presence of wax could reduce Tr due to its low permeability and blockage of the stomata [79], no such differences in daily Tr were observed in this study. This is likely due to other genotypic factors confounding the influence of glaucousness on daily Tr. Consequently, precise identification of the effects of glaucousness on daily Tr should involve isogenic lines with a contrasting presence/absence of wax [63]. Chemical analyses are needed to estimate the level of wax deposition.
Green leaf area significantly decreased under high temperature, the extent of which depended on genotype. There was a moderate positive correlation (r = 0.40–0.57) between total water use through Tr and green leaf area (increased transpirational area). Genotypes with high water use might maintain leaf area by avoiding overheating and delaying senescence, which would support biomass accumulation due to greater photosynthetic area, translating into greater yields.
In both batches, high temperature (T2) reduced shoot dry weight by 20%. However, shoot dry weight positively correlated with total water use under both temperature regimes, reflecting Tr’s positive role in plant growth and biomass accumulation. High temperatures reduced root dry weight more than shoot dry weight, which is likely associated with reduced dry matter partitioning to roots under high temperature [80]. However, the smaller root biomass met the increased evaporative demand, as indicated by a 71% greater daily Tr under high temperature. Root length was not measured in this study, so it is unknown whether the change in root biomass resulted in a smaller root system or thinner roots. In this scenario, water absorption and delivery (hydraulic conductance) may have increased to support the higher daily Tr.
The effect of high temperature on specific leaf weight, an approximate measure of leaf thickness, depended on genotype. In 13 of the 20 genotypes, high temperature increased specific leaf weight (leaves thickened), whereas the other 7 had similar or slightly lower specific leaf weights. A similar increase in specific leaf weight when Tair > 20 °C was reported previously [81]. Thick leaves are believed to have a higher volume of vascular tissues [82], improving axial hydraulic conductance. Thus, it was expected that genotypes with thick leaves would transpire more water. However, thick leaves may have a longer radial path through mesophyll, limiting radial hydraulic conductance. These counteracting effects could explain why total water use did not correlate with specific leaf weight.

3.3. Different Responses between the Two Batches of Genotypes as Explained by Differential Adaptations to Warm and Dry Conditions

Variability in the performance of Batch 01 and Batch 02 genotypes highlights their sensitivity to changes in temperature and VPD. Such responses can be expected under field conditions, which are highly variable and predicted to increase. The growing conditions before exposure to high temperatures differed slightly between the two batches. Due to starting later in the season, the second batch of plants was grown under relatively warmer and drier atmospheric conditions before exposure to T2. Consequently, the second batch of genotypes may have developed some adaptive mechanisms to those warmer and drier atmospheric conditions that reduced the response to T2, relative to the first batch of genotypes. For example, VPD between the two temperature glasshouses ranged from 1.2 to 2.2 kPa (average 1.7 kPa) for Batch 02 and 0.8 to 2.2 kPa (average 1.5 kPa) for Batch 01. However, the average increase in daily Tr under high temperature, relative to ambient temperature, was about 38% for Batch 02 genotypes and 71% for Batch 01 genotypes. The genotype Wyalkatchem, included in both batches as a reference, transpired at a 56% higher rate under high temperature than ambient temperature in Batch 02, much lower than Batch 01 (79%).
Furthermore, differential adaptations to warm and dry conditions in Batch 01 and Batch 02 genotypes were evident in the strength of the relationships between total water use and some growth attributes. For instance, Batch 02 had a stronger relationship between total water use and green leaf area and shoot dry weight than Batch 01. Therefore, we can assume that the influence of global warming on water use will differ between wheat grown in cooler and warmer regions. If wheat crops grown in cooler regions are exposed to warmer conditions, their water use may significantly increase, but wheat crops already in warmer conditions may not increase their water use proportionately in response to temperature.
The study suggests that some genotypes may adapt and develop tolerance mechanisms when exposed to warmer conditions for long periods. Therefore, we can expect that wheat crops already in warmer conditions may not increase their water use proportionately in response to temperature. However, if wheat crops grown in cooler regions are exposed to warmer conditions due to global warming, their water use may significantly increase.

3.4. Association of Instantaneous Tr Response to VPD and Tleaf Regulation

The instantaneous rate of Tr linearly increased with VPD in all genotypes, but the magnitude of the increase per unit change in VPD (i.e., slope) differed between genotypes. Such variability in the instantaneous Tr response to VPD may be associated with differences in stomatal regulation and/or the efficacy of water absorption and delivery of the vascular system in roots, shoots, and leaves (hydraulic conductance).
Tleaf also increased in response to Tair in all genotypes. However, the rate of increase (slope) differed among genotypes indicating differences in their capacity to regulate Tleaf under changing Tair. When all 20 genotypes were considered together, no significant correlation was observed between the instantaneous Tr response to VPD and Tleaf response to Tair. However, a positive correlation occurred when several contrasting genotypes were excluded from the analysis. The contrasting responses could be linked to differences in leaf physical attributes, such as glaucousness, pubescence, leaf color, and leaf size, affecting the absorption of radiant energy, reflectance, and sensible heat loss [83,84]. For instance, high leaf glaucousness in Espada [85] could explain its moderate Tleaf response to Tair despite its low instantaneous Tr response to VPD due to greater reflectance associated with glaucousness [84]. Leaf color and chlorophyll content could also affect leaf temperature [27,35,86]. Darker leaves absorb more radiation heat than pale leaves [87]. Therefore, dark green leaves may be warmer (e.g., Magenta), regardless of the Tr response to VPD. Traits like leaf size can affect transpirational cooling and sensible heat loss. When water is not limited, transpirational cooling is effective for large leaves due to the greater surface area for water escape. However, when water is scarce—imposing limits on transpirational cooling—large leaves may be disadvantaged due to their thick boundary layer, preventing sensible heat loss [64]. These findings suggest that transpirational cooling is not the only mechanism contributing to heat avoidance under high temperature; other heat dissipation mechanisms, such as those mentioned above, can contribute to heat avoidance. Moreover, their relative contribution varies depending on genotype.

4. Materials and Methods

4.1. Plant Material and Growing Conditions

Twenty wheat (Triticum aestivum L.) genotypes with contrasting morpho-physiological attributes and responses to heat and drought were selected (Table 6). The study was conducted in two batches of ten genotypes (Table 6), planted ten weeks apart due to the many measurements. The cultivar Wyalkatchem, a high-yielding and putatively drought-tolerant commercial cultivar, was used in both batches as a reference for comparison. The experiment was conducted in naturally-lit glasshouses with a daily maximum PAR 800–1000 µmol m−2 s−1 measured at the plane of the top leaves, at The University of Western Australia, Crawley, Western Australia (31°98′ S, 115°82′ E) under partially regulated conditions.
Seeds were surface sterilized and pre-germinated as described by Bramley et al. [104]. Three days after germination, seedlings were planted into the same soil and pots described in our previous study [70]. The pH (in 0.01 M CaCl2) and electrical conductance of the soil and sand mixture were 7.8 and 12.6 mS m−1, respectively. Before planting, the pot soil water capacity (PSWC) was determined by weighing each pot after saturating the soil with water and allowing them to drain freely for 48 h. The pots were sealed at the top with aluminum foil during free drainage to prevent evaporation from the soil surface. At planting, each pot was fertilized with 4 g of commercial slow-release fertilizer (N:P:K 19.4:1.6:5, Osmocote™, Scotts Australia Pty Ltd., Auckland, New Zealand). The pots were well-watered and maintained at 100 g below PSWC (85% PSWC) throughout the initial growing period by weighing daily to prevent anaerobic conditions. A liquid fertilizer (N:P:K 19:8.4:15.8, Poly–Feed™, Haifa Chemicals, Haifa, Israel) was applied (2 g per pot in 125 mL water) three weeks after planting. A 20 mm layer of white plastic beads covered the soil surface of each pot to prevent soil evaporation [70,105,106,107]. The pots were randomly arranged on a glasshouse bench and periodically rotated to minimize environmental heterogeneity.

4.2. Temperature Treatment

Seven weeks after sowing when the flag leaf ligule was visible (Z39; Zadoks’ growth scale) [108], a high-temperature treatment was imposed by transferring half of the plants (four replicates of each genotype) to another glasshouse with average temperatures 8–9 °C warmer (T2) than the ambient temperature glasshouse (T1) (see Table S1 and Figure S1). The remaining plants were maintained in the ambient glasshouse (T1). Plants were evaluated under the two temperature regimes for four weeks.

4.3. Experimental Design

The experiment was a completely randomized, two-factor factorial design with four replicates per treatment combination. The two factors were genotype and temperature regime [ambient (T1) and high (T2)].

4.4. Measurements

4.4.1. Growth and Morpho–Physiological Parameters

The transpiration rate (Tr) per plant was recorded by weighing pots daily between 08:00 and 09:00 h using an electronic balance with 0.1 g resolution (Model PGL 6001, Adam Equipment Company, Oxford, CT, USA). The difference between daily pot weights was considered the daily Tr per plant. After weighing, plants were re-watered to 100 g below PSWC. Leaf temperature (Tleaf) was recorded on the most recent, fully-expanded sunlit leaf (middle portion of the leaf) on the tagged main stem between 10:30 and 14:30 h weekly, on clear sunny days using a hand-held infrared thermometer (Impac Model IN 15 plus, LumaSense Technologies, Santa Clara, CA, USA; ±0.2 °C precision). The emissivity of the infrared thermometer was set at 0.94 (determined in a preliminary experiment), where the Tleaf reading from the infrared thermometer was compared against the Tleaf measured with a thermocouple (Digi–Temper Model 3527 with type K thermocouples, Tsuruga Electric Works, Osaka, Japan). Tair surrounding the leaf was measured using a digital thermometer probe (Dick Smith Electronics Ltd., New South Wales, Australia) shaded with an aluminum sheet to prevent radiant heating from direct sunlight. The instantaneous leaf-level Tr and gs were measured weekly on the same leaf after Tleaf measurements using a portable gas exchange system (Model LI-6400, LI-COR Inc., Lincoln, NE, USA). During the measurements, the conditions in the leaf chamber were: reference CO2 concentration 380 µmol mol−1, flow rate 400 µmol s−1, and photosynthetic photon flux density 1000 µmol m−2 s−1, which is the average saturation light intensity for photosynthesis in wheat [109]. Measurements continued for four weeks after applying the temperature treatment.
At the end of the experiment, the leaves used for physiological measurements were kept separate in zip-lock bags on ice to analyze abaxial and adaxial stomatal density. The number of stomata was counted with ImageJ 1.47v (National Institute of Health, Bethesda, Maryland, USA) from images taken using a digital camera (Pro-MicroScan Model DCM 310, Oplenic Optronics Co., Ltd., Hangzhou, China) mounted on a dissecting microscope (Zeiss SteREO Discovery.V8, Carl Zeiss MicroImaging GmbH, Gottingen, Germany). Leaf glaucousness was observed on the adaxial and abaxial surfaces of the leaf lamina (same leaf used for gas exchange measurements) using a magnifying glass (3×) and scored using a 0–3 scale, based on visual observations (0 = no wax, 1 = wax only on adaxial surface, 2 = wax only on abaxial surface, and 3 = wax on both adaxial and abaxial surfaces). Similarly, leaf pubescence was rated on a 0–3 scale (0 = hairs, 1 = hairs on both adaxial and abaxial surfaces, 2 = hairs only on adaxial surface, 3 = hairs only on abaxial surface). At the end of the experiment, the green leaf area of the whole plant was measured with a leaf area meter (Model LI 3000, Li-COR Inc., Lincoln, NE, USA). Leaves and stems were then oven-dried at 60 °C for 48 h for dry weight measurements. The specific leaf weight (g m−2) of the leaves used for gas exchange measurements was calculated as the ratio of leaf dry weight to leaf area. Roots were carefully washed from the soil as described by Liao et al. [110] and Palta et al. [111], and dry weight recorded after oven drying at 60 °C for 72 h. The percentage reduction in shoot dry weight (biomass reduction%) under elevated temperature (T2) in relation to ambient temperature (T1) was calculated as:
Biomass   reduction % = ( shoot   dry   weight   at   T 1 shoot   dry   weight   at   T 2 ) ( shoot   dry   weight   at   T 1 ) × 100

4.4.2. Environmental Parameters

Maximum and minimum Tair and relative humidity (RH) in the glasshouses were recorded throughout the experimental period using a data logger (WatchDog Micro Stations, Model 1250, Spectrum Technologies, Inc., Aurora, IL, USA) positioned just above the canopy. Atmospheric VPD was calculated according to the equations of [112]:
VPD = ( 100 RH 100 ) ×   SVP  
SVP = 610.7 × 10 7.5 T / ( 237.3 + T )
where RH is relative humidity (%), SVP is saturated vapor pressure (Pa), and T is air temperature (°C).

4.5. Statistical Analysis

A linear mixed model was fitted for biomass reduction% to test the hypothesis that high water use maintains biomass accumulation (less reduction) under high temperature through increased leaf cooling. The blocking structure that accounted for the nested genotype structure within a batch, namely the terms batch and batch genotype, were fitted as random factors. The model accounted for the unbalanced genotype allocation within batches. The fixed terms in the model included total water use, leaf-to-air temperature differential (Tair–Tleaf), and their interactions with genotype. The correlation between biomass reduction% and total water use per plant was studied to identify how water use influences biomass retention under warm and dry conditions.
Two-way ANOVAs were performed for daily Tr, stomatal density, green leaf area, shoot and root dry weights, shoot-to-root ratio, and specific leaf weight. Treatment means were compared using the 5% least significant difference (LSD) values. Correlations were examined between total water use per plant and green leaf area, shoot dry weight, shoot-to-root ratio, and specific leaf weight. The correlation between total stomatal density and gs was also examined.
Genotypic variation in the instantaneous Tr response to naturally fluctuating atmospheric VPD and the Tleaf response to Tair in the glasshouse were evaluated using the single linear regression model. Data within a typical VPD range (1.3–4.3 kPa) and Tair range (23.6–32.3 °C) were selected for each genotype in both batches of the instantaneous Tr (VPD) and Tleaf (Tair) regressions, respectively. Genotypes contrasting in their Tr response to VPD and Tleaf response to Tair were identified based on their regression slopes. The possible role of Tr in regulating Tleaf was identified by evaluating the correlation between the instantaneous Tr response to VPD and Tleaf response to Tair.
Statistical analysis was conducted using the R 3.6.2 programming environment [113], ASReml–R 3.0 [114], and GraphPad Prism 6.04 (GraphPad Software Inc., La Jolla, CA, USA; www.graphpad.com) (accessed on 10 May 2022).

5. Conclusions

High temperature and VPD significantly affected daily Tr, Tleaf, and associated morpho-physiological and growth characteristics. A positive correlation between shoot dry weight and water use indicates the benefit of Tr in maintaining growth under warm conditions. However, high water use through Tr or its potential effect of leaf cooling did not contribute equally to biomass retention under warm conditions in all genotypes. Some genotypes could maintain growth and biomass, to a certain extent, regardless of water use or leaf cooling through other mechanisms. Such genotypes may adapt and perform better when leaf cooling through Tr is limited by soil water deficit. Moreover, genotypes capable of reflecting excessive radiation heat loads (e.g., waxy or pubescent genotypes), such as Gladius and Espada, will be beneficial in such situations.
The plant root system plays a crucial role in supporting Tr through water absorption. It appears that when less dry matter was allocated to roots under high temperature, it did not significantly affect Tr. Thus, root water absorption (greater hydraulic conductance) may have improved to support Tr. However, increased dry matter allocation to produce extensive and deeper root systems under water stress would be beneficial for capturing water in deeper soil layers.
We believe that these findings will provide new insight into the basis of selecting superior wheat genotypes for future climate scenarios. Relying only on Tleaf or water use measurement for screening genotypes may not be sufficient as those parameters do not always correlate with heat tolerance and productivity. As highlighted in our study, comprehensive examination of different morpho-physiological attributes is needed for screening suitable genotypes for specific environments. Genotypic performances identified in this study will be useful in breeding programs of wheat.

Supplementary Materials

The following supporting information can be downloaded at: https://www.mdpi.com/article/10.3390/plants11162174/s1, Figure S1: Daily fluctuations in maximum, minimum, and average environmental conditions inside the two glasshouses during the experimental period (after imposing the temperature treatment).; Figure S2: Relationship between biomass reduction% and leaf-to-air temperature differential (Tair–Tleaf) in Batch 01 and Batch 02 wheat genotypes under T2 temperature condition; Table S1: Environmental conditions inside the two glasshouses during the experiment period (after imposing the temperature treatment); Table S2: Parameters of linear regression models for the relationship between instantaneous rate of transpiration (Tr) and atmospheric vapour pressure deficit (VPD) in 20 wheat genotypes.

Author Contributions

Conceptualization, S.R.W.M.C.J.K.R., H.B., K.H.M.S. and J.A.P.; methodology, S.R.W.M.C.J.K.R., H.B., K.H.M.S. and J.A.P.; formal analysis, S.R.W.M.C.J.K.R. and K.S.; investigation, S.R.W.M.C.J.K.R.; resources, K.H.M.S.; writing—original draft preparation, S.R.W.M.C.J.K.R.; writing—review and editing, K.H.M.S., H.B., J.A.P., K.S. and S.R.W.M.C.J.K.R.; supervision, H.B., K.H.M.S. and J.A.P.; project administration, K.H.M.S.; funding acquisition, K.H.M.S. All authors have read and agreed to the published version of the manuscript.

Funding

This research was funded by the UWA Institute of Agriculture. S.R.W.M.C.J.K.R. was supported by an Australian Government Endeavour Postgraduate Scholarship.

Institutional Review Board Statement

Not applicable.

Informed Consent Statement

Not applicable.

Data Availability Statement

All relevant data is contained within the article and supplementary materials. Additional data that support the findings of this study are available on request from the corresponding author.

Acknowledgments

We are grateful to Greg Rebetzke (CSIRO Plant Industry), Daniel Mullan (InterGrain Pty Ltd.) and the Australian Winter Cereal Collection (AWCC) for providing seeds and information about wheat cultivars, and Bruce Piper for providing the field soil.

Conflicts of Interest

The authors declare no conflict of interest.

References

  1. Wollenweber, B.; Porter, J.R.; Schellberg, J. Lack of Interaction between Extreme High-Temperature Events at Vegetative and Reproductive Growth Stages in Wheat. J. Agron. Crop Sci. 2003, 189, 142–150. [Google Scholar] [CrossRef]
  2. Ullah, A.; Nadeem, F.; Nawaz, A.; Siddique, K.H.M.; Farooq, M. Heat stress effects on the reproductive physiology and yield of wheat. J. Agron. Crop Sci. 2021, 208, 1–17. [Google Scholar] [CrossRef]
  3. Pachauri, R.K.; Allen, M.R.; Barros, V.R.; Broome, J.; Cramer, W.; Christ, R.; Church, J.A.; Clarke, L.; Dahe, Q.; Dasgupta, P. Climate Change 2014: Synthesis Report; Contribution of Working Groups I, II and III to the Fifth Assessment Report of the Intergovernmental Panel on Climate Change; IPCC: Geneva, Switzerland, 2014. [Google Scholar]
  4. Asseng, S.; Foster, I.; Turner, N.C. The impact of temperature variability on wheat yields. Glob. Chang. Biol. 2011, 17, 997–1012. [Google Scholar] [CrossRef]
  5. Shpiler, L.; Blum, A. Differential reaction of wheat cultivars to hot environments. Euphytica 1986, 35, 483–492. [Google Scholar] [CrossRef]
  6. Zhong-Hu, H.; Rajaram, S. Differential responses of bread wheat characters to high temperature. Euphytica 1993, 72, 197–203. [Google Scholar] [CrossRef]
  7. Rahman, M.A.; Chikushi, J.; Yoshida, S.; Karim, A. Growth and yield components of wheat genotypes exposed to high temperature stress under control environment. Bangladesh J. Agric. Res. 1970, 34, 360–372. [Google Scholar] [CrossRef] [Green Version]
  8. Hawker, J.; Jenner, C. High Temperature Affects the Activity of Enzymes in the Committed Pathway of Starch Synthesis in Developing Wheat Endosperm. Funct. Plant Biol. 1993, 20, 197–209. [Google Scholar] [CrossRef]
  9. Nuttall, J.G.; Barlow, K.M.; Delahunty, A.J.; Christy, B.P.; O’Leary, G.J. Acute High Temperature Response in Wheat. Agron. J. 2018, 110, 1296–1308. [Google Scholar] [CrossRef] [Green Version]
  10. Paulsen, G.M. High temperature response of crop plants. In Physiology and Determination of Crop Yield; Boote, K.J., Bennet, I.M., Sinclair, T.R., Paulsen, G.M., Eds.; American Society of Agronomy: Madison, WI, USA, 1994; pp. 365–389. [Google Scholar]
  11. Stone, P. The effects of heat stress on cereal yield and quality of hexaploid wheat. Euphytica. 2001, 126, 275–282. [Google Scholar]
  12. Dolferus, R.; Ji, X.; Richards, R.A. Abiotic stress and control of grain number in cereals. Plant Sci. 2011, 181, 331–341. [Google Scholar] [CrossRef]
  13. De Oliveira, E.D.; Palta, J.A.; Bramley, H.; Stefanova, K.; Siddique, K. Elevated CO2 Reduced Floret Death in Wheat Under Warmer Average Temperatures and Terminal Drought. Front. Plant Sci. 2015, 6, 1010. [Google Scholar] [CrossRef] [PubMed] [Green Version]
  14. Fábián, A.; Sáfrán, E.; Szabó-Eitel, G.; Barnabás, B.; Jäger, K. Stigma Functionality and Fertility Are Reduced by Heat and Drought Co-stress in Wheat. Front. Plant Sci. 2019, 10, 244. [Google Scholar] [CrossRef] [PubMed]
  15. Ullah, S.; Bramley, H.; Mahmood, T.; Trethowan, R. A strategy of ideotype development for heat-tolerant wheat. J. Agron. Crop Sci. 2019, 206, 229–241. [Google Scholar] [CrossRef]
  16. Ullah, S.; Trethowan, R.; Bramley, H. The physiological basis of improved heat tolerance in selected emmer-derived hexa-ploid wheat genotypes. Front. Plant Sci. 2021, 12, 739246. [Google Scholar] [CrossRef] [PubMed]
  17. Coast, O.; Posch, B.C.; Bramley, H.; Gaju, O.; Richards, R.A.; Lu, M.; Ruan, Y.; Trethowan, R.; Atkin, O.K. Acclimation of leaf photosynthesis and respiration to warming in field-grown wheat. Plant, Cell Environ. 2020, 44, 2331–2346. [Google Scholar] [CrossRef]
  18. Posch, B.C.; Zhai, D.; Coast, O.; Scafaro, A.P.; Bramley, H.; Reich, P.; Ruan, Y.-L.; Trethowan, R.; A Way, D.; Atkin, O. Wheat respiratory O2 consumption falls with night warming alongside greater respiratory CO2 loss and reduced biomass. J. Exp. Bot. 2021, 73, 915–926. [Google Scholar] [CrossRef]
  19. Shirdelmoghanloo, H.; Cozzolino, D.; Lohraseb, I.; Collins, N.C. Truncation of grain filling in wheat (Triticum aestivum) trig-gered by brief heat stress during early grain filling: Association with senescence responses and reductions in stem re-serves. Funct. Plant Biol. 2016, 43, 919–930. [Google Scholar] [CrossRef]
  20. Sarkar, S.; Islam, A.; Barma, N.; Ahmed, J. Tolerance mechanisms for breeding wheat against heat stress: A review. South Afr. J. Bot. 2021, 138, 262–277. [Google Scholar] [CrossRef]
  21. Prasad, P.V.; Bheemanahalli, R.; Jagadish, S.K. Field crops and the fear of heat stress—opportunities, challenges and future directions. Field Crops Res. 2017, 200, 114–121. [Google Scholar] [CrossRef] [Green Version]
  22. Peguero-Pina, J.J.; Vilagrosa, A.; Alonso-Forn, D.; Ferrio, J.P.; Sancho-Knapik, D.; Gil-Pelegrín, E. Living in drylands: Func-tional adaptations of trees and shrubs to cope with high temperatures and water scarcity. Forests 2020, 11, 1028. [Google Scholar] [CrossRef]
  23. Matsumoto, J.; Muraoka, H.; Washitani, I. Ecophysiological Mechanisms used by Aster kantoensis, an Endangered Species, to Withstand High Light and Heat Stresses of its Gravelly Floodplain Habitat. Ann. Bot. 2000, 86, 777–785. [Google Scholar] [CrossRef] [Green Version]
  24. Yadav, S.K.; Tiwari, Y.K.; Kumar, D.P.; Shanker, A.; Lakshmi, N.J.; Vanaja, M.; Maheswari, M. Genotypic Variation in Physiological Traits Under High Temperature Stress in Maize. Agric. Res. 2015, 5, 119–126. [Google Scholar] [CrossRef]
  25. Jagadish, S.V.K.; Murty, M.V.R.; Quick, W.P. Rice responses to rising temperatures–challenges, perspectives and future di-rections. Plant Cell Environ. 2015, 38, 1686–1698. [Google Scholar] [CrossRef] [PubMed]
  26. De Costa, W.A.J.M. Plant Water Relations: Principles and Applications; University of Peradeniya: Peradeniya, Sri Lanka, 2004. [Google Scholar]
  27. Rehman, H.; Tariq, A.; Ashraf, I.; Ahmed, M.; Muscolo, A.; Basra, S.; Reynolds, M. Evaluation of Physiological and Morphological Traits for Improving Spring Wheat Adaptation to Terminal Heat Stress. Plants 2021, 10, 455. [Google Scholar] [CrossRef]
  28. Gates. Transpiration and leaf temperature. Annu. Rev. Plant Physiol. 1968, 19, 211–238. [Google Scholar] [CrossRef]
  29. Lin, H.; Chen, Y.; Zhang, H.; Fu, P.; Fan, Z. Stronger cooling effects of transpiration and leaf physical traits of plants from a hot dry habitat than from a hot wet habitat. Funct. Ecol. 2017, 31, 2202–2211. [Google Scholar] [CrossRef] [Green Version]
  30. Clum, H.H. The effect of transpiration and environmental factors on leaf temperatures I. transpiration. Am. J. Bot. 1926, 13, 194–216. [Google Scholar] [CrossRef]
  31. Curtis, O.F. Transpiration and the cooling of leaves. Am. J. Bot. 1936, 23, 7–10. [Google Scholar] [CrossRef]
  32. Maricle, B.R.; Cobos, D.R.; Campbell, C.S. Biophysical and morphological leaf adaptations to drought and salinity in salt marsh grasses. Environ. Exp. Bot. 2007, 60, 458–467. [Google Scholar] [CrossRef]
  33. Shull, C.A. The mass factor in the energy relations of leaves. Plant Physiol. 1930, 5, 279–282. [Google Scholar] [CrossRef]
  34. Clements, H.F. SIGNIFICANCE OF TRANSPIRATION. Plant Physiol. 1934, 9, 165–172. [Google Scholar] [CrossRef] [PubMed] [Green Version]
  35. Monteiro, M.V.; Blanuša, T.; Verhoef, A.; Hadley, P.; Cameron, R.W.F. Relative importance of transpiration rate and leaf morphological traits for the regulation of leaf temperature. Aust. J. Bot. 2016, 64, 32–44. [Google Scholar] [CrossRef]
  36. Hegde, V.S.; Yadav, S.S.; Kumar, J. Heterosis and combining ability for biomass and harvest index in chickpea under a drought-prone, short-duration environment. Euphytica 2007, 157, 223–230. [Google Scholar] [CrossRef]
  37. Sinclair, T.R.; Bennett, J.M.; Muchow, R.C. Relative Sensitivity of Grain Yield and Biomass Accumulation to Drought in Field-Grown Maize. Crop Sci. 1990, 30, 690–693. [Google Scholar] [CrossRef]
  38. Zhang, Z.H.; Li, P.; Wang, L.X.; Hu, Z.L.; Zhu, L.H.; Zhu, Y.G. Genetic dissection of the relationships of biomass production and partitioning with yield and yield related traits in rice. Plant Sci. 2004, 167, 1–8. [Google Scholar] [CrossRef]
  39. Sharma, R.C. Selection for biomass yield in wheat. Euphytica 1993, 70, 35–42. [Google Scholar] [CrossRef]
  40. Hughes, W.G.; Westcott, B.; Sharp, P.L. Joint Selection for High Yield and Low Sensitivity in Winter Wheat (Triticum aestivum L.). Plant Breed. 1987, 99, 107–117. [Google Scholar] [CrossRef]
  41. Damisch, W.; Wiberg, A. Biomass Yield—A Topical Issue in Modern Wheat Breeding Programmes. Plant Breed. 1991, 107, 11–17. [Google Scholar] [CrossRef]
  42. Boukerrou, L.; Rasmusson, D.D. Breeding for High Biomass Yield in Spring Barley. Crop Sci. 1990, 30, 31–35. [Google Scholar] [CrossRef]
  43. Laza, M.R.; Peng, S.; Akita, S.; Saka, H. Contribution of Biomass Partitioning and Translocation to Grain Yield under Sub-Optimum Growing Conditions in Irrigated Rice. Plant Prod. Sci. 2003, 6, 28–35. [Google Scholar] [CrossRef]
  44. Liu, B.; Asseng, S.; Wang, A.; Wang, S.; Tang, L.; Cao, W.; Zhu, Y.; Liu, L. Modelling the effects of post-heading heat stress on biomass growth of winter wheat. Agric. For. Meteorol. 2017, 247, 476–490. [Google Scholar] [CrossRef]
  45. Richards, R.A.; Gómez-Macpherson, H.; Condon, A. Improving the efficiency of water use by plant breeding and molecular biology. Irrig. Sci. 1993, 14, 93–104. [Google Scholar] [CrossRef]
  46. López-Castañeda, C.; Richards, R. Variation in temperate cereals in rainfed environments III. Water use and water-use efficiency. Field Crop. Res. 1994, 39, 85–98. [Google Scholar] [CrossRef]
  47. Steduto, P.; Hsiao, T.C.; Fereres, E. On the conservative behavior of biomass water productivity. Irrig. Sci. 2007, 25, 189–207. [Google Scholar] [CrossRef] [Green Version]
  48. Xue, Q.; Stewart, B.A.; Lazar, M.D.; Piccinni, G.; Salisbury, C.D. Genotypic Variation of Osmotic Adjustment, Water-use and Transpiration Efficiency among Closely Related Wheat Lines. J. Crop Improv. 2012, 26, 258–281. [Google Scholar] [CrossRef]
  49. Musick, J.T.; Jones, O.R.; Stewart, B.A.; Dusek, D.A. Water-yield relationship for irrigated and dryland wheat in the U. S. Southern Plains. Agron. J. 1994, 86, 980–986. [Google Scholar] [CrossRef]
  50. Blum, A. Effective use of water (EUW) and not water-use efficiency (WUE) is the target of crop yield improvement under drought stress. Field Crop. Res. 2009, 112, 119–123. [Google Scholar] [CrossRef]
  51. Trnka, M.; Feng, S.; Semenov, M.A.; Olesen, J.E.; Kersebaum, K.C.; Rötter, R.P.; Semerádová, D.; Klem, K.; Huang, W.; Ruiz-Ramos, M.; et al. Mitigation efforts will not fully alleviate the in-crease in water scarcity occurrence probability in wheat-producing areas. Sci. Adv. 2019, 5, eaau2406. [Google Scholar] [CrossRef] [Green Version]
  52. Sadok, W.; Lopez, J.R.; Smith, K.P. Transpiration increases under high-temperature stress: Potential mechanisms, trade-offs and prospects for crop resilience in a warming world. Plant Cell Environ. 2021, 44, 2102–2116. [Google Scholar] [CrossRef]
  53. Nassiri, M.; Koocheki, A.; Kamali, G.A.; Shahandeh, H. Potential impact of climate change on rainfed wheat production in Iran. Arch. Agron. Soil Sci. 2006, 52, 113–124. [Google Scholar] [CrossRef]
  54. Amani, I.; Fischer, R.A.; Reynolds, M.P. Canopy temperature depression association with yield of irrigated spring wheat cul-tivars in a hot climate. J. Agron. Crop Sci. 1996, 176, 119–129. [Google Scholar] [CrossRef]
  55. Cossani, C.M.; Pietragalla, J.; Reynolds, M.P. Canopy temperature and plant water relations traits. In Physiological Breeding I: Interdisciplinary Approaches to Improve Crop Adaptation; Reynolds, M.P., Pask, A.J.D., Mullan, D.M., Eds.; CIMMYT: Texcoco, Mexico, 2012; pp. 60–68. [Google Scholar]
  56. Blum, A.; Mayer, J.; Gozlan, G. Infrared thermal sensing of plant canopies as a screening technique for dehydration avoidance in wheat. Field Crops Res. 1982, 5, 137–146. [Google Scholar] [CrossRef]
  57. Lopes, M.S.; Reynolds, M.P. Partitioning of assimilates to deeper roots is associated with cooler canopies and increased yield under drought in wheat. Funct. Plant Biol. 2010, 37, 147–156. [Google Scholar] [CrossRef]
  58. Reynolds, M.; Balota, M.; Delgado, M.; Amani, I.; Fischer, R. Physiological and Morphological Traits Associated With Spring Wheat Yield Under Hot, Irrigated Conditions. Funct. Plant Biol. 1994, 21, 717–730. [Google Scholar] [CrossRef]
  59. Olivares-Villegas, J.J.; Reynolds, M.P.; McDonald, G.K. Drought-adaptive attributes in the Seri/Babax hexaploid wheat pop-ulation. Funct. Plant Biol. 2007, 34, 189–203. [Google Scholar]
  60. Pietragalla, J. Canopy temperature. In Physiological Breeding II: A Field Guide to Wheat Phenotyping; Pask, A.J.D., Pietragalla, J., Mullan, D.M., Reynolds, M.P., Eds.; CIMMYT: Texcoco, Mexico, 2012; pp. 10–14. [Google Scholar]
  61. Ghojogh, H.; Mohammadi, V.; Zeinali, H.; Alizadeh, H. Efficiency of canopy temperature and relative water content in screening wheat genotypes for heat tolerance. Iran. J. Field Crop Sci. 2019, 50, 195–207. [Google Scholar]
  62. Sinclair, T.R.; Tanner, C.B.; Bennett, J.M. Water-Use Efficiency in Crop Production. BioScience 1984, 34, 36–40. [Google Scholar] [CrossRef]
  63. Richards, R.; Rawson, H.; Johnson, D. Glaucousness in Wheat: Its Development and Effect on Water-use Efficiency, Gas Exchange and Photosynthetic Tissue Temperatures*. Funct. Plant Biol. 1986, 13, 465–473. [Google Scholar] [CrossRef]
  64. Jones, H.G. Plants and Microclimate: A Quantitative Approach to Environmental Plant Physiology; Cambridge University Press: Cambridge, UK, 2014. [Google Scholar]
  65. Levitt, J. Responses of Plants to Environmental Stresses: Chilling, Freezing, and High Temperature Stresses; Academic Press: New York, NY, USA, 1980. [Google Scholar]
  66. Bonos, S.A.; Murphy, J.A. Growth Responses and Performance of Kentucky Bluegrass under Summer Stress. Crop Sci. 1999, 39, 770–774. [Google Scholar] [CrossRef]
  67. Xu, Y.; Zhan, C.; Huang, B. Heat Shock Proteins in Association with Heat Tolerance in Grasses. Int. J. Proteom. 2011, 2011, 529648. [Google Scholar] [CrossRef] [Green Version]
  68. Smith, R.C.G.; Barrs, H.D.; Steiner, J.L. Alternative models for predicting the foliage–air temperature difference of well irri-gated wheat under variable meteorological conditions. I. derivation of parameters II. accuracy of predictions. Irrig. Sci. 1986, 7, 225–236. [Google Scholar] [CrossRef]
  69. Hendershot, K.L.; Weng, J.; Nguyen, H.T. Induction Temperature of Heat-Shock Protein Synthesis in Wheat. Crop Sci. 1992, 32, 256–261. [Google Scholar] [CrossRef]
  70. Ranawana, S.R.W.M.C.J.K.; Siddique, K.H.M.; Palta, J.A.; Stefanova, K.; Bramley, H. Stomata coordinate with plant hydraulics to regulate transpiration response to vapour pressure deficit in wheat. Funct. Plant Biol. 2021, 48, 839–850. [Google Scholar] [CrossRef]
  71. Frank, A.B.; Power, J.F.; Willis, W.O. Effect of Temperature and Plant Water Stress on Photosynthesis, Diffusion Resistance, and Leaf Water Potential in Spring Wheat. Agron. J. 1973, 65, 777–780. [Google Scholar] [CrossRef] [Green Version]
  72. Salisbury, E.J.I. On the causes and ecological significance of stomatal frequency, with special reference to the woodland flora. Philos. Trans. R. Soc. Ser. B 1928, 216, 1–65. [Google Scholar] [CrossRef] [Green Version]
  73. Leuschner, C. Air humidity as an ecological factor for woodland herbs: Leaf water status, nutrient uptake, leaf anatomy, and productivity of eight species grown at low or high VPD levels. Flora Morphol. Distrib. Funct. Ecol. Plants 2002, 197, 262–274. [Google Scholar] [CrossRef]
  74. Murphy, M.R.C.; Jordan, G.J.; Brodribb, T.J. Acclimation to humidity modifies the link between leaf size and the density of veins and stomata. Plant Cell Environ. 2013, 37, 124–131. [Google Scholar] [CrossRef] [Green Version]
  75. Bakker, J. Effects of humidity on stomatal density and its relation to leaf conductance. Sci. Hortic. 1991, 48, 205–212. [Google Scholar] [CrossRef]
  76. Woodward, F.I.; Bazzaz, F.A. The Responses of Stomatal Density to CO2 Partial Pressure. J. Exp. Bot. 1988, 39, 1771–1781. [Google Scholar] [CrossRef]
  77. Ohsumi, A.; Kanemura, T.; Homma, K.; Horie, T.; Shiraiwa, T. Genotypic Variation of Stomatal Conductance in Relation to Stomatal Density and Length in Rice (Oryza sativa L.). Plant Prod. Sci. 2007, 10, 322–328. [Google Scholar] [CrossRef]
  78. Farquhar, G.D.; Sharkey, T.D. Stomatal conductance and photosynthesis. Annu. Rev. Plant Physiol. 1982, 33, 317–345. [Google Scholar] [CrossRef]
  79. Araus, J.L.; Febrero, A.; Vendrell, P. Epidermal conductance in different parts of durum wheat grown under Mediterranean conditions: The role of epicuticular waxes and stomata. Plant Cell Environ. 1991, 14, 545–558. [Google Scholar] [CrossRef]
  80. Wardlaw, I.; Sofield, I.; Cartwright, P. Factors Limiting the Rate of Dry Matter Accumulation in the Grain of Wheat Grown at High Temperature. Funct. Plant Biol. 1980, 7, 387–400. [Google Scholar] [CrossRef]
  81. Hotsonyame, G.K.; Hunt, L.A. Seeding date, photoperiod and nitrogen effects on specific leaf area of field-grown wheat. Can. J. Plant Sci. 1998, 78, 51–61. [Google Scholar] [CrossRef]
  82. Garnier, E.; Laurent, G. Leaf anatomy, specific mass and water content in congeneric annual and perennial grass species. N. Phytol. 1994, 128, 725–736. [Google Scholar] [CrossRef]
  83. Ehleringer, J.; Björkman, O.; Mooney, H.A. Leaf Pubescence: Effects on Absorptance and Photosynthesis in a Desert Shrub. Science 1976, 192, 376–377. [Google Scholar] [CrossRef]
  84. Johnson, J.D.; Ferrell, W.K. Stomatal response to vapour pressure deficit and the effect of plant water stress. Plant Cell Environ. 1983, 6, 451–456. [Google Scholar]
  85. Australian Grain Technologies. Espada-Fact Sheet; AGT: Roseworthy, Australia, 2010. [Google Scholar]
  86. Ferguson, H.; Cooper, C.S.; Brown, J.H.; Eslick, R.F. Effect of leaf color, chlorohyll concentration, and temperature on pho-tosynthetic rates of isogenic barley lines. Agron. J. 1972, 64, 671–673. [Google Scholar] [CrossRef]
  87. Lin, B.-S.; Lin, Y.-J. Cooling Effect of Shade Trees with Different Characteristics in a Subtropical Urban Park. HortScience 2010, 45, 83–86. [Google Scholar] [CrossRef] [Green Version]
  88. Izanloo, A.; Condon, A.G.; Langridge, P.; Tester, M.; Schnurbusch, T. Different mechanisms of adaptation to cyclic water stress in two South Australian bread wheat cultivars. J. Exp. Bot. 2008, 59, 3327–3346. [Google Scholar] [CrossRef] [Green Version]
  89. Roberts, J.J.; Gallun, R.L.; Patterson, F.L.; Finney, R.E.; Ohm, H.W.; Shaner, G.E. Registration of Downy wheat (Reg. No. 641). Crop Sci. 1981, 21, 350. [Google Scholar] [CrossRef]
  90. Sharma, H.C.; Waines, J.G. Inheritance of Leaf Pubescence in Diploid Wheat. J. Hered. 1994, 85, 286–288. [Google Scholar] [CrossRef]
  91. Pinter Jr, P.J.; Jackson, R.D.; Ezra, C.E.; Gausman, H.W. Sun-angle and canopy-architecture effects on the spectral reflectance of six wheat cultivars. Int. J. Remote Sens. 1985, 6, 1813–1825. [Google Scholar] [CrossRef]
  92. InterGrain. Magenta: Product Profile; InterGrain Pty Ltd.: Bibra Lake, WA, USA, 2012. [Google Scholar]
  93. Richards, R.A.; Rebetzke, G.J.; Condon, A.G.; van Herwaarden, A.F. Breeding opportunities for increasing the efficiency of water use and crop yield in temperate cereals. Crop Sci. 2002, 42, 111–121. [Google Scholar] [CrossRef] [PubMed]
  94. Bourgault, M.; Dreccer, M.F.; James, A.T.; Chapman, S.C. Genotypic variability in the response to elevated CO2 of wheat lines differing in adaptive traits. Funct. Plant Biol. 2013, 40, 172–184. [Google Scholar] [CrossRef] [PubMed]
  95. Dias de Oliveira, E.; Bramley, H.; Siddique, K.H.M.; Henty, S.; Berger, J.; Palta, J.A. Can elevated CO2 combined with high temperature ameliorate the effect of terminal drought in wheat? Funct. Plant Biol. 2013, 40, 160–171. [Google Scholar] [CrossRef]
  96. Akbari, M.; Wenzl, P.; Caig, V.; Carling, J.; Xia, L.; Yang, S.; Uszynski, G.; Mohler, V.; Lehmensiek, A.; Kuchel, H.; et al. Diversity arrays technology (DArT) for high-throughput profiling of the hexaploid wheat genome. Theor. Appl. Genet. 2006, 113, 1409–1420. [Google Scholar] [CrossRef]
  97. Richards, R.A. Physiological traits used in the breeding of new cultivars for water-scarce environments. Agric. Water Manag. 2006, 80, 197–211. [Google Scholar] [CrossRef]
  98. Hare, R.A. Characterization and Inheritance of Adult Plant Stem Rust Resistance in Durum Wheat. Crop Sci. 1997, 37, 1094–1098. [Google Scholar] [CrossRef]
  99. Ford, K.L.; Cassin, A.; Bacic, A.F. Quantitative Proteomic Analysis of Wheat Cultivars with Differing Drought Stress Tolerance. Front. Plant Sci. 2011, 2, 44. [Google Scholar] [CrossRef] [Green Version]
  100. InterGrain. Emu Rock: Product Profile; InterGrain Pty Ltd.: Bibra Lake, WA, USA, 2012. [Google Scholar]
  101. Australian Grain Technologies. Mace: Wheat Variety Fact Sheet for South Australia and Western Victoria; AGT: Roseworthy, Australia, 2013. [Google Scholar]
  102. Australian Grain Technologies. Gladius: Wheat Variety Fact Sheet for South Australia; AGT: Roseworthy, Australia, 2010. [Google Scholar]
  103. Fleury, D.; Jefferies, S.; Kuchel, H.; Langridge, P. Genetic and genomic tools to improve drought tolerance in wheat. J. Exp. Bot. 2010, 61, 3211–3222. [Google Scholar] [CrossRef] [PubMed] [Green Version]
  104. Bramley, H.; Turner, N.; Turner, D.; Tyerman, S. Roles of Morphology, Anatomy, and Aquaporins in Determining Contrasting Hydraulic Behavior of Roots. Plant Physiol. 2009, 150, 348–364. [Google Scholar] [CrossRef] [Green Version]
  105. Saradadevi, R.; Bramley, H.; Siddique, K.H.M.; Edwards, E.; Palta, J.A. Contrasting stomatal regulation and leaf ABA con-centrations in wheat genotypes when split root systems were exposed to terminal drought. Field Crops Res. 2014, 162, 77–86. [Google Scholar] [CrossRef]
  106. Turner, N.C.; Palta, J.A.; Shrestha, R.; Ludwig, C.; Siddique, K.H.M.; Turner, D.W. Carbon isotope discrimination is not cor-related with transpiration efficiency in three cool-season grain legumes (Pulses). J. Integr. Plant Biol. 2007, 49, 1478–1483. [Google Scholar] [CrossRef]
  107. Fletcher, A.; Chenu, K. Change in biomass partitioning and transpiration efficiency in Australian wheat varieties over the last decades. In Building Productive, Diverse and Sustainable Landscapes, Proceedings of the 17th Australian Agronomy Conference, Hobart, Australia, 20–24 September 2015; Acuna, T.B., Harrison, M., Moeller, C., Parsons, D., Eds.; Australian Society of Agronomy Inc.: Horsham, Australia, 2015; pp. 394–397. [Google Scholar]
  108. Zadoks, J.C.; Chang, T.T.; Konzak, C.F. A decimal code for the growth stages of cereals. Weed Res. 1974, 14, 415–421. [Google Scholar] [CrossRef]
  109. Acevedo, E.; Silva, P.; Silva, H. Wheat growth and physiology. In Bread Wheat: Improvement and Production; Curtis, B.C., Rajaram, S., Macpherson, H.G., Eds.; FAO: Rome, Italy, 2002; pp. 39–70. [Google Scholar]
  110. Liao, M.; Palta, J.A.; Fillery, I.R.P. Root characteristics of vigorous wheat improve early nitrogen uptake. Aust. J. Agric. Res. 2006, 57, 1097–1107. [Google Scholar] [CrossRef]
  111. Palta, J.A.; Fillery, I.R.P.; Rebetzke, G.J. Restricted-tillering wheat does not lead to greater investment in roots and early nitrogen uptake. Field Crops Res. 2007, 104, 52–59. [Google Scholar] [CrossRef]
  112. Monteith, J.L.; Unsworth, M.H. Principles of Environmental Physics, 2nd ed.; Edward Arnold: London, UK, 1990. [Google Scholar]
  113. R Development Core Team. R: A Language and Environment for Statistical Computing; R Foundation for Statistical Computing: Vienna, Austria, 2020; Available online: https://www.R-project.org/ (accessed on 11 August 2021).
  114. Gilmour, A.R.; Gogel, B.; Cullis, B.; Thompson, R. ASReml User Guide Release 3.0; VSN International Ltd.: Hemel Hempstead, UK, 2009. [Google Scholar]
Figure 1. Mean daily rate of transpiration (Tr) of 20 wheat genotypes in Batch 01 and 02 under ambient (T1) and high (T2) temperature regimes over the period of temperature treatment. Mean daily rate of Tr was calculated by dividing total water use per plant over the treatment period by the duration of the temperature treatment. Error bars indicate ± SEM; n = 4. The letters “ns” indicate no significant difference (p > 0.05) in the average daily rate of Tr between the two temperature regimes.
Plants 11 02174 g001
Figure 2. Categorization of wheat genotypes (Batch 01 and Batch 02) based on glaucousness (blueish/white waxy deposition) of leaves under (A) ambient (T1), and (B) high (T2) temperature regimes. T2 enhanced glaucousness, especially in genotypes indicated by *.
Plants 11 02174 g002
Figure 3. Relationship between shoot dry weight and total water use per plant during the period of temperature treatment in Batch 01 (A) and Batch 02 (B) wheat genotypes under T1 and T2 temperature conditions. Each data point represents an individual plant (replicate), all genotypes combined. Pearson correlation coefficient (r) and probability (p) are given in each sub-figure.
Plants 11 02174 g003
Figure 4. Relationship between instantaneous rate of transpiration (Tr) response to VPD (mean slope of instantaneous rate of Tr response to VPD regression) and leaf temperature (Tleaf) response to air temperature (Tair) (mean slope of Tleaf response to Tair regression) of 20 wheat genotypes (two batches combined). Each data point represents an individual genotype. The genotypes circled do not conform to the expected model of negative linear correlation between Tleaf (Tair) and instantaneous rate of Tr (VPD) slopes.
Plants 11 02174 g004
Table 1. Abaxial, adaxial, and total stomatal densities of 20 wheat genotypes in Batch 01 and 02 under ambient (T1) and high (T2) temperature regimes. Values presented are means ± SEM, n = 4.
Batch 01Batch 02
Genotype
(G)
Treatment
(T)
Stomatal Density
(Number of Stomata per mm−2)
Genotype
(G)
Treatment
(T)
Stomatal Density
(Number of Stomata per mm−2)
AbaxialAdaxialTotalAbaxialAdaxialTotal
ExcaliburT158.7 ± 1.759.1 ± 1.1117.9 ± 2.0DrysdaleT149.1 ± 1.461.1 ± 1.5110.2 ± 2.5
T271.2 ± 1.270.7 ± 5.2141.8 ± 6.3 T258.5 ± 1.167.0 ± 1.3125.5 ± 1.7
Glennson 81T152.5 ± 2.466.7 ± 3.5119.2 ± 1.3LongReach-EnvoyT160.7 ± 1.861.3 ± 2.6122.1 ± 2.4
T253.0 ± 3.579.2 ± 4.4132.2 ± 6.9 T263.7 ± 2.270.1 ± 2.5133.9 ± 2.4
Sonora 64T155.7 ± 2.864.0 ± 3.6119.7 ± 5.3HartogT157.7 ± 0.664.2 ± 1.7122.0 ± 1.3
T255.9 ± 2.563.0 ± 2.4118.9 ± 1.3 T266.9 ± 0.978.3 ± 1.6145.2 ± 2.4
DowneyT136.5 ± 2.446.8 ± 6.183.3 ± 8.3Glossy-HuguenotT171.9 ± 1.380.0 ± 1.0151.9 ± 2.1
T243.0 ± 1.052.5 ± 4.395.5 ± 5.0 T282.7 ± 3.383.1 ± 2.3165.9 ± 4.2
EinkornT166.0 ± 5.559.2 ± 2.3125.2 ± 7.7RAC 875T149.0 ± 5.862.2 ± 4.3111.2 ± 10.0
T280.5 ± 3.073.5 ± 4.9154.0 ± 7.6 T255.4 ± 1.266.9 ± 2.3122.2 ± 2.0
Ciano 67T151.3 ± 2.053.3 ± 2.2104.7 ± 4.1EspadaT147.9 ± 2.953.5 ± 2.4101.4 ± 4.1
T254.8 ± 3.256.5 ± 2.7111.3 ± 5.9 T257.5 ± 5.162.0 ± 6.1119.5 ± 11.2
Yecora 70T152.3 ± 4.170.2 ± 0.4122.5 ± 4.1MaceT150.0 ± 0.652.0 ± 0.3102.0 ± 0.7
T260.0 ± 2.563.2 ± 1.2123.2 ± 3.7 T257.9 ± 5.666.0 ± 1.8123.9 ± 6.5
MagentaT146.5 ± 3.260.0 ± 3.1106.5 ± 2.5GladiusT153.2 ± 1.965.9 ± 2.2119.1 ± 4.1
T253.1 ± 4.972.6 ± 3.7125.7 ± 8.1 T264.0 ± 4.274.2 ± 4.1138.2 ± 5.6
JanzT149.2 ± 2.156.2 ± 1.7105.5 ± 2.4KukriT154.5 ± 4.362.2 ± 1.6116.7 ± 5.4
T251.1 ± 3.867.0 ± 2.1118.1 ± 5.6 T254.5 ± 3.362.8 ± 2.1117.3 ± 5.2
Wyalkatchem T165.4 ± 1.455.6 ± 0.9121.0 ± 2.0Emu RockT161.9 ± 1.963.5 ± 1.5125.4 ± 1.5
T253.4 ± 1.265.0 ± 2.0118.4 ± 2.5 T263.4 ± 3.465.9 ± 3.7129.2 ± 5.3
WyalkatchemT159.4 ± 1.863.4 ± 4.5122.7 ± 5.8
(Reference)T260.5 ± 1.968.6 ± 3.6129.1 ± 5.1
p value:     G <0.001<0.001<0.001 <0.001<0.001<0.001
       T 0.008<0.001<0.001 <0.001<0.001<0.001
       G × T 0.0030.0560.037 0.5020.3090.392
LSD value:     G 6.0106.50810.194 5.9605.6699.861
       T 2.6552.8754.503 2.5392.4154.200
       G × T 8.540NS14.486 NSNSNS
Table 2. Green leaf area, shoot dry weight, and specific leaf weight of 20 wheat genotypes in Batch 01 and Batch 02 under ambient (T1) and high (T2) temperature regimes. Values presented are means ± SEM, n = 4.
Batch 01Batch 02
Genotype
(G)
Treatment
(T)
Green Leaf Area
(m2 plant−1)
Shoot Dry
Weight
(g plant−1)
Specific Leaf
Weight
(g m−2)
Genotype
(G)
Treatment
(T)
Green Leaf Area
(m2 plant−1)
Shoot Dry
Weight
(g plant−1)
Specific Leaf
Weight
(g m−2)
ExcaliburT10.14 ± 0.0313.9 ± 1.942.7 ± 1.3DrysdaleT10.08 ± 0.0019.3 ± 0.652.5 ± 1.0
T20.07 ± 0.0111.7 ± 0.449.6 ± 0.8 T20.03 ± 0.0015.0 ± 0.551.4 ± 2.2
Glennson 81T10.17 ± 0.0115.3 ± 1.646.8 ± 1.8LongReach-EnvoyT10.14 ± 0.0112.5 ± 1.245.9 ± 2.2
T20.07 ± 0.0110.6 ± 0.651.9 ± 1.4 T20.05 ± 0.0012.0 ± 1.357.9 ± 2.7
Sonora 64T10.09 ± 0.0014.6 ± 0.749.3 ± 1.9HartogT10.07 ± 0.0114.3 ± 1.650.0 ± 1.5
T20.06 ± 0.0012.7 ± 0.647.9 ± 0.8 T20.02 ± 0.009.5 ± 1.751.6 ± 1.1
DowneyT10.24 ± 0.0212.7 ± 1.034.7 ± 3.1Glossy-HuguenotT10.11 ± 0.0019.5 ± 1.356.7 ± 2.6
T20.23 ± 0.0110.8 ± 0.539.2 ± 2.8 T20.06 ± 0.0014.0 ± 0.757.0 ± 1.1
EinkornT10.20 ± 0.00 8.1 ± 0.531.6 ± 2.2RAC 875T10.10 ± 0.0020.6 ± 1.254.6 ± 1.7
T20.12 ± 0.00 7.2 ± 0.240.8 ± 1.7 T20.05 ± 0.0015.4 ± 0.357.3 ± 1.8
Ciano 67T10.09 ± 0.0016.9 ± 0.746.2 ± 0.6EspadaT10.10 ± 0.0019.3 ± 2.355.1 ± 2.1
T20.04 ± 0.0012.0 ± 0.345.8 ± 0.9 T20.05 ± 0.0017.0 ± 0.755.8 ± 1.6
Yecora 70T10.12 ± 0.0115.9 ± 0.445.4 ± 2.7MaceT10.08 ± 0.0116.4 ± 2.151.1 ± 0.7
T20.05 ± 0.0011.7 ± 0.343.9 ± 1.4 T20.04 ± 0.0012.3 ± 1.256.3 ± 1.2
MagentaT10.18 ± 0.0016.9 ± 1.245.1 ± 2.5GladiusT10.08 ± 0.0112.8 ± 1.551.5 ± 1.2
T20.07 ± 0.0112.5 ± 0.444.6 ± 1.4 T20.04 ± 0.0013.0 ± 2.250.2 ± 4.1
JanzT10.16 ± 0.0116.2 ± 1.247.6 ± 1.7KukriT10.08 ± 0.0116.1 ± 2.749.3 ± 1.8
T20.08 ± 0.0113.1 ± 0.644.2 ± 2.1 T20.03 ± 0.008.9 ± 1.252.4 ± 0.5
Wyalkatchem T10.15 ± 0.0213.2 ± 0.540.4 ± 0.6Emu RockT10.05 ± 0.0111.9 ± 2.249.7 ± 1.2
T20.08 ± 0.0111.5 ± 0.344.3 ± 4.8 T20.03 ± 0.0011.6 ± 2.051.9 ± 0.5
Wyalkatchem T10.07 ± 0.0111.2 ± 1.345.9 ± 2.1
(reference)T20.04 ± 0.0110.9 ± 1.956.0 ± 2.9
p value:     G <0.001<0.001<0.001 <0.001<0.0010.004
       T <0.001<0.0010.019 <0.001<0.0010.000
       G × T 0.0030.1390.048 0.0060.2410.012
LSD value:     G 0.0231.6624.154 0.0133.1523.835
       T 0.0100.7431.858 0.0051.3441.635
       G × T 0.032NS5.874 0.018NS5.424
Table 3. Root dry weight and shoot:root ratios of 10 wheat genotypes in Batch 02 under ambient (T1) and high (T2) temperature regimes. Values presented are means ± SEM, n = 4.
Genotype
(G)
Treatment
(T)
Root Dry Weight
(g plant−1)
Shoot:Root
Ratio
DrysdaleT12.2 ± 0.38.9 ± 1.0
T20.9 ± 0.015.9 ± 0.5
LongReach-EnvoyT12.0 ± 0.26.2 ± 0.5
T21.1 ± 0.110.6 ± 0.2
HartogT11.7 ± 0.18.6 ± 0.8
T20.5 ± 0.118.2 ± 0.7
Glossy-HuguenotT13.1 ± 0.26.4 ± 0.5
T22.1 ± 0.26.8 ± 0.5
RAC 875T12.1 ± 0.210.0 ± 0.8
T21.3 ± 0.112.4 ± 0.7
EspadaT12.3 ± 0.48.5 ± 0.5
T21.5 ± 0.211.4 ± 1.1
MaceT11.5 ± 0.210.8 ± 1.1
T20.9 ± 0.113.8 ± 0.4
GladiusT11.7 ± 0.37.8 ± 0.8
T21.3 ± 0.210.2 ± 0.9
KukriT11.6 ± 0.310.5 ± 0.5
T20.6 ± 0.115.4 ± 1.6
Emu RockT11.1 ± 0.312.3 ± 1.7
T20.9 ± 0.113.3 ± 1.5
Wyalkatchem T11.6 ± 0.58.2 ± 1.4
T20.9 ± 0.212.5 ± 1.5
p value:     G <0.001<0.001
       T <0.001<0.001
       G × T 0.540<0.001
LSD value:     G 0.4621.946
       T 0.1970.830
       G × T NS2.752
Table 4. Summary of the fixed effects of the linear mixed model used to evaluate the effect of total water use per plant and leaf-to-air temperature differential (Tair–Tleaf) on biomass reduction% under high temperature conditions (T2).
Degrees of Freedom (df)Sum of SquaresWald StatisticPr (Chisq)
(Intercept)12419791.640<0.0001
(Tair–Tleaf)1160.0610.806
Total water use per plant11152443.644<0.0001
(Tair–Tleaf) × genotype191227346.4820.0004
Total water use × genotype191346751.003<0.0001
Residual (Mean Square)<0.0001
Table 5. Parameters of linear regression models for the relationship between leaf temperature (Tleaf) and air temperature (Tair) in 20 wheat genotypes. Data are means ± SEM for the best-fit values and the goodness of fits of the regressions.
GenotypeSlope
(°C °C−1)
Tleaf–Intercept
(°C)
R2p
Einkorn0.49 ± 0.1513.73 ± 4.550.450.008
RAC 8750.57 ± 0.1212.44 ± 3.240.600.0002
Excalibur0.57 ± 0.1210.58 ± 3.360.630.0003
Espada0.58 ± 0.1412.57 ± 3.970.530.001
LongReach-Envoy0.62 ± 0.1412.57 ± 3.840.590.001
Emu Rock0.64 ± 0.1711.35 ± 4.840.490.002
Kukri0.65 ± 0.1611.15 ± 4.480.530.001
Wyalkatchem (Batch 02)0.67 ± 0.1310.01 ± 3.720.650.0001
Mace 0.69 ± 0.169.50 ± 4.400.560.001
Glossy-Huguenot0.68 ± 0.129.90 ± 3.510.65<0.0001
Gladius0.74 ± 0.138.48 ± 3.680.69<0.0001
Hartog0.78 ± 0.137.51 ± 3.540.72<0.0001
Drysdale0.80 ± 0.146.68 ± 4.010.68<0.0001
Downey0.81 ± 0.134.96 ± 3.720.74<0.0001
Wyalkatchem (Batch 01)0.81 ± 0.133.53 ± 3.850.790.0001
Yecora 700.87 ± 0.191.64 ± 5.600.610.001
Glennson 810.89 ± 0.080.81 ± 2.260.92<0.0001
Ciano 670.91 ± 0.191.26 ± 5.420.640.0004
Magenta0.92 ± 0.120.34 ± 3.530.81<0.0001
Sonora 640.93 ± 0.180.75 ± 5.260.710.0003
Janz1.02 ± 0.14−2.01 ± 4.140.80<0.0001
Table 6. Morpho-physiological criteria used for the selection of wheat genotypes.
Batch NoCharacter of InterestStatusGenotypeReference
1Canopy
Temperature
Depression
HighGlennson 81[54]
LowSonora 64[54]
Transpiration rate
or stomatal
conductance (gs)
HighExcalibur[88]
PubescencePubescentDowny[89]
GlabrousEinkorn * [90]
Leaf angleErectophileCiano 67[91]
PlanophileYecora 70[91]
Early vigourHighMagenta[92]
LowJanz[93,94,95]
Adaptability to Western Australian
conditions
HighWyalkatchem[96]
Dr. D. Mullan, InterGrain, pers. Comm.
2Carbon Isotope Discrimination (CID)
or Transpiration
Efficiency (TE)
Low CID or
High TE
Drysdale
LongReach-Envoy
[97]; Dr. D. Mullan, InterGrain, pers. Comm.; Dr. G. Rebetzke, CSIRO, pers. Comm.
Dr. B. Jacobs, LongReach Plant Breeders, pers. Comm.
High CID or
Low TE
Hartog[97]
Glaucousness
(waxiness)
Non–glaucous Glossy–Huguenot **[98]
Glaucous (high)RAC 875, Espada[85,99]
Grain sizeHighEmu Rock[100]
Drought adaptabilityDrought-tolerantMace
Gladius
[101]
[102];
Dr. D. Mullan, InterGrain, pers. Comm.
Drought-susceptibleKukri[88,103]
Adaptability to Western Australian conditionsHighWyalkatchem
(reference for comparisons)
[96];
Dr. D. Mullan, InterGrain, pers. Comm.
* T. monococcum, ** T. turgidum.
Publisher’s Note: MDPI stays neutral with regard to jurisdictional claims in published maps and institutional affiliations.

