Article

LC/MS Profiling and Gold Nanoparticle Formulation of Major Metabolites from Origanum majorana as Antibacterial and Antioxidant Potentialities

by
Ahmed H. El-Ghorab
1,†,
Fathy A. Behery
2,3,†,
Mohamed A. Abdelgawad
4,*,
Ibrahim Hotan Alsohaimi
1,
Arafa Musa
5,
Ehab M. Mostafa
5,
Hamud A. Altaleb
6,
Ibrahim O. Althobaiti
7,
Mohamed Hamza
8,
Mohammed H. Elkomy
9,
Ahmed A. Hamed
10,
Ahmed M. Sayed
11,
Hossam M. Hassan
12 and
Mahmoud A. Aboseada
11,*
1
Department of Chemistry, College of Science, Jouf University, Sakaka 72341, Saudi Arabia
2
Department of Pharmacognosy, Faculty of Pharmacy, Mansoura University, Mansoura 35516, Egypt
3
Department of Pharmacy, College of Pharmacy, Riyadh Elm University, Riyadh 11681, Saudi Arabia
4
Department of Pharmaceutical Chemistry, College of Pharmacy, Jouf University, Sakaka 72341, Saudi Arabia
5
Department of Pharmacognosy, College of Pharmacy, Jouf University, Sakaka 72341, Saudi Arabia
6
Department of Chemistry, Faculty of Science, Islamic University of Madinah, Madinah 41477, Saudi Arabia
7
Department of Chemistry, College of Science and Arts, Jouf University, Sakaka 72341, Saudi Arabia
8
Department of Biology, College of Science, Jouf University, Sakaka 72341, Saudi Arabia
9
Department of Pharmaceutics, College of Pharmacy, Jouf University, Sakaka 72341, Saudi Arabia
10
National Research Centre, Microbial Chemistry Department, 33 El-Buhouth Street, Dokki, Giza 12622, Egypt
11
Department of Pharmacognosy, Faculty of Pharmacy, Nahda University, Beni-Suef 62513, Egypt
12
Department of Pharmacognosy, Faculty of Pharmacy, Beni-Suef University, Beni-Suef 62513, Egypt
*
Authors to whom correspondence should be addressed.
These authors contributed equally to this work.
Plants 2022, 11(14), 1871; https://doi.org/10.3390/plants11141871
Submission received: 12 May 2022 / Revised: 28 June 2022 / Accepted: 4 July 2022 / Published: 18 July 2022

Abstract

:
Origanum majoranum L. is a Lamiaceae medicinal plant with culinary and ethnomedical applications. Its biological and phytochemical profiles have been extensively researched. Accordingly, this study aimed to investigate the chemical composition and the antibacterial and antioxidant properties of O. majoranum high features, as well as to search for techniques for activity optimization. A metabolomics study of the crude extract of O. majoranum using liquid chromatography-high-resolution electrospray ionization mass spectrometry (LC ± HR ± ESI ± MS) was conducted. Five fractions (petroleum ether, dichloromethane, ethyl acetate, n-butanol, and aqueous) were derived from the total extract of the aerial parts. Different chromatographic methods and NMR analysis were utilized to purify and identify the isolated phenolics (high features). Moreover, the antimicrobial, antibiofilm, and antioxidant activity of phenolics were performed. Results showed that metabolomic profiling of the crude extract of O. majoranum aerial parts revealed the presence of a variety of phytochemicals, predominantly phenolics, resulting in the isolation and identification of seven high-feature compounds comprising two phenolic acids, rosmarinic and caffeic acids, one phenolic diterpene, 7-methoxyepirosmanol, in addition to four flavonoids, quercetin, hesperitin, hesperidin, and luteolin. On the other hand, 7-methoxyepirosmanol (OM1) displayed the most antimicrobial and antioxidant potential. Such a phenolic principal activity improvement seems to be established after loading on gold nanoparticles.

1. Introduction

Origanum is one of 200 genera of the Lamiaceae family, containing 3500 species worldwide. The vast majority of species are fragrant and grow naturally in the Mediterranean region [1,2,3,4]. The genus is characterized by large morphological and chemical diversity. The morphological differences within the genus result in dividing the genus into 10 divisions, each including 49 taxa (species, sub-species, and varieties) [5,6,7]. Origanum majoranum L., also known as Majorana hortensis Moench, is a tender perennial herb in the genus “Origanum” [8]. It is sometimes referred to as sweet marjoram and is endemic to Cyperus, Antolia (Turkey), and has been naturalized in sections of the Mediterranean region, particularly Egypt [9]. It is grown for its flavor and aroma throughout the world, including in India, France, Hungary, and the United States. Marjoram was initially used as an antiseptic by Hippocrates. It is a popular home remedy for chest infections, sore throat, cough, rheumatoid arthritis, mental disorders, epilepsy, cardiovascular diseases, sleeplessness, skincare, flatulence, and stomach problems. [10,11,12]. Pharmacologically, marjoram was evaluated for its antioxidant, anti-anxiety, anti-convulsant, anti-diabetic, anti-gout, anti-mutagenic, anti-ulcer, antibacterial, antifungal, and antiprotozoal activities [13,14,15,16,17]. Sweet marjoram has a pungent, spicy, and pleasant aroma and flavor. Analysis of the essential oil reported volatile constituents as major metabolites, predominantly terpinen-4-ol, cis-sabinene hydrate, p-cymene, sabinene, and trans-sabinene hydrate [4,18]. Various phytochemical tests on ethanolic extracts revealed the presence of terpenoids such as oleanolic acid and ursolic acid [8,19], flavonoids, namely apigenin, arbutin, catechin, rutin, hesperidin, and amentoflavone, phenolic acids, such as rosmarininc acid, caffeic acid, and coumaric acid, and tannins such as gallic acid [20,21,22].
In natural product research, dereplication has been widespread, allowing for rapidly identifying known metabolites in complex combinations. [23,24]. It is significantly easier to screen samples for known natural chemicals with LC-MS dereplication and subsequent database searches, such as Reaxys online database and the Dictionary of Natural Products (DNP) on DVD [25,26]. It reduces the likelihood of re-isolation redundancy in natural product discovery methods and saves time. Metabolomics also thoroughly examines chemicals in a biological system under a specific set of conditions [27]. The metabolome is most intimately related to the phenotype at the molecular level, providing insight into biological activities [28].
This study intends to investigate the chemical and biological profiles of the plant as mentioned above as part of our ongoing research on it. In this approach, the secondary metabolites of Origanum majoranum will be initially assessed and dereplicated utilizing metabolomic analysis via liquid chromatography combined with high-resolution electrospray ionization mass spectrometry (LC-HRESIMS). Subsequently, we assess datasets for correlations between its previously reported antioxidant, antibacterial, and anti-biofilm efficacy, and the related chemical profile, as well as purification of its high features. Afterwards, in vitro activities will be investigated to identify the most promising metabolite(s) and how to optimize their efficacy via nanotechnology.

2. Results

2.1. Chemical Diversity of Natural Products in OM Extract

The mass resolution in this current study was 50,000 (atm/z 400), which is sufficient to differentiate closely related metabolites. The total number of features found by LC-HRMS in OM extract is documented in Table 1 and Figure S1. The extract with the greatest number of features identified is documented in Table 2 and Figure 1.

2.2. Dereplication of OM Extract

In a target-based functional assay, crude hydromethanolic extracts of OM were active as antimicrobials and antioxidants [29,30]. Most of the metabolites from the OM extract were putatively assigned as polyphenolics (Table 1, Figure 1 and Figure S1). Furthermore, several of those were identified as flavonoids, such as hesperitin, apigenin, rutin, and quercetin, which were previously reported in OM [30]. In addition, phenolic acids such as rosmarinic acid, caffeic acid, and ferulic acid [20], and triterpenes such as oleanolic acid and ursolic acid [31], were detected as plausible congeners (Table 1).

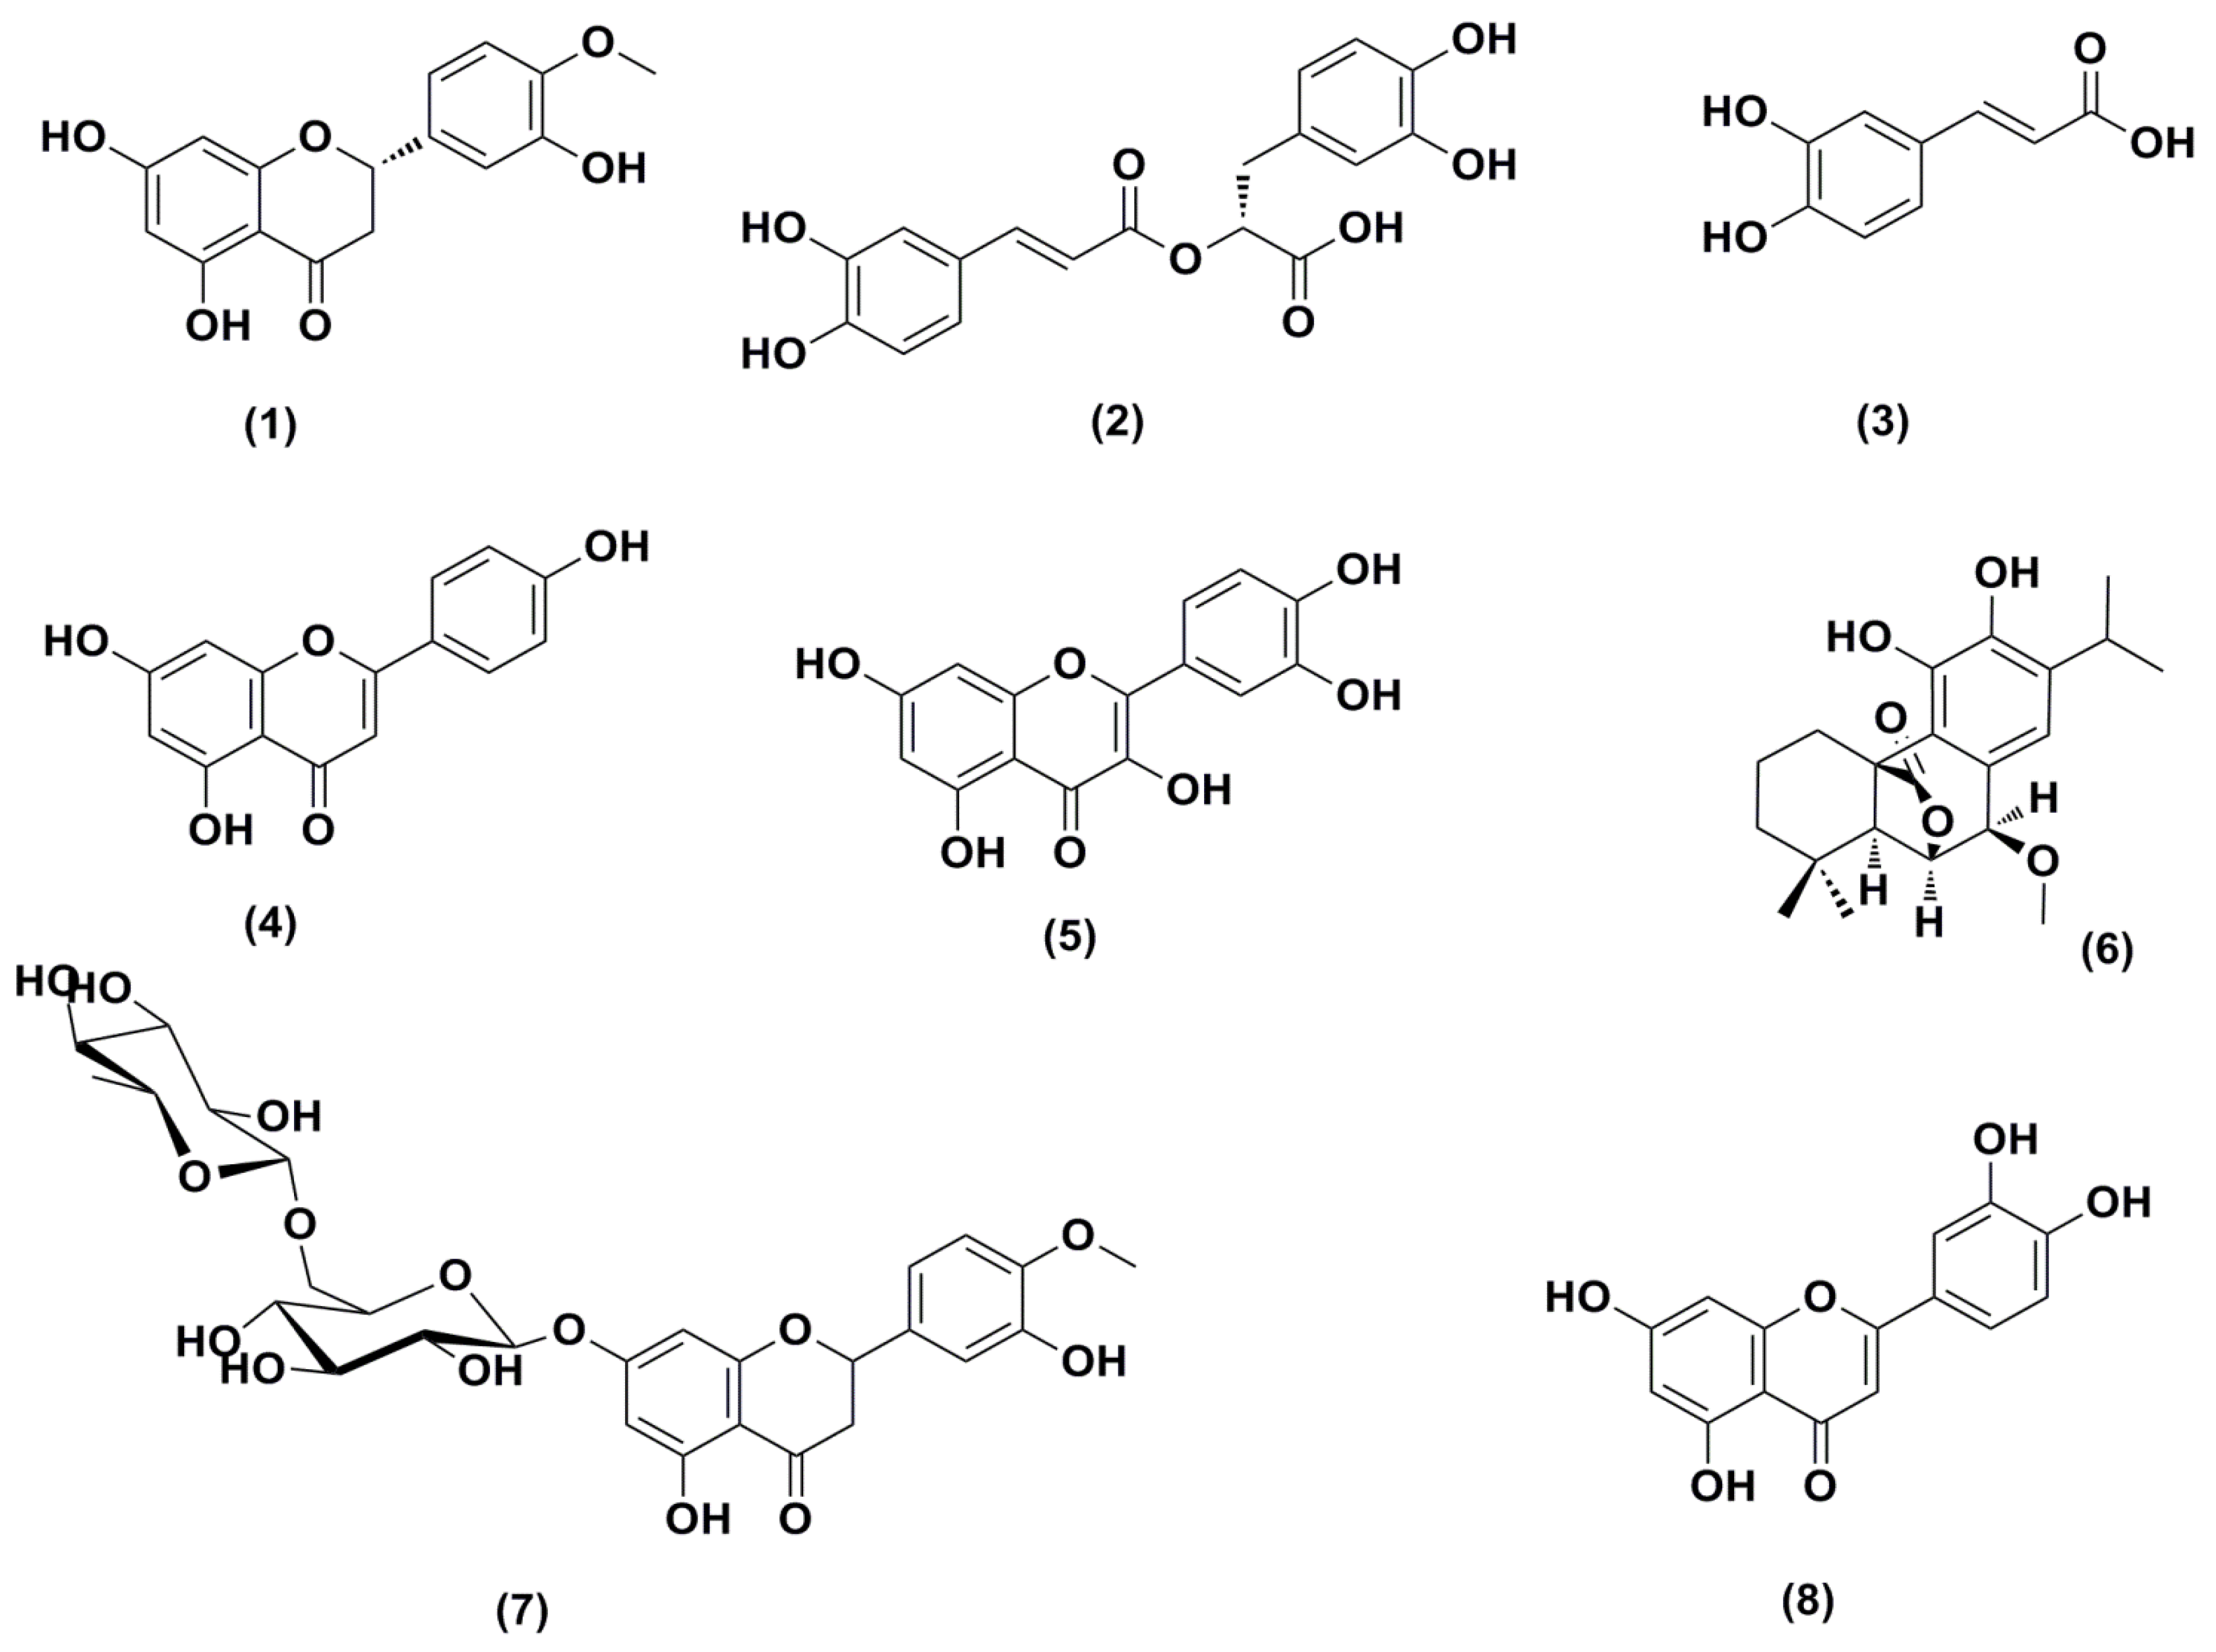
2.3. Identification of Purified Metabolites

All physical characteristics and 1H and 13C NMR spectral analysis of purified metabolites are represented in Section S2 of the “Supplementary Material File”.

2.4. Biological Evaluation of Purified Compounds

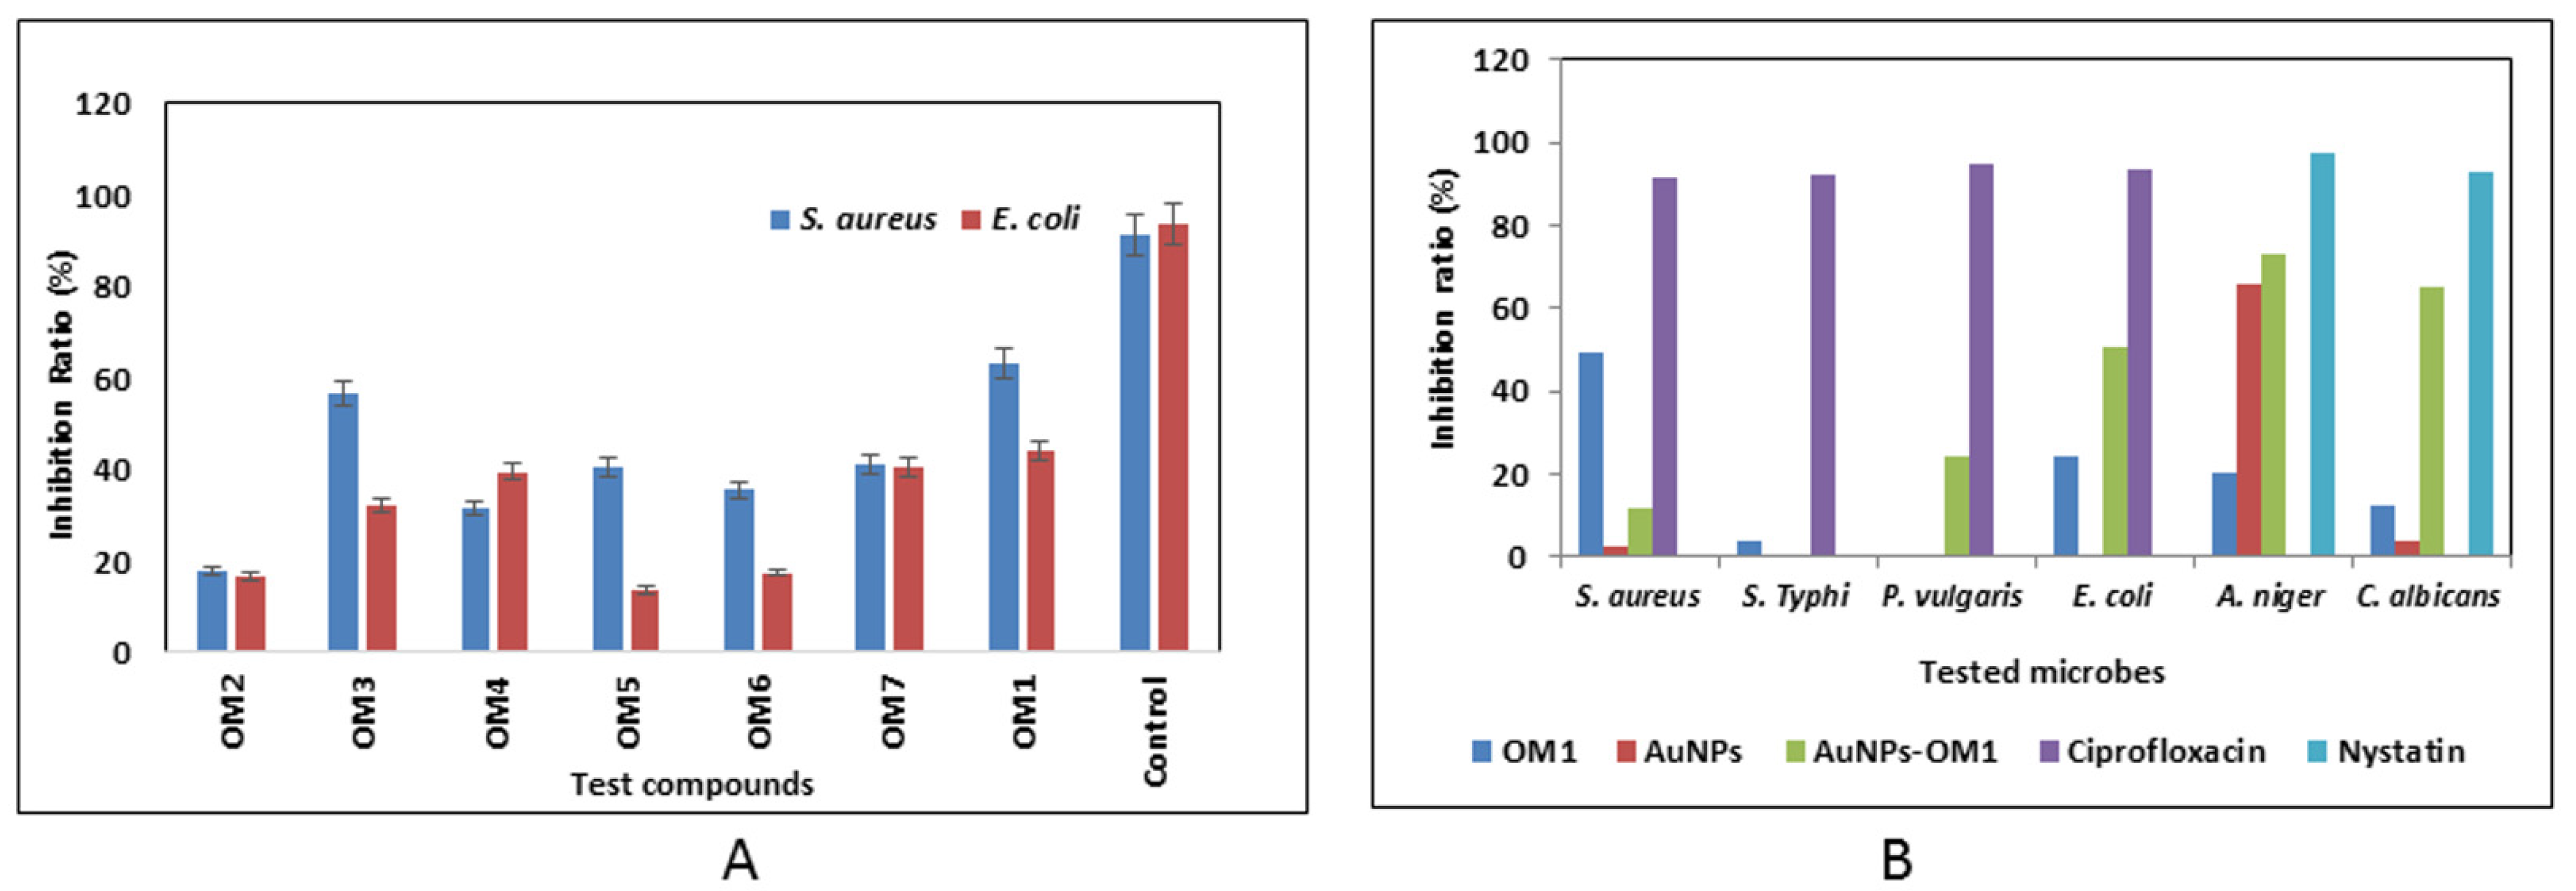
2.4.1. Antimicrobial Activity

The O. majoranum purified metabolites (high features) were investigated against E. coli and S. aureus using the MTP assay. Results showed that all purified metabolites displayed low to moderate antimicrobial properties against all tested bacteria, with inhibition ratios ranging from 13.720% to 63.160%. In addition, compound OM1 exhibited the highest antibacterial activity with an inhibition ratio of 63.160%. To compare the inhibitory effects of OM1 and AuNPs-OM1 on the growth of microbes, different bacterial and fungal species were tested. The OM1 compound exhibited low to moderate antimicrobial activity toward all tested bacterial and fungal strains, with inhibition ratios ranging from 12.512% and 49.377%. Additionally, the antibacterial activity of OM1 was elevated after loading on gold nanoparticles (AuNPs), which caused the increase in the inhibition ratios against P. vulgaris and E. coli to be 24.419% and 50.658%, respectively. Moreover, AuNPs-OM1 exhibited better inhibitory activity against A. niger and C. albicans fungal strains than OM1, individually with inhibition ratios of 73.150% and 65.200%, respectively (Figure 2).

2.4.2. Biofilm Inhibitory Percentage (%) of OM1 and AgNPs-OM1

Biofilm inhibition activity was examined using microtiter plates. The biofilm inhibition efficiency of the substances OM1 and AuNPs-OM1 was studied against four clinical pathogenic bacteria (S. aureus, E. coli, B. subtilis, and P. aeruginosa), and the biofilms of each of these bacteria were compared to the control (untreated biofilms). In preliminary antibiofilm experiments, the phenolic OM1 demonstrated limited antibiofilm activity against all tested bacteria with biofilm inhibitory activity up to 10.552%. Additionally, the AuNPs-OM1 reduced the biofilm formation of all strains, especially E. coli, by 30.02% (see Table 3).

2.4.3. Antioxidant Activity of the Purified Compounds and AuNPs-OM1

The absorbance value at 517 nm shows that compound OM1 has the highest DPPH scavenging activity (IC50 = 2.41 µg). In contrast, the lowest DPPH depletion was found in the OM5, revealing a low antioxidant “power” of this compound. The other phenolics, namely quercetin, rosmarinic acid, caffeic acid, luteolin, and hesperidin, showed similar scavenging activities to OM1, ranging from 65.63% to 89.38%. The AuNPs-OM1 did not potentiate the antioxidant activity of OM1 compared to antimicrobial and antibiofilm activities (scavenging activity = 55.50%) (see Table 4; Table 5).

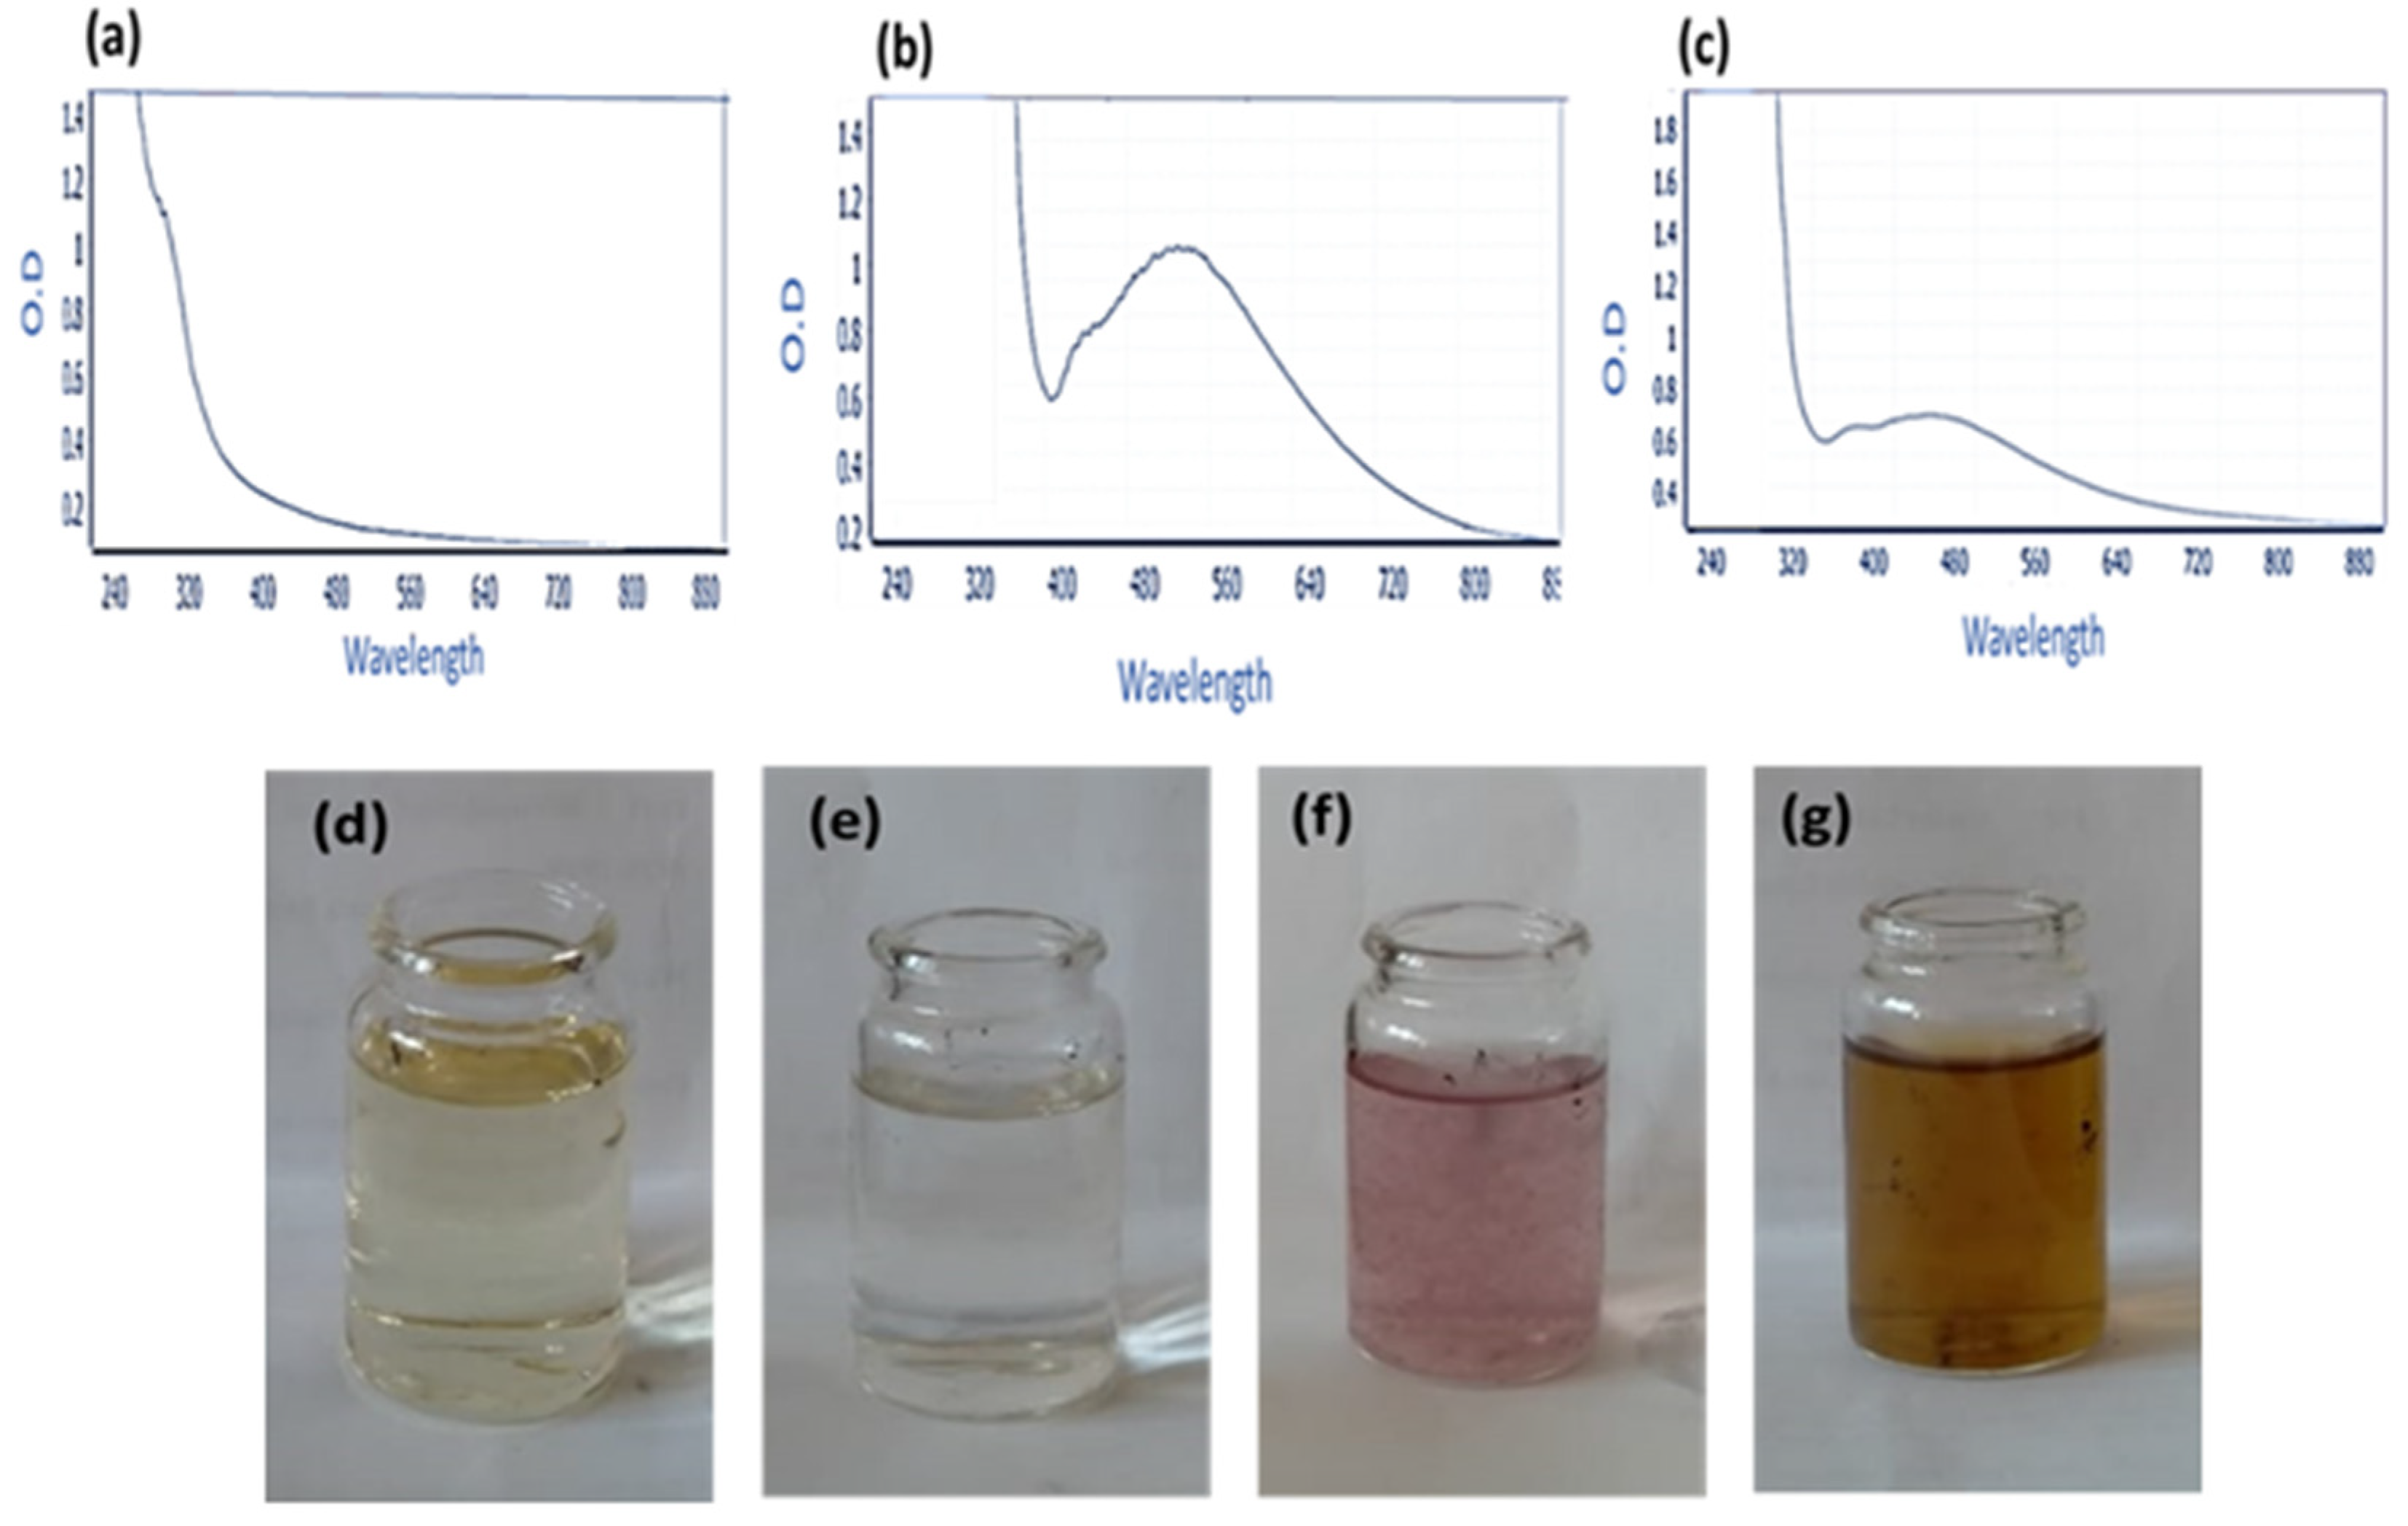
2.5. Gold Nanoparticles’ Preparation and Conjugation with Compound OM1

Based on the obtained antimicrobial, antibiofilm, and antioxidant activity, the compound OM1 was selected for loading on gold nanoparticles. Gold nanoparticles (AuNPs) were synthesized utilizing GSH in this study. Creating a covalent bond between the cysteine thiolate of GSH and the gold nanoparticles’ surface in the HAuCl4.3H2O mediates the synthesis. This interaction caused AuNPs to cluster together on GSH molecules, and the addition of NaBH4 at pH 8 resulted in the production of ruby-red AuNPs. The prepared AuNPs using GSH and NaBH4 exhibited a characteristic surface plasmon band (SPR) at 520 nm, and the surface plasmon resonance (SPR) absorption spectral range was from 385 to 540 nm. On the other hand, the plasmon band of the conjugate was also measured (Figure 3). These findings were consistent with Sulaiman et al.’s earlier research [32]. The conjugation process between compound OM1 and AuNPs was conducted at pH 5. The surface plasmon of the compound OM1 alone was measured, and no characteristic surface plasmon bands were measured (Figure 3).

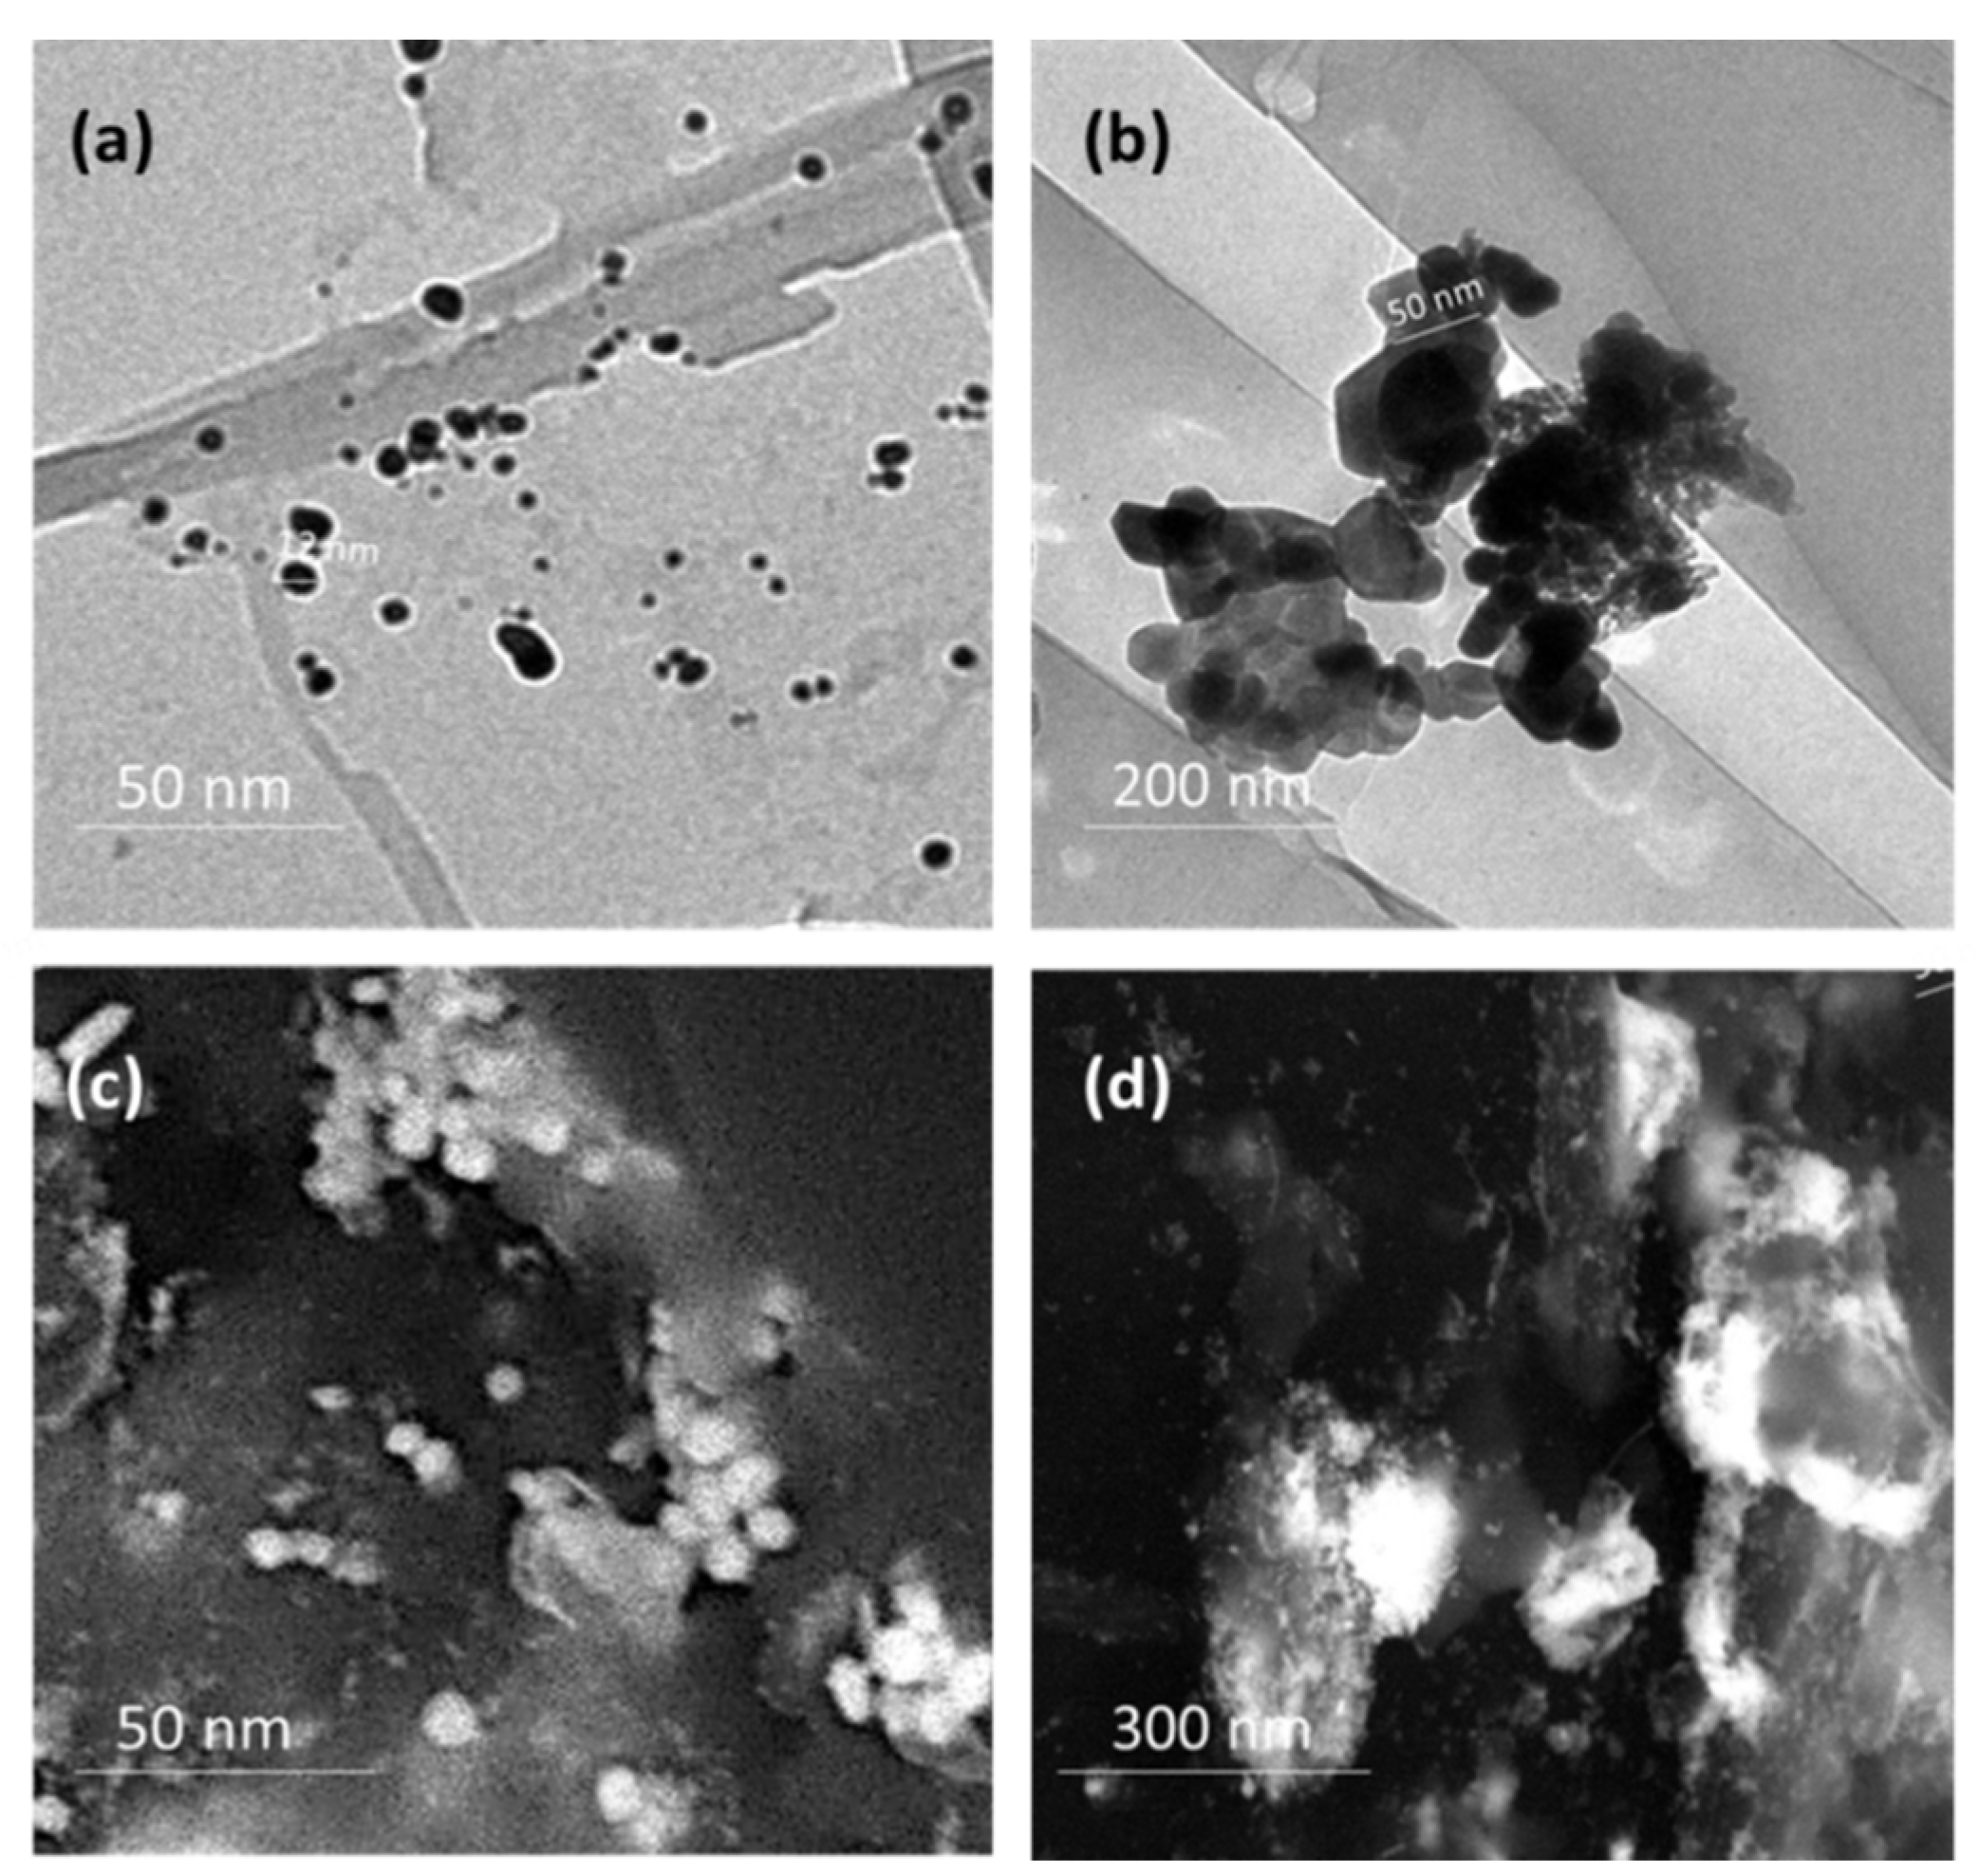
2.6. Electron Microscopy

The synthesized AuNPs and AuNPs-OM1 conjugate morphology and size were investigated using transmission electron microscopy (TEM) and field emission scanning electron microscopy (FESEM). According to the TEM micrograph, the produced AuNPs had an average particle size of approximately 5.02 to 30.20 ± 25 nm, with a spherical shape (Figure 4).

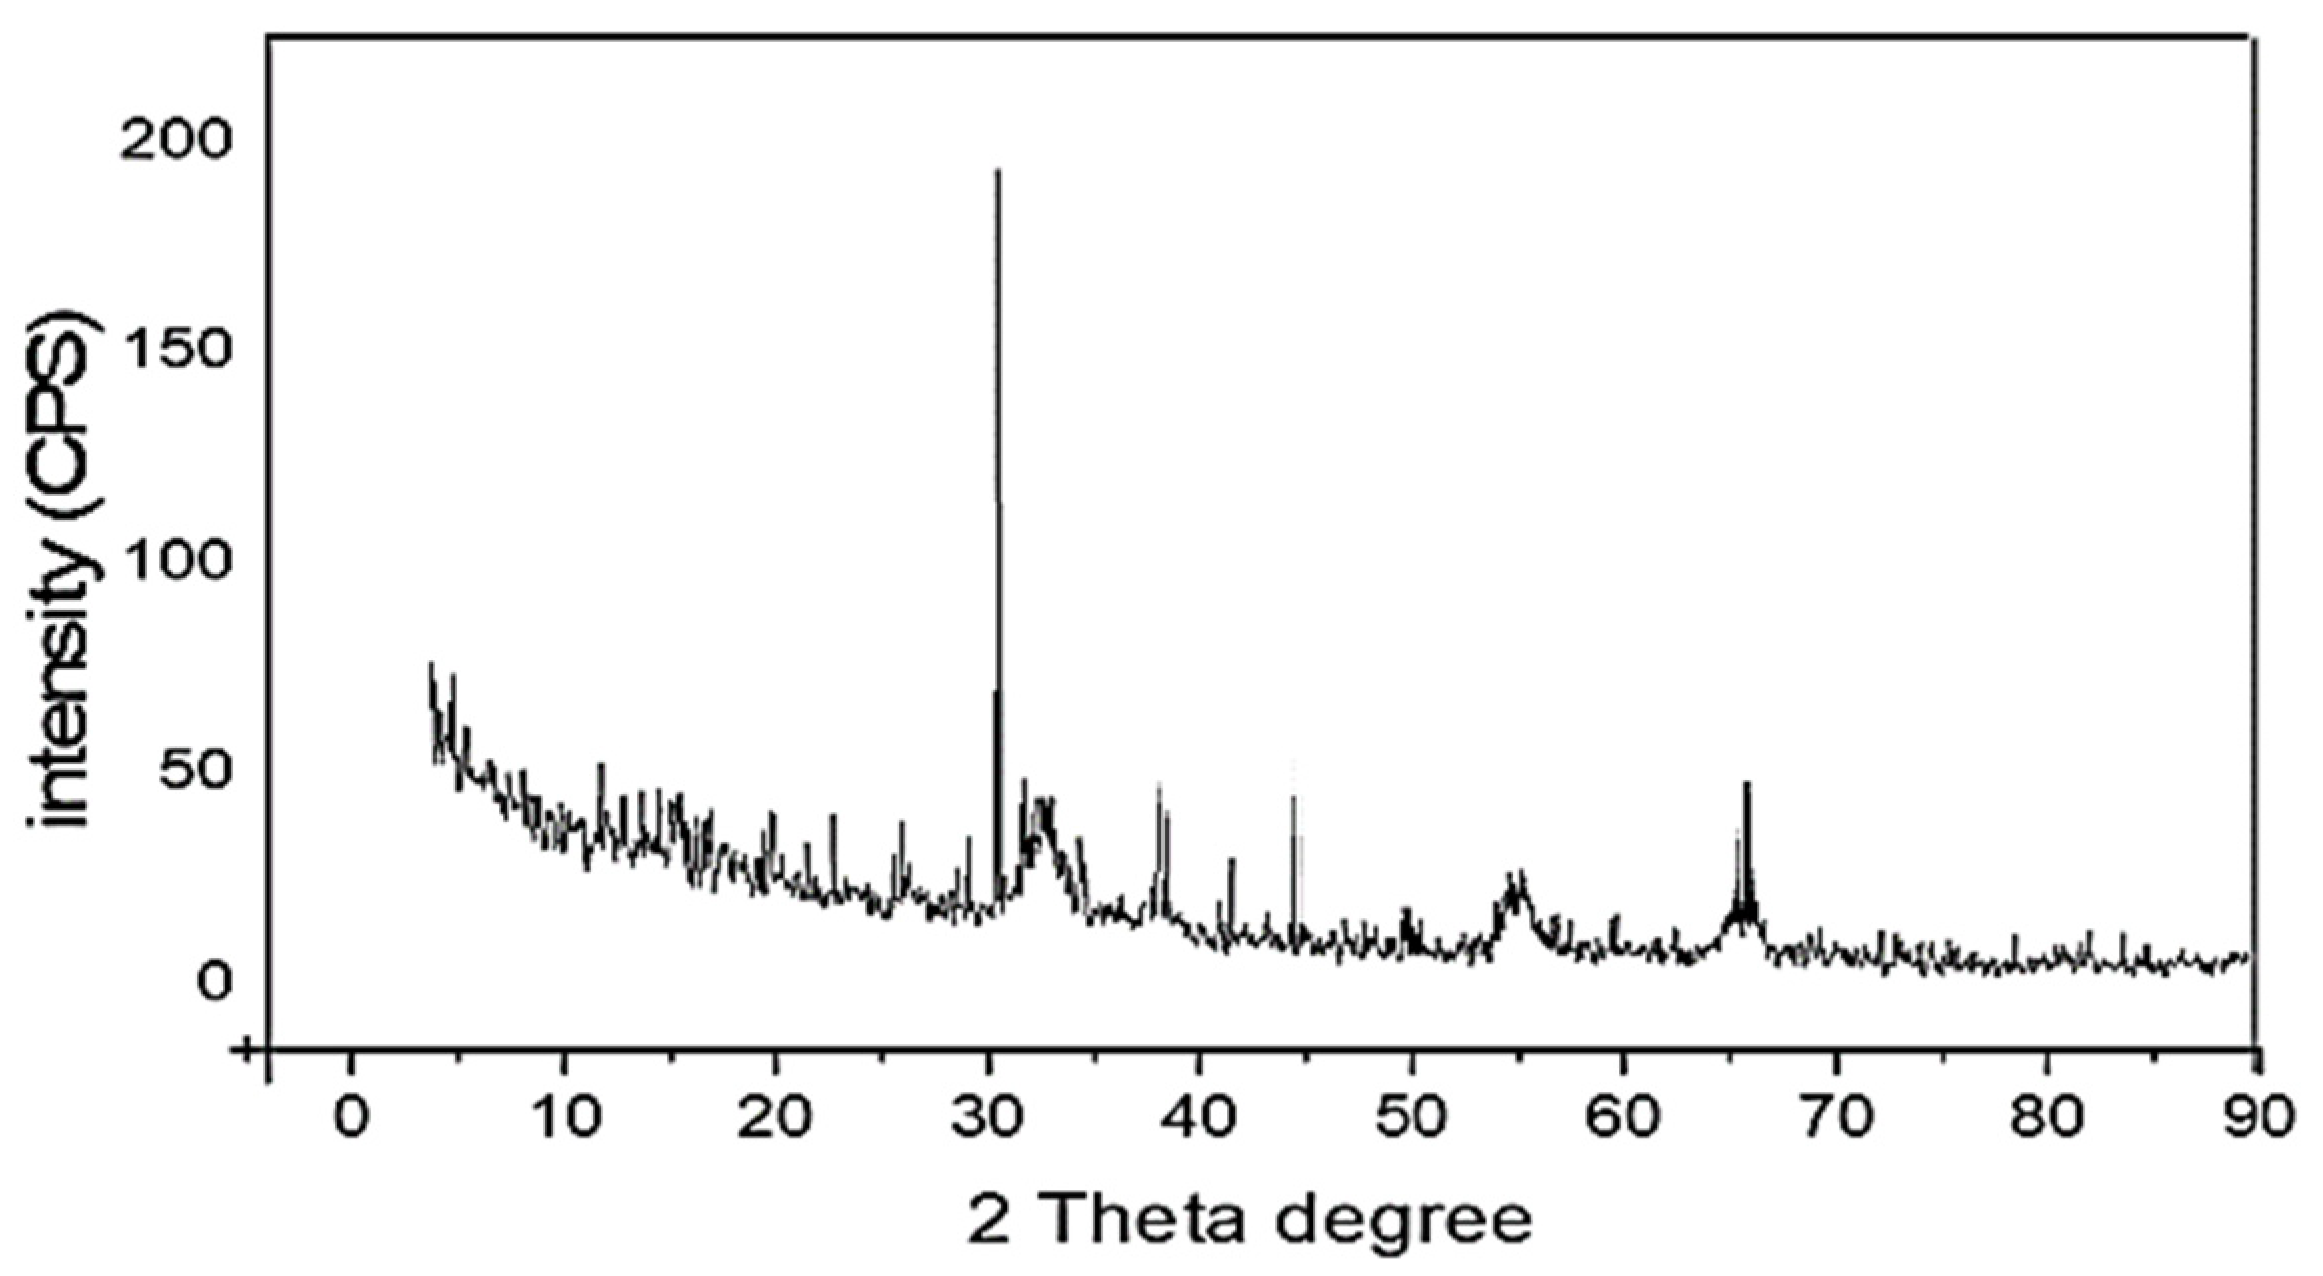
2.7. XRD of the Prepared AuNPs

XRD is considered the most important technique to study the structural properties of the prepared nanomaterials. Therefore, the prepared AuNPs were examined via the XRD diffraction pattern. Figure 5 represents the XRD result of Au nanoparticles. The prepared AuNPs attained in the existence of AuCl4- analogous diffraction peaks are assigned to the metallic Au phase with the most essential characteristic peaks, which appeared at 38.0°, 44.2°, and 64.1°, accredited to the crystallographic planes (1 1 1), (2 0 0), and (2 2 0), respectively.

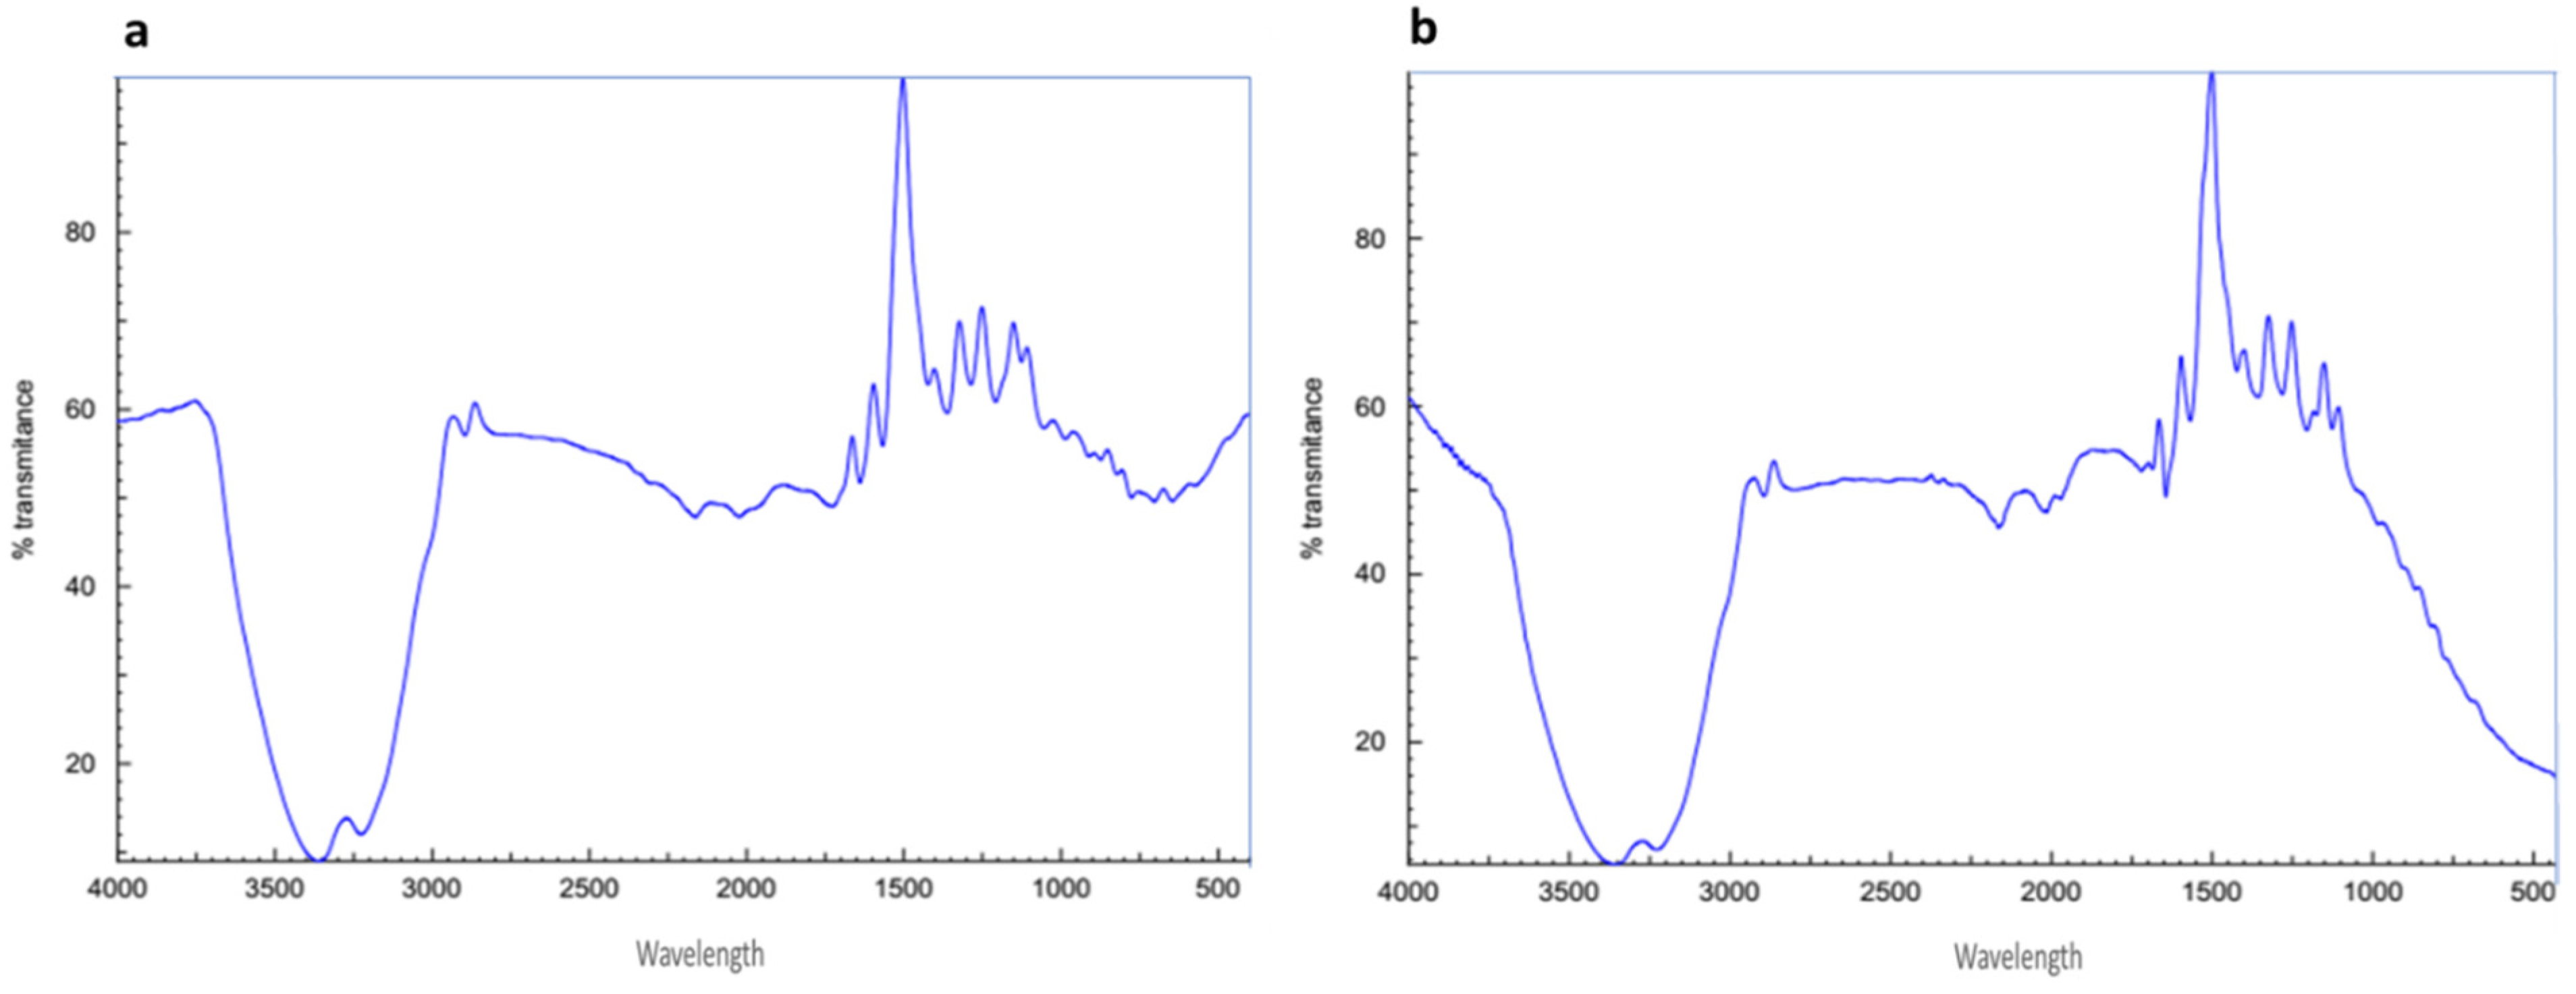
2.8. Fourier Transform Infrared Spectroscopy Analysis (FTIR)

For the characterization of functional groups presenting AuNPs and AuNPs-OM1, FTIR analysis is required. The FTIR spectra of the compound alone, OM1, and AuNPs-OM1 were recorded in the spectral region of 4000–400 cm−1 and are exhibited in Figure 6.

3. Discussion

The topic of oxidative stress and its control by antioxidants is receiving more attention than ever. In nutrition, many consumers and healthcare practitioners closely examine the antioxidant content of typical diet components [33]. The phenolic structure of polyphenols determines their antioxidant activity, and those with catechol-like moieties and the ability to delocalize unpaired electrons have the highest activity. Given the significance of oxidation in several disease pathways and the high antioxidant activity of numerous phenolic compounds in vitro, it was logical to believe that antioxidant activity explained the association between dietary polyphenols and disease prevention [34]. On the other hand, there has been an increase in interest in discovering and producing novel antimicrobial compounds from a variety of sources to address microbial resistance in recent years. Therefore, antimicrobial activity screening and evaluation methodologies have received more attention [35]. Polyphenols found in vegetables and medicinal plants have been studied extensively for their antibacterial action against a variety of pathogens [36].
The in vitro microbicidal activity of the alcoholic extracts of Origanum majorana L. was previously tested against diverse fungi such as Aspergillus niger, Fusarium solani, Candida albicans, and A. parasiticus, and different bacteria such as Bacillus subtilis, B. megaterium, Escherichia coli, and Proteus vulgaris, as well as in vitro antioxidant activity against reactive oxygen species was evaluated. As a result, both antimicrobial and antioxidant assays suggested that the alcoholic extract of O. majorana can be used as an effective herbal protectant against different pathogenic bacteria and fungi and has a powerful antioxidant capacity toward various free radicals [29,30,37,38,39,40].
To establish a reason for this result, metabolomics utilizing LC-HRMS and dereplication of O. majorana extract were performed to identify various compounds and understand the leading causes of the previously reported antimicrobial and antioxidant potential. According to metabolomics and dereplication, it was clear that O. majorana extract possesses a high chemical diversity. In particular, there were eight phenolic compounds identified as high features (high intensity), namely 7-methoxyepirosmanol, rosmarinic acid, quercetin, caffeic acid, hesperitin, luteolin, apigenin, and hesperidin. Most of these metabolites were previously reported in O. majorana alcoholic extracts [30,35]. An extensive search of these metabolites concerning their antimicrobial and antioxidant activities revealed that they displayed low to moderate effects against various bacterial and fungal strains [41,42,43], while they demonstrated powerful antioxidant scavenging activity towards ROS [44,45,46], which is highly matched with our results.
Polyphenolic-nanoparticle conjugates have recently been investigated for targeted medication activity augmentation. Nanoparticle-based drug delivery techniques such as vesicular drug delivery (liposomes), nanocrystals, nanoparticles, solid dispersion, and phospholipid complexes have been used to solve the challenges of poor solubility and low bioavailability [47,48,49,50,51].
Gold nanoparticles (AuNPs) have been employed in a wide range of applications due to their highly tunable physicochemical features [52]. Surface plasmon resonance (SPR)—the oscillation of free electrons on the AuNP surface upon infrared radiation [53,54,55]—is definitely the hallmark of all AuNP optical properties. Herein, 7-methoxyepirosmanol displayed the most powerful antimicrobial and antioxidant activities of all those phenolics, and thus it was selected to be loaded on gold nanoparticles to establish activity optimization.
Loading 7-methoxyepirosmanol on nanoparticles exhibited an optimization result for both antimicrobial and antibiofilm activities but not for antioxidant scavenging activity. To our knowledge, gold nanoparticles have not exerted any role in the alteration of the antioxidant capacity of various reducing agents but have been considered analytical tools for antioxidant capacity assessment [56]. Moreover, the antimicrobial and biofilm activity of AuNPs-OM1 against several pathogens was substantially (p < 0.05) higher than that of free OM1. The bactericidal activities of AuNPs-OM1 against microorganisms were consistent with the findings of other researchers. In one investigation, azithromycin-loaded nanoparticles outperformed free azithromycin against S. Typhimurium [57]. Nisin-loaded nanoparticles inhibited the growth of Escherichia aerogenes, M. luteus, P. aeruginosa, S. enterica, and for 20 days, compared to free nisin, which had antibacterial action for 6 days [58]. That effect could be attributed to the smaller particle size, which allows for improved cell penetration and uptake [51].

4. Materials and Methods

4.1. Plant Material

The leaves of O. majoranum (OM) plant were obtained in March 2021 from a field near Elwasta Capital, Beni Suif, Egypt. Professor Abdel-Halim A. Mohammed, Horticultural Research Institute, Department of Flora and Phytotaxonomy Research, Dokki, Cairo, Egypt, certified the plant’s authenticity. A voucher specimen (2021-BuPD 57) was deposited at the Department of Pharmacognosy, Faculty of Pharmacy, Beni Suif University.

4.2. Plant Extraction

O. majoranum powdered plant (1 kg) was macerated with 80% MeOH at room temperature and then concentrated under reduced pressure using a rotary evaporator (IKA, Königswinter, Germany) to a syrupy consistency. The concentrated methanolic extract yielded 60 g, and the dried extract was stored at 4 °C for in vitro and metabolomic studies.

4.3. Metabolomics Analysis

According to Hifnawy et al. [59], the extracted O. majoranum powder was subjected to metabolomic analysis using the LC-HRESIMS technique, detailed in Section S1 of the “Supplementary Material File”, representing the HR-MS chart of the main identified components (Figure S1).

4.4. Purification of High Features from O. majoranum

4.4.1. Fractionation of the Hydromethanolic Extract

The concentrated methanolic extract of OM (170 gm) was suspended in distilled water (500 mL) and extracted with petroleum ether, DCM, EtOAc, and BuOH, in that order. Under reduced pressure, the organic phase of each step was evaporated individually to afford the corresponding fractions OM-I (0.6 g), OM-II, (35 g) OM-III (18 g), and OM-IV (60 g), respectively. The resulting EtOAc (OM-III) and BuOH (OM-IV) fractions were kept at 4 °C for the phytochemical investigation.

4.4.2. Purification of 7-Methoxyepirosmanol

On a silica gel column (1 × 100 cm, 50 g), a portion of fraction OM-I (600 mg) was fractionated. First, elution was carried out utilizing a petroleum ether-EtOAc gradient mixture in order of increasing polarity (5% to 40%, 10% to 60%, and 20% to 100%), then EtOAc-MeOH (80:20), (50–50), and finally MeOH 100%. The effluents were then collected in test tubes (20 mL), concerning each fraction of 200 mL. Afterwards, each resulted fraction was concentrated and visualized by TLC. Similar fractions were grouped and concentrated under reduced pressure to provide 10 sub-fractions (OMI1–OMI10). Sub-fraction OMI5 was washed several times with chloroform to afford compound OM1 (96 mg).

4.4.3. Purification of Flavonoids and Phenolic Acids

On a silica gel column (2.7 × 110 cm, 150 g), a portion of fraction OM-III (15 g) was fractionated. First, elution was carried out utilizing CHCl3-EtOAc gradient mixtures in order of increasing polarity (5% to 40%, 10% to 60%, and 20% to 100%), then with EtOAc-MeOH (80:20), (50–50), and finally with MeOH 100%. The effluents were separated into fractions of 400 mL each, which were then divided into test tubes (20 mL), and each fraction was concentrated and monitored using TLC. Six sub-fractions (OMIII1–OMIII6) were created by grouping similar fractions together and concentrating them under reduced pressure. Next, a portion of subfraction OMIII4 (2 g) was fractionated under the same conditions as fraction OM-III, yielding OMIII4-F4 and OMIII4-F5, the latter of which is pure compound OM2 (105 mg). OMIII4-F4 was then subjected to a Sephadex LH-20 column (80 × 1.5 cm, 15 g) using MeOH-H2O (8:2) to afford compounds OM3 (32 mg), OM4 (43 mg), OM5 (54 mg), and OM6 (102 mg).
On a polyamide-6 column (3.5 × 100 cm, 100 g), a portion of fraction OM-IV (10 g) was fractionated. Afterwards, elution was carried out utilizing MeOH-H2O gradient mixtures in order of decreasing polarity (5% to 40%, 10% to 60%, and 20% to 100%). The effluents were collected in various fractions (600 mL each), and each resulted fraction was concentrated and visualized by TLC. To create 16 sub-fractions (OMIV1–OMIV16), similar fractions were clustered together and concentrated at reduced pressure. OMIV6 (200 mg) was then subjected to chromatographic separation using a Sephadex LH-20 column (110 × 1 cm, 15 g) using MeOH-H2O (8:2) to yield OMIV6-F3, which was afforded to be compound OM7 (24 mg). All chemicals, reagents, and apparatus are mentioned in Section S2 of the “Supplementary Material File”.

4.5. The Antimicrobial Activity Determination of Phenolic Compounds

To test pure compounds for antibacterial activity, three Gram-negative bacteria (Proteus vulgaris, Salmonella typhimurium, and Escherichia coli ATCC 25955), one Gram-positive bacteria (Staphylococcus aureus NRRL B-767), and two yeasts (Aspergillus niger ATCC 16404 and Candida albicans ATCC 10231) were used as test organisms and antibacterial tests were performed [60]. The experiments were carried out in 96-well flat polystyrene plates. First, 10 µL of test extracts (final concentration of 250 g/mL) were added to 80 L of lysogeny broth (LB broth), then 10 µL of bacterial culture suspension (log phase) was added, and the plates were incubated overnight at 37 °C. Following incubation, the positive antibacterial action of the tested drug was observed as clearance in the wells. In contrast, compounds that had no effect on the bacteria caused the growth media to become opaque in the wells. Finally, the absorbance was measured after roughly 20 h at OD600 in a Spectrostar Nano Microplate Reader (BMG LABTECH GmbH, Allmendgrun, Germany).

4.6. Antibiofilm Activity

The 96-well flat polystyrene plates were used to test the biofilm inhibitory activity of compound OM1 and AuNPs-OM1 against four clinical microorganisms, including Gram-positive bacteria (Staphylococcus aureus and Bacillus subtilis) and Gram-negative bacteria (Pseudomonas areuginosa and Escherichia coli) [61]. In brief, each well was filled with 180 µL of lysogeny broth (LB broth) and then inoculated with 10 µL of pathogenic bacteria, followed by the addition of 10 µL (final concentration of 250 µg/mL) of samples along with a control (without test sample). The plates were incubated for 24 h at 37 °C, following which the contents in the wells were removed and washed with 200 µL of phosphate buffer saline (PBS), pH 7.2, to remove free-floating bacteria, and then dried in sterilized laminar flow for 1 h. For staining, 200 µL of crystal violet (0.1% w/v) was applied to each well for 1 h, then the surplus stain was removed, and the plates were retained for drying. Furthermore, dried plates were washed with 95% ethanol, and then optical density was evaluated at an optical density of 570 nm using a Spectrostar Nano Microplate Reader (BMG LABTECH GmbH, Allmendgrun, Germany).

4.7. DDPH Antioxidant Assay

The DPPH free radical scavenging experiment was used to assess the antioxidant activity of various metabolites [62]. A fresh DPPH solution in methanol was produced, and the accurate initial concentration was determined spectrophotometrically from a calibration curve (Equation (1)):
ABS515nm = 10,500 × [DPPH] − 1.4 × 10⁻²
The linear regression (r2 = 0.999) suggested that the model was well-fitting. The kinetic measurements for each antioxidant investigated were performed using the spectrophotometer model Cary Bio 100 (Varian, Australia). Moreover, the sample chamber’s temperature was kept under control using a Peltier device incorporated into the chamber. In the literature, DPPH radical scavenging by H atom-donating antioxidants has been described utilizing at least two methods: (a) the fixed reaction time approach and (b) the steady-state saturation method. We tested both strategies to compare their outcomes.

4.8. Preparation of Gold Nanoparticles

Gold nanoparticles were prepared as described by Wu et al., [13].50 mL of 0.019 M reduced L-glutathione (GSH) aqueous solution was added to 5 mL of tetrachloroauric acid aqueous solution (0.025 M) and rapidly agitated for 30 min, then NaOH (0.1 M) was used to adjust the pH of the mixture to 8. To get rid of the excess GSH and other salts, the AuNPs were centrifuged for 3 h at 5000 rpm with a freshly prepared aqueous NaBH4 (2 mg/mL) under strong stirring until the ruby-red color formed. The supernatant was declined after centrifugation, and the gold nanoparticles were distributed in water before centrifugation was performed again to obtain clean AuNPs.

4.9. Characterization of Prepared Nanoparticles

The formation of AuNPs was initially monitored by a color change of the solution. Then, the transition of Au3+ to Au0 was tracked by regularly sampling aliquots (1 mL) of the mixture and analyzing the UV-vis spectra of the solutions with a SPECTROstar Nano Absorbance Plate Reader (BMG LABTECH). Finally, the gold nanoparticle solution was drop-coated onto a glass substrate, and the X-ray diffraction patterns were recorded using a PANalytical X’pert PRO X-ray diffractometer (The Netherlands) with Cu Ka1 radiation at 40 kV and 30 mA, respectively. Further, the diffracted patterns were captured at 2θ with the scanning speed of 0.02°/min from 10° to 80°. According to Brock-Neely, the ATR-FTIR spectra (Thermo Nicolet 380) of gold nanoparticles were obtained utilizing Broker vertex 80 v in the range of 4000–400 cm−1 with a resolution of 4 cm−1 (1957) [13].
Transmission electron microscopy (TEM) and scanning electron microscopy were used for analysis of the size and morphology of the produced gold nanoparticles and conjugate. First, 2–4 µL of gold nanoparticle solution was placed on carbon-coated copper grids for sample preparation. Next, the thin film was formed and air-dried under ambient circumstances and detected using Philips 10 Technai with an accelerating voltage of around 180 keV with a wavelength (λ) of 0.0251 Å. Next, scanning electron microscopy (SEM) was used to detect the elemental analysis, with a Field Emission Scanning Electron Microscope (FE-SEM) (Quanta FEG-250, The Netherlands) acceleration voltage of 20 kV, attached with EDAX (energy-dispersive X-ray analysis).

4.10. Conjugation of Compound OM1 and Gold Nanoparticles

Conjugation of compound OM1 and the prepared AuNPs was carried out according to Sulaiman et al. [32], whereby 5 mL of prepared AuNPs was combined with compound OM1 (500 μg mL−1) and stirred at room temperature overnight. The conjugated AuNP-OM1 was centrifuged for 1 h at 10,000 rpm after preparation to eliminate excess OM1.

5. Conclusions

The present work revealed the antimicrobial and antioxidant effects of the aerial parts of O. Majoranum, particularly of its metabolites purified from ethyl acetate and butanol fractions. Furthermore, metabolomic and phytochemical investigations of the plant revealed its ability to accumulate and biosynthesize several secondary metabolites, and primarily phenolics, implying their involvement in O. majoranum’s previously reported antibacterial and antioxidant activities. As a result, O. majoranum’s previously noted antibacterial ability may be partly attributed to the combined effects of these phytochemicals and/or their synergistic interactions. The antibacterial study confirms that the AuNPs-OM1 is more effective at controlling the development of the microorganisms tested and in bacterial biofilm inhibition compared with free OM1 (the most active compound). After loading the 7-methoxyepirosmanol in gold nanoparticles, the higher antibacterial activity could be attributed to increased cell penetration and uptake. These discoveries may assist in broadening the potential of this plant in future phytotherapy. Given its dietary supplementation and reported edibility, O. majoranum may be considered to protect against a variety of disorders. In the near future, more research into the cellular mechanisms and molecular aspects of O. majoranum’s antibacterial and antioxidant properties, as well as its phenolic metabolites, is required.

Supplementary Materials

The following supporting information can be downloaded at: https://www.mdpi.com/article/10.3390/plants11141871/s1, Figure S1: HRESI/MS spectrum for O. majoranum in the positive ionization mode. Figure S2: 1H NMR spectrum of compound OM1 (400 MHZ, methanol-d4). Figure S3: 13C NMR spectrum of compound OM1 (100 MHZ, methanol-d4). Figure S4: 1H NMR spectrum of compound OM2 (400 MHZ, methanol-d4). Figure S5: 1H NMR spectrum of compound OM3 (400 MHZ, DMSO-d6). Figure S6: 1H NMR spectrum of compound OM4 (400 MHZ, methanol-d4). Figure S7: 1H NMR spectrum of compound OM5 (400 MHZ, methanol-d4). Figure S8: 1H NMR spectrum of compound OM6 (400 MHZ, methanol-d4). Figure S9: 1H NMR spectrum of compound OM7 (400 MHZ, DMSO-d6). Section S1: Metabolomics analysis. Section S2: Identification of purified metabolites.

Author Contributions

Conceptualization, A.H.E.-G. and F.A.B.; methodology, M.A.A. (Mohamed A. Abdelgawad); software, M.A.A. (Mahmoud A. Aboseada); validation, I.H.A., A.M., and E.M.M.; formal analysis, H.A.A.; investigation, I.O.A.; resources, M.H.; data curation, M.H.E.; writing—original draft preparation, M.A.A. (Mohamed A. Abdelgawad); writing—review and editing, A.A.H.; visualization, A.M.S.; supervision, H.M.H.; project administration, H.M.H.; funding acquisition, M.A.A. (Mahmoud A. Aboseada). All authors have read and agreed to the published version of the manuscript.

Funding

The Deanship of Scientific Research at Jouf University, grant No. DSR-2021-03-0218.

Institutional Review Board Statement

Not applicable.

Informed Consent Statement

Not applicable.

Data Availability Statement

Not applicable.

Acknowledgments

The authors extend their appreciation to the Deanship of Scientific Research at Jouf University for funding this work through research grant No. (DSR-2021-03-0218). We also acknowledge Mina A. Saweris for assisting in the computer data processing.

Conflicts of Interest

The authors declare that there is no conflict of interest.

References

  1. Gheitasi, I.; Azizi, A.; Omidifar, N.; Doustimotlagh, A.H. Renoprotective effects of Origanum majorana methanolic L and carvacrol on ischemia/reperfusion-induced kidney injury in male rats. Evidence-Based Complement. Altern. Med. 2020, 2020, 9785932. [Google Scholar]
  2. Jssim, Q.A.-N.K.; Abdul-Halim, A.G. Cytotoxic effect of synergism relationship of oil extract from Origanum majorana L. and silicon nano particles on MCF-7. Plant Arch. 2020, 20, 817–821. [Google Scholar]
  3. Chorianopoulos, N.; Kalpoutzakis, E.; Aligiannis, N.; Mitaku, S.; Nychas, G.-J.; Haroutounian, S.A. Essential oils of Satureja, Origanum, and Thymus species: Chemical composition and antibacterial activities against foodborne pathogens. J. Agric. Food Chem. 2004, 52, 8261–8267. [Google Scholar] [CrossRef] [PubMed]
  4. Raina, A.P.; Negi, K.S. Essential oil composition of Origanum majorana and Origanum vulgare ssp. hirtum growing in India. Chem. Nat. Compd. 2012, 47, 1015–1017. [Google Scholar] [CrossRef]
  5. Kosakowska, O.; Czupa, W. Morphological and chemical variability of common oregano (Origanum vulgare L. subsp vulgare) occurring in eastern Poland. Herba Pol. 2018, 64. [Google Scholar]
  6. Danin, A.; Künne, I. Origanum jordanicum (Labiatae), a new species from Jordan, and notes on the other species of O. sect. Campanulaticalyx. Willdenowia 1996, 601–611. [Google Scholar]
  7. González-Tejero, M.R.; Casares-Porcel, M.; Sánchez-Rojas, C.P.; Ramiro-Gutiérrez, J.M.; Molero-Mesa, J.; Pieroni, A.; Giusti, M.E.; Censorii, E.; De Pasquale, C.; Della, A. Medicinal plants in the Mediterranean area: Synthesis of the results of the project Rubia. J. Ethnopharmacol. 2008, 116, 341–357. [Google Scholar] [CrossRef]
  8. Vagi, E.; Simándi, B.; Daood, H.G.; Deak, A.; Sawinsky, J. Recovery of pigments from Origanum majorana L. by extraction with supercritical carbon dioxide. J. Agric. Food Chem. 2002, 50, 2297–2301. [Google Scholar] [CrossRef]
  9. Novak, J.; Langbehn, J.; Pank, F.; Franz, C.M. Essential oil compounds in a historical sample of marjoram (Origanum majorana L., Lamiaceae). Flavour Fragr. J. 2002, 17, 175–180. [Google Scholar] [CrossRef]
  10. Yazdanparast, R.; Shahriyary, L. Comparative effects of Artemisia dracunculus, Satureja hortensis and Origanum majorana on inhibition of blood platelet adhesion, aggregation and secretion. Vascul. Pharmacol. 2008, 48, 32–37. [Google Scholar] [CrossRef]
  11. Faleiro, L.; Miguel, G.; Gomes, S.; Costa, L.; Venâncio, F.; Teixeira, A.; Figueiredo, A.C.; Barroso, J.G.; Pedro, L.G. Antibacterial and antioxidant activities of essential oils isolated from Thymbra capitata L. (Cav.) and Origanum vulgare L. J. Agric. Food Chem. 2005, 53, 8162–8168. [Google Scholar] [CrossRef] [PubMed]
  12. Bremness, L.; King, D. The Complete Book of Herbs; Viking Studio Books: New York, NY, USA, 1988; ISBN 0670818941. [Google Scholar]
  13. Wu, C.-H.; Huang, S.-M.; Lin, J.-A.; Yen, G.-C. Inhibition of advanced glycation endproduct formation by foodstuffs. Food Funct. 2011, 2, 224–234. [Google Scholar] [CrossRef] [PubMed]
  14. Vasudeva, N.; Singla, P.; Das, S.; Sharma, S.K. Antigout and antioxidant activity of stem and root of Origanum majorana Linn. Am. J. Drug Discov. Dev. 2014, 4, 102–112. [Google Scholar] [CrossRef]
  15. Rezaie, A.; Mousavi, G.; Nazeri, M.; Jafari, B.; Ebadi, A.; Ahmadeh, C.; Habibi, E. Comparative study of sedative, pre-anesthetic and anti-anxiety effect of Origanum majorana extract with diazepam on rats. Res. J. Biol. Sci. 2011, 6, 611–614. [Google Scholar] [CrossRef] [Green Version]
  16. Deshmane, D.N.; Gadgoli, C.H.; Halade, G.V. Anticonvulsant effect of Origanum majorana L. Pharmacologyonline 2007, 2007, 64. [Google Scholar]
  17. Al-Harbi, N.O. Effect of marjoram extract treatment on the cytological and biochemical changes induced by cyclophosphamide in mice. J. Med. Plants Res. 2011, 5, 5479–5485. [Google Scholar]
  18. Singla, P.; Vasudeva, N. Pharmacognostical and quality control parameters of Origanum majorana Linn. Stem root. World J. Pharm. Pharm. Sci. 2014, 3, 1428–1437. [Google Scholar]
  19. Chung, Y.-K.; Heo, H.-J.; Kim, E.-K.; Kim, H.-K.; Huh, T.-L.; Lim, Y.; Kim, S.-K.; Shin, D.-H. Inhibitory Effect of Ursolic Acid Purified from Origanum majorana L. on the Acetylcholinesterase. Mol. Cells 2001, 11, 137–143. [Google Scholar]
  20. Sellami, I.H.; Maamouri, E.; Chahed, T.; Wannes, W.A.; Kchouk, M.E.; Marzouk, B. Effect of growth stage on the content and composition of the essential oil and phenolic fraction of sweet marjoram (Origanum majorana L.). Ind. Crops Prod. 2009, 30, 395–402. [Google Scholar] [CrossRef]
  21. Khan, I.A.; Abourashed, E.A. Leung’s Encyclopedia of Common Natural Ingredients: Used in Food, Drugs and Cosmetics; John Wiley & Sons: Hoboken, NJ, USA, 2011; ISBN 1118213068. [Google Scholar]
  22. Janicsák, G.; Máthé, I.; Miklossy-Vari, V.; Blunden, G. Comparative studies of the rosmarinic and caffeic acid contents of Lamiaceae species. Biochem. Syst. Ecol. 1999, 27, 733–738. [Google Scholar] [CrossRef]
  23. Bobzin, S.C.; Yang, S.; Kasten, T.P. LC-NMR: A new tool to expedite the dereplication and identification of natural products. J. Ind. Microbiol. Biotechnol. 2000, 25, 342–345. [Google Scholar] [CrossRef] [PubMed]
  24. Tawfike, A.F.; Viegelmann, C.; Edrada-Ebel, R. Metabolomics and dereplication strategies in natural products. In Metabolomics Tools for Natural Product Discovery; Humana Press: Totowa, NJ, USA, 2013; pp. 227–244. [Google Scholar]
  25. Blunt, J. MarinLit; University of Canterbury: Christchurch, New Zealand, 2012. [Google Scholar]
  26. Laatsch, H. Antibase Version 4.0—The Natural Compound Identifier; Wiley-VCH Verlag GmbH & Co. KGaA: Weinheim, Germany, 2012. [Google Scholar]
  27. Fiehn, O. Combining genomics, metabolome analysis, and biochemical modelling to understand metabolic networks. Int. J. Genom. 2001, 2, 155–168. [Google Scholar] [CrossRef] [PubMed] [Green Version]
  28. Van Der Werf, M.J.; Jellema, R.H.; Hankemeier, T. Microbial metabolomics: Replacing trial-and-error by the unbiased selection and ranking of targets. J. Ind. Microbiol. Biotechnol. 2005, 32, 234–252. [Google Scholar] [CrossRef]
  29. Leeja, L.; Thoppil, J.E. Antimicrobial activity of methanol extract of Origanum majorana L. (Sweet marjoram). J. Environ. Biol. 2007, 28, 145. [Google Scholar]
  30. Erenler, R.; Sen, O.; Aksit, H.; Demirtas, I.; Yaglioglu, A.S.; Elmastas, M.; Telci, I. Isolation and identification of chemical constituents from Origanum majorana and investigation of antiproliferative and antioxidant activities. J. Sci. Food Agric. 2016, 96, 822–836. [Google Scholar] [CrossRef]
  31. Vagi, E.; Rapavi, E.; Hadolin, M.; Vasarhelyine Peredi, K.; Balazs, A.; Blazovics, A.; Simandi, B. Phenolic and triterpenoid antioxidants from Origanum majorana L. herb and extracts obtained with different solvents. J. Agric. Food Chem. 2005, 53, 17–21. [Google Scholar] [CrossRef]
  32. Sulaiman, T.A.; Bulut, H.; Baskonus, H.M. Optical solitons to the fractional perturbed NLSE in nano-fibers. Discret. Contin. Dyn. Syst. 2020, 13, 925. [Google Scholar]
  33. Preiser, J. Oxidative stress. J. Parenter. Enter. Nutr. 2012, 36, 147–154. [Google Scholar] [CrossRef]
  34. Croft, K.D. Dietary polyphenols: Antioxidants or not? Arch. Biochem. Biophys. 2016, 595, 120–124. [Google Scholar] [CrossRef] [Green Version]
  35. Balouiri, M.; Sadiki, M.; Ibnsouda, S.K. Methods for in vitro evaluating antimicrobial activity: A review. J. Pharm. Anal. 2016, 6, 71–79. [Google Scholar] [CrossRef] [Green Version]
  36. Daglia, M. Polyphenols as antimicrobial agents. Curr. Opin. Biotechnol. 2012, 23, 174–181. [Google Scholar] [CrossRef] [PubMed]
  37. Kozłowska, M.; Laudy, A.E.; Starościak, B.J.; Napiórkowski, A.; Chomicz, L.; Kazimierczuk, Z. Antimicrobial and antiprotozoal effect of sweet marjoram (Origanum majorana L.). Acta Sci. Pol. Cultus 2010, 9, 133–141. [Google Scholar]
  38. Choi, M.-Y.; Rhim, T.-J. Antimicrobial effect of Oregano (Origanum majorana L.) extract on food-borne pathogens. Korean J. Plant Resour. 2008, 21, 352–356. [Google Scholar]
  39. Roby, M.H.H.; Sarhan, M.A.; Selim, K.A.-H.; Khalel, K.I. Evaluation of antioxidant activity, total phenols and phenolic compounds in thyme (Thymus vulgaris L.), sage (Salvia officinalis L.), and marjoram (Origanum majorana L.) extracts. Ind. Crops Prod. 2013, 43, 827–831. [Google Scholar] [CrossRef]
  40. Jun, W.J.; Han, B.K.; Yu, K.W.; Kim, M.S.; Chang, I.S.; Kim, H.Y.; Cho, H.Y. Antioxidant effects of Origanum majorana L. on superoxide anion radicals. Food Chem. 2001, 75, 439–444. [Google Scholar] [CrossRef]
  41. Matejczyk, M.; Świsłocka, R.; Golonko, A.; Lewandowski, W.; Hawrylik, E. Cytotoxic, genotoxic and antimicrobial activity of caffeic and rosmarinic acids and their lithium, sodium and potassium salts as potential anticancer compounds. Adv. Med. Sci. 2018, 63, 14–21. [Google Scholar] [CrossRef] [PubMed]
  42. Nitiema, L.W.; Savadogo, A.; Simpore, J.; Dianou, D.; Traore, A.S. In vitro antimicrobial activity of some phenolic compounds (coumarin and quercetin) against gastroenteritis bacterial strains. Int. J. Microbiol. Res. 2012, 3, 183–187. [Google Scholar]
  43. He, M.; Wu, T.; Pan, S.; Xu, X. Antimicrobial mechanism of flavonoids against Escherichia coli ATCC 25922 by model membrane study. Appl. Surf. Sci. 2014, 305, 515–521. [Google Scholar] [CrossRef]
  44. Zhang, M.; Swarts, S.G.; Yin, L.; Liu, C.; Tian, Y.; Cao, Y.; Swarts, M.; Yang, S.; Zhang, S.B.; Zhang, K. Antioxidant properties of quercetin. In Oxygen Transport to Tissue XXXII; Springer: Berlin/Heidelberg, Germany, 2011; pp. 283–289. [Google Scholar]
  45. Parhiz, H.; Roohbakhsh, A.; Soltani, F.; Rezaee, R.; Iranshahi, M. Antioxidant and anti-inflammatory properties of the citrus flavonoids hesperidin and hesperetin: An updated review of their molecular mechanisms and experimental models. Phyther. Res. 2015, 29, 323–331. [Google Scholar] [CrossRef]
  46. Khojasteh, A.; Mirjalili, M.H.; Alcalde, M.A.; Cusido, R.M.; Eibl, R.; Palazon, J. Powerful plant antioxidants: A new biosustainable approach to the production of rosmarinic acid. Antioxidants 2020, 9, 1273. [Google Scholar] [CrossRef]
  47. Sahoo, N.G.; Kakran, M.; Shaal, L.A.; Li, L.; Müller, R.H.; Pal, M.; Tan, L.P. Preparation and characterization of quercetin nanocrystals. J. Pharm. Sci. 2011, 100, 2379–2390. [Google Scholar] [CrossRef]
  48. Pool, H.; Quintanar, D.; de Figueroa, J.D.; Bechara, J.E.H.; McClements, D.J.; Mendoza, S. Polymeric nanoparticles as oral delivery systems for encapsulation and release of polyphenolic compounds: Impact on quercetin antioxidant activity & bioaccessibility. Food Biophys. 2012, 7, 276–288. [Google Scholar]
  49. Gang, W.; Jie, W.J.; Ping, Z.L.; Ming, D.S.; Ying, L.J.; Lei, W.; Fang, Y. Liposomal quercetin: Evaluating drug delivery in vitro and biodistribution in vivo. Expert Opin. Drug Deliv. 2012, 9, 599–613. [Google Scholar] [CrossRef] [PubMed]
  50. de Mello Costa, A.R.; Marquiafável, F.S.; de Oliveira Lima Leite Vaz, M.M.; Rocha, B.A.; Pires Bueno, P.C.; Amaral, P.L.M.; da Silva Barud, H.; Berreta-Silva, A.A. Quercetin-PVP K25 solid dispersions: Preparation, thermal characterization and antioxidant activity. J. Therm. Anal. Calorim. 2011, 104, 273–278. [Google Scholar] [CrossRef]
  51. Kumar, V.D.; Verma, P.R.P.; Singh, S.K. Morphological and in vitro antibacterial efficacy of quercetin loaded nanoparticles against food-borne microorganisms. LWT-Food Sci. Technol. 2016, 66, 638–650. [Google Scholar] [CrossRef]
  52. Peng, G.; Tisch, U.; Adams, O.; Hakim, M.; Shehada, N.; Broza, Y.Y.; Billan, S.; Abdah-Bortnyak, R.; Kuten, A.; Haick, H. Diagnosing lung cancer in exhaled breath using gold nanoparticles. Nat. Nanotechnol. 2009, 4, 669–673. [Google Scholar] [CrossRef]
  53. Tzarouchis, D.; Sihvola, A. Light scattering by a dielectric sphere: Perspectives on the Mie resonances. Appl. Sci. 2018, 8, 184. [Google Scholar] [CrossRef] [Green Version]
  54. Farooq, M.U.; Novosad, V.; Rozhkova, E.A.; Wali, H.; Ali, A.; Fateh, A.A.; Neogi, P.B.; Neogi, A.; Wang, Z. Gold nanoparticles-enabled efficient dual delivery of anticancer therapeutics to HeLa cells. Sci. Rep. 2018, 8, 2907. [Google Scholar] [CrossRef] [Green Version]
  55. Dykman, L.A.; Khlebtsov, N.G. Gold nanoparticles in biology and medicine: Recent advances and prospects. Acta Nat. 2011, 3, 34–55. [Google Scholar] [CrossRef] [Green Version]
  56. Vilela, D.; González, M.C.; Escarpa, A. Nanoparticles as analytical tools for in-vitro antioxidant-capacity assessment and beyond. TRAC Trends Anal. Chem. 2015, 64, 1–16. [Google Scholar] [CrossRef]
  57. Mohammadi, G.; Valizadeh, H.; Barzegar-Jalali, M.; Lotfipour, F.; Adibkia, K.; Milani, M.; Azhdarzadeh, M.; Kiafar, F.; Nokhodchi, A. Development of azithromycin–PLGA nanoparticles: Physicochemical characterization and antibacterial effect against Salmonella typhi. Colloids Surf. B Biointerfaces 2010, 80, 34–39. [Google Scholar] [CrossRef]
  58. Bernela, M.; Kaur, P.; Chopra, M.; Thakur, R. Synthesis, characterization of nisin loaded alginate–chitosan–pluronic composite nanoparticles and evaluation against microbes. LWT-Food Sci. Technol. 2014, 59, 1093–1099. [Google Scholar] [CrossRef]
  59. Hifnawy, M.S.; Aboseada, M.A.; Hassan, H.M.; AboulMagd, A.M.; Tohamy, A.F.; Abdel-Kawi, S.H.; Rateb, M.E.; El Naggar, E.M.B.; Liu, M.; Quinn, R.J. Testicular caspase-3 and β-Catenin regulators predicted via comparative metabolomics and docking studies. Metabolites 2020, 10, 31. [Google Scholar] [CrossRef] [PubMed] [Green Version]
  60. Feng, S.; Tseng, D.; Di Carlo, D.; Garner, O.B.; Ozcan, A. High-throughput and automated diagnosis of antimicrobial resistance using a cost-effective cellphone-based micro-plate reader. Sci. Rep. 2016, 6, 39203. [Google Scholar] [CrossRef] [PubMed]
  61. Makled, A.F.; Salem, E.M.; Elbrolosy, A.M. Biofilm formation and antimicrobial resistance pattern of uropathogenic E. coli: Comparison of phenotypic and molecular methods. Egypt. J. Med. Microbiol. 2017, 26, 37–45. [Google Scholar] [CrossRef]
  62. Sanna, D.; Delogu, G.; Mulas, M.; Schirra, M.; Fadda, A. Determination of free radical scavenging activity of plant extracts through DPPH assay: An EPR and UV–Vis study. Food Anal. Methods 2012, 5, 759–766. [Google Scholar] [CrossRef]
Figure 1. Structures of high features of compounds (ranked by peak intensity) detected in hydromethanolic extract of OM after dereplication of their metabolomes.
Plants 11 01871 g001
Figure 2. In vitro antimicrobial activity. (A) Antibacterial activity of different purified compounds, compared to control (ciprofloxacin). (B) Antibacterial and antifungal activity of compound OM1, compared with AuNPs and AuNPs-OM1.
Plants 11 01871 g002
Figure 3. Surface plasmon bands of the compound OM1 (a), AuNPs (b), and the AuNPs-OM1 conjugate (c). Color change of the gold alone (d) and extract (e), when mixed together (f) and the formation of AuNPs-OM1 (g). Surface plasmon absorption bands (SPR).
Plants 11 01871 g003
Figure 4. TEM and SEM micrographs of the prepared AuNPs (a,c) and AuNPs-OM1 (b,d).
Plants 11 01871 g004
Figure 5. The XRD of the prepared AuNPs.
Plants 11 01871 g005
Figure 6. FTIR spectra for compound OM1 (a) and the prepared AuNPs-OM1 (b).
Plants 11 01871 g006
Table 1. LC-HRESIMS analysis of OM extract.
Experimentally Accurate m/zTheoretically Accurate m/zQuasi-FormSuggested Formula aTentative Identification b
302.0791302.0790[M+H]+C16H14O6Hesperitin
347.0762347.0760[M+H]+C17H14O8Rosmarinic acid
272.0893272.0896[M+H]+C12H16O7Arbutin
457.3670457.3673[M+H]+C30H48O3Oleanolic acid
456.3605456.3603[M+H]+C30H48O3Ursolic acid
170.0217170.0215[M+H]+C7H6O5Gallic acid
181.0495181.0497[M+H]+C9H8O4Caffeic acid
164.0471164.0473[M+H]+C9H8O3P-Coumaric acid
194.0578194.0579[M+H]+C10H10O4Ferulic acid
270.0529270.0528[M+H]+C15H10O5Apigenin
164.0812164.0815[M+H]+C10H12O2Trans-2-Hydrocinnamic acid
392.1108392.1107[M+H]+C19H20O96-O-4-Hydroxybenzoylarbutin
290.0792290.0790[M+H]+C15H14O6Catechin
611.1606611.1609[M+H]+C27H30O16Rutin
302.0427302.0426[M+H]+C15H10O7Quercetin
539.0974539.0975[M+H]+C30H18O10Amentoflavone
449.1079449.1077[M+H]+C21H20O11Luteolin 7-O-β-D-glucoside
360.1905360.1907[M+H]+C21H28O57-Methoxyepirosmanol
611.1973611.1972[M+H]+C28H34O15Hesperidin
286.0476286.0477[M+H]+C15H10O6Luteolin
a High-resolution electrospray ionization mass spectrometry (HRESIMS) using XCalibur 3.0 and allowing for M+H/M+Na adduct. b The suggested compound according to the Dictionary of Natural Products (DNP 23.1, 2021 on DVD) and Reaxys online database.
Table 2. High features of compounds (ranked by peak intensity) detected in hydromethanolic extracts of OM after dereplication of their metabolomes.
No. Accurate m/zSuggested Formula aQuasi-FormTentative Detection bIntensity
1302.0790[M+H]+C16H14O6Hesperitin 2.2 × 10⁴
2347.0760[M+H]+C17H14O8Rosmarinic acid1.2 × 107
3181.0497[M+H]+C9H8O4Caffeic acid 4.4 × 10⁷
4270.0528[M+H]+C15H10O5Apigenin 2.3 × 10⁷
5302.0426[M+H]+C15H10O7Quercetin8.8 × 105
6360.1907[M+H]+C21H28O57-Methoxyepirosmanol3.6 × 106
7611.1972[M+H]+C28H34O15Hesperidin1.1 × 104
8286.0477[M+H]+C15H10O6Luteolin6.8 × 106
a High-resolution electrospray ionization mass spectrometry (HRESIMS) using XCalibur 3.0 and allowing for M+H/M+Na adduct. b The suggested compound according to the Dictionary of Natural Products (DNP 23.1, 2021 on DVD) and Reaxys online database.
Table 3. Biofilm inhibitory percentage (%) of OM1 and AgNPs-OM1.
Biofilm Inhibitory Percentage (%)
Test BacteriaS. aureusB. subtilisP. aeruginosaE. coli
Compound OM15.2457.025010.552
AuNPs-OM119.25115.551030.021
Table 4. Scavenging activity (%) of the purified compounds and AuNPs-OM1.
Sample (100 µL) (Concentration = 4 µg)Scavenging Activity (%)
OM191.59
OM289.38
OM376.078
OM468.88
OM558.58
OM668.83
OM765.63
AuNPs-OM155.50
Ascorbic acid99.86
Table 5. Scavenging activity (%) of the compound OM1 at different concentrations.
OM1O.D517nmScavenging Activity (%)
Control2.759
50 µL (1 µg)2.414512.48
100 µL (2 µg)1.8333.67
200 µL (4 µg)0.711474.22
300 µL (6 µg)0.293689.35
IC50 = 2.41 µg
Publisher’s Note: MDPI stays neutral with regard to jurisdictional claims in published maps and institutional affiliations.

