
Aralia cordata Thunb. as a Source of Bioactive Compounds: Phytochemical Composition and Antioxidant Activity

 , and
, and
Abstract
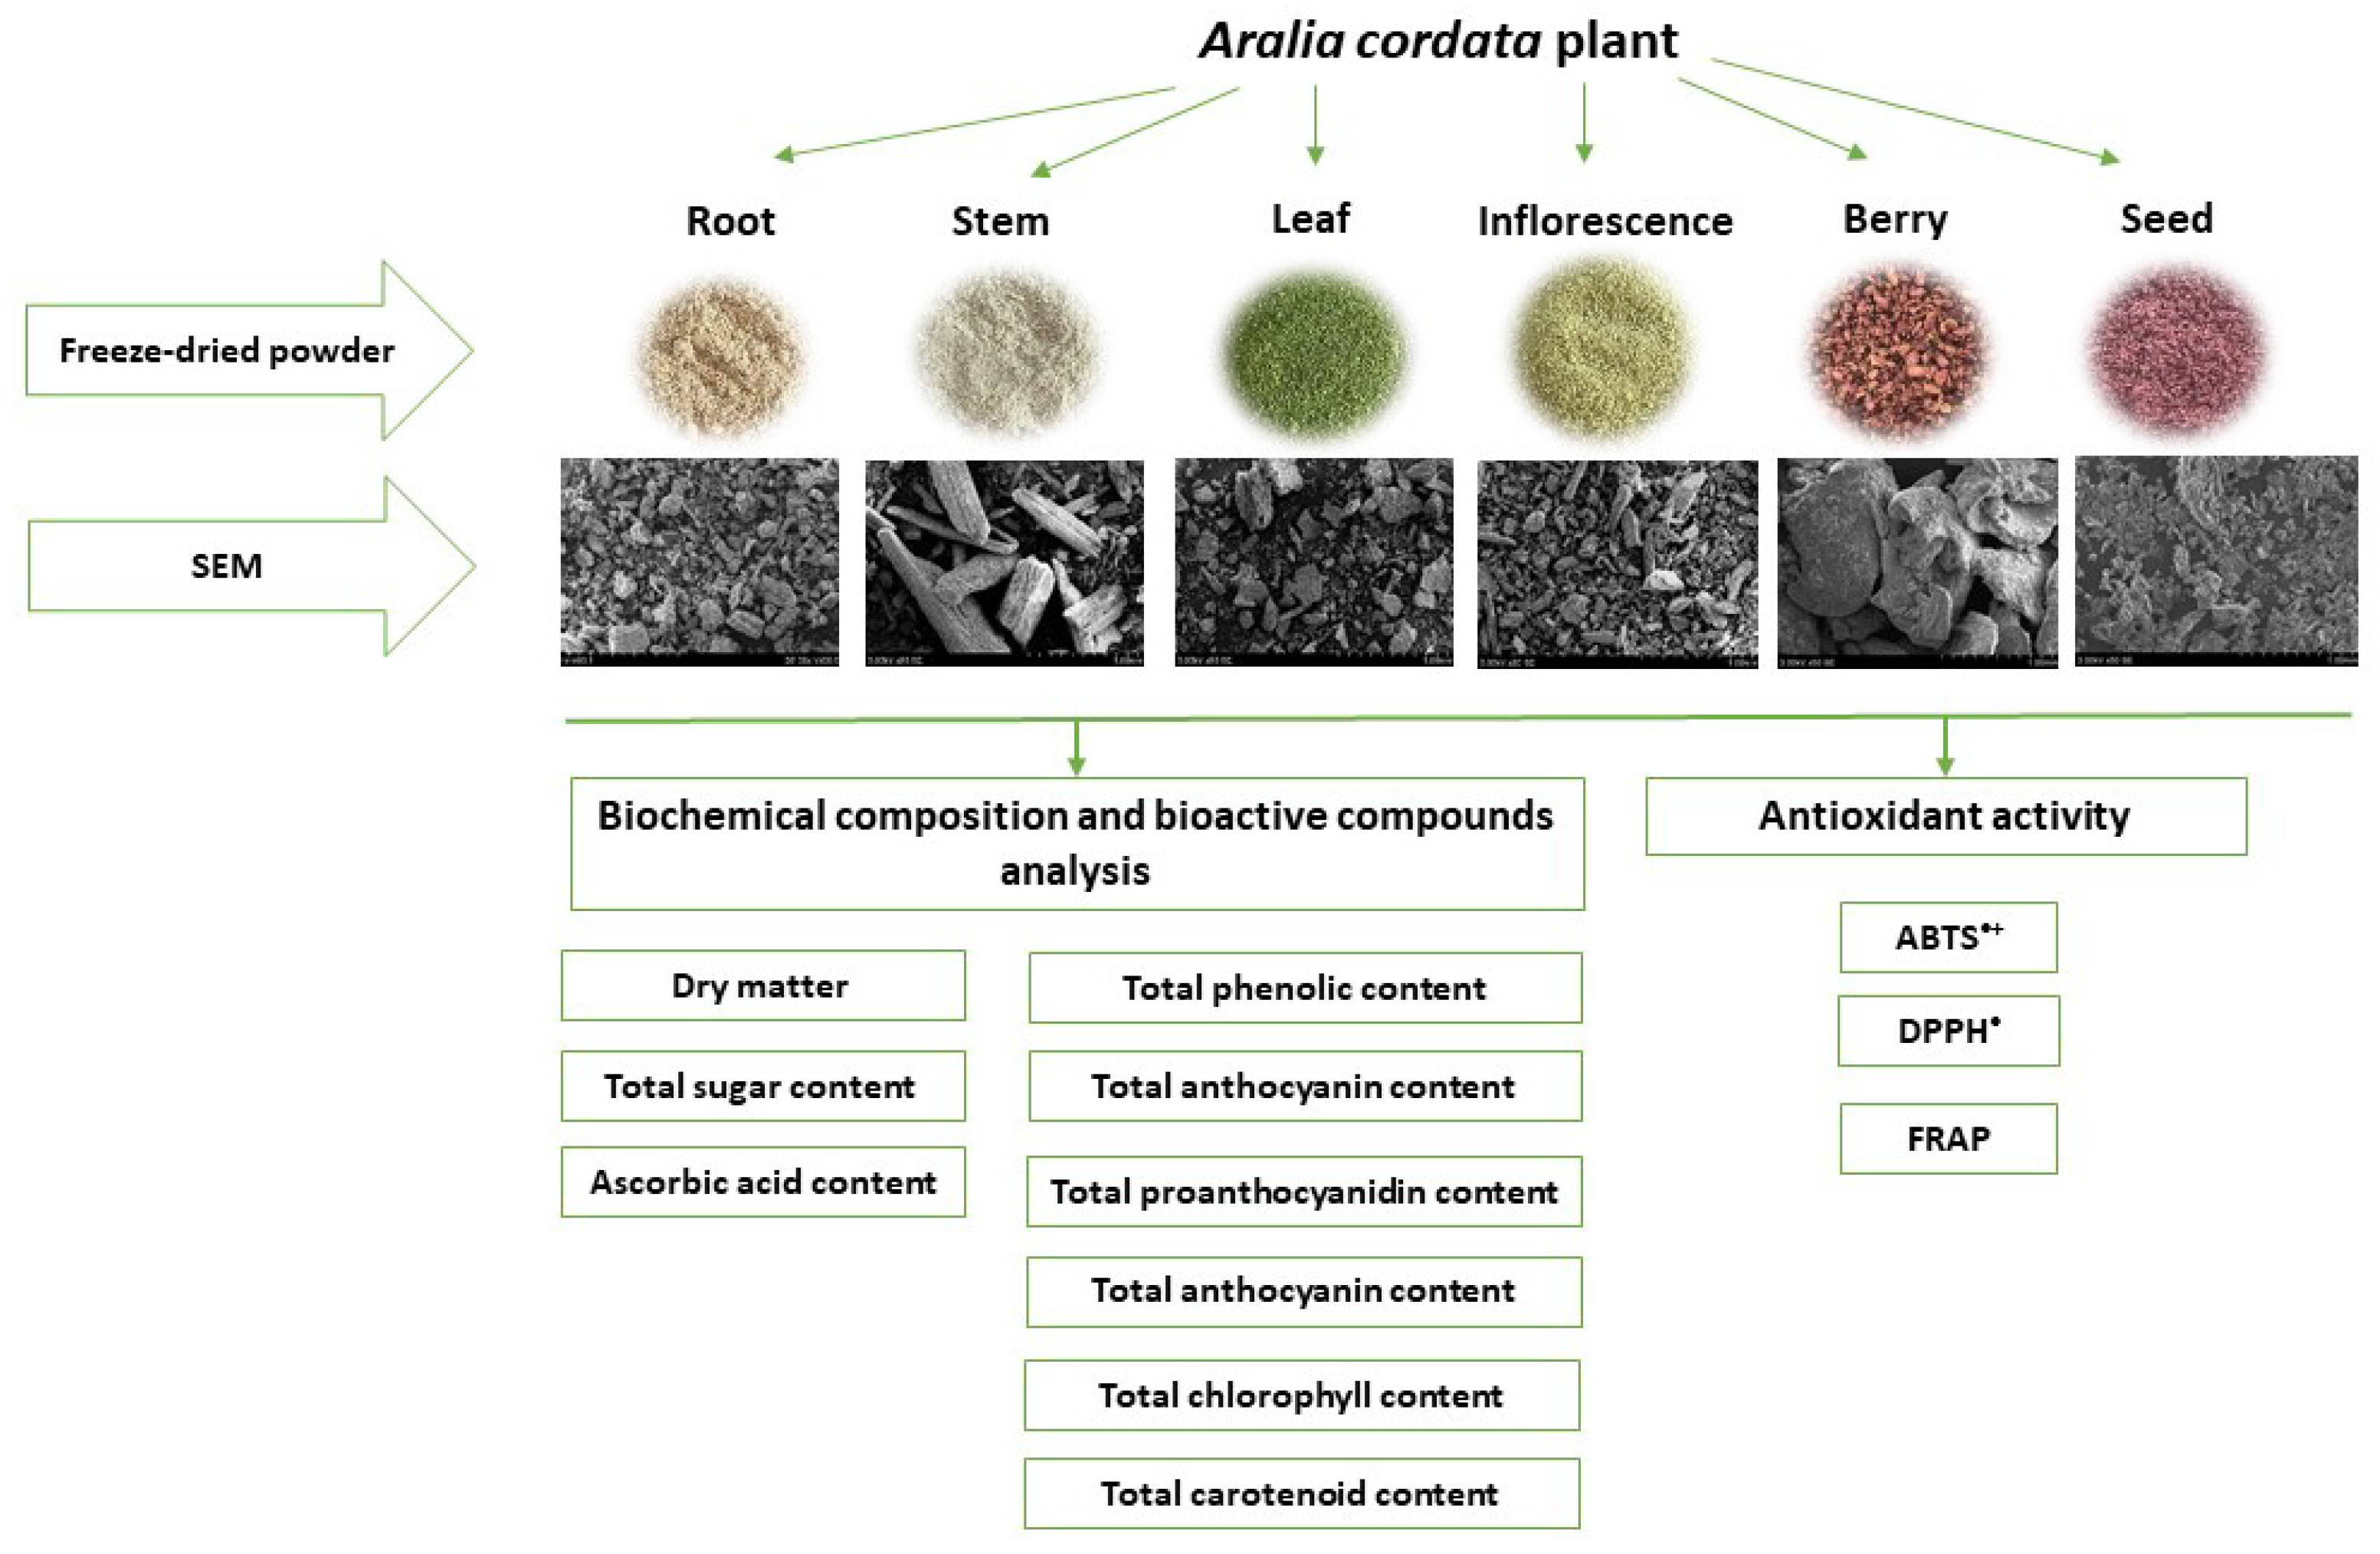
:1. Introduction
2. Results and Discussion
2.1. Determination of Sugars, Sucrose, Ascorbic Acid and Dry Matter Content
2.2. Evaluation of Chlorophyll, Phenolics, Carotenoids, Proanthocyanidins and Anthocyanyn Contents of A. cordata Morphological Parts
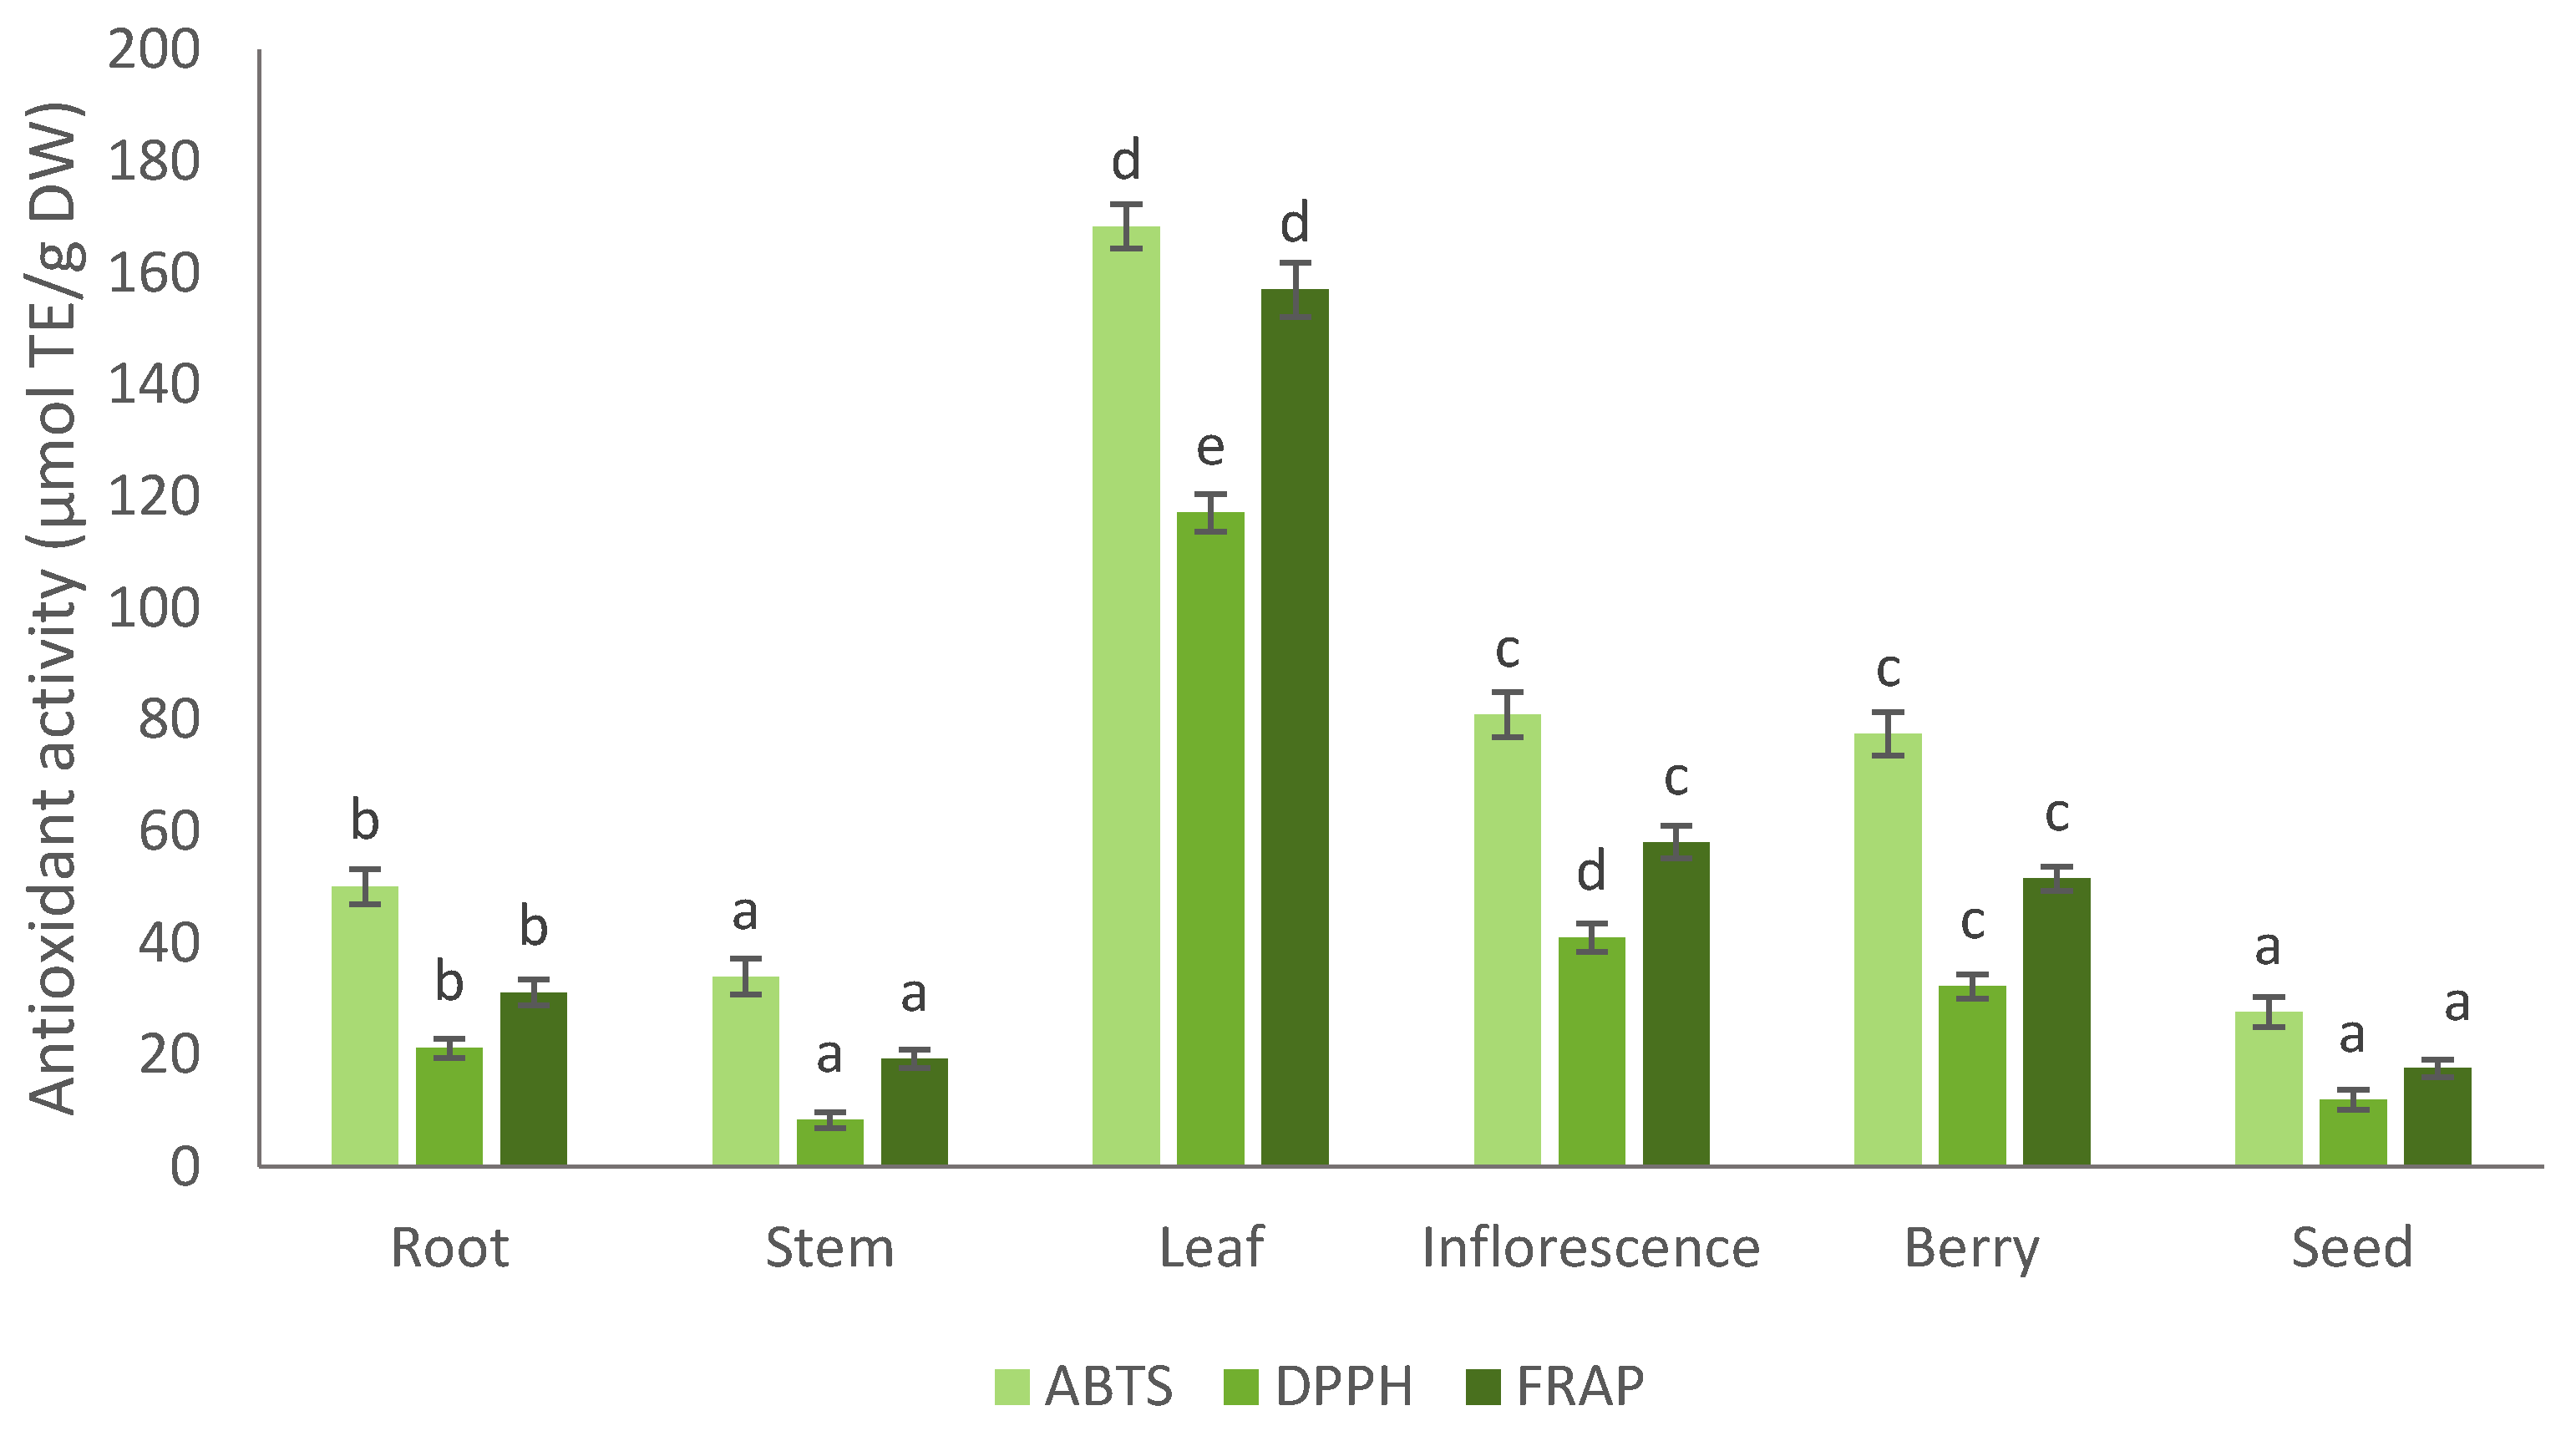
2.3. Determination Antioxidant Capacity of A. cordata Morphological Parts
2.4. Evaluation of Colour Changes in A. cordata Different Morphological Parts
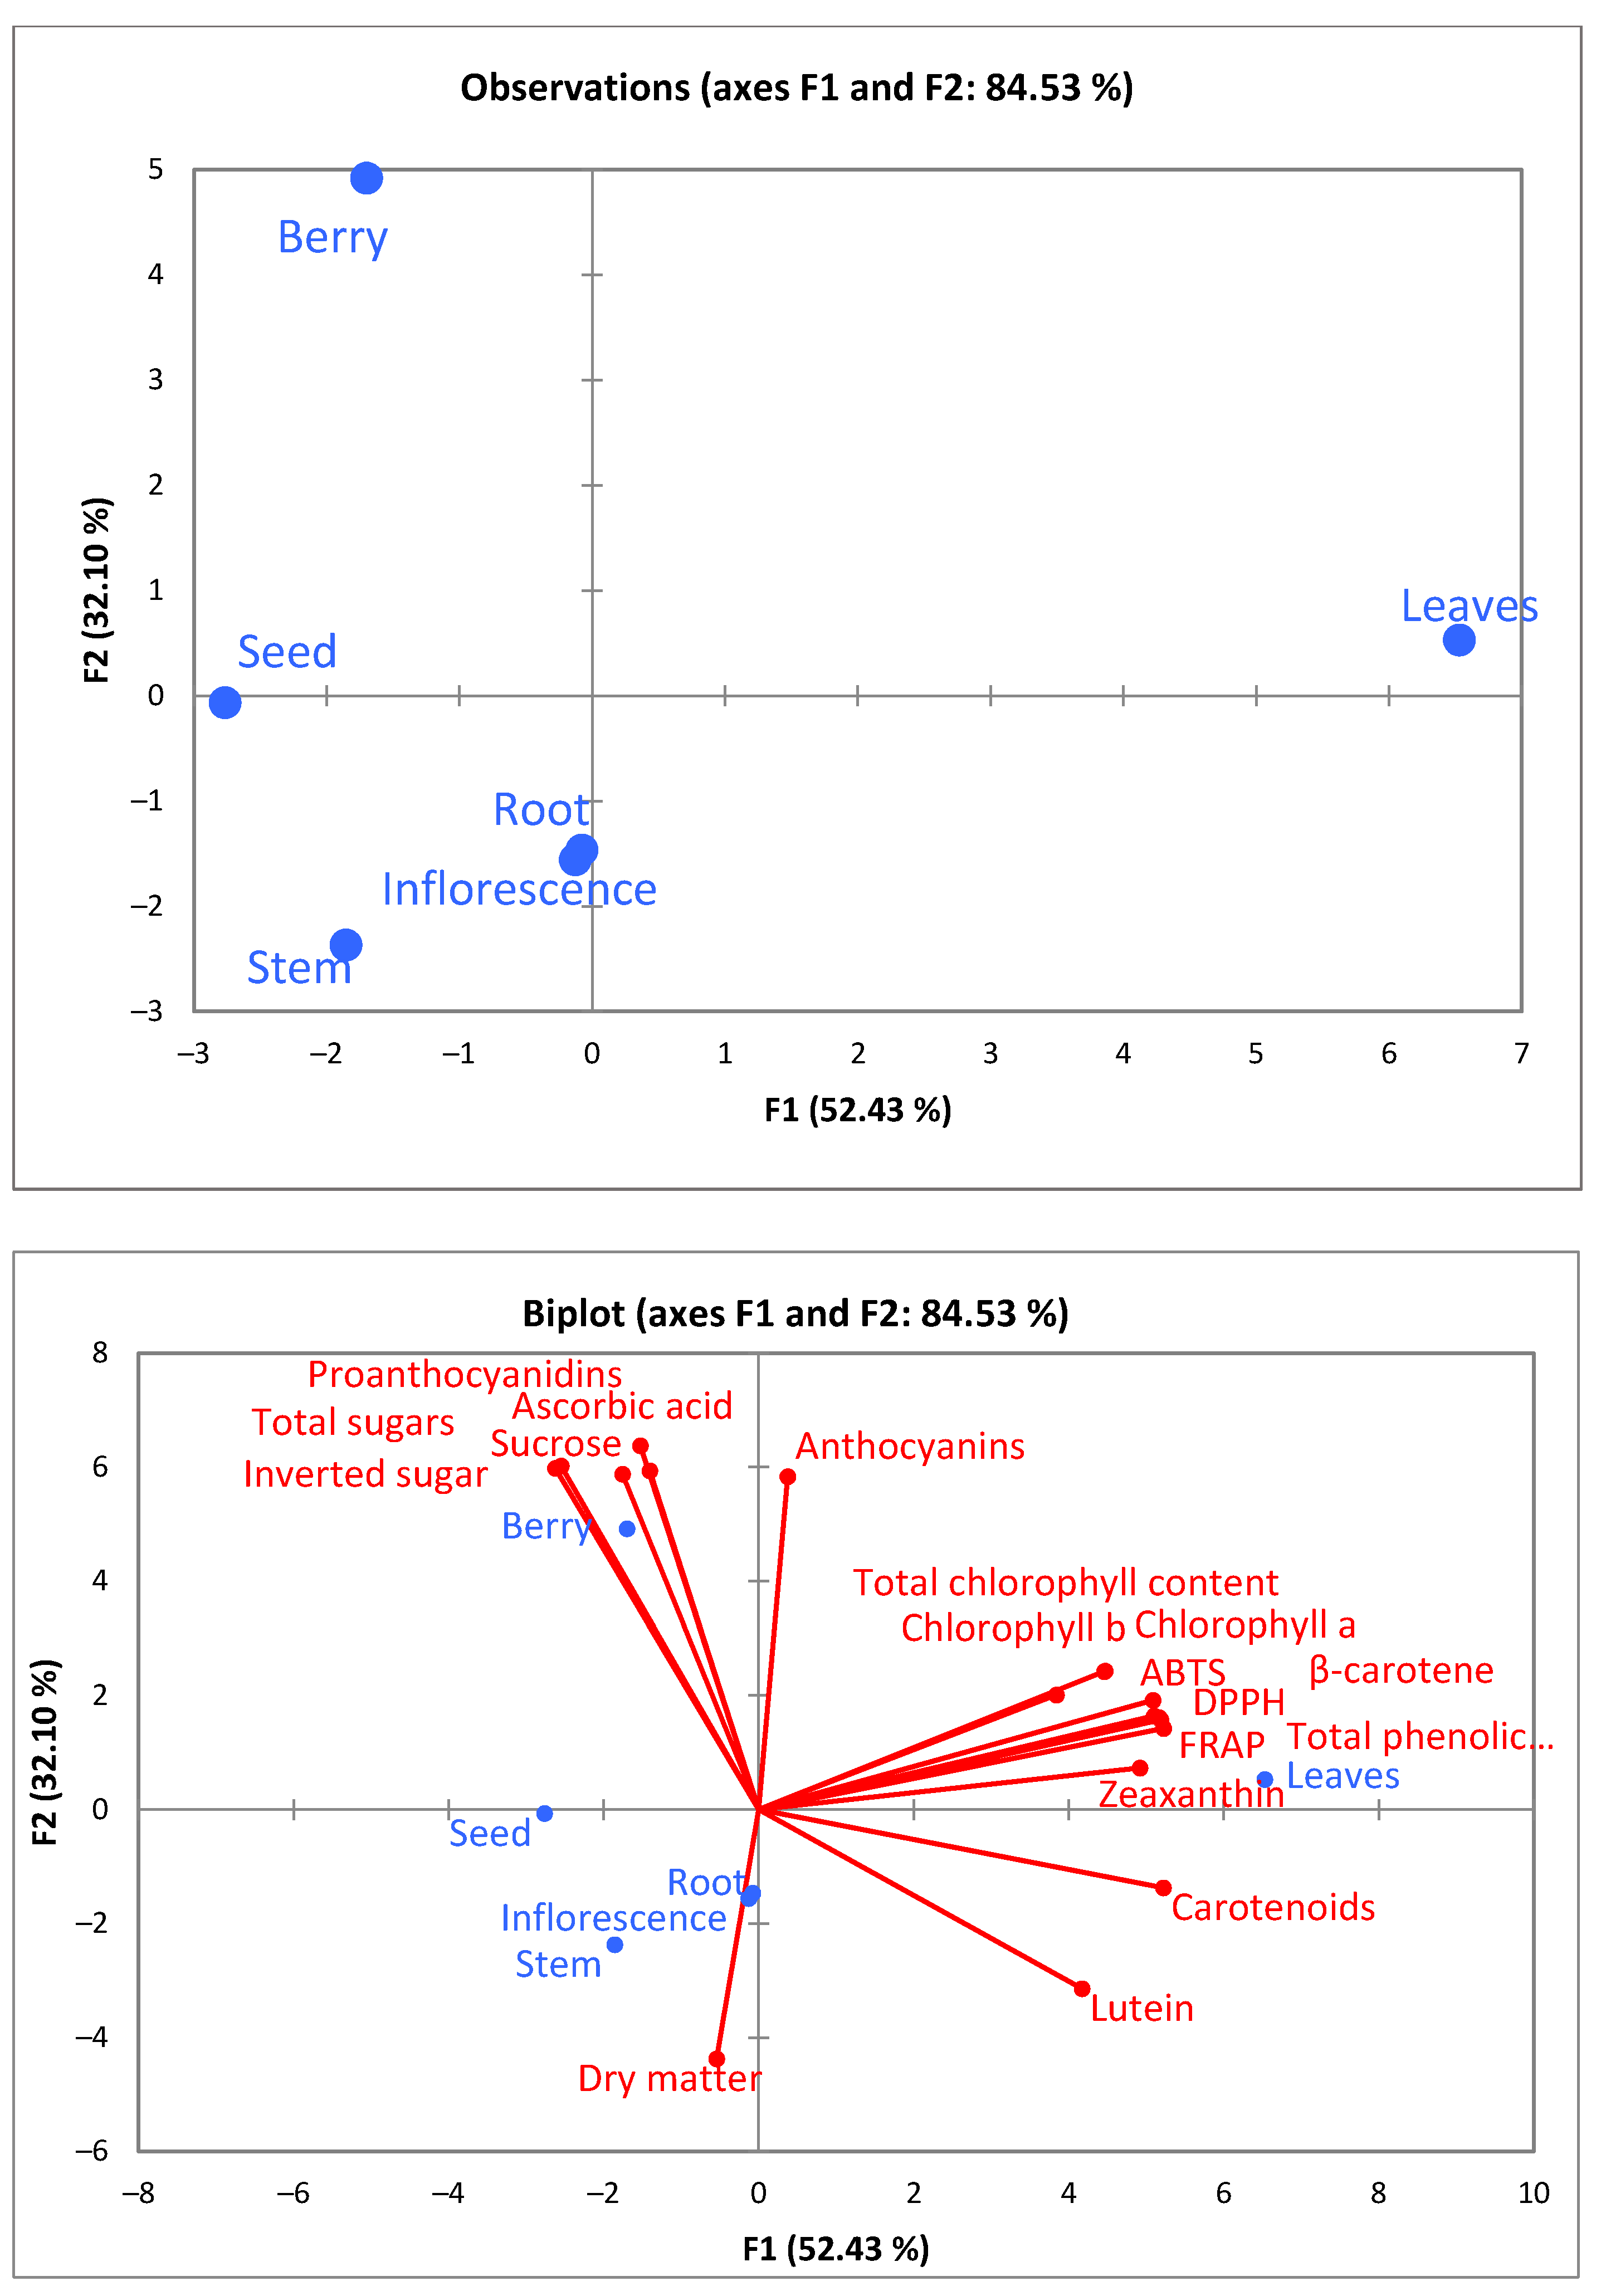
2.5. Principal Component Analysis (PCA) of A. cordata Morphological Parts
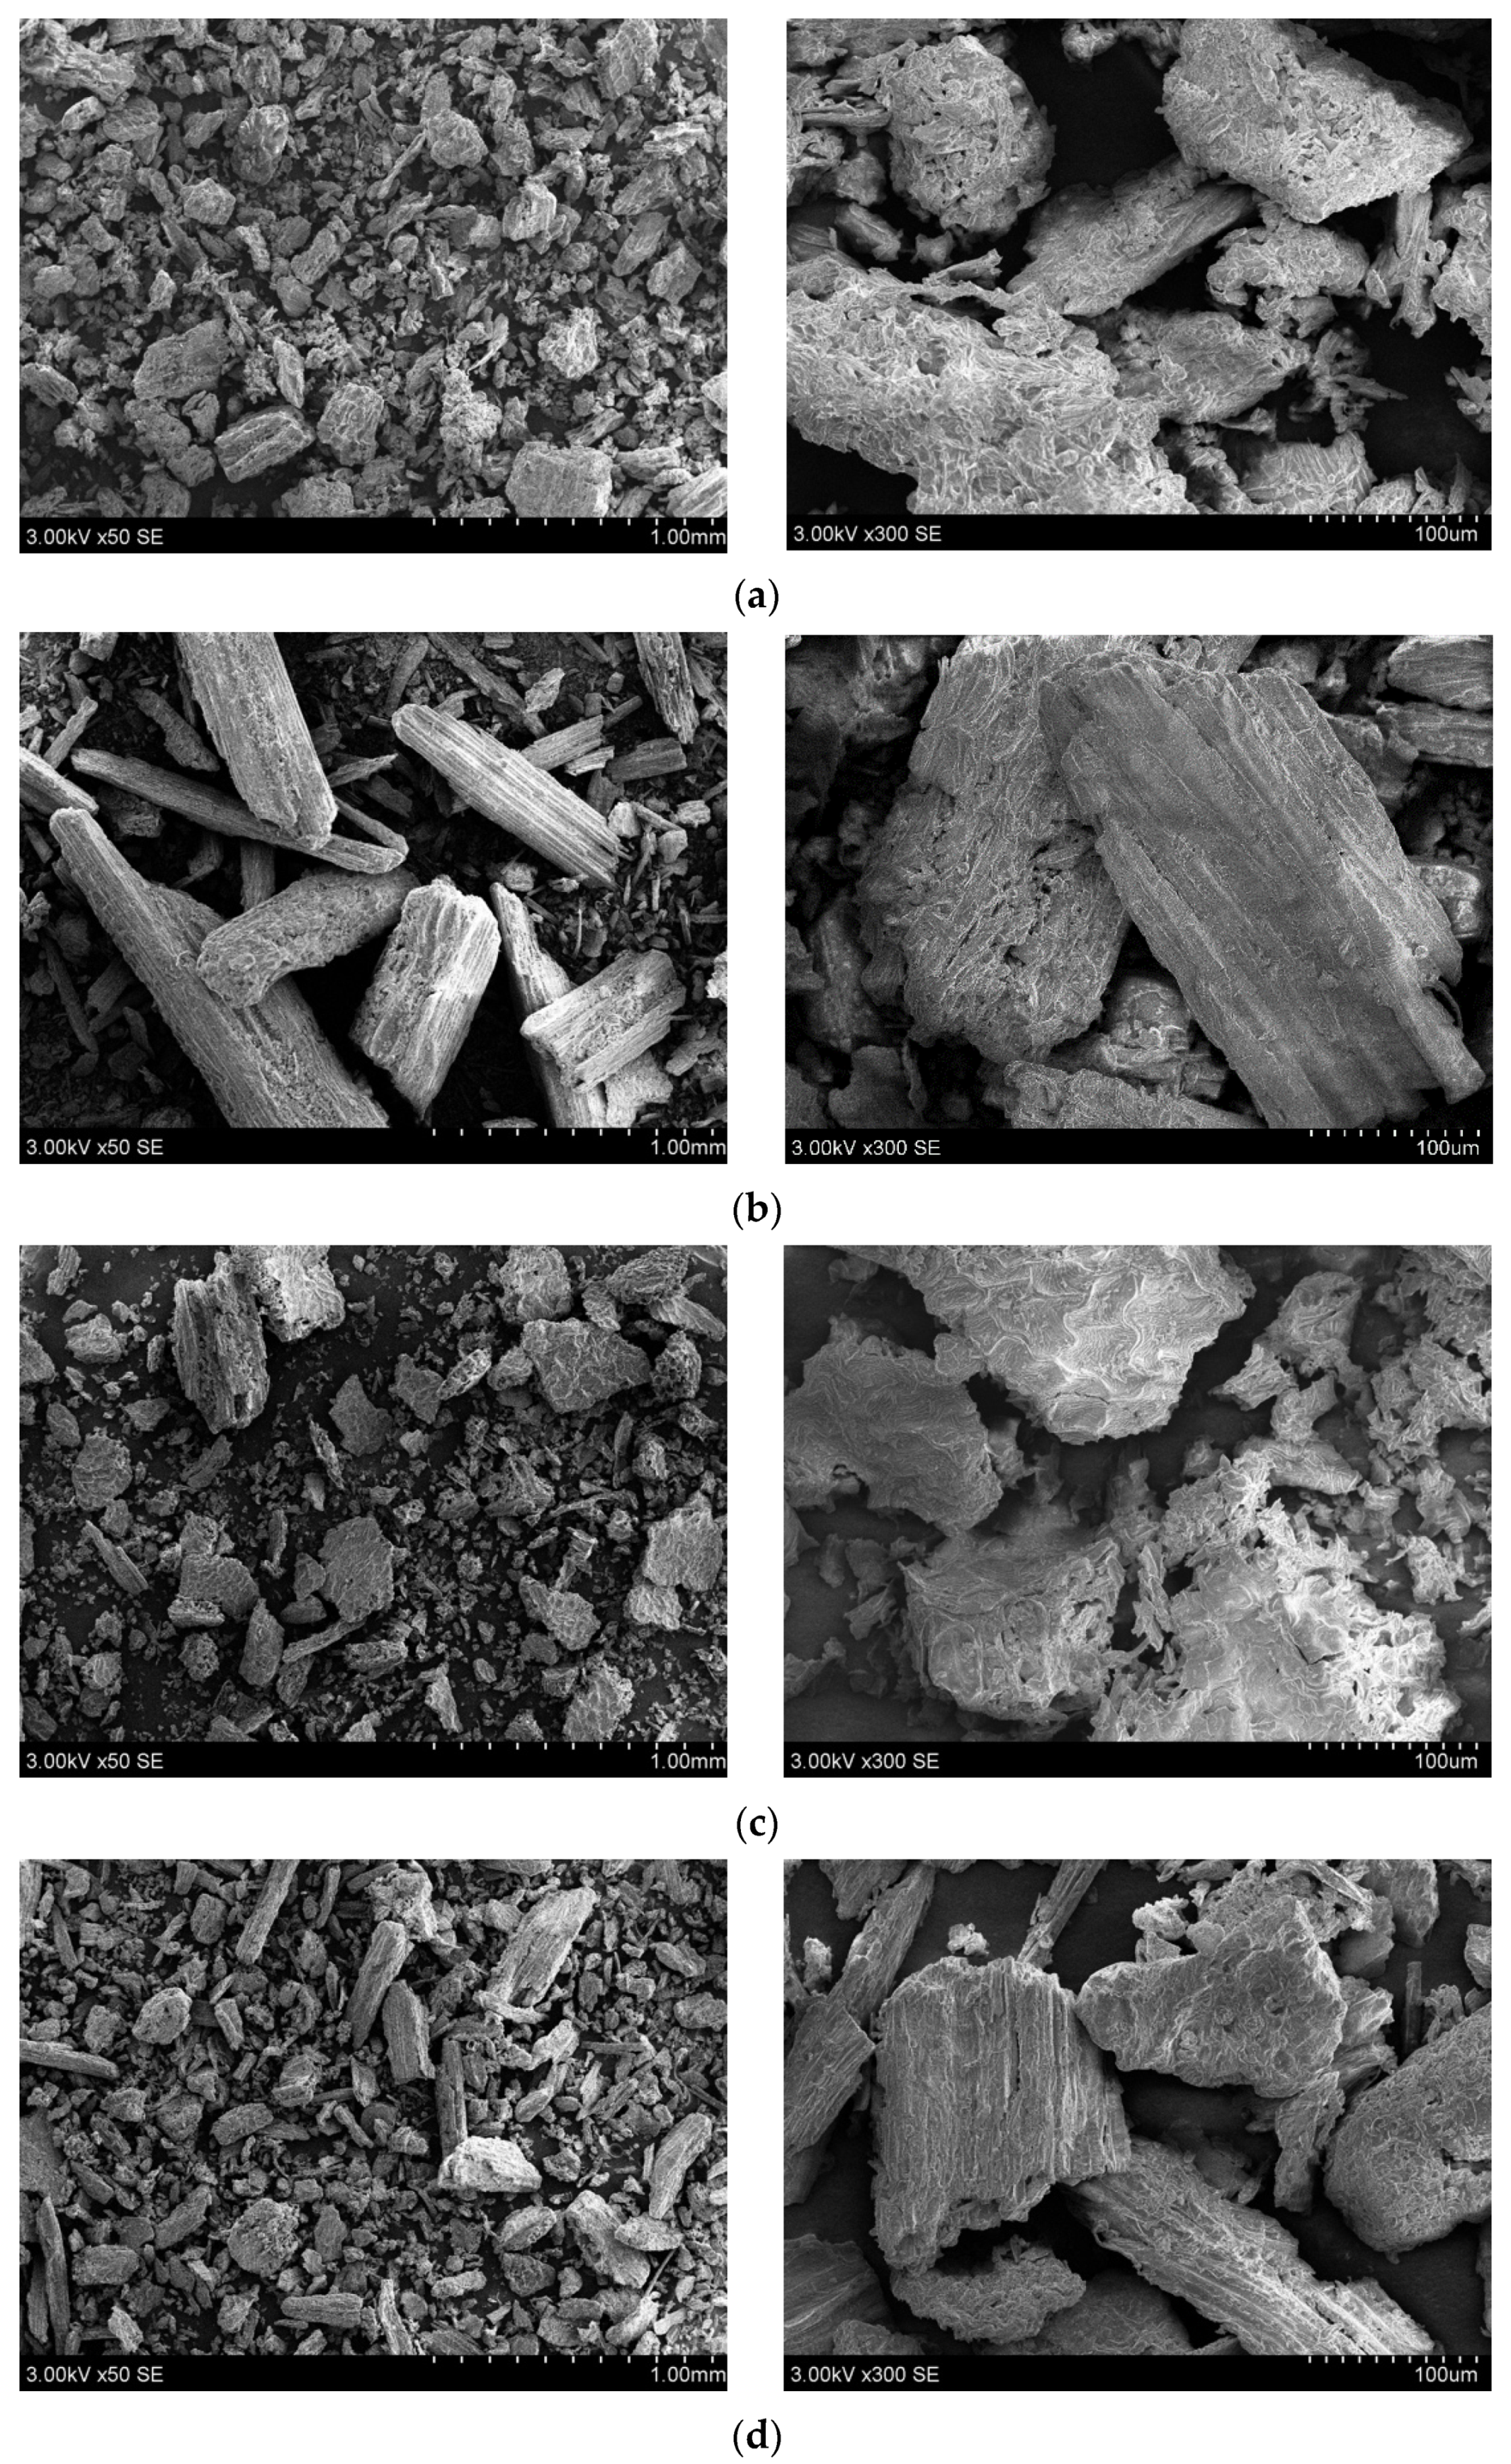
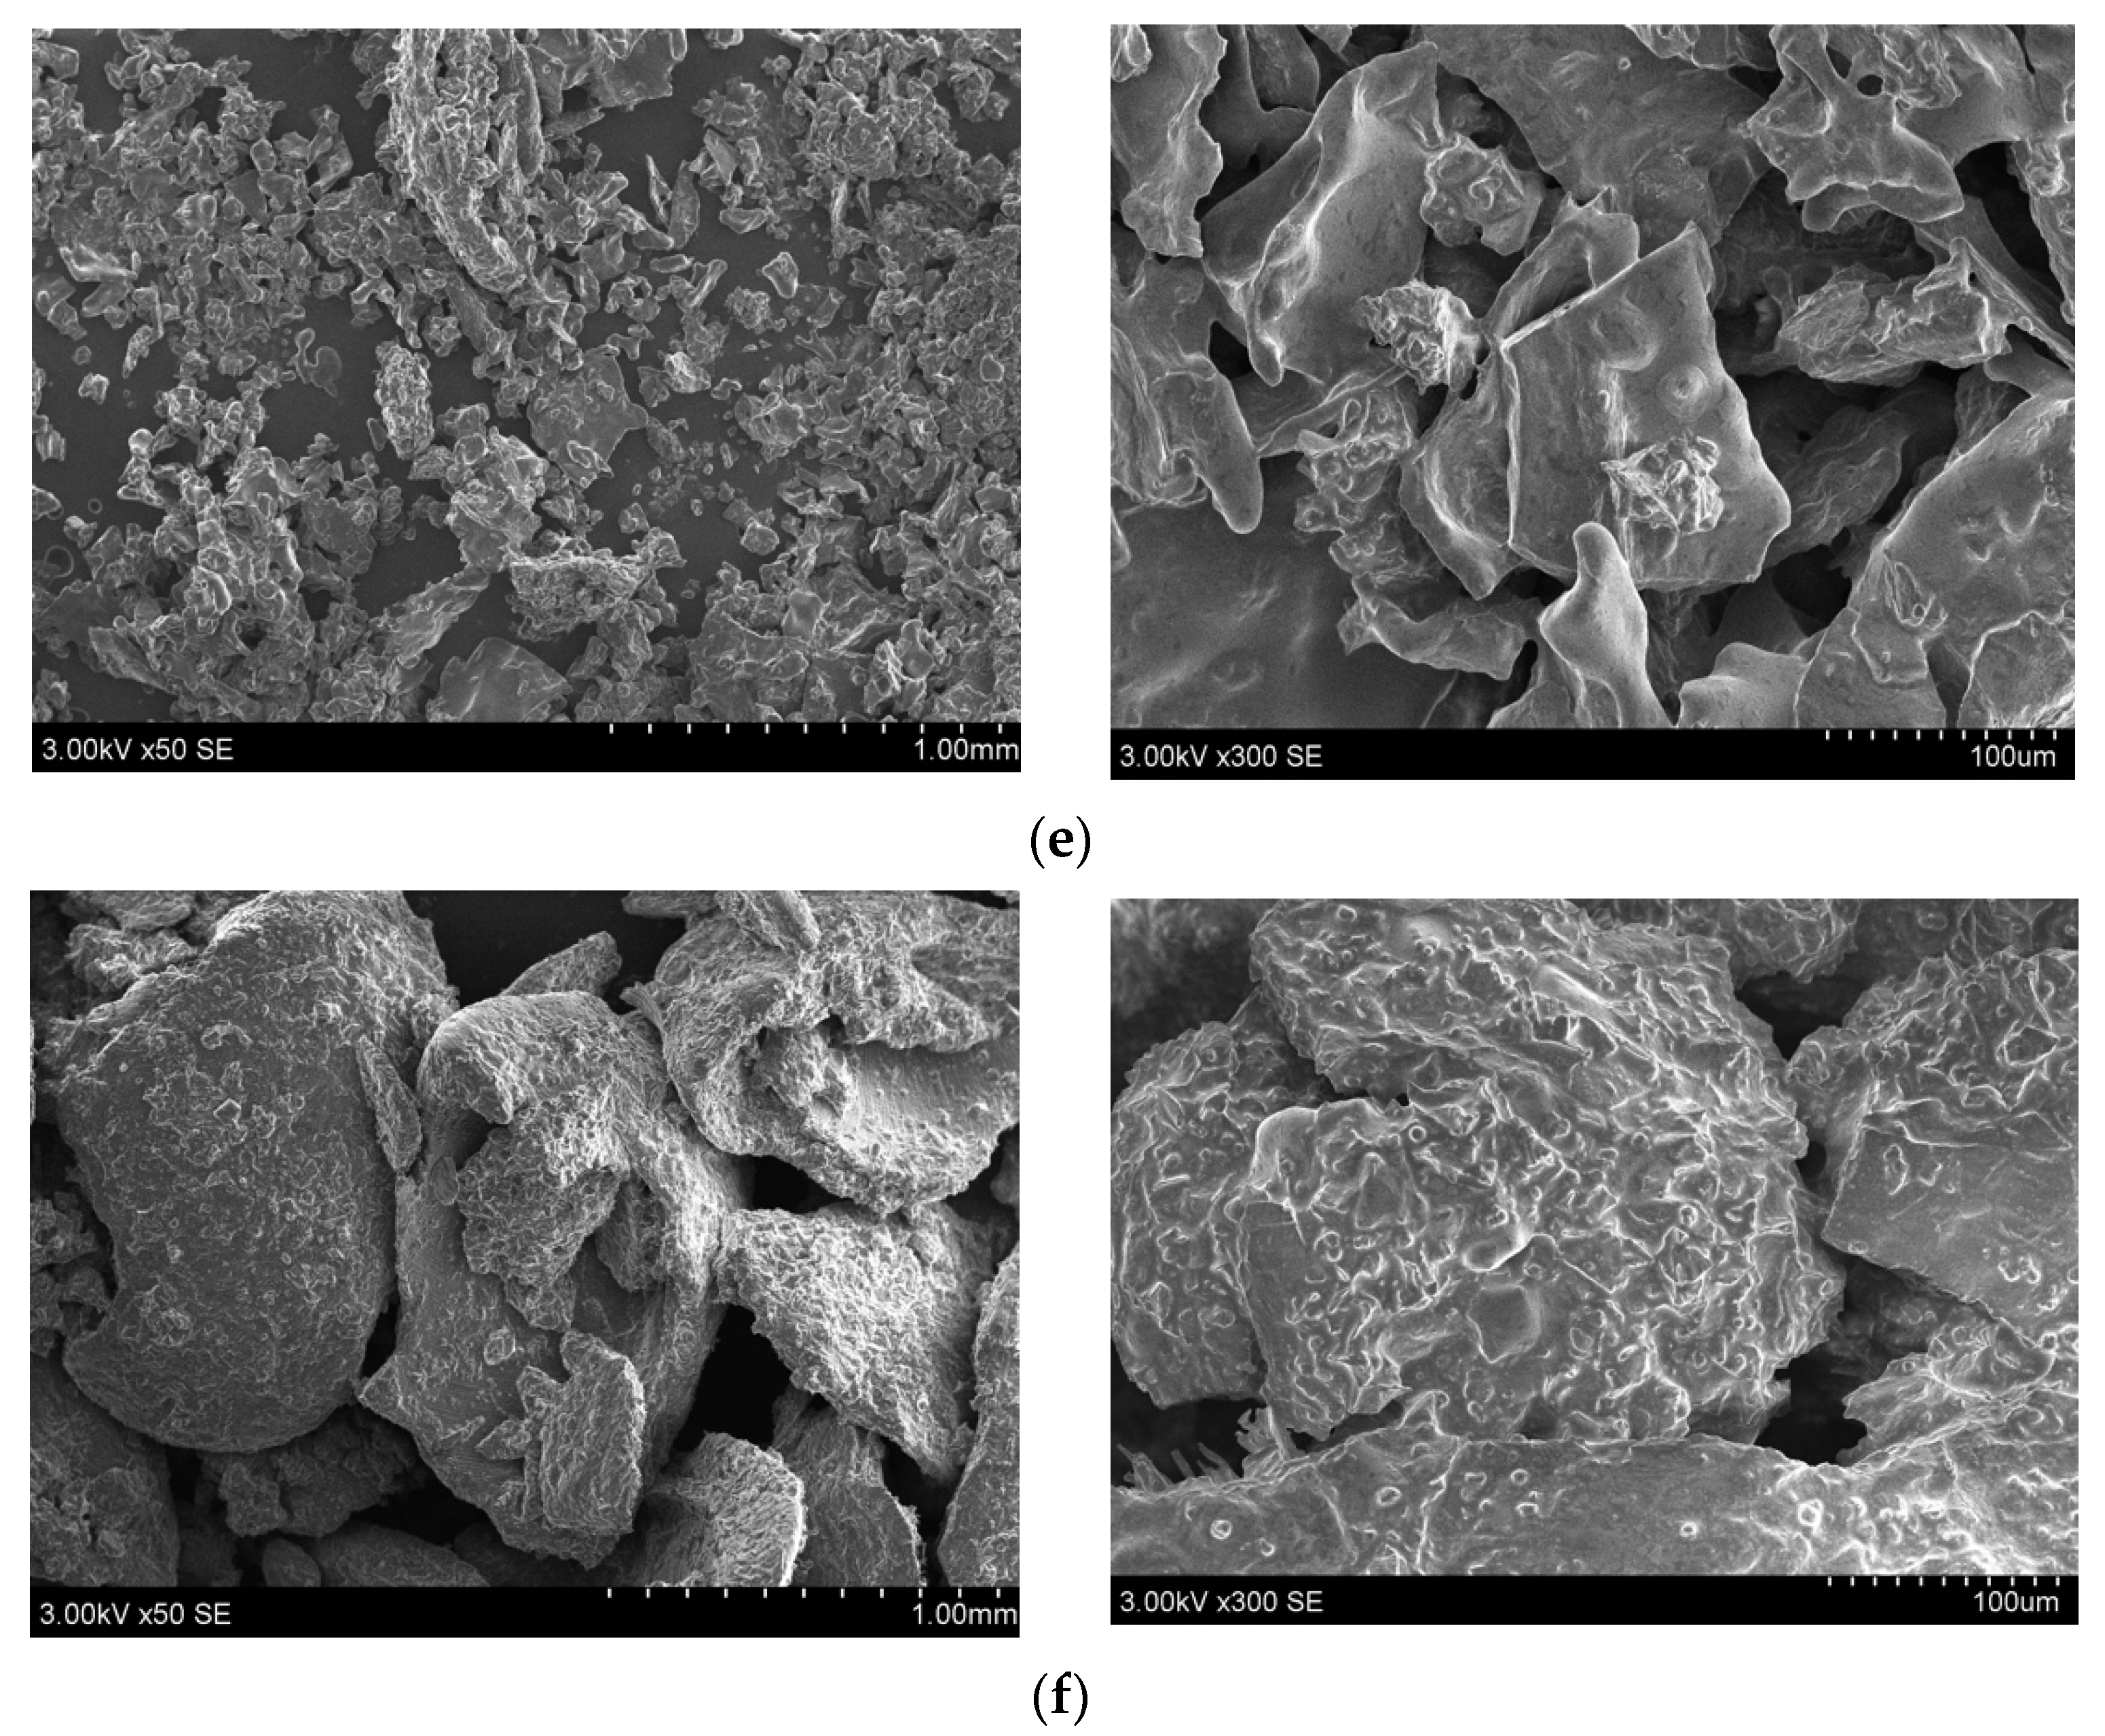
2.6. Scanning Electron Microscopy (SEM) Analysis
3. Materials and Methods
3.1. Chemicals
3.2. Plant Material
3.3. Extraction
3.4. The Determination of Dry Matter Content
3.5. The Determination of Ascorbic Acid
3.6. The Evaluation of Sugars
3.7. Measurment of Chlorophyll a and Chlorophyl b Content
3.8. Analysis of Carotenoids
3.9. Determination of Total Proanthocyanidin Content
3.10. Determination of Total Anthocyanin Content
3.11. Determination of Total Phenolic Content
3.12. Determination of Antioxidant Capacity
3.13. Evaluation of Color in Aralia cordata Different Motphological Parts
3.14. Scanning Electron Microscopy (SEM) Analysis
3.15. Statistical Analysis
4. Conclusions
Author Contributions
Funding
Institutional Review Board Statement
Informed Consent Statement
Data Availability Statement
Conflicts of Interest
References
- Hamburger, M.; Hostettmann, K. Bioactivity in plants: The link between phytochemistry and medicine. Phytochemistry 1991, 30, 3864–3874. [Google Scholar] [CrossRef]
- Shakya, A.K. Medicinal plants: Future source of new drugs. Int. J. Herb. Med. 2016, 4, 59–64. [Google Scholar]
- Wen, J. Generic delimitation of Aralia (Araliaceae). Brittonia 1993, 45, 47–55. [Google Scholar] [CrossRef]
- Perry, L.M.; Metzger, J. Medicinal Plants of East and South East Asia; MIT Press: Cambridge, UK, 1980. [Google Scholar]
- Kim, J.G.; Lee, J.W.; Le, T.P.L.; Han, J.S.; Kwon, H.; Lee, D.; Hong, J.T.; Kim, Y.; Lee, M.K.; Hwang, B.Y. Diterpenoids and diacetylenes from the roots of Aralia cordata with inhibitory effects on nitric oxide production. J. Nat. Prod. 2021, 84, 230–238. [Google Scholar] [CrossRef] [PubMed]
- Jain, N.; Goyal, S.; Ramawat, K. Evaluation of antioxidant properties and total phenolic content of medicinal plants used in diet therapy during postpartum healthcare in Rajasthan. Int. J. Pharm. Pharm. Sci. 2011, 3, 248–253. [Google Scholar]
- Olas, B.; Żuchowski, J.; Lis, B.; Skalski, B.; Kontek, B.; Grabarczyk, Ł.; Stochmal, A. Comparative chemical composition, antioxidant and anticoagulant properties of phenolic fraction (a rich in non-acylated and acylated flavonoids and non-polar compounds) and non-polar fraction from Elaeagnus rhamnoides (L.) A. Nelson fruits. Food Chem. 2018, 247, 39–45. [Google Scholar] [CrossRef]
- Li, H.; Wong, C.; Cheng, K.; Chen, F. Antioxidant properties in vitro and total phenolic contents in methanol extracts from medicinal plants. LWT-Food Sci. Technol. 2008, 3, 385–390. [Google Scholar] [CrossRef]
- Tapiero, H.; Tew, K.; Ba, G.N.; Mathe, G. Polyphenols: Do they play a role in the prevention of human pathologies? Biomed. Pharmacother. 2002, 56, 200–207. [Google Scholar] [CrossRef]
- Amarowicz, R.; Pegg, R.; Rahimi-Moghaddam, P.; Barl, B.; Weil, J. Free-radical scavenging capacity and antioxidant activity of selected plant species from the Canadian prairies. Food Chem. 2004, 84, 551–562. [Google Scholar] [CrossRef]
- Maisuthisakul, P.; Pasuk, S.; Ritthiruangdej, P. Relationship between antioxidant properties and chemical composition of some Thai plants. J. Food Compos. Anal. 2008, 21, 229–240. [Google Scholar] [CrossRef]
- Kim, Y.I.; Lee, H.S.; Kim, Y.K. The Chemical composition and ruminal dry matter digestibility of leaves stems, leaves, stems and roots of Aralia cordata Thunberg as a roughage sources. Korean J. Agricult. Sci. 1999, 26, 58–64. [Google Scholar]
- Peng, T.; Dong, X.; Deng, Y.; Tu, Y.; Li, X. Research on chemical ingredients of the root from cultivar Aralia cordata Thunb. J. Chin. Med. Mater. 2005, 28, 996–998. [Google Scholar]
- Hyun, S.; Jung, H.; Min, B.; Jung, J.; Choi, J. Isolation of phenolics, nucleosides, saccharides and an alkaloid from the root of Aralia cordata. Nat. Prod. Sci. 2010, 16, 20–25. [Google Scholar]
- Kim, M.O.; Lee, S.H.; Seo, J.H.; Kim, I.S.; Han, A.R.; Moon, D.O.; Cho, S.; Cui, L.; Kim, J.; Lee, H.S. Aralia cordata inhibits triacylglycerol biosynthesis in HepG2 cells. J. Med. Food 2013, 16, 1108–1114. [Google Scholar] [CrossRef] [PubMed] [Green Version]
- Okuyama, E.; NISHIMURA, S.; YAMAZAKI, M. Analgesic principles from Aralia cordata Thunb. Chem. Pharm. Bull. 1991, 39, 405–407. [Google Scholar] [CrossRef] [Green Version]
- Seo, C.; Li, G.; Kim, C.; Lee, C.; Jahng, Y.; Chang, H.; Son, J. Cytotoxic and DNA topoisomerases I and II inhibitory constituents from the roots of Aralia cordata. Arch. Pharm. Res. 2007, 30, 1404–1409. [Google Scholar] [CrossRef]
- Dang, N.H.; Zhang, X.; Zheng, M.; Son, K.H.; Chang, H.W.; Kim, H.P.; Bae, K.; Kang, S.S. Inhibitory constituents against cyclooxygenases from Aralia cordata Thunb. Arch. Pharm. Res. 2005, 28, 28–33. [Google Scholar] [CrossRef]
- Pu, L.; Tang, T.; Yuan, X.; Hou, D.; Wang, B. Study on essential oil constituents of Aralia cordata Thunb. from different habitats. Med. Plant 2010, 38, 8946–8948. [Google Scholar]
- Jung, H.A.; Lee, E.J.; Kim, J.S.; Kang, S.S.; Lee, J.; Min, B.; Choi, J.S. Cholinesterase and BACE1 inhibitory diterpenoids from Aralia cordata. Arch. Pharm. Res. 2009, 32, 1399–1408. [Google Scholar] [CrossRef]
- Cheng, W.; Lin, T.; Tseng, Y.; Chu, F.; Chueh, P.; Kuo, Y.; Wang, S. Inhibitory effect of human breast cancer cell proliferation via p21-mediated G1 cell cycle arrest by araliadiol isolated from Aralia cordata Thunb. Planta Med. 2011, 77, 164–168. [Google Scholar] [CrossRef] [Green Version]
- Lee, I.S.; Jin, W.Y.; Zhang, X.; Hung, T.M.; Song, K.S.; Seong, Y.H.; Bae, K. Cytotoxic and COX-2 inhibitory constituents from the aerial parts of Aralia cordata. Arch. Pharm. Res. 2006, 29, 548–555. [Google Scholar] [CrossRef] [PubMed]
- Jang, J.Y.; Seong, Y.H. Anti-nociceptive and anti-inflammatory effect of an ethanol extract of the leaf and stem of Aralia cordata. Nat. Prod. Sci. 2014, 20, 301–305. [Google Scholar]
- Cho, S.O.; Ban, J.Y.; Kim, J.Y.; Ju, H.S.; Lee, I.S.; Song, K.; Bae, K.; Seong, Y.H. Anti-ischemic activities of Aralia cordata and its active component, oleanolic acid. Arch. Pharm. Res. 2009, 32, 923–932. [Google Scholar] [CrossRef] [PubMed]
- Ganguly, B.; Kumar, N.; Ahmad, A.H.; Rastogi, S.K. Influence of phytochemical composition on in vitro antioxidant and reducing activities of Indian ginseng [Withania somnifera (L.) Dunal] root extracts. J. Ginseng Res. 2018, 42, 463–469. [Google Scholar] [CrossRef]
- Han, G.; Shin, D.; Jang, M. A study of the nutritional composition of Aralia continentalis Kitagawa and Aralia continentalis Kitagawa leaf. Korean J. Food Sci. Technol. 2008, 40, 680–685. [Google Scholar]
- Traveset, A.; F. Willson, M.; Verdú, M. Characteristics of fleshy fruits in southeast Alaska: Phylogenetic comparison with fruits from Illinois. Ecography 2004, 27, 41–48. [Google Scholar] [CrossRef]
- Palta, J.P. Leaf chlorophyll content. Remote Sens. Rev. 1990, 5, 207–213. [Google Scholar] [CrossRef]
- Mehdipoor Damiri, G.R.; Motamedzadegan, A.; Safari, R.; Shahidi, S.A.; Ghorbani, A. Evaluation of stability, physicochemical and antioxidant properties of extracted chlorophyll from Persian clover (Trifolium resupinatum L.). Food Meas. 2021, 155, 327–340. [Google Scholar] [CrossRef]
- Ferruzzi, M.G.; Blakeslee, J. Digestion, absorption, and cancer preventative activity of dietary chlorophyll derivatives. Nutr. Res. 2007, 27, 1–12. [Google Scholar] [CrossRef]
- Vaňková, K.; Marková, I.; Jašprová, J.; Dvořák, A.; Subhanová, I.; Zelenka, J.; Novosádová, I.; Rasl, J.; Vomastek, T.; Sobotka, R. Chlorophyll-mediated changes in the redox status of pancreatic cancer cells are associated with its anticancer effects. Oxidative Med. Cell. Longev. 2018, 2, 4069167. [Google Scholar] [CrossRef] [Green Version]
- Proctor, J.T.; Sullivan, A.J.; Rupasinghe, V.P.; Jackson, C.J. Morphological and ginsenoside differences among North American ginseng leaves. J. Ginseng Res. 2011, 35, 155–161. [Google Scholar] [CrossRef] [PubMed] [Green Version]
- Jang, I.B.; Lee, D.Y.; Yu, J.; Park, H.W.; Mo, H.S.; Park, K.C.; Hyun, D.Y.; Lee, E.H.; Kim, K.H.; Oh, C.S. Photosynthesis rates, growth, and ginsenoside contents of 2-yr-old Panax ginseng grown at different light transmission rates in a greenhouse. J. Ginseng Res. 2015, 39, 345–353. [Google Scholar] [CrossRef] [PubMed] [Green Version]
- Tungmunnithum, D.; Thongboonyou, A.; Pholboon, A.; Yangsabai, A. Flavonoids and other phenolic compounds from medicinal plants for pharmaceutical and medical aspects: An overview. Medicines 2018, 5, 93. [Google Scholar] [CrossRef]
- Prinsloo, G.; Nogemane, N. The effects of season and water availability on chemical composition, secondary metabolites and biological activity in plants. Phytochem. Rev. 2018, 17, 889–902. [Google Scholar] [CrossRef]
- Załuski, D.; Smolarz, H.D.; Gawlik-Dziki, U. Bioactive compounds and antioxidative, antileukemic and anti-MMPs activity of Eleutherococcus species cultivated in Poland. Nat. Prod. Commun. 2012, 7, 1483–1486. [Google Scholar] [CrossRef] [Green Version]
- Qi, M.; Hua, X.; Peng, X.; Yan, X.; Lin, J. Comparison of chemical composition in the buds of Aralia elata from different geographical origins of China. R. Soc. Open Sci. 2018, 5, 180676. [Google Scholar] [CrossRef] [Green Version]
- Jung, C.; Seog, H.; Choi, I.; Park, M.; Cho, H. Antioxidant properties of various solvent extracts from wild ginseng leaves. LWT-Food Sci. Technol. 2006, 39, 266–274. [Google Scholar] [CrossRef]
- Hassanpour, S.; MaheriSis, N.; Eshratkhah, B. Plants and secondary metabolites (Tannins): A Review. Int. J. Life Sci. 2011, 1, 47–53. [Google Scholar]
- Lee, J.; Durst, R.W.; Wrolstad, R.E. Determination of total monomeric anthocyanin pigment content of fruit juices, beverages, natural colorants, and wines by the pH differential method: Collaborative study. J. AOAC Int. 2005, 88, 1269–1278. [Google Scholar] [CrossRef] [Green Version]
- Tsuda, T. Dietary anthocyanin-rich plants: Biochemical basis and recent progress in health benefits studies. Mol. Nutr. Food Res. 2012, 56, 159–170. [Google Scholar] [CrossRef]
- Kay, C.D.; Pereira-Caro, G.; Ludwig, I.A.; Clifford, M.N.; Crozier, A. Anthocyanins and flavanones are more bioavailable than previously perceived: A review of recent evidence. Ann. Rev. Food Sci. Technol. 2017, 8, 155–180. [Google Scholar] [CrossRef] [PubMed]
- He, J.; Giusti, M.M. Anthocyanins: Natural colorants with health-promoting properties. Ann. Rev. Food Sci. Technol. 2010, 1, 163–187. [Google Scholar] [CrossRef] [PubMed]
- Prior, R. Absorption and metabolism of anthocyanins: Potential health effects. In Phytochemicals: Mechanism of Action, 1st ed.; Meskin, M.S., Bidlack, W.R., Davies, A.J., Lewis, D.S., Randolph, R.K., Eds.; CRC Press: Boca Raton, FL, USA, 2003; pp. 1–16. [Google Scholar]
- Cassidy, A. Berry anthocyanin intake and cardiovascular health. Mol. Asp. Med. 2018, 61, 76–82. [Google Scholar] [CrossRef] [Green Version]
- Tian, Y.; Zhang, X.; Liu, H.; Gong, D.; Li, X. Comparison of the nutritional and phytochemical composition and antioxidant activities of Aralia elata (Miq.) Seem fruits in Northeast China. Arab. J. Chem. 2021, 14, 103448. [Google Scholar] [CrossRef]
- Chen, L.; Xin, X.; Feng, H.; Li, S.; Cao, Q.; Wang, X.; Vriesekoop, F. Isolation and identification of anthocyanin component in the fruits of Acanthopanax sessiliflorus (Rupr. & Maxim.) seem. by means of high speed counter current chromatography and evaluation of its antioxidant activity. Molecules 2020, 25, 1781. [Google Scholar]
- Smeriglio, A.; Barreca, D.; Bellocco, E.; Trombetta, D. Proanthocyanidins and hydrolysable tannins: Occurrence, dietary intake and pharmacological effects. Br. J. Pharmacol. 2017, 174, 1244–1262. [Google Scholar] [CrossRef] [Green Version]
- Ghosh, D. Tannins from foods to combat diseases. Int. J. Pharm. Res. Rev. 2015, 4, 40–44. [Google Scholar]
- Sharma, K.; Kumar, V.; Kaur, J.; Tanwar, B.; Goyal, A.; Sharma, R.; Gat, Y.; Kumar, A. Health effects, sources, utilization and safety of tannins: A critical review. Toxin Rev. 2019, 40, 432–444. [Google Scholar] [CrossRef]
- Dutta, D.; Chaudhuri, U.R.; Chakraborty, R. Structure, health benefits, antioxidant property and processing and storage of carotenoids. Afr. J. Biotechnol. 2005, 4, 1510–1520. [Google Scholar] [CrossRef]
- Rubinskienė, M.; Viškelis, P.; Dambrauskienė, E.; Viškelis, J.; Karklelienė, R. Effect of drying methods on the chemical composition and colour of peppermint (Mentha× piperita L.) leaves. Zemdirbyste-Agriculture 2015, 102, 223–228. [Google Scholar] [CrossRef] [Green Version]
- Saini, R.K.; Nile, S.H.; Park, S.W. Carotenoids from fruits and vegetables: Chemistry, analysis, occurrence, bioavailability and biological activities. Food Res. Int. 2015, 76, 735–750. [Google Scholar] [CrossRef] [PubMed]
- Langi, P.; Kiokias, S.; Varzakas, T.; Proestos, C. Carotenoids: From plants to food and feed industries. Methods Mol. Biol. 2018, 1852, 57–71. [Google Scholar] [PubMed]
- Arain, M.A.; Mei, Z.; Hassan, F.; Saeed, M.; Alagawany, M.; Shar, A.; Rajput, I. Lycopene: A natural antioxidant for prevention of heat-induced oxidative stress in poultry. World’s Poult. Sci. J. 2018, 74, 89–100. [Google Scholar] [CrossRef]
- Guerin, M.; Huntley, M.E.; Olaizola, M. Haematococcus astaxanthin: Applications for human health and nutrition. Trends Biotechnol. 2003, 21, 210–216. [Google Scholar] [CrossRef]
- Lauretani, F.; Semba, R.D.; Dayhoff-Brannigan, M.; Corsi, A.M.; Di Iorio, A.; Buiatti, E.; Bandinelli, S.; Guralnik, J.M.; Ferrucci, L. Low total plasma carotenoids are independent predictors of mortality among older persons. Eur. J. Nutr. 2008, 47, 335–340. [Google Scholar] [CrossRef] [PubMed] [Green Version]
- Nabi, F.; Arain, M.; Rajput, N.; Alagawany, M.; Soomro, J.; Umer, M.; Soomro, F.; Wang, Z.; Ye, R.; Liu, J. Health benefits of carotenoids and potential application in poultry industry: A review. J. Anim. Physiol. Anim. Nutr. 2020, 104, 1809–1818. [Google Scholar] [CrossRef]
- Belin, M.A.F.; Gendron, F.; Cheng, S.; Ziffle, V. Total phenolic compounds, carotenoids and in vitro antioxidant activity of three traditional indigenous medicinal plants of Saskatchewan, Canada. Am. J. Plant Sci. 2021, 12, 1197–1209. [Google Scholar] [CrossRef]
- Othman, R.; Halim, S.; Mohd, H.; Farah, A.; Jamaludin, M. Carotenoid content and composition in 20 medicinal plant species of traditional Malay Midwifery postnatal bath. J. Pharm. Nutr. Sci. 2017, 7, 193–197. [Google Scholar] [CrossRef]
- Mitra, S.; Rauf, A.; Tareq, A.M.; Jahan, S.; Emran, T.B.; Shahriar, T.G.; Dhama, K.; Alhumaydhi, F.A.; Aljohani, A.S.; Rebezov, M. Potential health benefits of carotenoid lutein: An updated review. Food Chem. Toxicol. 2021, 154, 112328. [Google Scholar] [CrossRef]
- García-Sánchez, A.; Miranda-Díaz, A.G.; Cardona-Muñoz, E.G. The role of oxidative stress in physiopathology and pharmacological treatment with pro-and antioxidant properties in chronic diseases. Oxidative Med. Cell. Longev. 2020, 2020, 2082145. [Google Scholar] [CrossRef]
- Prior, R.L.; Wu, X.; Schaich, K. Standardized methods for the determination of antioxidant capacity and phenolics in foods and dietary supplements. J. Agric. Food Chem. 2005, 53, 4290–4302. [Google Scholar] [CrossRef] [PubMed]
- Alam, M.N.; Bristi, N.J.; Rafiquzzaman, M. Review on in vivo and in vitro methods evaluation of antioxidant activity. Saudi Pharm. J. 2013, 21, 143–152. [Google Scholar] [CrossRef] [PubMed] [Green Version]
- Schlesier, K.; Harwat, M.; Böhm, V.; Bitsch, R. Assessment of antioxidant activity by using different in vitro methods. Free Radic. Res. 2002, 36, 177–187. [Google Scholar] [CrossRef] [PubMed]
- Feduraev, P.; Chupakhina, G.; Maslennikov, P.; Tacenko, N.; Skrypnik, L. Variation in phenolic compounds content and antioxidant activity of different plant organs from Rumex crispus L. and Rumex obtusifolius L. at different growth stages. Antioxidants 2019, 8, 237. [Google Scholar] [CrossRef] [PubMed] [Green Version]
- Ryu, H.; Jung, C.; Beik, G. Antioxidant activities of flower, berry and leaf of Panax ginseng C. A. Meyer. Korean J. Food Sci. Technol. 2020, 52, 342–349. [Google Scholar]
- Nowacka, M.; Dadan, M.; Janowicz, M.; Wiktor, A.; Witrowa-Rajchert, D.; Mandal, R.; Pratap-Singh, A.; Janiszewska-Turak, E. Effect of nonthermal treatments on selected natural food pigments and color changes in plant material. Compr. Rev. Food Sci. Food Saf. 2021, 20, 5097–5144. [Google Scholar] [CrossRef]
- Różyło, R. Recent trends in methods used to obtain natural food colorants by freeze-drying. Trends Food Sci. Technol. 2020, 102, 39–50. [Google Scholar] [CrossRef]
- Bencheikh, N.; Elbouzidi, A.; Kharchoufa, L.; Ouassou, H.; Alami Merrouni, I.; Mechchate, H.; Es-Safi, I.; Hano, C.; Addi, M.; Bouhrim, M. Inventory of medicinal plants used traditionally to manage kidney diseases in North-Eastern Morocco: Ethnobotanical fieldwork and pharmacological evidence. Plants 2021, 10, 1966. [Google Scholar] [CrossRef]
- Zhao, X.; Du, F.; Zhu, Q.; Qiu, D.; Yin, W.; Ao, Q. Effect of superfine pulverization on properties of Astragalus membranaceus powder. Powder Technol. 2010, 203, 620–625. [Google Scholar] [CrossRef]
- Kunzek, H.; Müller, S.; Vetter, S.; Godeck, R. The significance of physico chemical properties of plant cell wall materials for the development of innovative food products. Eur. Food Res. Technol. 2002, 214, 361–376. [Google Scholar] [CrossRef]
- Balciunaitiene, A.; Viskelis, P.; Viskelis, J.; Streimikyte, P.; Liaudanskas, M.; Bartkiene, E.; Zavistanaviciute, P.; Zokaityte, E.; Starkute, V.; Ruzauskas, M. Green synthesis of silver nanoparticles using extract of Artemisia absinthium L., Humulus lupulus L. and Thymus vulgaris L., physico-chemical characterization, antimicrobial and antioxidant activity. Processes 2021, 9, 1304. [Google Scholar] [CrossRef]
- Meier, U. Growth Stages of Mono- and Dicotyledonous Plants: BBCH Monograph; Meier, U., Ed.; Julius Kühn-Institut: Quedlinburg, Germany, 2018. [Google Scholar]
- AOAC. Association of Official Analytical Chemists. Vitamins and other nutrients. In Official Methods of Analysis, 15th ed.; Helrich, K., Ed.; Association of Analytical Chemist Inc.: Washington, DC, USA, 1990. [Google Scholar]
- AOAC. Sucrose in fruits and fruit products. In Official Methods of Analysis, 15th ed.; Helrich, K., Ed.; Association of Analytical Chemist Inc.: Washington, DC, USA, 1990. [Google Scholar]
- Lichtenthaler, H.K.; Buschmann, C. Chlorophylls and carotenoids: Measurement and characterization by UV-VIS spectroscopy. Curr. Protoc. Food Anal. Chem. 2001, 1, F4.3.1–F4.3.8. [Google Scholar] [CrossRef]
- Tolpeznikaite, E.; Bartkevics, V.; Ruzauskas, M.; Pilkaityte, R.; Viskelis, P.; Urbonaviciene, D.; Zavistanaviciute, P.; Zokaityte, E.; Ruibys, R.; Bartkiene, E. Characterization of macro-and microalgae extracts bioactive compounds and micro-and macroelements transition from algae to extract. Foods 2021, 10, 2226. [Google Scholar] [CrossRef] [PubMed]
- Bobinaitė, R.; Kraujalis, P.; Tamkutė, L.; Urbonavičienė, D.; Viškelis, P.; Venskutonis, P.R. Recovery of bioactive substances from rowanberry pomace by consecutive extraction with supercritical carbon dioxide and pressurized solvents. J. Ind. Eng. Chem. 2020, 85, 152–160. [Google Scholar] [CrossRef]
- Heil, M.; Baumann, B.; Andary, C.; Linsenmair, E.K.; McKey, D. Extraction and quantification of" condensed tannins" as a measure of plant anti-herbivore defence? Revisiting an old problem. Naturwissenschaften 2002, 89, 519–524. [Google Scholar] [CrossRef] [PubMed]
- Giusti, M.; Wrolstad, R. Anthocyanins. Characterization and measurement with UV-visible spectroscopy. Curr. Protoc. Food Anal. Chem. 2001, 1, 1–13. [Google Scholar] [CrossRef]
- Singleton, V.L.; Orthofer, R.; Lamuela-Raventós, R.M. Analysis of total phenols and other oxidation substrates and antioxidants by means of Folin-Ciocalteu reagent. Meth. Enzymol. 1999, 299, 152–178. [Google Scholar]
- Re, R.; Pellegrini, N.; Proteggente, A.; Pannala, A.; Yang, M.; Rice-Evans, C. Antioxidant activity applying an improved ABTS radical cation decolorization assay. Free. Radic. Biol. Med. 1999, 26, 1231–1237. [Google Scholar] [CrossRef]
- Brand-Williams, W.; Cuvelier, M.; Berset, C. Use of a free radical method to evaluate antioxidant activity. LWT-Food Sci. Technol. 1995, 28, 25–30. [Google Scholar] [CrossRef]
- Viskelis, P.; Rubinskiene, M.; Bobinaite, R.; Dambrauskiene, E. Bioactive compounds and antioxidant activity of small fruits in Lithuania. J. Food Agric. Environ. 2010, 8, 259–263. [Google Scholar]
- Benzie, I.F.; Strain, J.J. The ferric reducing ability of plasma (FRAP) as a measure of “antioxidant power”: The FRAP assay. Anal. Biochem. 1996, 239, 70–76. [Google Scholar] [CrossRef] [PubMed] [Green Version]
- Luksiene, Z.; Buchovec, I.; Kairyte, K.; Paskeviciute, E.; Viskelis, P. High-power pulsed light for microbial decontamination of some fruits and vegetables with different surfaces. J. Food Agric. Environ. 2012, 10, 162–167. [Google Scholar]


| Morphological Parts | Dry Matters, % | Invert Sugar, % DW | Sucrose, % DW | Total Sugars, % DW | Ascorbic Acid, mg/100 g DW |
|---|---|---|---|---|---|
| Root | 92.4 ± 0.08 b | 4.8 ± 0.09 b | 0.8 ± 0.04 a | 5.7 ± 0.10 a | 22.3 ± 1.02 a |
| Stem | 97.6 ± 0.05 f | 6.9 ± 0.08 c | 2.6 ± 0.06 c | 9.6 ± 0.09 c | 66.4 ± 1.02 b |
| Leaf | 94.4 ± 0.11 d | 4.3 ± 0.06 a | 2.6 ± 0.08 c | 6.9 ± 0.05 b | 64.2 ± 0.47 b |
| Inflorescence | 93.3 ± 0.09 c | 10.2 ± 0.03 d | 1.3 ± 0.03 b | 11.5 ± 0.05 d | 67.2 ± 1.77 b |
| Berry | 90.9 ± 0.14 a | 44.2 ± 0.02 f | 6.5 ± 0.02 e | 50.8 ± 0.02 f | 146.0 ± 0.95 d |
| Seed | 96.0 ± 0.11 e | 24.1 ± 0.05 e | 4.5 ± 0.05 d | 28.6 ± 0.05 e | 76.8 ± 1.15 c |
| Morphological Parts | Total Chlorophyll Content, mg/g DW | Chlorophyll a Content, mg/g DW | Chlorophyll b Content, mg/g DW |
|---|---|---|---|
| Stem | 0.22 ± 0.011 a | 0.05 ± 0.002 a | 0.26 ± 0.012 b |
| Leaf | 7.45 ± 0.071 c | 6.86 ± 0.061 c | 0.59 ± 0.024 c |
| Inflorescence | 0.59 ± 0.023 b | 0.50 ± 0.017 b | 0.08 ± 0.003 a |
| Morphological Parts | Phenolics, mg/100 g DW | Anthocyanins, mg/100 g DW | Proanthocyanidins, mg/100 g DW |
|---|---|---|---|
| Root | 673.01 ± 12.147 b | nd | nd |
| Stem | 333.79 ± 9.905 a | 20.34 ± 0.813 b | 0.03 ± 0.001 a |
| Leaf | 2328.31 ± 47.269 e | nd | 0.06 ± 0.002 b |
| Inflorescence | 1084.18 ± 36.937 d | nd | 0.05 ± 0.002 ab |
| Berry | 913.21 ± 38.588 c | 78.54 ± 1.124 c | 0.28 ± 0.011 d |
| Seed | 356.42 ± 4.521 a | 18.27 ± 0.303 a | 0.10 ± 0.001 c |
| Morphological Parts | Carotenoids, mg/g DW | Lutein, mg/g DW | Zeaxanthin, mg/g DW | β-Carotene, mg/g DW |
|---|---|---|---|---|
| Stem | 0.244 ± 0.0122 b | 0.128 ± 0.0065 b | 0.081 ± 0.0021 b | 0.035 ± 0.0016 c |
| Leaf | 0.812 ± 0.0406 d | 0.291 ± 0.0047 d | 0.195 ± 0.0051 d | 0.221 ± 0.0075 e |
| Inflorescence | 0.420 ± 0.0187 c | 0.271 ± 0.0122 c | 0.110 ± 0.0029 c | 0.024 ± 0.0006 b |
| Berry | 0.115 ± 0.0032 a | 0.012 ± 0.0004 a | nd | 0.071 ± 0.0032 d |
| Seed | 0.035 ± 0.0015 a | 0.011 ± 0.0004 a | 0.010 ± 0.0003 a | 0.013 ± 0.0005 a |
| Morphological Parts | Color Parameters | ||||
|---|---|---|---|---|---|
| L* | a* | b* | C | h° | |
| Root | 70.2 ± 0.01 e | 3.00 ± 0.067 d | 17.9 ± 0.15 e | 18.2 ± 0.14 d | 80.5 ± 0.28 c |
| Stem | 72.1 ± 0.08 f | −2.13 ± 0.015 c | 14.4 ± 0.12 c | 14.5 ± 0.12 c | 98.4 ± 0.14 d |
| Leaf | 54.5 ± 0.04 c | −6.64 ± 0.086 a | 16.4 ± 0.08 d | 17.7 ± 0.06 d | 112.1 ± 0.32 e |
| Inflorescence | 64.1 ± 0.01 d | −3.41 ± 0.045 b | 21.7 ± 0.07 f | 22.0 ± 0.07 f | 98.9 ± 0.10 d |
| Berry | 36.7 ± 0.03 a | 5.29 ± 0.125 e | 3.5 ± 0.07 a | 6.4 ± 0.07 a | 33.8 ± 1.12 a |
| Seed | 39.7 ± 0.06 b | 5.98 ± 0.105 f | 7.0 ± 0.12 b | 9.22 ± 0.12 b | 49.6 ± 0.63 b |
Publisher’s Note: MDPI stays neutral with regard to jurisdictional claims in published maps and institutional affiliations. |
© 2022 by the authors. Licensee MDPI, Basel, Switzerland. This article is an open access article distributed under the terms and conditions of the Creative Commons Attribution (CC BY) license (https://creativecommons.org/licenses/by/4.0/).
Share and Cite
Puzerytė, V.; Viškelis, P.; Balčiūnaitienė, A.; Štreimikytė, P.; Viškelis, J.; Urbonavičienė, D. Aralia cordata Thunb. as a Source of Bioactive Compounds: Phytochemical Composition and Antioxidant Activity. Plants 2022, 11, 1704. https://doi.org/10.3390/plants11131704
Puzerytė V, Viškelis P, Balčiūnaitienė A, Štreimikytė P, Viškelis J, Urbonavičienė D. Aralia cordata Thunb. as a Source of Bioactive Compounds: Phytochemical Composition and Antioxidant Activity. Plants. 2022; 11(13):1704. https://doi.org/10.3390/plants11131704
Chicago/Turabian StylePuzerytė, Viktorija, Pranas Viškelis, Aistė Balčiūnaitienė, Paulina Štreimikytė, Jonas Viškelis, and Dalia Urbonavičienė. 2022. "Aralia cordata Thunb. as a Source of Bioactive Compounds: Phytochemical Composition and Antioxidant Activity" Plants 11, no. 13: 1704. https://doi.org/10.3390/plants11131704