
Introducing Three-Dimensional Scanning for Phenotyping of Olive Fruits Based on an Extensive Germplasm Survey


Abstract
: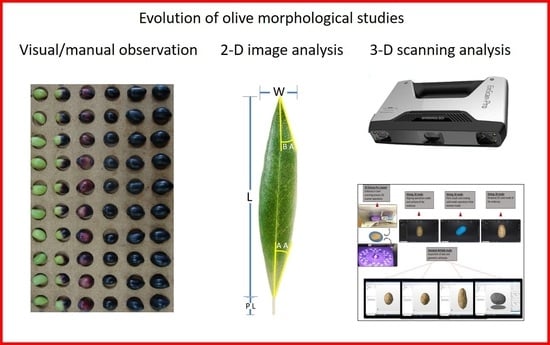
1. Introduction
2. Materials and Methods
2.1. Plant Material and Sample Preparation
2.2. Two-Dimensional Photography and Image J Analysis
2.3. Three-Dimensional Scanning and Autodesk Netfabb Software Analysis
2.4. Statistics
3. Results
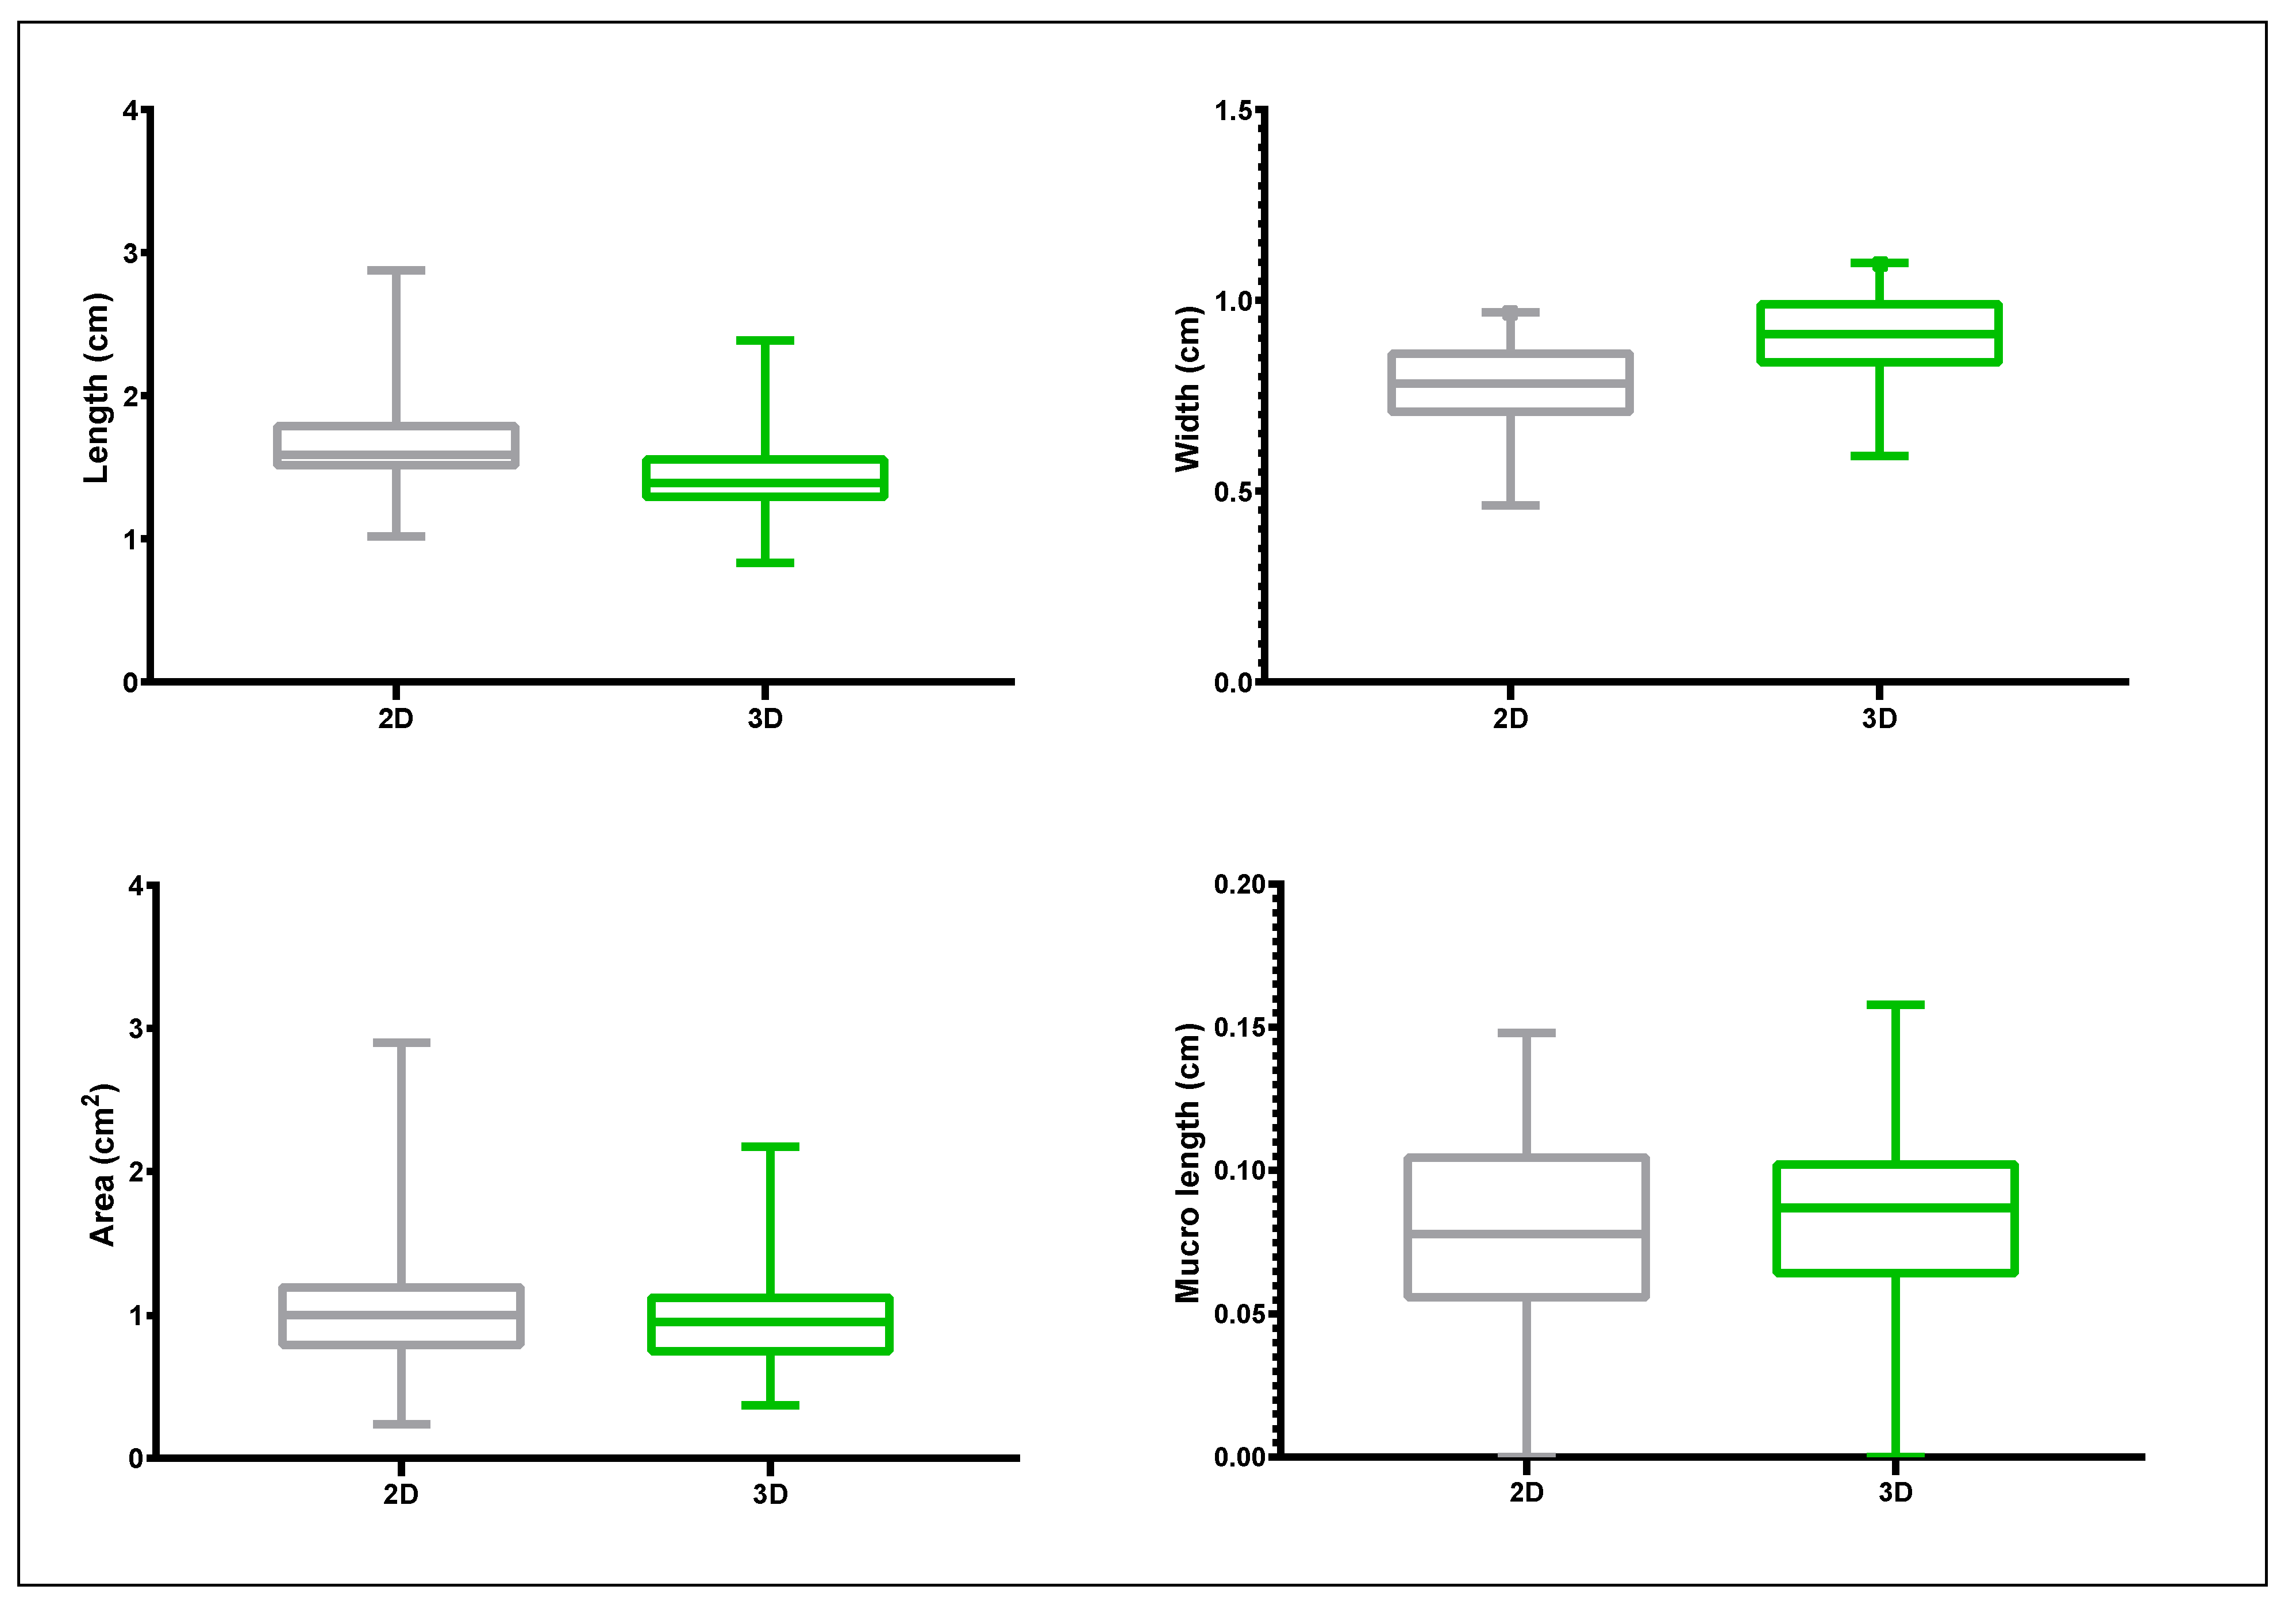
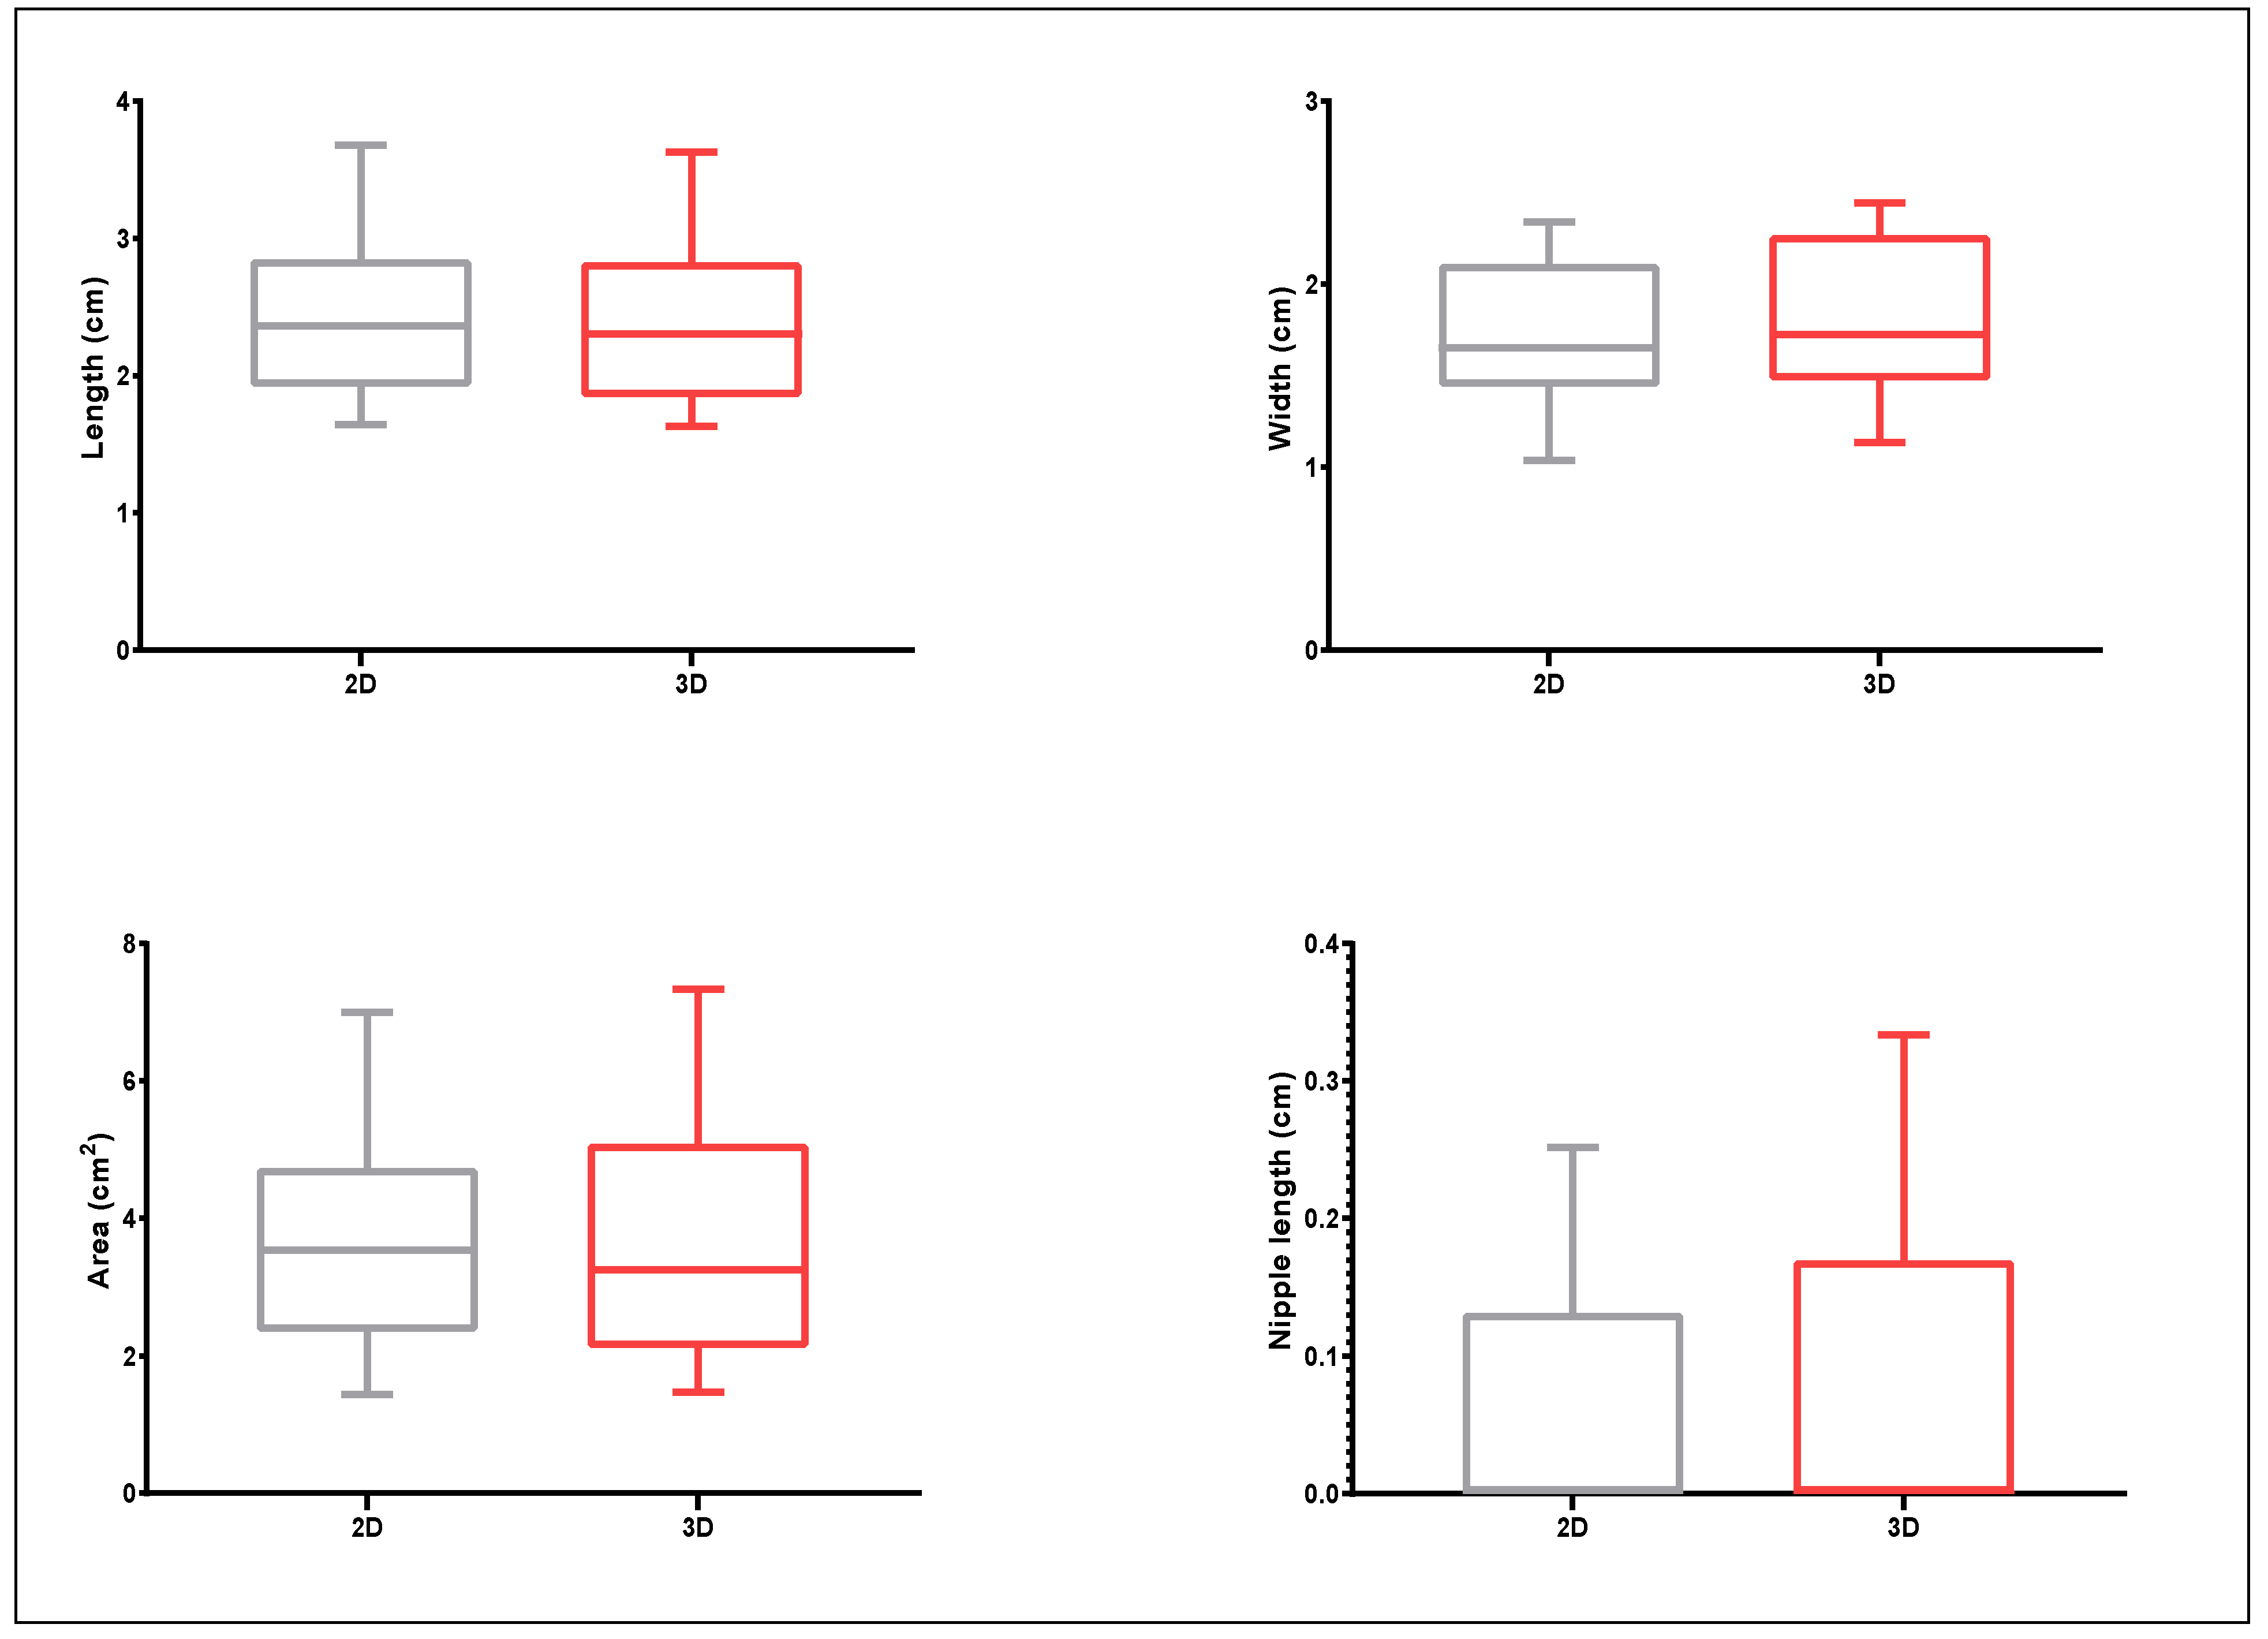
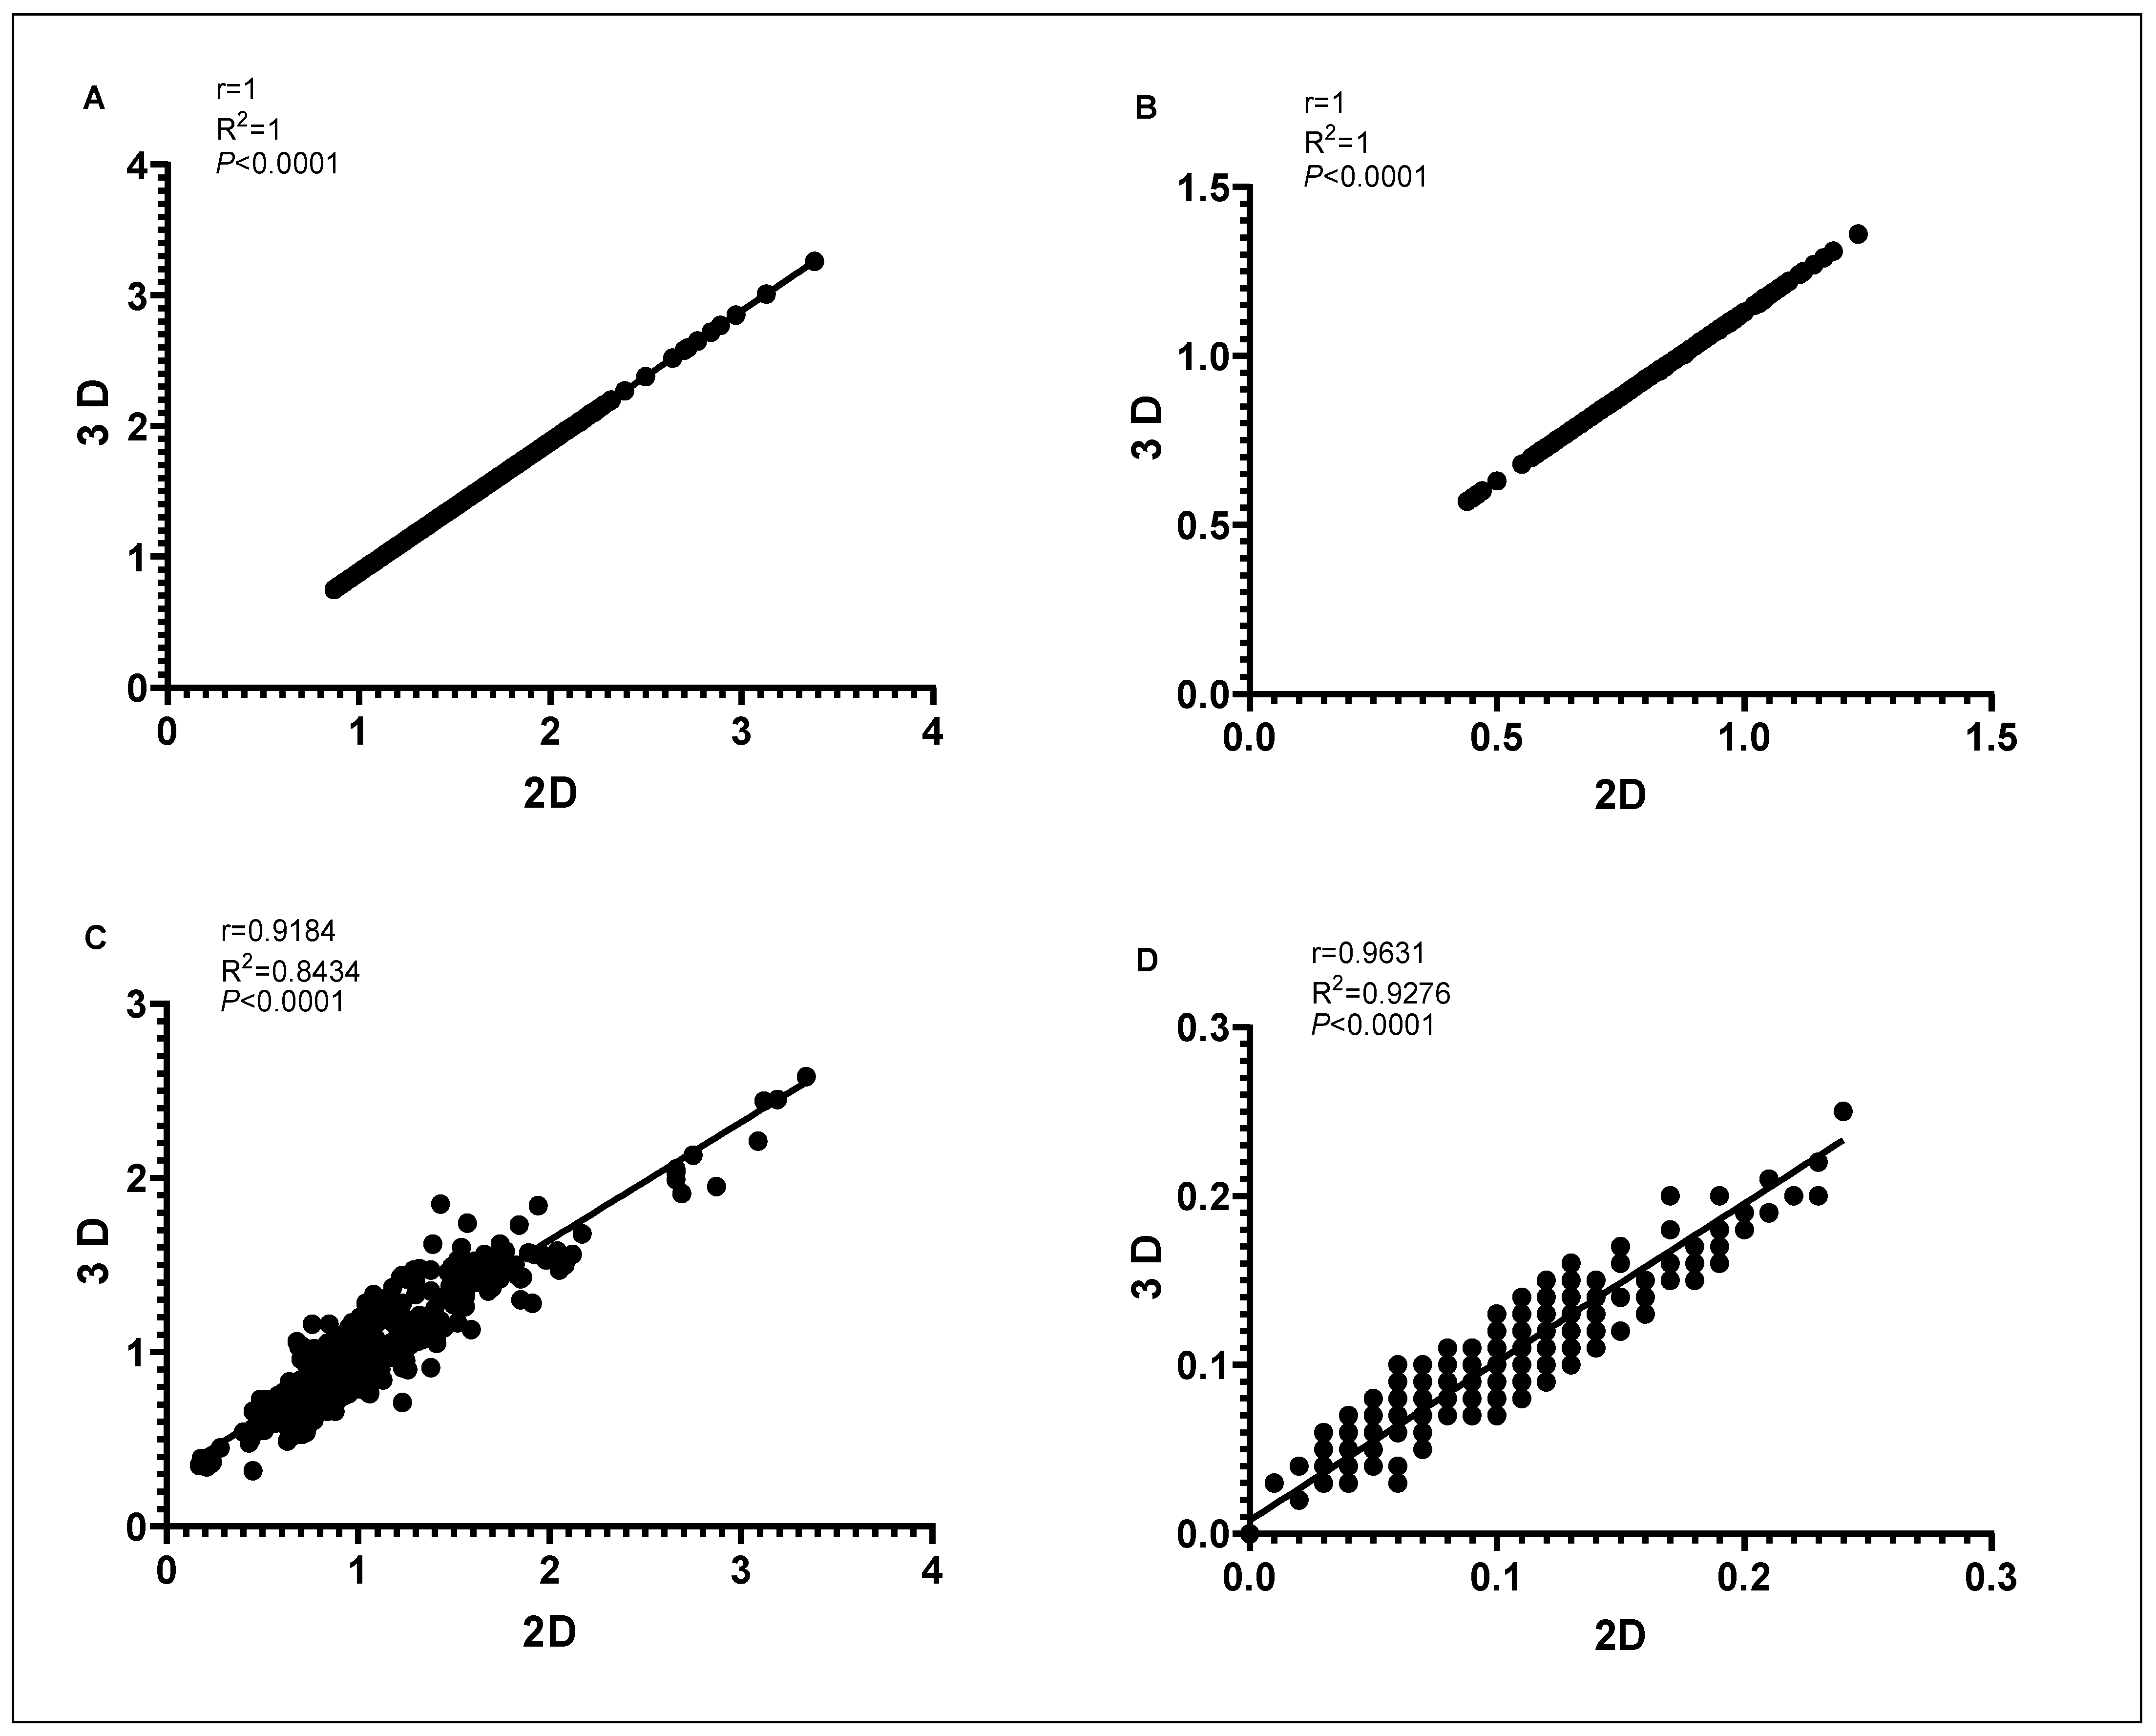
3.1. Assessing Phenotypic Variation of the Germplasm Collection from 2D Images and 3D Scanning
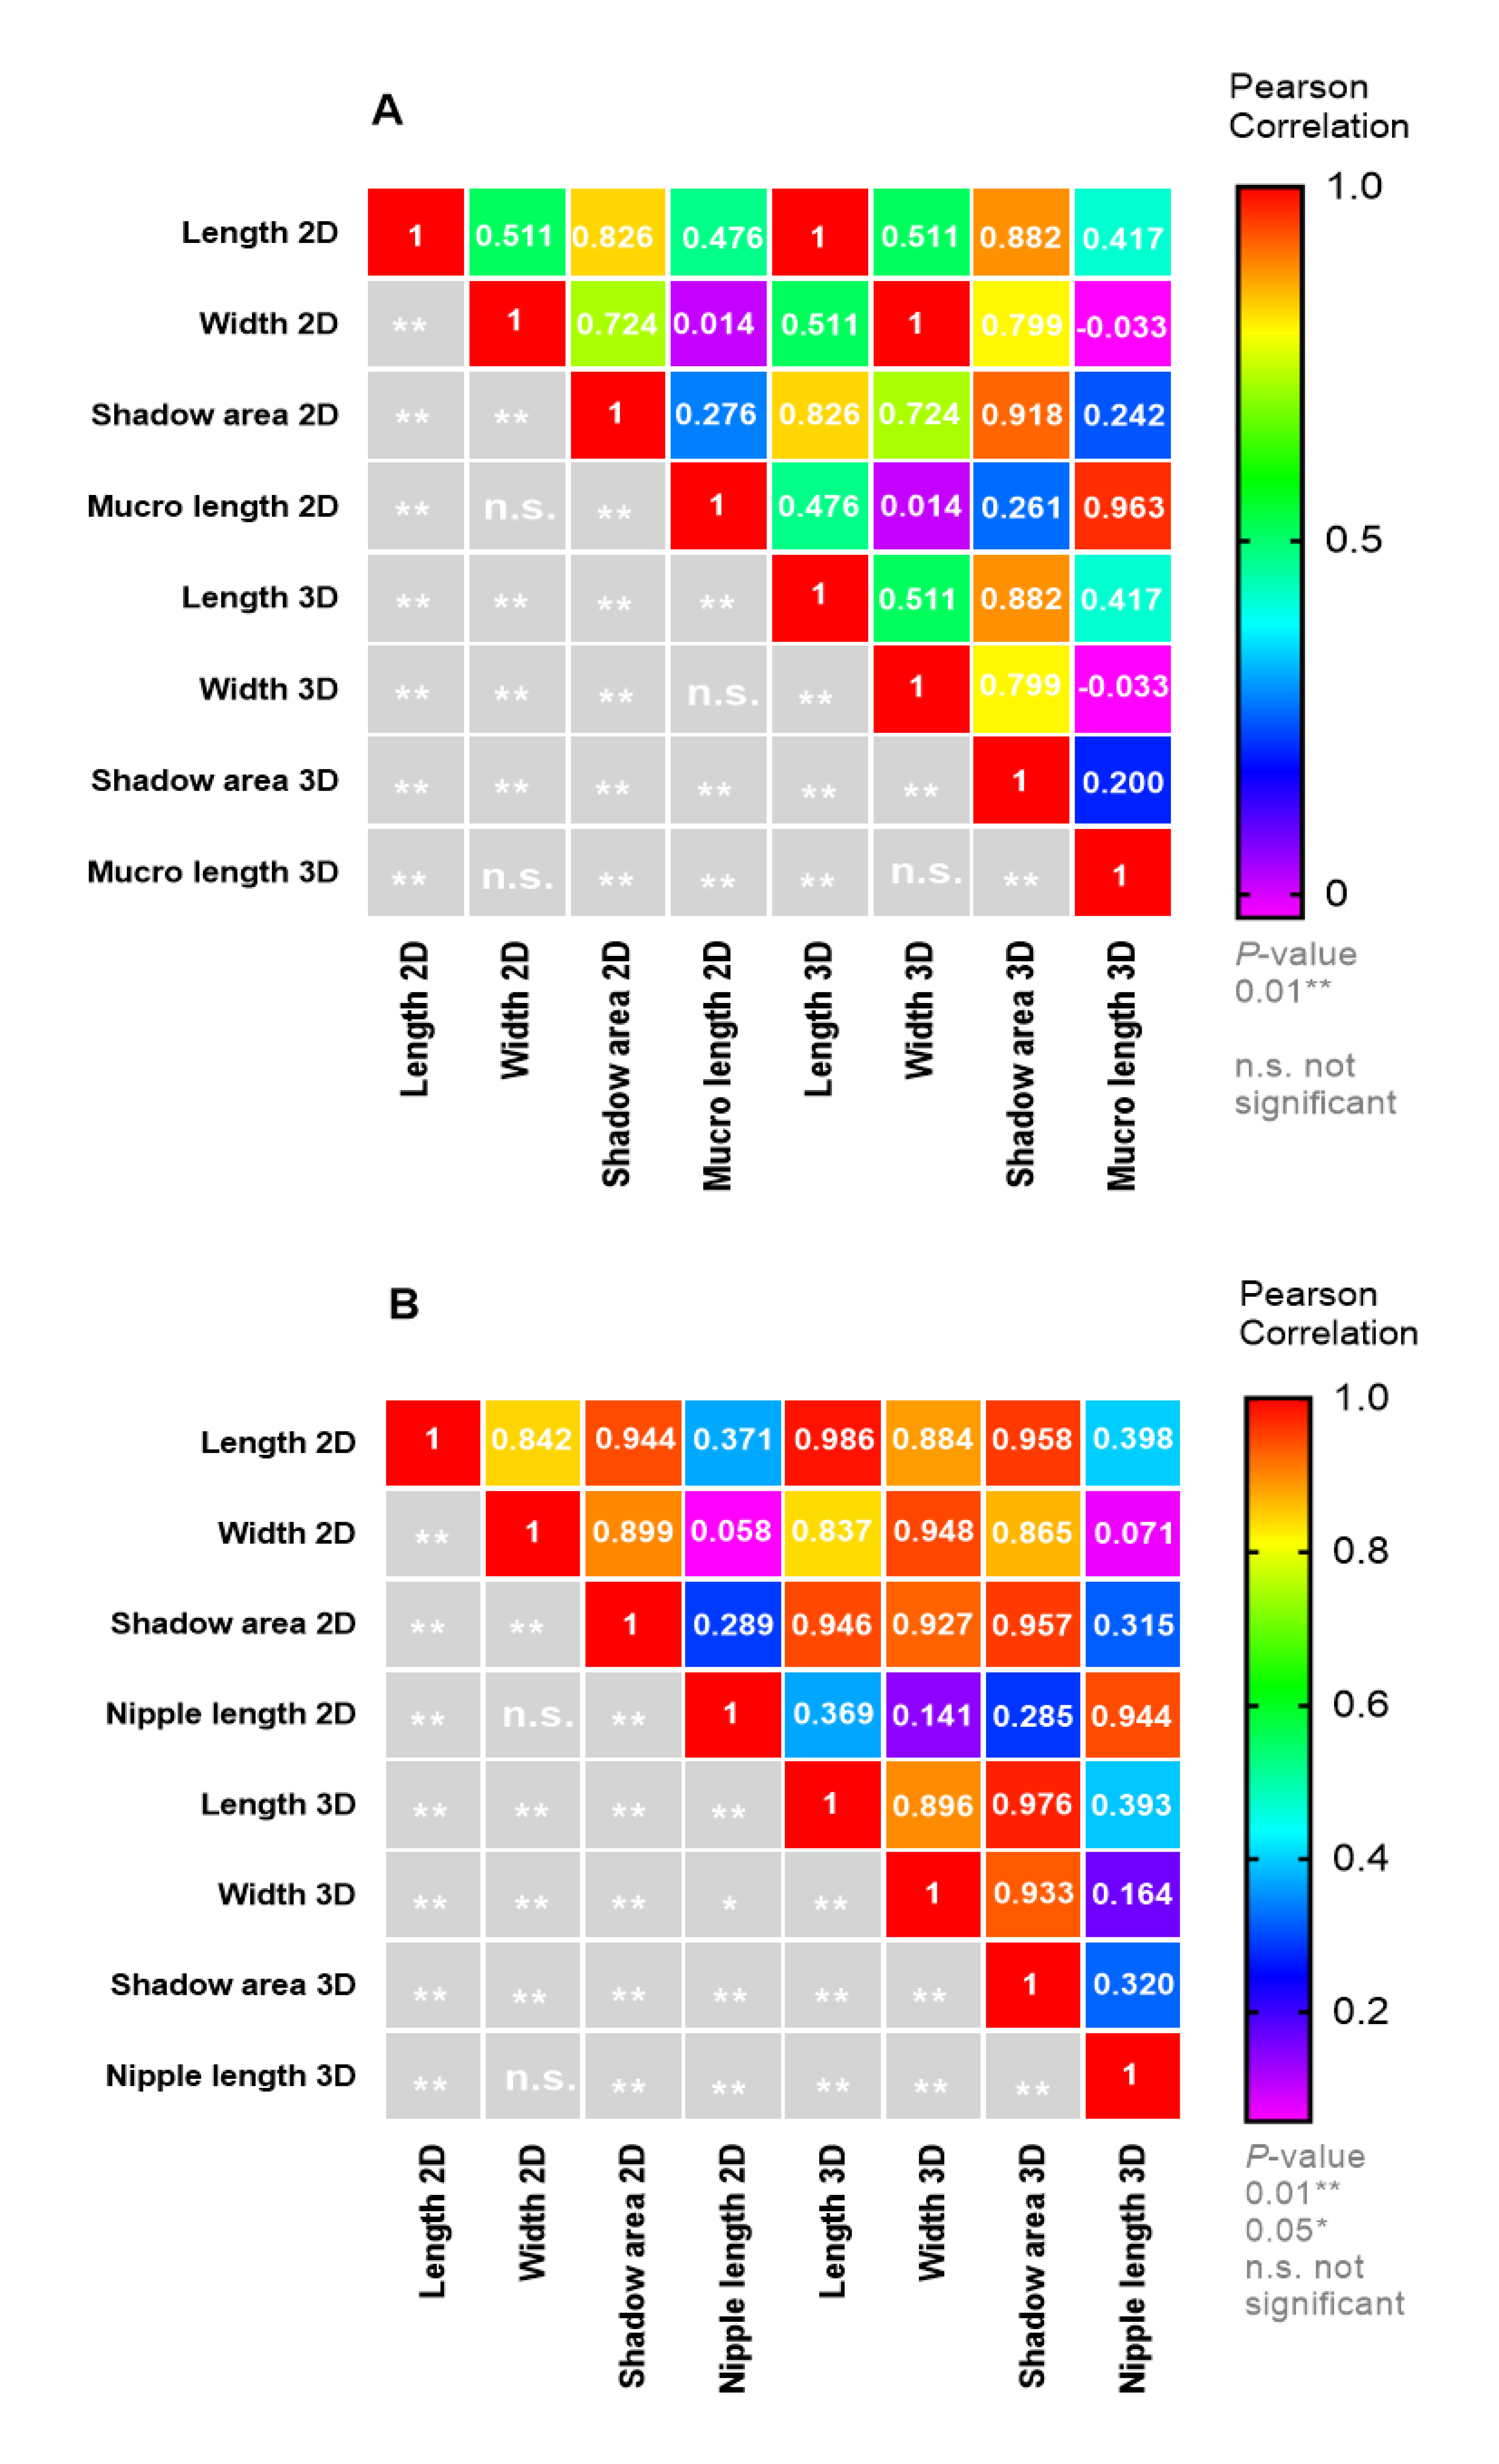
3.2. Proof-of-Principle on Olive Cultivars: Comparison of 2D and 3D Methods
3.3. Evaluation of Phenotypic Variation of the Germplasm Collection Based on Traits Exclusively Derived from 3D Scanning
4. Discussion
5. Conclusions
Supplementary Materials
Author Contributions
Funding
Institutional Review Board Statement
Informed Consent Statement
Data Availability Statement
Conflicts of Interest
References
- Rackham, O.; Moody, J. The Making of the Cretan Landscape; Manchester University Press: Manchester, UK; New York, NY, USA, 1996. [Google Scholar]
- Bombarely, A.; Doulis, A.G.; Lambrou, K.K.; Zioutis, C.; Margaritis, E.; Koubouris, G. Elucidation of the Origin of the Monumental Olive Tree of Vouves in Crete, Greece. Plants 2021, 10, 2374. [Google Scholar] [CrossRef] [PubMed]
- FAOSTAT. Food and Agriculture Organization of the United Nations. Statistics Division. 2018. Available online: http://www.fao.org/faostat/en/#data/QC (accessed on 4 August 2021).
- Diamantakos, P.; Ioannidis, K.; Papanikolaou, C.; Tsolakou, A.; Rigakou, A.; Melliou, E.; Magiatis, P. A new definition of the Tterm “high-phenolic olive oil” based on large scale statistical data of greek olive oils analyzed by qNMR. Molecules 2021, 26, 1115. [Google Scholar] [CrossRef]
- Grounta, A.; Tassou, C.; Panagou, E. Greek-Style Table Olives and Their Functional Value. In Olives and Olive Oil as Functional Foods: Bioactivity, Chemistry and Processing, 1st ed.; Shahidi, F., Kiritsakis, A., Eds.; John Wiley & Sons Ltd.: West Sussex, UK, 2017; pp. 325–342. [Google Scholar] [CrossRef]
- Olea Databases. National Research Council of Italy. Available online: http://www.oleadb.it/ (accessed on 10 October 2021).
- Barranco, D.; Cimato, A.; Fiorino, P.; Rallo, L.; Touzani, A.; Castaneda, C.; Serafıni, F.; Trujillo, I. World Catalogue of Olive Varieties, 1st ed.; International Olive Oil Council: Madrid, Spain, 2000; Available online: https://www.internationaloliveoil.org/store/view/79-world-catalogue-of-olivevarieties-english (accessed on 28 January 2021).
- International Union for the Protection of New Varieties of Plants (UPOV). Technical Guideline for the Conduct of Tests for Distinctness, Homogeneity, and Stability in Olive; UPOV Code: OLEAA_EUR, Olea europaea TG/99/4; UPOV: Geneva, Switzerland, 2002. [Google Scholar]
- European Commission (EC). Plant Variety Catalogues, Databases & Information Systems. Commission Implementing Directive 2014/97/EU. Available online: http://www.ec.europa.eu/food/plant/plant_propagation_material/plant_variety_catalogues_databases_en (accessed on 13 December 2021).
- Koubouris, G.C.; Avramidou, E.V.; Metzidakis, I.T.; Petrakis, P.V.; Sergentani, C.K.; Doulis, A.G. Phylogenetic and evolutionary applications of analyzing endocarp morphological characters by classification binary tree and leaves by SSR markers for the characterization of olive germplasm. Tree Genet. Genomes 2019, 15, 26. [Google Scholar] [CrossRef]
- Avramidou, E.V.; Koubouris, G.C.; Petrakis, P.V.; Lambrou, K.K.; Metzidakis, I.T.; Doulis, A.G. Classification Binary Trees with SSR Allelic Sizes: Combining Regression Trees with Genetic Molecular Data in Order to Characterize Genetic Diversity between Cultivars of Olea europaea L. Agronomy 2020, 10, 1662. [Google Scholar] [CrossRef]
- Mahner, M.; Kary, M. What exactly are genomes, genotypes and phenotypes? And what about phenomes? J. Theor. Biol. 1997, 186, 55–63. [Google Scholar] [CrossRef]
- Walter, A.; Finger, R.; Huber, R.; Buchmann, N. Smart farming is key to developing sustainable agriculture. Proc. Natl. Acad. Sci. USA 2017, 114, 6148–6150. [Google Scholar] [CrossRef] [PubMed] [Green Version]
- Costa, C.; Schurr, U.; Loreto, F.; Menesatti, P.; Carpentier, S. Plant phenotyping research trends, a science mapping approach. Front. Plant Sci. 2019, 9, 1933. [Google Scholar] [CrossRef] [Green Version]
- Pieruschka, R.; Schurr, U. Plant phenotyping: Past, present and future. Plant Phenomics 2019, 2019, 7507131. [Google Scholar] [CrossRef]
- Costa, J.M.; Marques da Silva, J.; Pinheiro, C.; Baron, M.; Mylona, P.; Centritto, M.; Haworth, M.; Loreto, F.; Uzilday, B.; Turkan, I.; et al. Opportunities and Limitations of Crop Phenotyping in Southern European Countries. Front. Plant Sci. 2019, 10, 1125. [Google Scholar] [CrossRef] [Green Version]
- Koutsos, T.; Menexes, G. Economic, agronomic, and environmental benefits from the adoption of precision agriculture technologies: A systematic review. Int. J. Agric. Environ. Inf. Syst. 2019, 10, 40–56. [Google Scholar] [CrossRef]
- Koubouris, G.; Bouranis, D.; Vogiatzis, E.; Nejad, A.R.; Giday, H.; Tsaniklidis, G.; Ligoxigakis, E.K.; Blazakis, K.; Kalaitzis, P.; Fanourakis, D. Leaf area estimation by considering leaf dimensions in olive tree. Sci. Hortic. 2018, 240, 440–445. [Google Scholar] [CrossRef]
- Zapolska, A.; Kalaitzidis, C.; Markakis, E.; Ligoxigakis, E.; Koubouris, G. Linear Discriminant Analysis of spectral measurements for discrimination between healthy and diseased trees of Olea europaea L. artificially infected by Fomitiporia mediterranea. Int. J. Remote Sens. 2020, 41, 5388–5398. [Google Scholar] [CrossRef]
- Boshkovski, B.; Doupis, G.; Zapolska, A.; Kalaitzidis, C.; Koubouris, G. Hyperspectral Imagery Detects Water Deficit and Salinity Effects on Photosynthesis and Antioxidant Enzyme Activity of Three Greek Olive Varieties. Sustainability 2022, 14, 1432. [Google Scholar] [CrossRef]
- Li, L.; Zhang, Q.; Huang, D. A review of imaging techniques for plant phenotyping. Sensors 2014, 14, 20078–20111. [Google Scholar] [CrossRef]
- Dadwal, M.; Banga, V.K. Color image segmentation for fruit ripeness detection: A review. In Proceedings of the 2nd International Conference on Electrical, Electronics and Civil Engineering, Singapore, 28–29 April 2012; pp. 190–193. [Google Scholar]
- Blasco, J.; Aleixos, N.; Moltó, E. Computer vision detection of peel defects in citrus by means of a region-oriented segmentation algorithm. J. Food Eng. 2007, 81, 535–543. [Google Scholar] [CrossRef]
- Kang, S.P.; East, A.R.; Trujillo, F.J. Colour vision system evaluation of bicolour fruit: A case study with “B74” mango. Postharvest Biol. Technol. 2008, 49, 77–85. [Google Scholar] [CrossRef]
- Mendoza, F.; Aguilera, J.M. Application of image analysis for classification of ripening bananas. Food Eng. Phys. Prop. 2004, 69, E471–E477. [Google Scholar] [CrossRef]
- Throop, J.A.; Aneshansley, D.J.; Anger, W.C.; Peterson, D.L. Quality evaluation of apples based on surface defects: Development of an automated inspection system. Postharvest Biol. Technol. 2005, 36, 281–290. [Google Scholar] [CrossRef]
- Liming, X.; Yanchao, Z. Automated strawberry grading system based on image processing. Comput. Electron. Agric. 2010, 71, S32–S39. [Google Scholar] [CrossRef]
- Blasco, J.; Aleixos, N.; Moltó, E. Machine vision system for automatic quality grading of fruit. Biosyst. Eng. 2003, 85, 415–423. [Google Scholar] [CrossRef]
- Costa, C.; Menesatti, P.; Paglia, G.; Pallottino, F.; Aguzzi, J.; Rimatori, V.; Russo, G.; Recupero, S.; Reforgiato Recupero, G. Quantitative evaluation of Tarocco sweet orange fruit shape using optoelectronic elliptic Fourier based analysis. Postharvest Biol. Technol. 2009, 54, 38–47. [Google Scholar] [CrossRef]
- Abràmoff, M.D.; Magalhães, P.J.; Ram, S.J. Image processing with ImageJ. Biophotonics Int. 2004, 11, 36–41. [Google Scholar]
- Vázquez-Arellano, M.; Griepentrog, H.W.; Reiser, D.; Paraforos, D.S. 3-D imaging systems for agricultural applications—A review. Sensors 2016, 16, 618. [Google Scholar] [CrossRef] [Green Version]
- Godin, C. Representing and encoding plant architecture: A review. Ann. For. Sci. 2000, 57, 413–438. [Google Scholar] [CrossRef]
- Bernard, A.; Hamdy, S.; Le Corre, L.; Dirlewanger, E.; Lheureux, F. 3D characterization of walnut morphological traits using X-ray computed tomography. Plant Methods 2020, 16, 115. [Google Scholar] [CrossRef] [PubMed]
- Rist, F.; Herzog, K.; Mack, J.; Richter, R.; Steinhage, V.; Töpfer, R. High-precision phenotyping of grape bunch architecture using fast 3D sensor and automation. Sensors 2018, 18, 763. [Google Scholar] [CrossRef] [PubMed] [Green Version]
- Furbank, R.T.; Tester, M. Phenomics—Technologies to relieve the phenotyping bottleneck. Trends Plant Sci. 2011, 16, 635–644. [Google Scholar] [CrossRef]
- Sanz-Cortes, F.; Martinez-Calvo, J.; Badenes, M.L.; Bleiholder, H.; Hack, H.; Llacer, G.; Meier, U. Phenological growth stages of olives trees (Olea europaea). Ann. App. Biol. 2002, 140, 151–157. [Google Scholar] [CrossRef]
- He, J.Q.; Harrison, R.J.; Li, B. A novel 3D imaging system for strawberry phenotyping. Plant Methods 2017, 13, 93. [Google Scholar] [CrossRef]
- Anders, A.; Choszcz, D.; Markowski, P.; Lipiński, A.J.; Kaliniewicz, Z.; Ślesicka, E. Numerical modeling of the shape of agricultural products on the example of cucumber fruits. Sustainability 2019, 11, 2798. [Google Scholar] [CrossRef] [Green Version]
- Dutagaci, H.; Rasti, P.; Galopin, G.; Rousseau, D. ROSE-X: An annotated data set for evaluation of 3D plant organ segmentation methods. Plant Methods 2020, 16, 28. [Google Scholar] [CrossRef] [PubMed] [Green Version]
- Paulus, S. Measuring crops in 3D: Using geometry for plant phenotyping. Plant Methods 2019, 15, 103. [Google Scholar] [CrossRef] [PubMed]
- Atefi, A.; Ge, Y.; Pitla, S.; Schnable, J. Robotic Technologies for High-Throughput Plant Phenotyping: Contemporary Reviews and Future Perspectives. Front. Plant Sci. 2021, 12, 611940. [Google Scholar] [CrossRef] [PubMed]


| Varieties | ||||
|---|---|---|---|---|
| Adramitini | Dafnelia | Kolireiki Ilias | Mastoidis | Pierias Skotiniotiki |
| Aggouromanakolia | Dopia Zakinthou | Kolimbada | Matolia Ilias | Pikrolia |
| Amfissis | Frantoio | Koroneiki | Mavrelia | Rachati |
| Arbequina | Frantoio Rodou | Kothreiki | Mavrelia Serron | Stroggilolia |
| Amigdalolia | Gaidourelia | Koutsourelia | Mavrelia Lefkadas | Thiaki |
| Asprolia $$$Alexandroupolis | Galatistas | Lefkolia Serron | Megaritiki | Throumbolia Thassou |
| Asprolia Lefkados | Kalamon | Lianolia Kerkiras | Mirtolia | Throubolia |
| Chalkidikis | Kalokerida | Lianomanako Tirou | Petrolia | Tragolia |
| Chondrolia Chalkidikis | Karolia | Makris | Picual | Valanolia |
| Chrisolia | Karidolia | Manzanilla | Pierias | Vasilikada |
| Morphological Trait | Unit | Method | |
|---|---|---|---|
| 2D | 3D | ||
| Length | cm | The maximum length from the base to the end (major axis) | Greatest dimension orthogonal to the height |
| Width | cm | Widest point perpendicular to the major axis | Greatest dimension orthogonal to both height and length |
| Shadow area | cm2 | The size of the region enclosed within it. | Shadow area |
| Mucro length | cm | The maximum length from the base to the end (major axis) of mucro | The maximum length from the base to the end (major axis) of mucro |
| Nipple length | cm | The maximum length from the base to the end (major axis) of nipple | The maximum length from the base to the end (major axis) of nipple |
| Volume | cm3 | not applicable | A scalar quantity expressing the amount of three-dimensional space enclosed by a closed surface. |
| Area | cm2 | not applicable | Total surface area, or the sum of the areas, on every outward surface |
| Up-skin (cm2) | cm2 | not applicable | Upwards facing surface at a specific angle (45°) |
| Down-skin (cm2) | cm2 | not applicable | Downwards facing surface at a specific angle (45°). |
| Center of gravity (size) x, y, z | cm | not applicable | The point where all the weight of the object can be considered to be concentrated. (x, y, z coordinate) |
Publisher’s Note: MDPI stays neutral with regard to jurisdictional claims in published maps and institutional affiliations. |
© 2022 by the authors. Licensee MDPI, Basel, Switzerland. This article is an open access article distributed under the terms and conditions of the Creative Commons Attribution (CC BY) license (https://creativecommons.org/licenses/by/4.0/).
Share and Cite
Manolikaki, I.; Sergentani, C.; Tul, S.; Koubouris, G. Introducing Three-Dimensional Scanning for Phenotyping of Olive Fruits Based on an Extensive Germplasm Survey. Plants 2022, 11, 1501. https://doi.org/10.3390/plants11111501
Manolikaki I, Sergentani C, Tul S, Koubouris G. Introducing Three-Dimensional Scanning for Phenotyping of Olive Fruits Based on an Extensive Germplasm Survey. Plants. 2022; 11(11):1501. https://doi.org/10.3390/plants11111501
Chicago/Turabian StyleManolikaki, Ioanna, Chrysi Sergentani, Safiye Tul, and Georgios Koubouris. 2022. "Introducing Three-Dimensional Scanning for Phenotyping of Olive Fruits Based on an Extensive Germplasm Survey" Plants 11, no. 11: 1501. https://doi.org/10.3390/plants11111501