
Screening of Durum Wheat Cultivars for Selenium Response under Contrasting Environments, Based on Grain Yield and Quality Attributes


Abstract
:
1. Introduction
2. Results
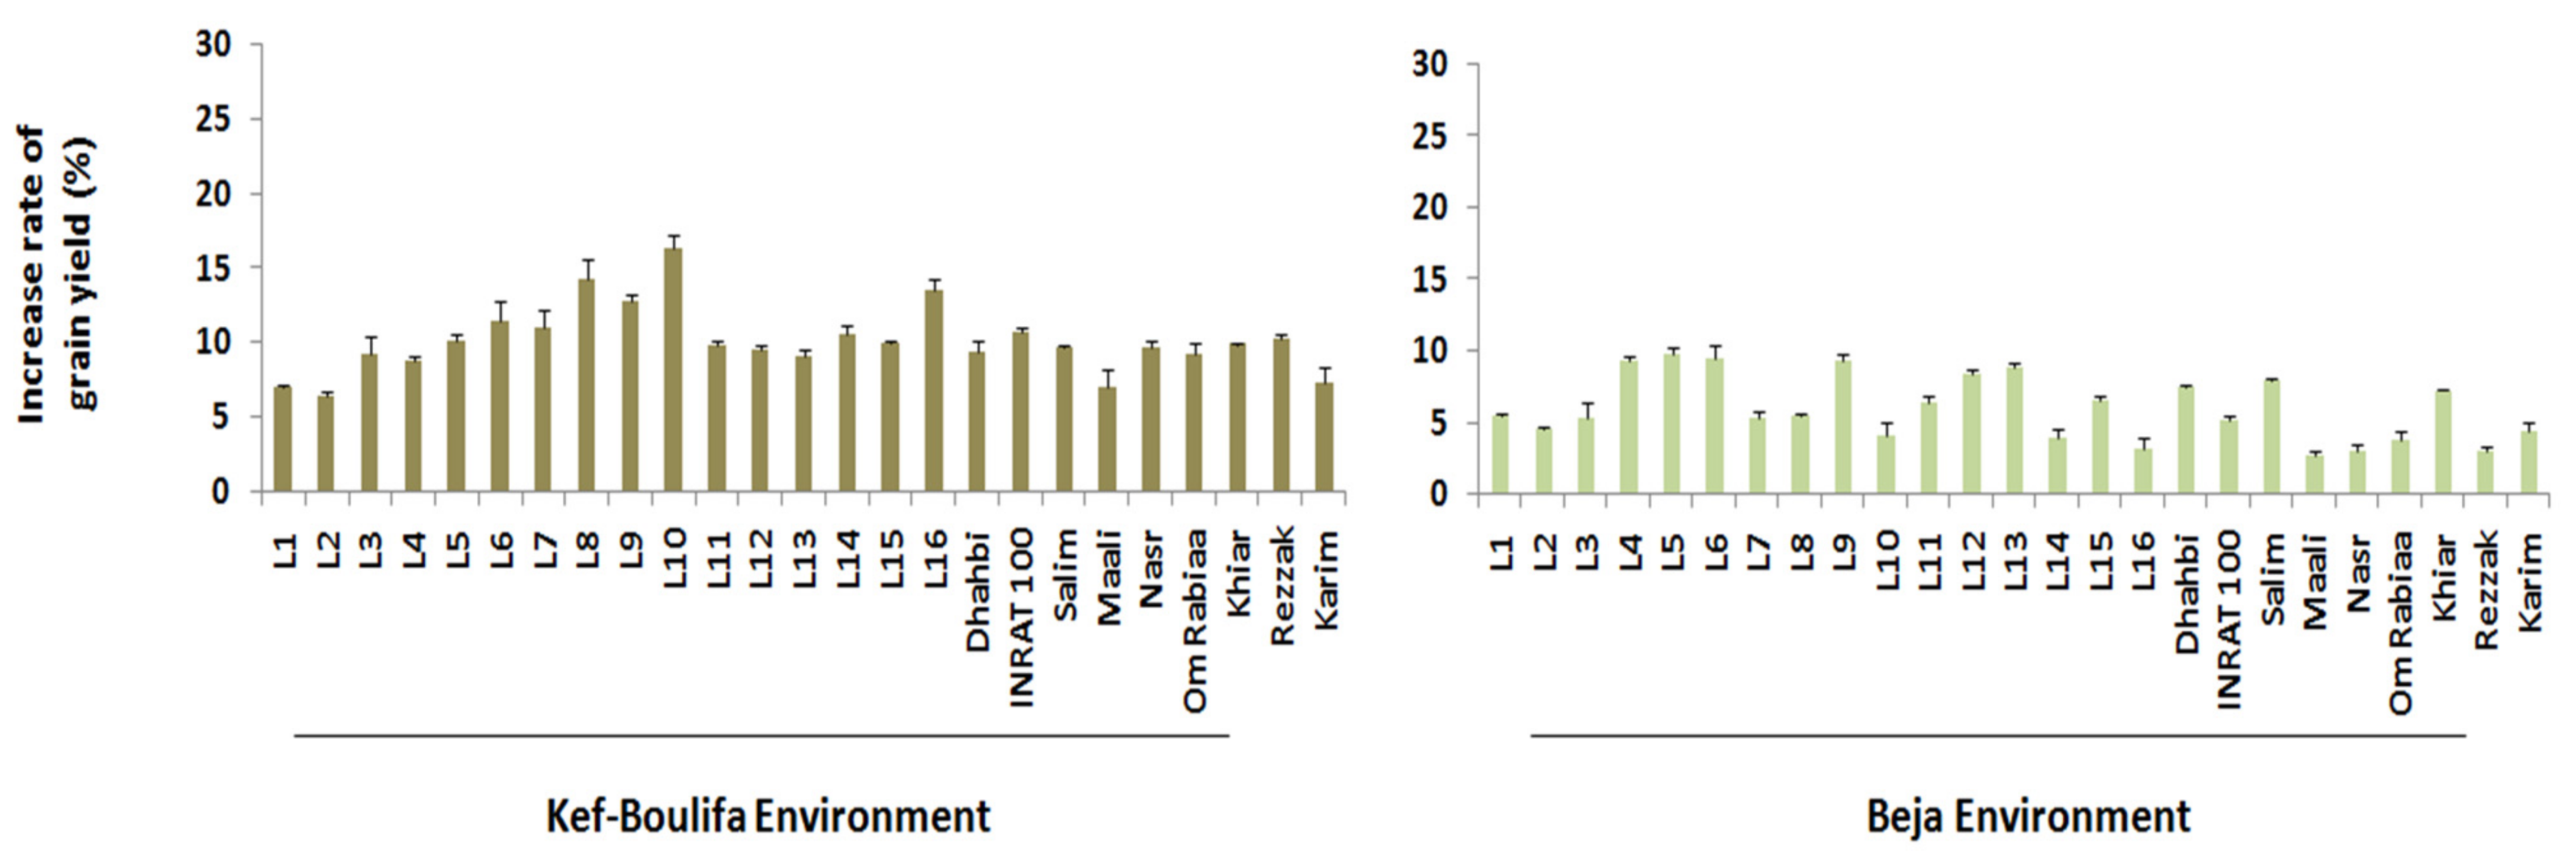
2.1. Effects of Environments, Se Application, and Cultivars on Grain Yield
2.2. Effects of Environments, Se Application, and Cultivars on Grain Quality Attributes
2.3. Analysis of ‘Cultivar-Treatment’ Combinations Based on Grain Yield and Quality Attributes
3. Discussion
3.1. Se Fertilization and Its Role in Improving Grain Yield
3.2. Se Fertilization and Its Role in Improving Grain Quality Attributes
3.3. Cultivar Responses to Se Fertilization
4. Materials and Methods
4.1. Genetic Material and Sites Description
4.2. Se Treatments and Field Management
4.3. Measured Agronomic and Grain Quality Traits
4.4. Statistical Data Analysis
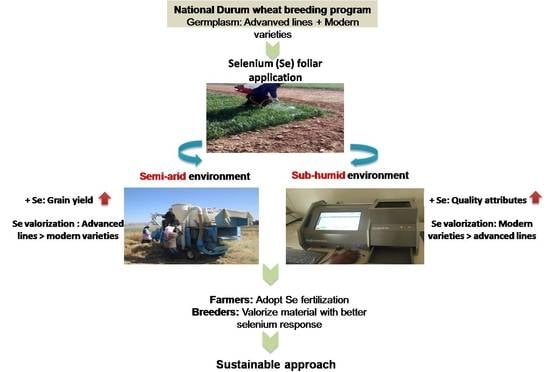
5. Conclusions
Supplementary Materials
Author Contributions
Funding
Institutional Review Board Statement
Informed Consent Statement
Data Availability Statement
Acknowledgments
Conflicts of Interest
References
- Arraouadi, S.; Nasraoui, R.; Gharbi, W.; Sellami, M.H. Genetic variation of response to irrigation system of three durum wheat varieties (Triticum durum Desf.) cultivated in Sidi Bouzid (Tunisia). J. New Sci. 2015, 20, 804–809. [Google Scholar]
- Belhaj Mguidiche, A.; Douh, B.; Gazouani, H.; Harbaoui, K.; Sahbi, F. Wheat yield and water use efficiency in the north of Tunisia under supplemental irrigation. In Recent Advances in Environmental Science from the Euro-Mediterranean and Surrounding Regions, Proceedings of Euro-Mediterranean Conference for Environmental Integration (EMCEI-1), Sousse, Tunisia, 22–25 November 2017; Kallel, A., Ksibi, M., Ben Dhia, H., Khélifi, N., Eds.; Springer: Cham, Switzerland, 2018; pp. 779–780. [Google Scholar]
- Bahri, H.; Annabi, M.; Cheikh M’Hamed, H.; Frija, A. Assessing the long-term impact of conservation agriculture on wheat-based systems in Tunisia using APSIM simulations under a climate change context. Sci. Total Environ. 2019, 692, 1223–1233. [Google Scholar] [CrossRef] [PubMed]
- Moriondo, M.; Bindi, M.; Brilli, L.; Costafreda-Aumedes, S.; Dibari, C.; Leolini, L.; Padovan, G.; Trombi, G.; Karali, A.; Varotsos, K.V.; et al. Assessing climate change impacts on crops by adopting a set of crop performance indicators. EMJE 2021, 6, 45. [Google Scholar] [CrossRef]
- Ahmad, Z.; Anjum, S.; Skalicky, M.; Waraich, E.A.; Tariq, R.M.S.; Ayub, M.A.; Hossain, A.; Hassan, M.M.; Brestic, M.; Islam, M.S.; et al. Selenium alleviates the adverse effect of drought in oilseed crops camelina (Camelina sativa L.) and canola (Brassica napus L.). Molecules 2021, 26, 1699. [Google Scholar] [CrossRef]
- Mohtashami, R.; Movahhedi, M.D.; Balouchi, H.; Faraji, H. Improving yield, oil content and water productivity of dryland canola by supplementary irrigation and selenium spraying. Agric. Water Manag. 2020, 232, 106046. [Google Scholar] [CrossRef]
- Hasanuzzaman, M.; Nahar, K.; García-Caparrós, P.; Parvin, K.; Zulfiqar, F.; Ahmed, N.; Fujita, M. Selenium supplementation and crop plant tolerance to metal/metalloid toxicity. Front. Plant Sci. 2022, 12, 792770. [Google Scholar] [CrossRef]
- Kápolna, E.; Hillestrøm, P.R.; Laursen, K.H.; Husted, S.; Larsen, E.H. Effect of foliar application of selenium on its uptake and speciation in carrot. Food Chem. 2009, 115, 1357–1363. [Google Scholar] [CrossRef]
- Kápolna, E.; Laursen, K.H.; Husted, S.; Larsen, E.H. Bio-fortification and isotopic labelling of Se metabolites in onions and carrots following foliar application of Se and 77Se. Food Chem. 2012, 133, 650–657. [Google Scholar] [CrossRef]
- Gupta, M.; Gupta, S. An overview of selenium uptake, metabolism, and toxicity in plants. Front. Plant Sci. 2017, 7, 2074. [Google Scholar] [CrossRef] [Green Version]
- White, P.J. Selenium accumulation by plants. Ann. Bot. 2015, 117, 217–235. [Google Scholar] [CrossRef] [Green Version]
- Lara, T.S.; Lessa, J.H.D.L.; de Souza, K.R.D.; Corguinha, A.P.B.; Martins, F.A.D.; Lopes, G.; Guilherme, L.R.G. Selenium biofortification of wheat grain via foliar application and its effect on plant metabolism. J. Food Compos. Anal. 2019, 81, 10–18. [Google Scholar] [CrossRef]
- Nawaz, F.; Ashraf, M.Y.; Ahmad, R.; Waraich, E.A.; Shabbir, R.N.; Hussain, R.A. Selenium supply methods and time of application influence spring wheat (Triticum aestivum L.) yield under water deficit conditions. J. Agric. Sci. 2016, 155, 643–656. [Google Scholar] [CrossRef]
- Hajiboland, R.; Sadeghzadeh, N.; Ebrahimi, N.; Sadeghzadeh, B.; Mohammadi, S.A. Influence of selenium in drought-stressed wheat plants under greenhouse and field conditions. Acta Agric. Slov. 2015, 105, 175–191. [Google Scholar] [CrossRef]
- Taha, R.S.; Seleiman, M.F.; Shami, A.; Alhammad, B.A.; Mahdi, A.H.A. Integrated application of selenium and silicon enhances growth and anatomical structure, antioxidant defense system and yield of wheat grown in salt-stressed soil. Plants 2021, 10, 1040. [Google Scholar] [CrossRef]
- Diao, M.; Ma, L.; Wang, J.; Cui, J.; Fu, A.; Liu, H.Y. Selenium promotes the growth and photosynthesis of tomato seedlings under salt stress by enhancing chloroplast antioxidant defense system. Plant Grow. Reg. 2014, 33, 671–682. [Google Scholar] [CrossRef]
- Das, S.; Biswas, A.K. Comparative study of silicon and selenium to modulate chloroplast pigments levels, Hill activity, photosynthetic parameters and carbohydrate metabolism under arsenic stress in rice seedlings. Environ. Sci. Pollut. Res. Int. 2022, 29, 19508–19529. [Google Scholar] [CrossRef]
- Curtin, D.; Hanson, R.; Van Der Weerden, T.J. Effect of selenium fertiliser formulation and rate of application on selenium concentrations in irrigated and dryland wheat (Triticum aestivum). N.Z.J. Crop. Hortic. Sci. 2008, 36, 1–7. [Google Scholar] [CrossRef] [Green Version]
- Ibrahim, H.B. Selenium pretreatment regulates the antioxidant defense system and reduces oxidative stress on drought-stressed wheat (Triticum aestivum L.) plants. Asian J. Plant Sci. 2014, 13, 120–128. [Google Scholar] [CrossRef]
- Hartikainen, H.; Xue, T.; Piironen, V. Selenium as an anti-oxidant and pro-oxidant in ryegrass. Plant Soil 2000, 225, 193–200. [Google Scholar] [CrossRef]
- Mikkelsen, R.; Wan, F. The effect of selenium on sulfur uptake by barley and rice. Plant Soil 1990, 121, 151–153. [Google Scholar] [CrossRef]
- Altenbach, S.B. New insights into the effects of high temperature, drought and post-anthesis fertilizer on wheat grain development. J. Cereal Sci. 2012, 56, 39–50. [Google Scholar] [CrossRef]
- Panozzo, J.; Eagles, H. Cultivar and environmental effects on quality characters in wheat. II. Protein. Aust. J. Agric. Res. 2000, 51, 629–636. [Google Scholar] [CrossRef]
- De Santis, M.A.; Soccio, M.; Laus, M.N.; Flagella, Z. Influence of drought and salt stress on durum wheat grain quality and composition: A review. Plants 2021, 10, 2599. [Google Scholar] [CrossRef] [PubMed]
- Guler, M. Effect of water stress on some quality characteristics at certain growth stages of winter wheat (Triticum aestivum L.). J. Agric. Sci. 2001, 7, 21–28. [Google Scholar]
- Tsenov, N.; Atanasova, D.; Stoeva, I.; Tsenova, E. Effects of drought on grain productivity and quality in winter bread wheat. Bulg. J. Agric. Sci. 2015, 21, 592–598. [Google Scholar]
- Ficco, D.M.B.; Riefolo, C.; Nicastro, G.; De Simone, V.; Digesù, A.M.; Beleggia, R.; Platani, C.; Cattivelli, L.; De Vita, P. Phytate and mineral elements concentration in a collection of Italian durum wheat cultivars. Field Crop. Res. 2009, 111, 235–242. [Google Scholar] [CrossRef]
- Rharrabti, Y.; Villegas, D.; Royo, C.; Martos-Nunez, V. Durum wheat quality in Mediterranean environments ii. influence of climatic variables and relationships between quality parameters. Field Crop. Res. 2003, 80, 133–140. [Google Scholar] [CrossRef]
- Magallanes-López, A.M.; Hernandez-Espinosa, N.; Velu, G.; Posadas-Romano, G.; Ordoñez-Villegas, V.M.G.; Crossa, J.; Ammar, K.; Guzmán, C. Variability in iron, zinc and phytic acid content in a worldwide collection of commercial durum wheat cultivars and the effect of reduced irrigation on these traits. Food Chem. 2017, 237, 499–505. [Google Scholar] [CrossRef]
- Ramkissoon, C. Selenium Dynamics in Cereal Biofortification: Optimising Fertiliser Strategies and Assessing Residual Fate. Ph.D. Thesis, University of Adelaide, Adelaide, Australia, 2020. [Google Scholar]
- De Vita, P.; Platani, C.; Fragasso, M.; Ficco, D.B.M.; Colecchia, S.A.; Del Nobile, M.A.; Padalino, L.; Di Gennaro, S.; Petrozza, A. Selenium-enriched durum wheat improves the nutritional profile of pasta without altering its organoleptic properties. Food Chem. 2017, 214, 374–382. [Google Scholar] [CrossRef]
- Khaliq, A.; Aslam, F.; Matloob, A.; Hussain, S.; Geng, M.; Wahid, A.; ur Rehman, H. Seed priming with selenium: Consequences for emergence, seedling growth, and biochemical attributes of rice. Biol. Trace Elem. Res. 2015, 166, 236–244. [Google Scholar] [CrossRef]
- Ros, G.; Rotterdam, A.; Bussink, D.; Bindraban, P. Selenium fertilization strategies for bio-fortification of food: An agro-ecosystem approach. Plant Soil 2016, 404, 99–112. [Google Scholar] [CrossRef]
- Ramkissoon, C.; Degryse, F.; da Silva, R.C.; Baird, R.; Young, S.D.; Bailey, E.H.; McLaughlin, M.J. Improving the efficacy of selenium fertilizers for wheat biofortification. Sci. Rep. 2019, 9, 19520. [Google Scholar] [CrossRef]
- Broadley, M.R.; Alcock, J.; Alford, J.; Cartwright, P.; Foot, I.; Fairweather-Tait, S.J.; Hart, D.J.; Hurst, R.; Knott, P.; McGrath, S.P.; et al. Selenium biofortification of high-yielding winter wheat (Triticum aestivum L.) by liquid or granular Se fertilisation. Plant Soil 2010, 332, 5–18. [Google Scholar]
- Mathers, A.W.; Young, S.D.; McGrath, S.P.; Zhao, F.J.; Crout, N.M.J.; Bailey, E.H. Determining the fate of selenium in wheat biofortification: An isotopically labelled field trial study. Plant Soil 2017, 420, 61–77. [Google Scholar] [CrossRef]
- Boldrin, P.F.; Faquin, V.; Ramos, S.J.; Boldrin, K.V.F.; Ávila, F.W.; Guilherme, L.R.G. Soil and foliar application of selenium in rice biofortification. J. Food Compos. Anal. 2013, 31, 238–244. [Google Scholar] [CrossRef]
- Ducsay, L.; Ložek, O.; Marček, M.; Varényiová, M.; Hozlár, P.; Lošák, T. Possibility of selenium biofortification of winter wheat grain. Plant Soil Environ. 2016, 62, 379–383. [Google Scholar] [CrossRef] [Green Version]
- Nawaz, F.; Ashraf, M.Y.; Ahmad, R.; Waraich, E.A.; Shabbir, R.N. Selenium (Se) regulates seedling growth in wheat under drought stress. Adv. Chem. 2014, 2014, 143567. [Google Scholar] [CrossRef] [Green Version]
- Radawiec, A.; Rutkowska, B.; Tidaback, J.A.; Gozdowski, D.; Knapowski, T.; Szulc, W. The impact of selenium fertilization on the quality characteristics of spring wheat grain. Agronomy 2021, 11, 2100. [Google Scholar] [CrossRef]
- Chu, J.; Yao, X.; Zhang, Z. Responses of wheat seedlings to exogenous selenium supply under cold stress. Biol. Trace Elem. Res. 2010, 136, 355–363. [Google Scholar] [CrossRef]
- Kuznetsov, V.V.; Kholodova, V.; Kuznetsov, V.V.; Yagodin, B. Selenium regulates the water status of plants exposed to drought. Dokl. Biol. Sci. 2003, 390, 266–268. [Google Scholar] [CrossRef]
- Djanaguiraman, M.; Devi, D.D.; Shanker, A.K.; Sheeba, J.A.; Bangarusamy, U. Selenium an antioxidative protectant in soybean during senescence. Plant Soil 2005, 272, 77–86. [Google Scholar] [CrossRef]
- Xue, T.; Hartikainen, H.; Piironen, V. Antioxidative and growth-promoting effect of selenium on senescing lettuce. Plant Soil 2001, 237, 55–61. [Google Scholar] [CrossRef]
- Shang, Q.M.; Chen, S.F.; Shang, Z.G. Regulation of selenium on antioxidative enzymes activity in pepper leaves under high temperature stress. Acta Hort. Sin. 2005, 32, 35–38. [Google Scholar]
- Wang, C.Q. Water-stress mitigation by selenium in Trifolium repens L. J. Plant Nutr. Soil Sci. 2011, 174, 276–282. [Google Scholar] [CrossRef]
- Rizwan, M.; Ali, S.; Rehman, M.Z.U.; Rinklebe, J.; Tsang, D.C.W.; Tack, F.M.G.; Abbasi, G.H.; Hussain, A.; Igalavithana, A.D.; Lee, B.C. Effects of selenium on the uptake of toxic trace elements by crop plants: A review. Crit. Rev. Environ. Sci. Tec. 2021, 51, 2531–2566. [Google Scholar] [CrossRef]
- Xia, Q.; Yang, Z.; Shui, Y.; Liu, X.; Chen, J.; Khan, S.; Wang, J.; Gao, Z. Methods of selenium application differentially modulate plant growth, selenium accumulation and speciation, protein, anthocyanins and concentrations of mineral elements in purple-grained wheat. Front. Plant Sci. 2020, 11, 1114. [Google Scholar] [CrossRef] [PubMed]
- Lyons, G.; Stangoulis, J.; Graham, R. High-selenium wheat: Biofortification for better health. Nutr. Res. Rev. 2003, 16, 45–60. [Google Scholar] [CrossRef] [Green Version]
- Quaglia, G.B. Other durum wheat products. In Durum Wheat: Chemistry and Technology, 2nd ed.; Fabriani, G., Lintas, C., Eds.; American Association of Cereal Chemists: St. Paul, MN, USA, 1988; pp. 263–282. [Google Scholar]
- Feillet, P.; Dexter, J.E. Quality requirements of durum wheat for semolina milling and pasta production. In Pasta and Noodle Technology; Kruger, J.E., Matsuo, R.R., Dick, J.W., Eds.; American Association of Cereal Chemists: St. Paul, MN, USA, 1996; pp. 95–131. [Google Scholar]
- Yildirim, A.; Ateş Sönmezoğlu, Ö.; Sayaslan, A.; Koyuncu, M.; Güleç, T.; Kandemir, N. Marker-assisted breeding of a durum wheat cultivar for γ-gliadin and LMW-glutenin proteins affecting pasta quality. Turk. J. Agric. For. 2013, 37, 527–533. [Google Scholar] [CrossRef]
- Deng, L.; Elias, E.M.; Manthey, F.A. Relationship between grain, semolina, and whole wheat flour properties and the physical and cooking qualities of whole wheat spaghetti. Cereal Chem. 2017, 94, 801–804. [Google Scholar] [CrossRef]
- Podolska, G.; Sulek, A. The main elements of the production technology that determine the high quality of wheat grain. Puławski’s Diary 2002, 130, 597–605. [Google Scholar]
- Knapowski, T.; Kozera, W.; Murawska, B.; Wszelaczynska, E.; Poberezny, J.; Mozolewski, W.; Keutgen, A.J. Assessment of technological parameters of selected winter wheat cultivars in terms of baking. Inz. Ap. Chem. 2015, 54, 255–256. [Google Scholar]
- Knapowski, T.; Szczepanek, M.; Wilczewski, E.; Poberezny, J. Response of wheat to seed dressing with humus and foliar potassium fertilization. J. Agric. Sci. Tech. 2015, 17, 1559–1569. [Google Scholar]
- Vizitiu, D.; Ognean, M.; Danciu, I. Rheological evaluation of some laboratory mills. Bull. UASVM Agric. 2012, 69, 2. [Google Scholar] [CrossRef]
- Luo, H.W.; He, L.X.; Du, B.; Wang, Z.M.; Zheng, A.X.; Lai, R.F.; Tang, X.R. Foliar application of selenium (Se) at heading stage induces regulation of photosynthesis, yield formation, and quality characteristics in fragrant rice. Photosynthetica 2019, 57, 1007–1014. [Google Scholar] [CrossRef] [Green Version]
- Schiavon, M.; Lima, L.W.; Jiang, Y.; Hawkesford, M.J. Effects of selenium on plant metabolism and implications for crops and consumers. In Selenium in Plants, Molecular, Physiological, Ecological and Evolutionary Aspects; Pilon-Smits, E.A.H., Winkel, L.H.E., Lin, Z.-Q., Eds.; Springer International Publishing: Cham, Switzerland, 2017; pp. 257–275. [Google Scholar]
- Carucci, F.; Gatta, G.; Gagliardi, A.; De Vita, P.; Bregaglio, S.; Giuliani, M.M. Agronomic strategies to improve N efficiency indices in organic durum wheat grown in Mediterranean area. Plants 2021, 10, 2444. [Google Scholar] [CrossRef]
- Hajiboland, R.; Sadeghzade, N. Effect of selenium on CO2 and NO3− assimilation under low and adequate nitrogen supply in wheat (Triticum aestivum L.). Photosynthetica 2014, 52, 501–510. [Google Scholar] [CrossRef]
- Blandino, M.; Vaccino, P.; Reyneri, A. Late-season nitrogen increases improver common and durum wheat quality. Agron. J. 2015, 107, 680–690. [Google Scholar] [CrossRef] [Green Version]
- Rodriguez-Felix, F.; Ramirez-Wong, B.; Torres-Chávez, P.I.; Alvarez-Avilés, A.; Moreno-Salazar, S.; Renteria-Martinez, M.E.; Bello-Perez, L.A. Yellow berry, protein and agronomic characteristics in bread wheat under different conditions of nitrogen and irrigation in northwest Mexico. Pak. J. Bot. 2014, 46, 221–226. [Google Scholar]
- González-Torralba, J.; Arazuri, S.; Jarén, C.; Arregui, L.M. Stable quality traits of soft Winter wheat under nonlimiting nitrogen conditions. Crop Sci. 2011, 51, 2820–2828. [Google Scholar] [CrossRef]
- Makowska, A.; Obuchowski, W.; Sulewka, H.; Koziara, W.; Paschke, H. Effect of nitrogen fertilization of durum wheat varieties on some characteristics important for pasta production. Acta Sci. Pol. Technol. Aliment. 2008, 7, 29–39. [Google Scholar]
- Williams, R.M.; O’Brien, L.; Eagles, H.A.; Solah, V.A.; Jayasena, V. The influences of genotype, environment, and genotype × environment interaction on wheat quality. Aust. J. Agric. Res. 2008, 59, 95–111. [Google Scholar] [CrossRef]
- Ames, N.P.; Clarke, J.M.; Dexter, J.E.; Woods, S.M.; Selles, F.; Marchylo, B. Effects of nitrogen fertilizer on protein quantity and gluten strength parameters in durum wheat (Triticum turgidum L. var. durum) cultivars of variable gluten strength. Cereal Chem. 2003, 80, 113–243. [Google Scholar]
- D’egidio, M.G.; Mariani, B.M.; Nardi, S.; Novaro, P.; Cubadda, R. Chemical and technological variables and their relationships: A predictive equation for pasta cooking quality. Cereal Chem. 1990, 67, 275–281. [Google Scholar]
- Novaro, P.; D’egidio, M.G.; Mariani, B.M.; Nardi, S. Combined effect of protein content and high-temperature drying systems on pasta cooking quality. Cereal Chem. 1993, 70, 716–719. [Google Scholar]
- Mariani, B.M.; D’egidio, M.G.; Novaro, P. Durum wheat quality evaluation: Influence of genotype and environment. Cereal Chem. 1995, 72, 194–197. [Google Scholar]
- Punia, H.; Madan, S.; Malik, A.; Sk, S. Stability analysis for quality attributes in durum wheat (Triticum durum L.) genotypes. Bangladesh J. Bot. 2019, 48, 967–972. [Google Scholar] [CrossRef]
- Saint Pierre, C.; Peterson, C.J.; Ross, A.S.; Ohm, J.B.; Verhoeven, M.C.; Larson, M.; Hoefer, B. Winter wheat genotypes under different levels of nitrogen and water stress: Changes in grain protein composition. J. Cereal Sci. 2008, 47, 407–416. [Google Scholar] [CrossRef]
- Lupini, A.; Preiti, G.; Badagliacca, G.; Abenavoli, M.R.; Sunseri, F.; Monti, M.; Bacchi, M. Nitrogen use efficiency in durum wheat under different nitrogen and water regimes in the Mediterranean basin. Front. Plant Sci. 2021, 11, 607226. [Google Scholar] [CrossRef]
- Uhlen, A.K.; Hafskjold, R.; Kalhovd, A.H.; Sahlstrom, S.; Longva, A.; Magnus, E.M. Effects of cultivar and temperature during grain filling on wheat protein content, composition, and dough mixing properties. Cereal Chem. 1998, 75, 460–465. [Google Scholar] [CrossRef]
- Moldestad, A.; Fergestad, E.M.; Hoel, B.; Skjelvag, A.O.; Uhlen, A.K. Effect of temperature variation during grain filling on wheat gluten resistance. J. Cereal Sci. 2011, 53, 347–354. [Google Scholar] [CrossRef]
- Ayed, S.; Othmani, A.; Bechrif, S.; Rezgui, M.; Ben Younes, M. Correlation between agronomical and quality traits in durum wheat (Triticum durum Desf.) germplasm in semi-arid environment. Adv. Plants Agric Res. 2018, 8, 612–615. [Google Scholar]
- Sliwinski, E.; Kolster, P.; Prins, A.; Van Vliet, T. On the relationship between gluten protein composition of wheat flours and large deformation properties of the doughs. J. Cereal Sci. 2004, 39, 247–264. [Google Scholar] [CrossRef]
- Lyons, G.; Ortiz-Monasterio, I.; Stangoulis, J.; Graham, R. Selenium concentration in wheat grain: Is there sufficient genotypic variation to use in breeding? Plant Soil 2005, 269, 369–380. [Google Scholar] [CrossRef]
- Hawkesford, M.J.; Zhao, F. Strategies for increasing the selenium content of wheat. J. Cereal Sci. 2007, 46, 282–292. [Google Scholar] [CrossRef]
- Iqbal, M.; Hussain, I.; Liaqat, H.; Ashraf, M.A.; Rasheed, R.; Rehman, A.U. Exogenously applied selenium reduces oxidative stress and induces heat tolerance in spring wheat. Plant Physiol. Biochem. 2015, 94, 95–103. [Google Scholar] [CrossRef]
- USDA. Soil Classification: A Comprehensives System (Pre-Pared by) Soil Survey Staff; Government Printing Office: Washington, DC, USA, 2013.
- Zadoks, J.C.; Chang, T.T.; Konzak, C.F.A. Decimal code for the growth stages of cereals. Weed Res. 1974, 14, 415–421. [Google Scholar] [CrossRef]


| Sources of Variance | df | F |
|---|---|---|
| E | 1 | 19,454.70 ** |
| SeTR | 1 | 292.45 ** |
| C | 24 | 28.92 ** |
| E × SeTR | 1 | 55.34 ** |
| E × C | 24 | 22.91 ** |
| SeTR × C | 24 | 3.15 ** |
| E × SeTR × C | 24 | 3.13 ** |
| Kef–Boulifa Environment | ||
| SeTR | 1 | 42.31 ** |
| C | 24 | 6.60 ** |
| SeTR × C | 24 | 0.84 ns |
| Beja Environment | ||
| SeTR | 1 | 335.74 ** |
| C | 24 | 49.65 ** |
| SeTR × C | 24 | 5.96 ns |
| Cultivars | Grain Yield (kg m−2) | |||
|---|---|---|---|---|
| Kef–Boulifa Environment | Beja Environment | |||
| Without Se | With Se | Without Se | With Se | |
| Advanced Lines | ||||
| L1 | 0.15 b | 0.16 ab | 0.36 b | 0.38 b |
| L2 | 0.12 d | 0.13 d | 0.40 a | 0.42 a |
| L3 | 0.12 d | 0.13 d | 0.34 b | 0.36 b |
| L4 | 0.13 cd | 0.14 cd | 0.31 cd | 0.34 bc |
| L5 | 0.15 b | 0.16 ab | 0.31 cd | 0.34 bc |
| L6 | 0.14 bc | 0.16 ab | 0.30 cd | 0.34 bc |
| L7 | 0.13 cd | 0.15 bc | 0.27 d | 0.29 e |
| L8 | 0.14 bc | 0.16 ab | 0.33 b | 0.35 bc |
| L9 | 0.14 bc | 0.16 ab | 0.31 cd | 0.34 bc |
| L10 | 0.13 cd | 0.15 bc | 0.29 d | 0.30 de |
| L11 | 0.15 b | 0.17 a | 0.32 bc | 0.34 bc |
| L12 | 0.16 a | 0.17 a | 0.30 cd | 0.33 cd |
| L13 | 0.12 d | 0.14 cd | 0.30 cd | 0.33 cd |
| L14 | 0.13 cd | 0.14 cd | 0.33 b | 0.35 bc |
| L15 | 0.13 cd | 0.14 cd | 0.27 d | 0.29 e |
| L16 | 0.13 cd | 0.15 bc | 0.29 d | 0.30 de |
| Mean | 0.14 | 0.15 | 0.32 | 0.34 |
| Modern Varieties | ||||
| Dhahbi | 0.13 cd | 0.15 bc | 0.33 b | 0.35 bc |
| INRAT 100 | 0.14 bc | 0.15 bc | 0.33 b | 0.34 bc |
| Salim | 0.13 cd | 0.14 cd | 0.32 bc | 0.35 bc |
| Maali | 0.13 cd | 0.14 cd | 0.30 cd | 0.30 de |
| Nasr | 0.13 cd | 0.14 cd | 0.31 cd | 0.32 de |
| Om Rabiaa | 0.12 d | 0.13 d | 0.32 bc | 0.33 cd |
| Khiar | 0.10 e | 0.11 e | 0.25 e | 0.27 f |
| Rezzak | 0.13 cd | 0.15 bc | 0.30 cd | 0.31 de |
| Karim | 0.12 d | 0.13 d | 0.30 cd | 0.31 de |
| Mean | 0.13 | 0.14 | 0.30 | 0.32 |
| Global Mean | 0.13 | 0.14 | 0.31 | 0.33 |
| Sources of Variation | df | Moisture Content | Protein Content | Gluten Content | Zeleny Sedimentation Index | Deformation Energy |
|---|---|---|---|---|---|---|
| E | 1 | 1308.23 *** | 510.85 *** | 41.49 *** | 32.49 * | 22.09 *** |
| SeTR | 1 | 0.80 ns | 359.70 *** | 63.95 *** | 42.95 ** | 0.38 ns |
| C | 24 | 3.70 *** | 10.63 *** | 1.78 * | 9.16 * | 11.66 *** |
| E × SeTR | 1 | 68.26 *** | 16.97 *** | 5.61 * | 8.14 * | 17.75 *** |
| E × C | 24 | 3.40 *** | 7.34 *** | 1.26 ns | 10.26 ** | 10.71 *** |
| SeTR × C | 24 | 4.50 *** | 4.17 *** | 0.70 ns | 5.13 ** | 4.98 *** |
| E × SeTR × C | 24 | 3.23 *** | 3.89 *** | 1.03 ns | 0.18 ns | 10.38 *** |
| Kef–Boulifa Environment | ||||||
| SeTR | 1 | 27.89 *** | 264.15 *** | 4.89 * | 7.23 * | 130.06 *** |
| C | 24 | 8.55 *** | 42.70 *** | 1.44 ns | 12.52 * | 156.74 *** |
| SeTR × C | 24 | 11.28 *** | 11.96 *** | 0.76 ns | 2.43 * | 224.54 *** |
| Beja Environment | ||||||
| SeTR | 1 | 32.09 *** | 695.29 *** | 82.82 *** | 29.96 ** | 239.72 *** |
| C | 24 | 1.54 ns | 26.29 *** | 2.15 ** | 4.11 ** | 330.24 *** |
| SeTR × C | 24 | 1.84 * | 16.42 *** | 1.93 ** | 3.64 ** | 156.60 *** |
| Cultivars | Moisture Content (%) | Protein Content (%) | Gluten Content (%) | |||||||||
| Kef–Boulifa Environment | Beja Environment | Kef–Boulifa Environment | Beja Environment | Kef–Boulifa Environment | Beja Environment | |||||||
| Without Se | With Se | Without Se | With Se | Without Se | With Se | Without Se | With Se | Without Se | With Se | Without Se | With Se | |
| Advances Lines | ||||||||||||
| L1 | 8.75 c | 9.12 cd | 10.82 a | 10.93 cd | 12.69 a | 12.86 bc | 14.86 a | 15.31 a | 34.31 a | 39.30 a | 33.89 ab | 34.95 c |
| L2 | 8.77 c | 9.18 cd | 10.77 a | 11.33 ab | 11.61 ab | 12.57 bc | 12.23 cd | 14.41 bc | 30.23 ab | 34.97 bc | 34.23 a | 35.96 bc |
| L3 | 8.88 c | 8.96 d | 10.53 ab | 10.84 cd | 13.08 a | 14.38 a | 15.67 a | 16.38 a | 33.10 a | 36.84 b | 30.27 c | 34.86 c |
| L4 | 9.02 bc | 9.51 bc | 10.43 ab | 11.11 ab | 12.12 ab | 13.39 ab | 12.89 bc | 15.06 ab | 30.75 ab | 31.00 bc | 32.85 bc | 38.21 a |
| L5 | 8.88 c | 9.10 cd | 10.19 b | 11.19 ab | 12.02 ab | 12.85 bc | 12.56 bc | 14.85 ab | 31.08 ab | 32.57 bc | 30.87 c | 36.95 bc |
| L6 | 8.87 c | 9.27 cd | 10.22 b | 11.28 ab | 13.02 a | 13.19 ab | 14.67 a | 15.08 ab | 34.83 a | 36.31 b | 31.52 c | 39.48 a |
| L7 | 9.15 bc | 9.41 bc | 10.18 b | 10.60 c | 12.40 a | 12.69 bc | 14.59 a | 15.70 a | 31.00 ab | 35.64 b | 31.23 c | 35.61 bc |
| L8 | 9.16 bc | 9.37 bc | 10.64 ab | 11.20 ab | 11.93 ab | 12.83 bc | 14.08 ab | 14.83 ab | 30.07 ab | 34.28 bc | 33.07 ab | 34.51 c |
| L9 | 9.18 bc | 10.03 ab | 10.79 a | 10.97 ab | 11.54 ab | 13.01 ab | 14.85 a | 15.95 a | 29.83 ab | 31.94 cd | 34.60 a | 37.63 ab |
| L10 | 9.06 bc | 10.33 a | 10.80 a | 11.09 ab | 12.01 ab | 14.83 a | 13.34 ab | 13.90 bc | 28.75 b | 32.97 bc | 33.10 ab | 37.75 ab |
| L11 | 9.18 bc | 10.31 a | 10.79 a | 11.11 ab | 12.47 a | 13.89 a | 14.70 a | 14.87 ab | 32.84 ab | 35.71 b | 34.14 a | 37.55 ab |
| L12 | 8.99 c | 10.23 a | 10.38 ab | 11.09 ab | 11.04 bc | 13.22 ab | 13.08 bc | 13.90 bc | 29.45 bc | 34.66 bc | 34.71 a | 35.64 bc |
| L13 | 9.05 bc | 10.34 a | 10.10 b | 10.46 c | 12.47 a | 12.72 bc | 12.60 bc | 13.94 bc | 30.95 ab | 32.97 bc | 34.31 a | 35.51 bc |
| L14 | 9.32 ab | 10.44 a | 10.63 a | 10.96 ab | 12.69 a | 13.41 ab | 12.94 bc | 15.20 a | 29.47 bc | 35.49 b | 31.60 c | 39.49 a |
| L15 | 9.48 a | 10.20 ab | 10.27 b | 10.60 c | 12.41 a | 13.78 ab | 14.02 ab | 15.78 a | 32.26 ab | 34.98 bc | 34.77 a | 38.98 a |
| L16 | 9.51 a | 10.07 ab | 10.68 a | 11.66 a | 12.65 a | 13.02 ab | 13.85 ab | 14.33 bc | 29.47 bc | 32.83 bc | 34.63 a | 35.59 bc |
| Mean | 9.08 | 9.74 | 10.51 | 11.03 | 12.26 | 13.29 | 13.81 | 14.97 | 31.15 | 34.53 | 33.11 | 36.79 |
| Modern Varieties | ||||||||||||
| Dhahbi | 9.97 a | 10.11 ab | 10.80 a | 10.89 cd | 13.49 a | 14.06 a | 12.79 bc | 12.95 c | 31.65 ab | 33.37 bc | 34.09 a | 36.85 bc |
| INRAT 100 | 8.88 c | 9.53 bc | 10.56 ab | 11.11 ab | 12.11 ab | 13.13 ab | 13.87 ab | 15.91 a | 31.32 ab | 32.39 bc | 31.46 c | 34.83 c |
| Salim | 9.15 bc | 9.19 cd | 10.83 a | 11.09 ab | 10.74 bc | 11.66 c | 14.97 a | 16.08 a | 29.12 bc | 30.93 bc | 31.68 c | 35.19 bc |
| Maali | 8.21 c | 8.90 d | 10.06 b | 10.59 c | 11.71 ab | 13.35 ab | 14.05 ab | 15.08 ab | 30.09 ab | 34.32 bc | 31.33 c | 35.43 bc |
| Nasr | 9.18 bc | 9.92 ab | 10.56 ab | 11.51 a | 10.82 bc | 11.32 c | 11.98 cd | 13.08 c | 30.98 ab | 32.70 bc | 34.36 a | 37.77 ab |
| Om Rabiaa | 9.36 ab | 9.68 bc | 10.47 ab | 10.88 cd | 12.09 ab | 13.52 ab | 12.41 cd | 15.52 a | 30.90 ab | 33.05 bc | 28.93 cd | 31.05 d |
| Khiar | 9.09 bc | 9.27 cd | 10.59 ab | 11.68 a | 10.95 bc | 11.92 bc | 12.89 bc | 15.76 a | 28.48 b | 30.19 bc | 30.55 c | 33.83 cd |
| Rezzak | 9.30 ab | 9.64 bc | 10.44 ab | 10.53 c | 11.92 ab | 12.37 bc | 12.03 cd | 14.37 bc | 30.61 ab | 32.15 bc | 23.77 d | 28.15 d |
| Karim | 9.28 ab | 10.35 a | 10.82 a | 11.57 a | 11.39 ab | 12.97 bc | 11.27 d | 12.97 c | 31.40 ab | 33.09 bc | 26.76 cd | 31.20 d |
| Mean | 9.19 | 9.84 | 10.51 | 11.04 | 11.92 | 12.92 | 13.10 | 14.66 | 30.51 | 32.47 | 30.33 | 33.81 |
| Global Mean | 9.13 | 9.79 | 10.51 | 11.03 | 12.09 | 13.10 | 13.46 | 14.81 | 30.83 | 33.50 | 31.72 | 35.30 |
| Cultivars | Zeleny Sedimentation Index (cm3) | Deformation Energy (10−4 J) | ||||||||||
| Kef–Boulifa Environment | Beja Environment | Kef–Boulifa Environment | Beja Environment | |||||||||
| Without Se | With Se | Without Se | With Se | Without Se | With Se | Without Se | With Se | |||||
| Advances Lines | ||||||||||||
| L1 | 34.31 a | 36.15 a | 35.95 a | 36.89 a | 209.49 b | 245.06 b | 185.85 d | 213.86 d | ||||
| L2 | 30.11 cd | 32.17 cd | 34.87 a | 37.12 a | 219.48 b | 225.80 c | 277.83 a | 285.75 b | ||||
| L3 | 33.10 a | 34.11 b | 34.86 a | 36.43 a | 238.34 a | 255.19 a | 240.96 bc | 280.74 b | ||||
| L4 | 30.71 cd | 32.00 cd | 33.21 ab | 34.34 bc | 200.23 c | 210.96 c | 224.85 c | 237.01 c | ||||
| L5 | 30.08 cd | 32.57 cd | 33.95 bc | 36.89 a | 188.25 c | 213.27 c | 253.14 b | 264.83 bc | ||||
| L6 | 32.83 ab | 34.31 b | 34.48 a | 35.23 ab | 221.65 b | 242.19 b | 224.61 c | 255.83 bc | ||||
| L7 | 32.00 ab | 33.64 bc | 34.61 a | 35.65 ab | 248.68 a | 261.86 a | 150.99 e | 171.37 e | ||||
| L8 | 31.07 bc | 32.28 cd | 33.51 bc | 34.54 bc | 194.52 c | 210.24 c | 197.66 d | 226.28 c | ||||
| L9 | 30.83 cd | 31.90 cd | 32.63 cd | 34.14 bc | 218.88 b | 223.48 c | 214.00 c | 233.64 c | ||||
| L10 | 31.65 bc | 34.97 b | 33.75 bc | 35.54 ab | 188.99 c | 219.12 c | 196.43 d | 210.10 d | ||||
| L11 | 33.64 a | 34.71 b | 35.55 a | 36.64 a | 196.16 c | 223.34 c | 172.04 de | 180.83 de | ||||
| L12 | 30.11 cd | 32.66 cd | 32.64 cd | 34.71 bc | 185.51 c | 218.83 c | 189.32 d | 213.11 d | ||||
| L13 | 29.35 d | 31.97 d | 33.51 bc | 34.31 bc | 194.03 c | 224.10 c | 190.35 d | 210.28 d | ||||
| L14 | 30.47 cd | 31.49 cd | 32.49 cd | 34.60 bc | 196.88 c | 230.58 bc | 272.50 a | 285.36 b | ||||
| L15 | 32.26 ab | 33.98 b | 32.98 cd | 34.77 bc | 202.32 bc | 213.17 c | 257.67 b | 277.07 b | ||||
| L16 | 29.16 d | 32.83 cd | 34.59 a | 35.63 ab | 210.95 b | 251.42 a | 167.23 de | 185.47 de | ||||
| Mean | 31.36 | 33.23 | 33.97 | 35.46 | 207.15 | 229.29 | 213.46 | 233.22 | ||||
| Modern Varieties | ||||||||||||
| Dhahbi | 32.47 ab | 34.23 b | 31.85 d | 34.09 bc | 180.43 c | 244.76 b | 179.00 de | 192.54 d | ||||
| INRAT 100 | 32.42 ab | 32.97 cd | 32.83 cd | 34.46 bc | 197.95 | 244.58 b | 184.05 d | 187.69 de | ||||
| Salim | 29.23 d | 31.34 cd | 32.19 cd | 33.68 c | 176.72 cd | 182.30 d | 266.00 a | 304.32 a | ||||
| Maali | 31.39 bc | 35.12 a | 33.43 bc | 35.56 ab | 240.35 a | 263.03 a | 263.11 a | 285.59 b | ||||
| Nasr | 30.12 cd | 33.65 bc | 34.43 a | 35.36 ab | 187.49 c | 189.99 d | 199.01 d | 228.95 c | ||||
| Om Rabiaa | 29.32 d | 33.05 bc | 31.05 d | 34.93 bc | 196.74 c | 223.74 c | 190.17 d | 213.40 d | ||||
| Khiar | 30.34 cd | 31.19 cd | 33.83 bc | 34.55 bc | 165.76 d | 208.74 c | 159.77 e | 176.67 e | ||||
| Rezzak | 32.61 ab | 33.15 bc | 32.15 cd | 34.77 bc | 171.21 d | 182.83 d | 147.89 e | 172.90 e | ||||
| Karim | 29.40 d | 31.15 cd | 30.20 d | 32.76 c | 161.06 d | 181.97 d | 177.34 de | 203.92 d | ||||
| Mean | 30.71 | 32.81 | 32.82 | 34.64 | 186.41 | 213.55 | 196.26 | 218.44 | ||||
| Global Mean | 31.03 | 33.02 | 33.40 | 35.05 | 196.78 | 221.42 | 204.86 | 225.83 | ||||
| Genetic Material | Pedigree | |
|---|---|---|
| N° | Name | |
| Advanced Lines | ||
| 1 | L1 | Karim/4/BD2337//D68-8-6A-3A/Karim“S”/3/Src2/Src1 |
| 2 | L2 | Site/3×Musk-4//Nasr/3/Maali |
| 3 | L3 | Dipper/3/Hui//Cit71/Cii/4/Chen/Altar84/6/Srn2/Bisu/4/Khp/D31708//Khp/3/Corm/5/Site/3×Musk-4/7/Lgt3/4/Bcr/3/Ch1//Gta/Stk |
| 4 | L4 | Somat-4/Silver-1//Site/3×Musk-4/3/Salim |
| 5 | L5 | Site/3×Musk-4//Salim/4/Bcr/Guerou-1/3/Minimus-6/Plata-16//Immer/5/Maali |
| 6 | L6 | Salim//D68-8-6a-3a/D68-8-93a-1a |
| 7 | L7 | Maali/Zeina-4/5/Somo“s”/Stn“s”/3/Tez“s”/Yav79//Hui“s”/4/Chen/Altar84 |
| 8 | L8 | Maali/Zeina-4/5/Somo“s”/Stn“s”/3/Tez“s”/Yav79//Hui“s”/4/Chen/Altar84 |
| 9 | L9 | Site/3×Musk-4//Salim/4/Bcr/Guerou-1/3/Minimus-6/Plata-16//Immer/5/Maali |
| 10 | L10 | Karim//Cado/Boomer-33 |
| 11 | L11 | Karim/Grecale//Salim |
| 12 | L12 | Salim/Neodur |
| 13 | L13 | Maali/4/Stot//Altar 84/Ald/3/Patka_7/Yazi_1/5/Altar 84//Fd8419-126-1-2/ Razzak/3/Krf-Dw/Baladia Hamra=cdss07y00659t-W-1b-12b-7b-0b |
| 14 | L14 | Maali/4/Arment//Srn_3/Nigris_4/3/Canelo_9.1/5/Altar84//Fd8419-126-1-2/Razzak/3/Krf-Dw/BaladiaHamra=Cdss07y00661t-L-2b-3b-14b-0b |
| 15 | L15 | Grecale/7/Ainzen-1/6/2×Cmh82a.1062/3/Gdovz394//Sba81/Plc/4/Aaz-1/Crex/5/Hui//Cit71/Cii/8/Maali |
| 16 | L16 | Grecale/7/Ainzen-1/6/2×Cmh82a.1062/3/Gdovz394//Sba81/Plc/4/Aaz-1/Crex/5/Hui//Cit71/Cii/8/Maali |
| Modern Varieties | ||
| 17 | Dhahbi | Karim/4/BD2337//D68-8-6A3A/Karim“S”/3/Src2/Src1 |
| 18 | INRAT 100 | Maali/8/Green_2/Himan_12//Ship_1/7/Eco/Cmh76a.722//Bit/3/Altar84/4/Ajaia_/5/Kjove_1/6/Malmuk_1/Serrator_1/9/Salim/5/Sula/Aaz_5//Chen/Altar84/3/Ajaia_12/F3local(Sel.Ethio.135.85)//Plata_13/4/Arment//Srn_3/Nigris_4/3/Canelo_91 |
| 19 | Salim | ALTAR84//FD8419-126-1-2/Razzak/3/Krf/Baladia Hamra |
| 20 | Maali | CMH80A.1060/4/TTURA/CMH74A.370//CMH77.774/3/YAV79/5/Razzak/6/DACK“S”/YEL“S”//Khiar |
| 21 | Nasr | GdoVZ512/Cit//Ruff/Fg/3/Pin/Gre//TrobICD85-1340-ABL-6AP-0TR-10b-3b-0b |
| 22 | Om Rabiaa | JoC69/Haurani |
| 23 | Khiar | CHEN“S”/ALTAR84 |
| 24 | Rezzak | DMX69-331/Karim |
| 25 | Karim | 21563/AA“S”//FG“S” |
| Environments | Total | Oct | Nov | Dec | Jan | Feb | Mar | Apr | May | Jun | |
|---|---|---|---|---|---|---|---|---|---|---|---|
| Rainfall (mm) | Kef–Boulifa | 281.6 | 14.2 | 39.8 | 50.6 | 9.2 | 3 | 66.2 | 70.9 | 1.4 | 26.3 |
| Beja | 409.2 | 30.4 | 68.6 | 74.2 | 20.2 | 2.6 | 101.7 | 105.5 | 1.6 | 4.4 | |
| Mean | 345.4 | 108.4 | 60.7 | 52.9 | 127.4 | 61.9 | 95.9 | 40.3 | 103.2 | 1.6 | |
| Temperature (°C) | Kef–Boulifa | 131.8 | 17.8 | 13.6 | 10.9 | 7.7 | 10.3 | 13.4 | 14.8 | 17.4 | 25.6 |
| Beja | 150.9 | 18.5 | 17.1 | 15.6 | 13.4 | 12.9 | 16.6 | 13.2 | 17.3 | 26.3 | |
| Mean | 141.3 | 18.1 | 15.3 | 13.2 | 10.5 | 11.6 | 15.0 | 14.0 | 17.3 | 25.9 | |
| Evapotranspiration (mm month−1) | Kef–Boulifa | 150.3 | 145.7 | 105.0 | 80.6 | 80.6 | 106.4 | 148.8 | 186.0 | 235.6 | 264.0 |
| Beja | 145.9 | 148.8 | 93.0 | 74.4 | 65.1 | 106.4 | 139.5 | 183.0 | 254.2 | 249.0 | |
| Mean | 148.1 | 147.3 | 99.0 | 77.5 | 72.9 | 106.4 | 144.2 | 184.5 | 244.9 | 256.5 |
Publisher’s Note: MDPI stays neutral with regard to jurisdictional claims in published maps and institutional affiliations. |
© 2022 by the authors. Licensee MDPI, Basel, Switzerland. This article is an open access article distributed under the terms and conditions of the Creative Commons Attribution (CC BY) license (https://creativecommons.org/licenses/by/4.0/).
Share and Cite
Ayed, S.; Bouhaouel, I.; Othmani, A. Screening of Durum Wheat Cultivars for Selenium Response under Contrasting Environments, Based on Grain Yield and Quality Attributes. Plants 2022, 11, 1437. https://doi.org/10.3390/plants11111437
Ayed S, Bouhaouel I, Othmani A. Screening of Durum Wheat Cultivars for Selenium Response under Contrasting Environments, Based on Grain Yield and Quality Attributes. Plants. 2022; 11(11):1437. https://doi.org/10.3390/plants11111437
Chicago/Turabian StyleAyed, Sourour, Imen Bouhaouel, and Afef Othmani. 2022. "Screening of Durum Wheat Cultivars for Selenium Response under Contrasting Environments, Based on Grain Yield and Quality Attributes" Plants 11, no. 11: 1437. https://doi.org/10.3390/plants11111437