
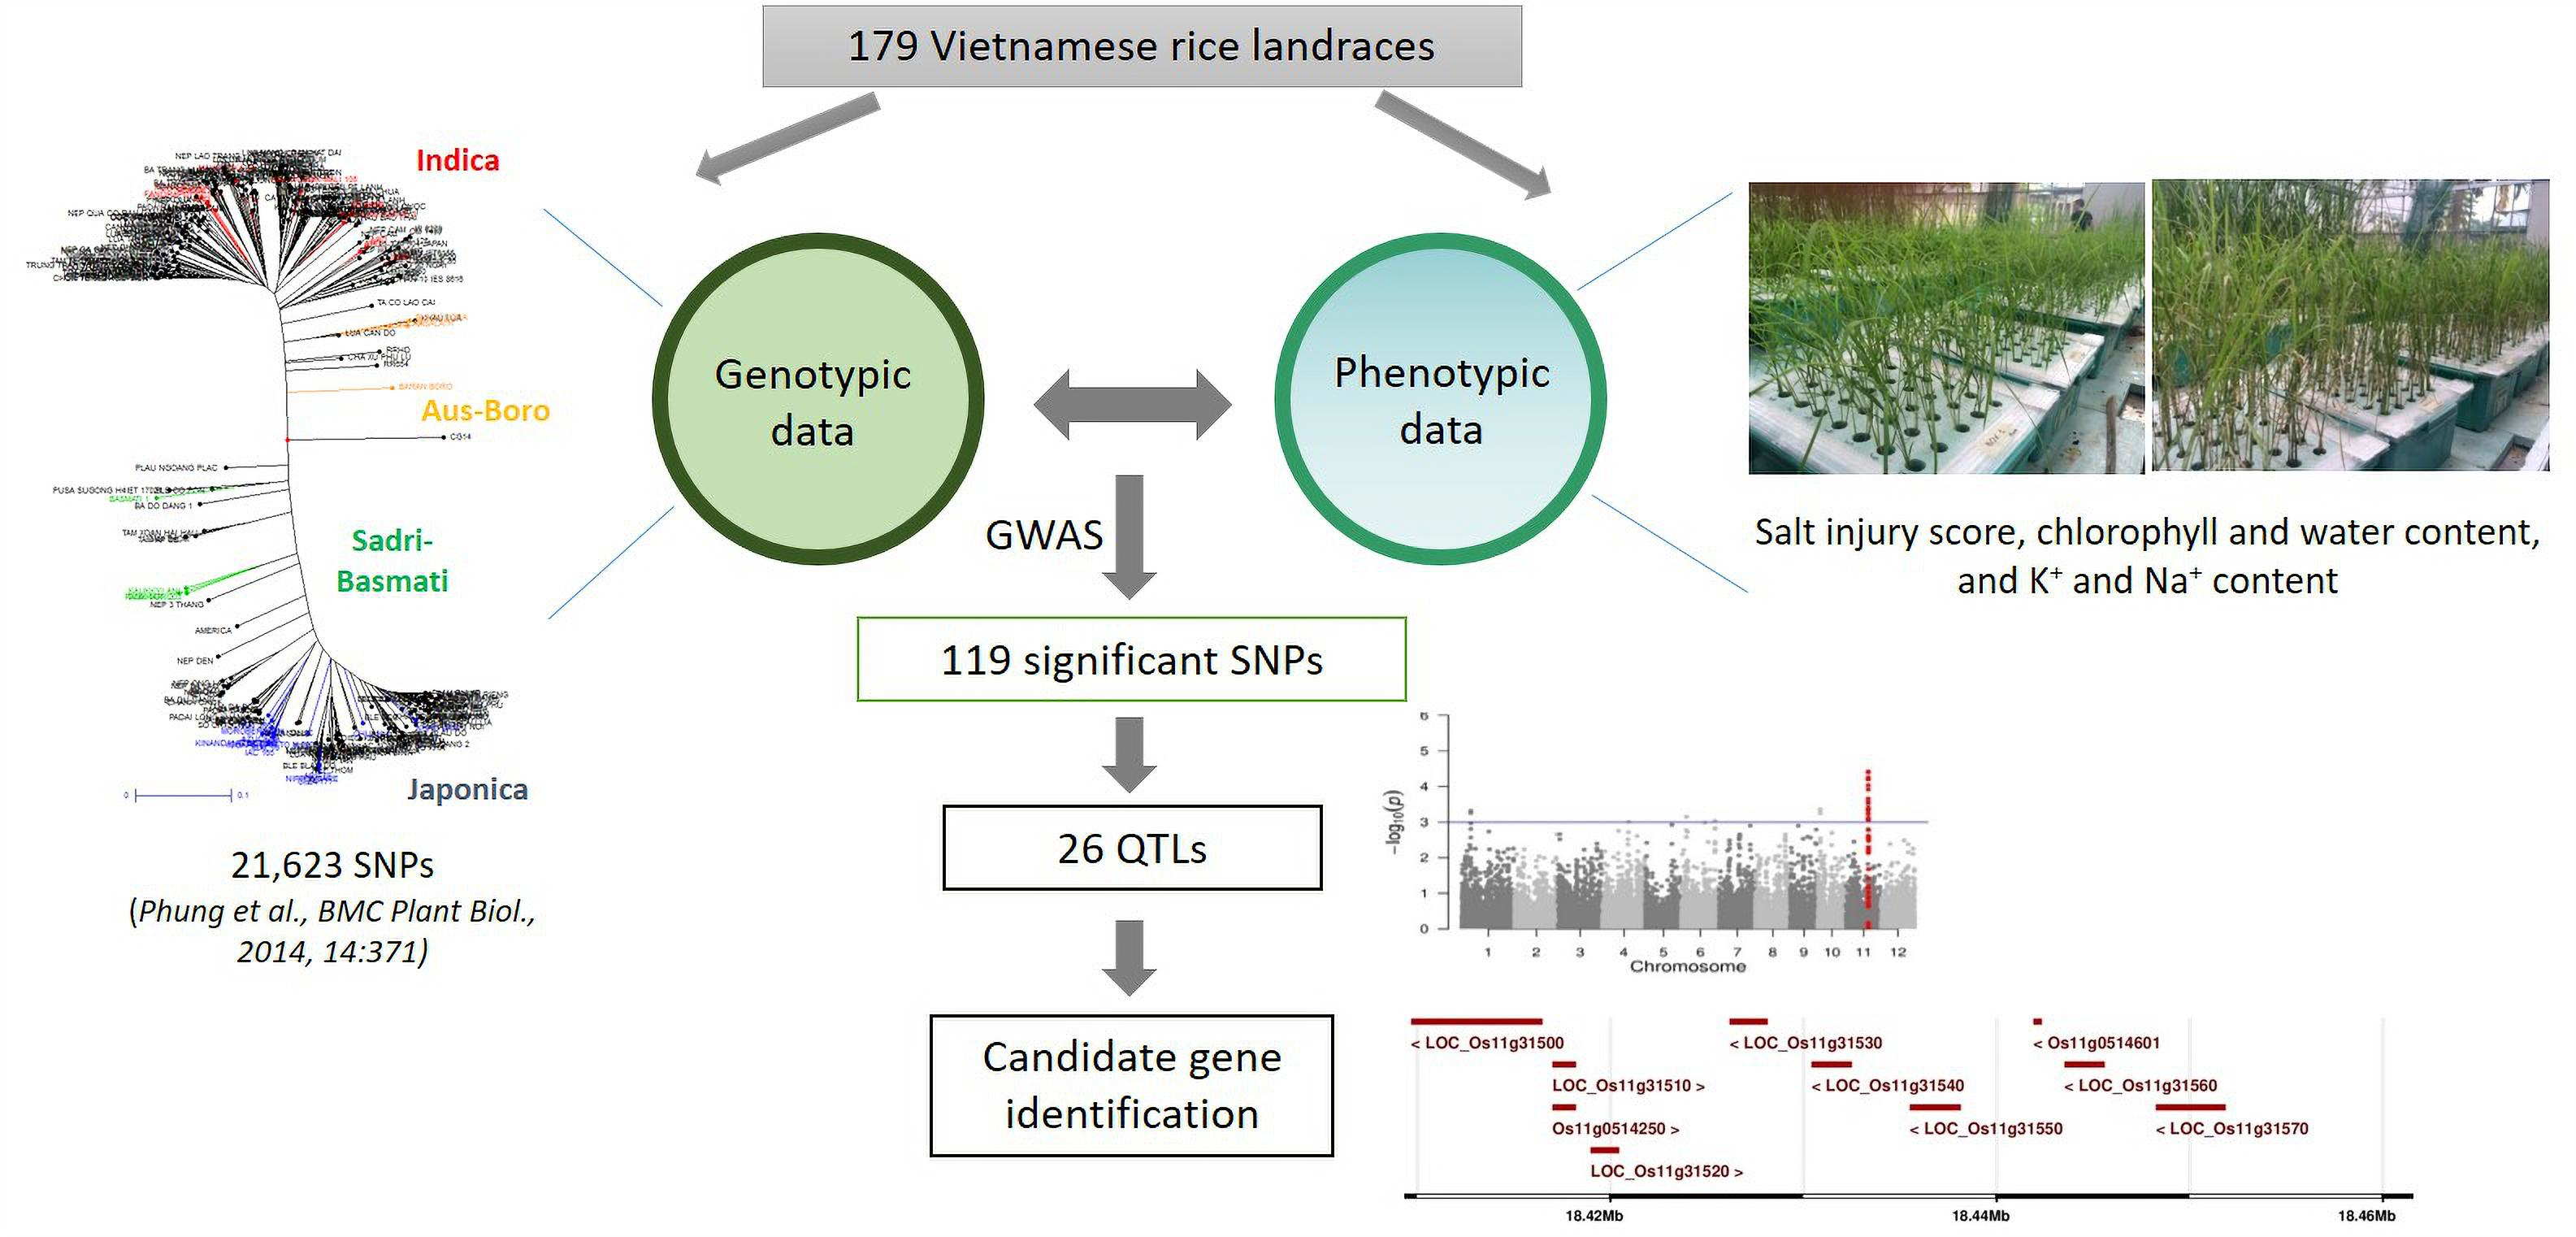
Genome-Wide Association Mapping of Salinity Tolerance at the Seedling Stage in a Panel of Vietnamese Landraces Reveals New Valuable QTLs for Salinity Stress Tolerance Breeding in Rice

 , and
, and
Abstract
:
1. Introduction
2. Results
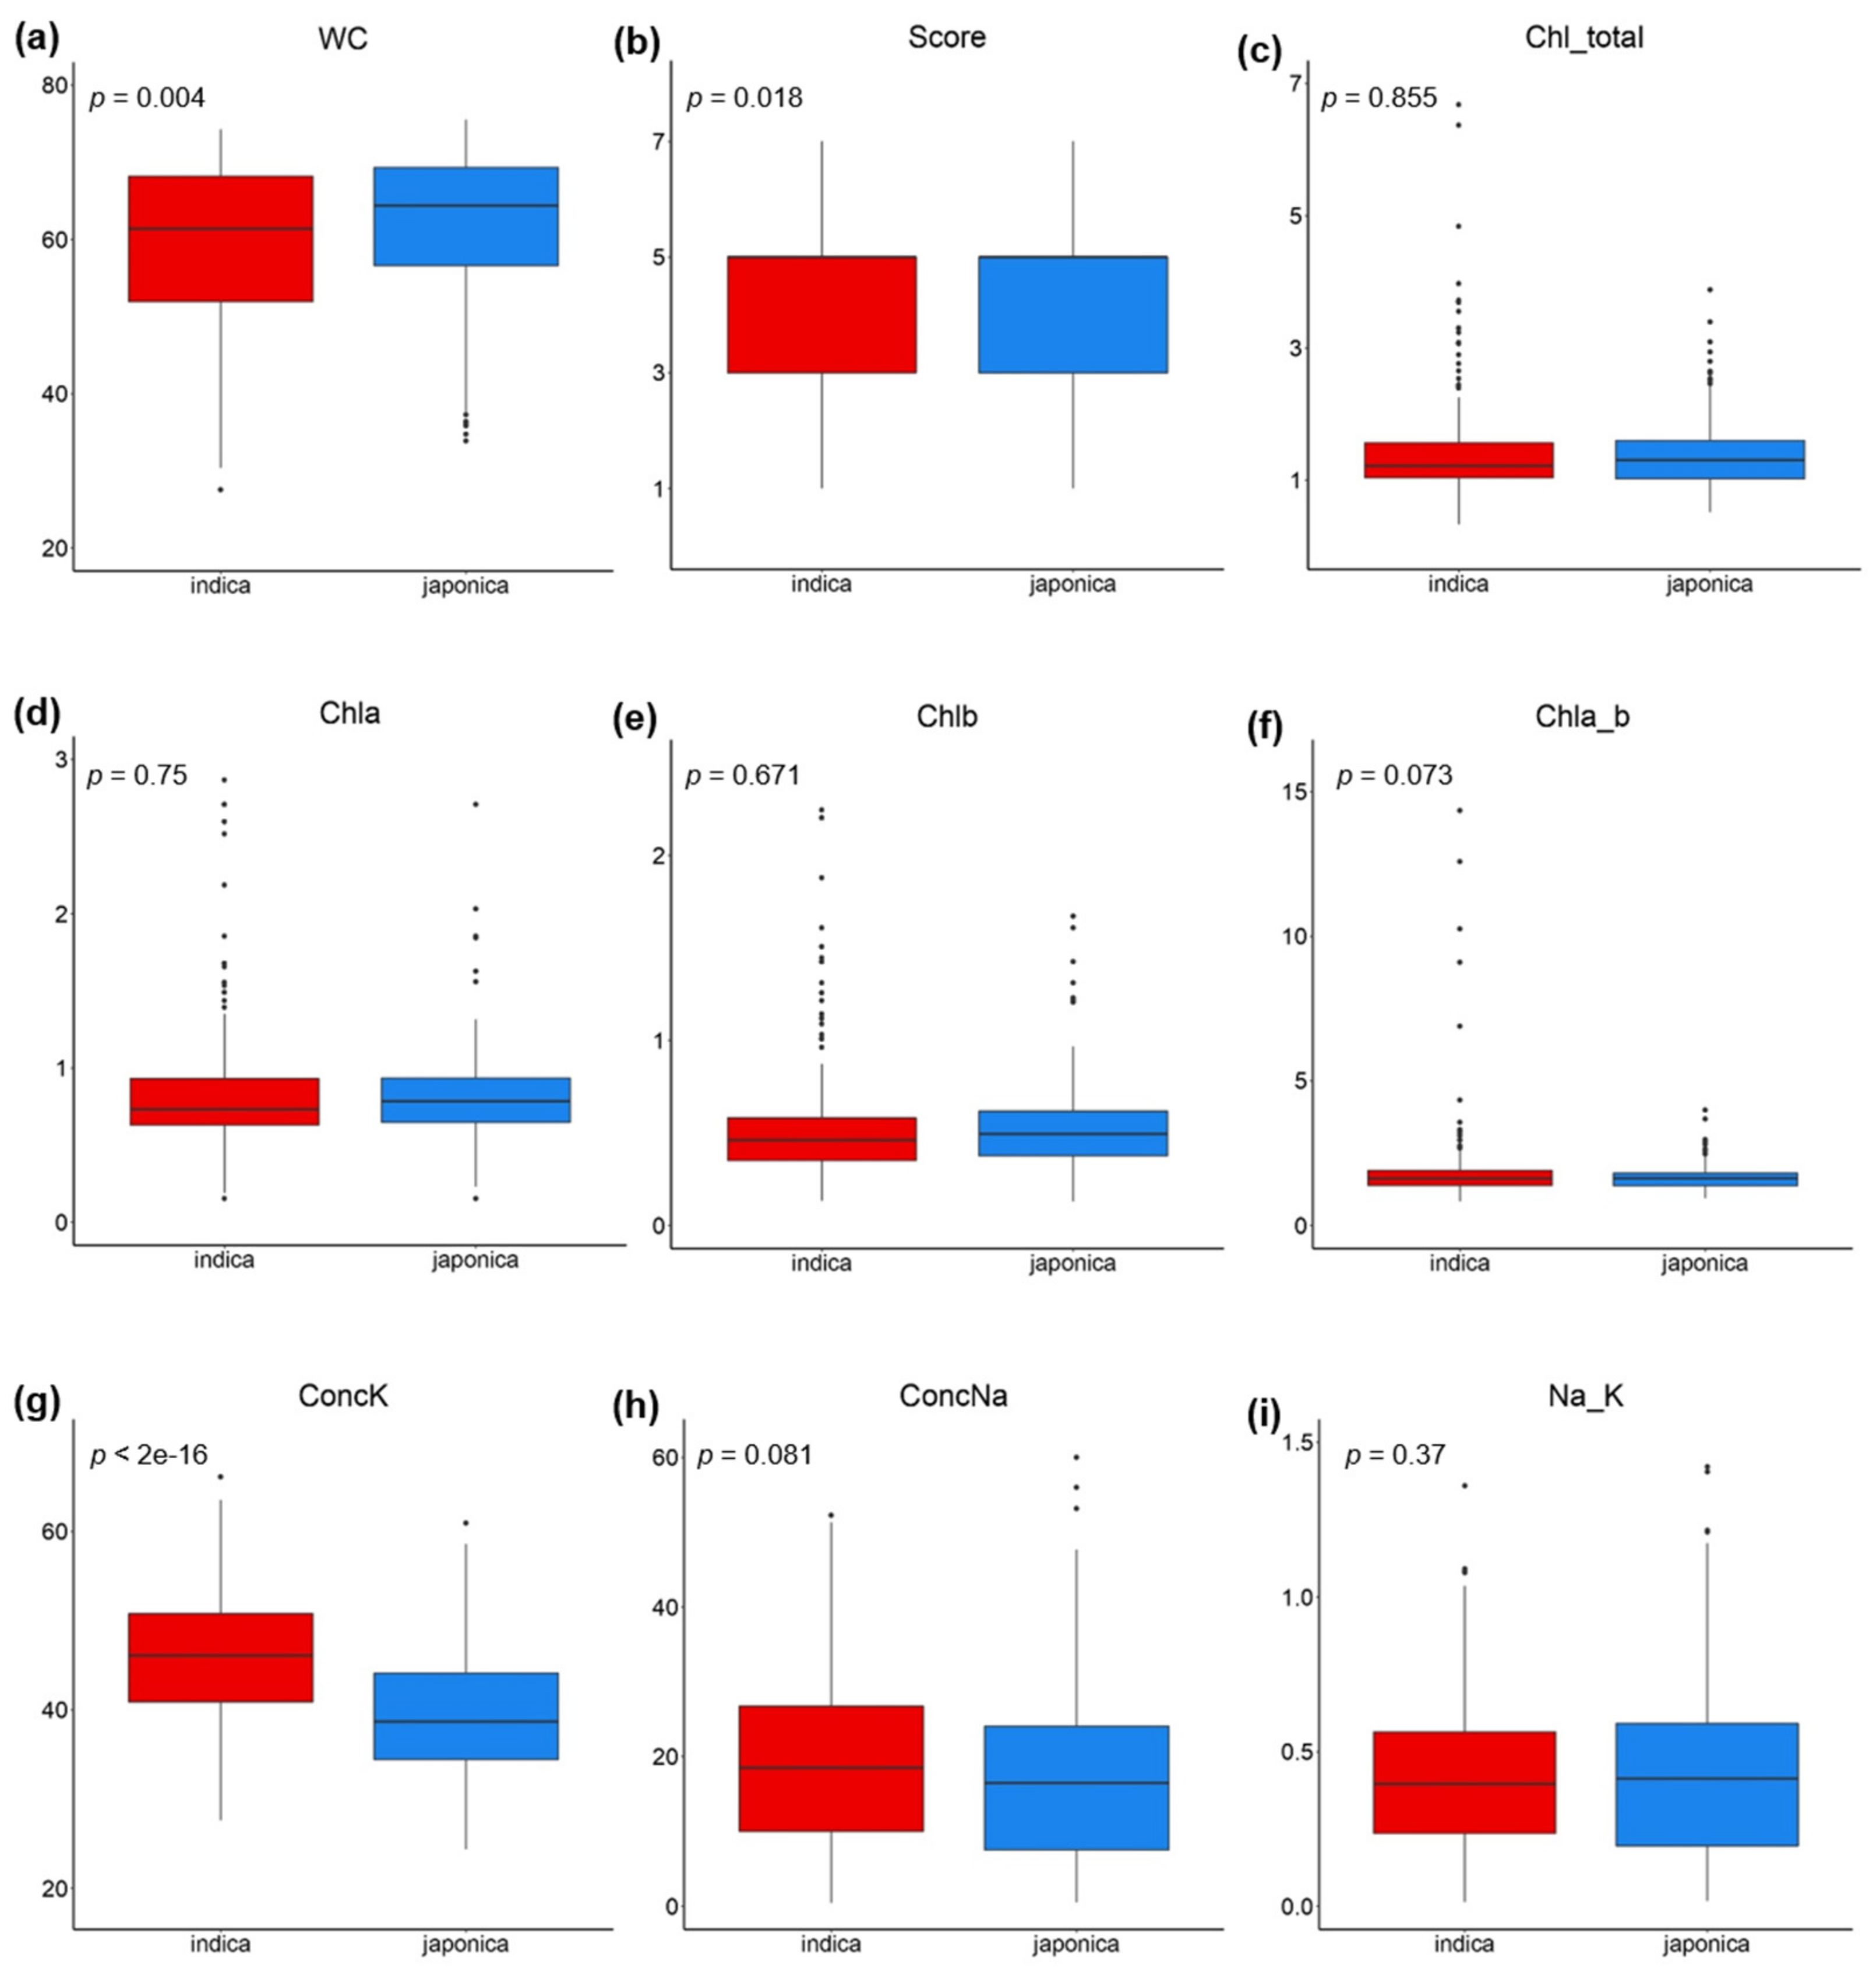
2.1. Phenotypic Variation and Heritability of Salinity Tolerance-Related Traits
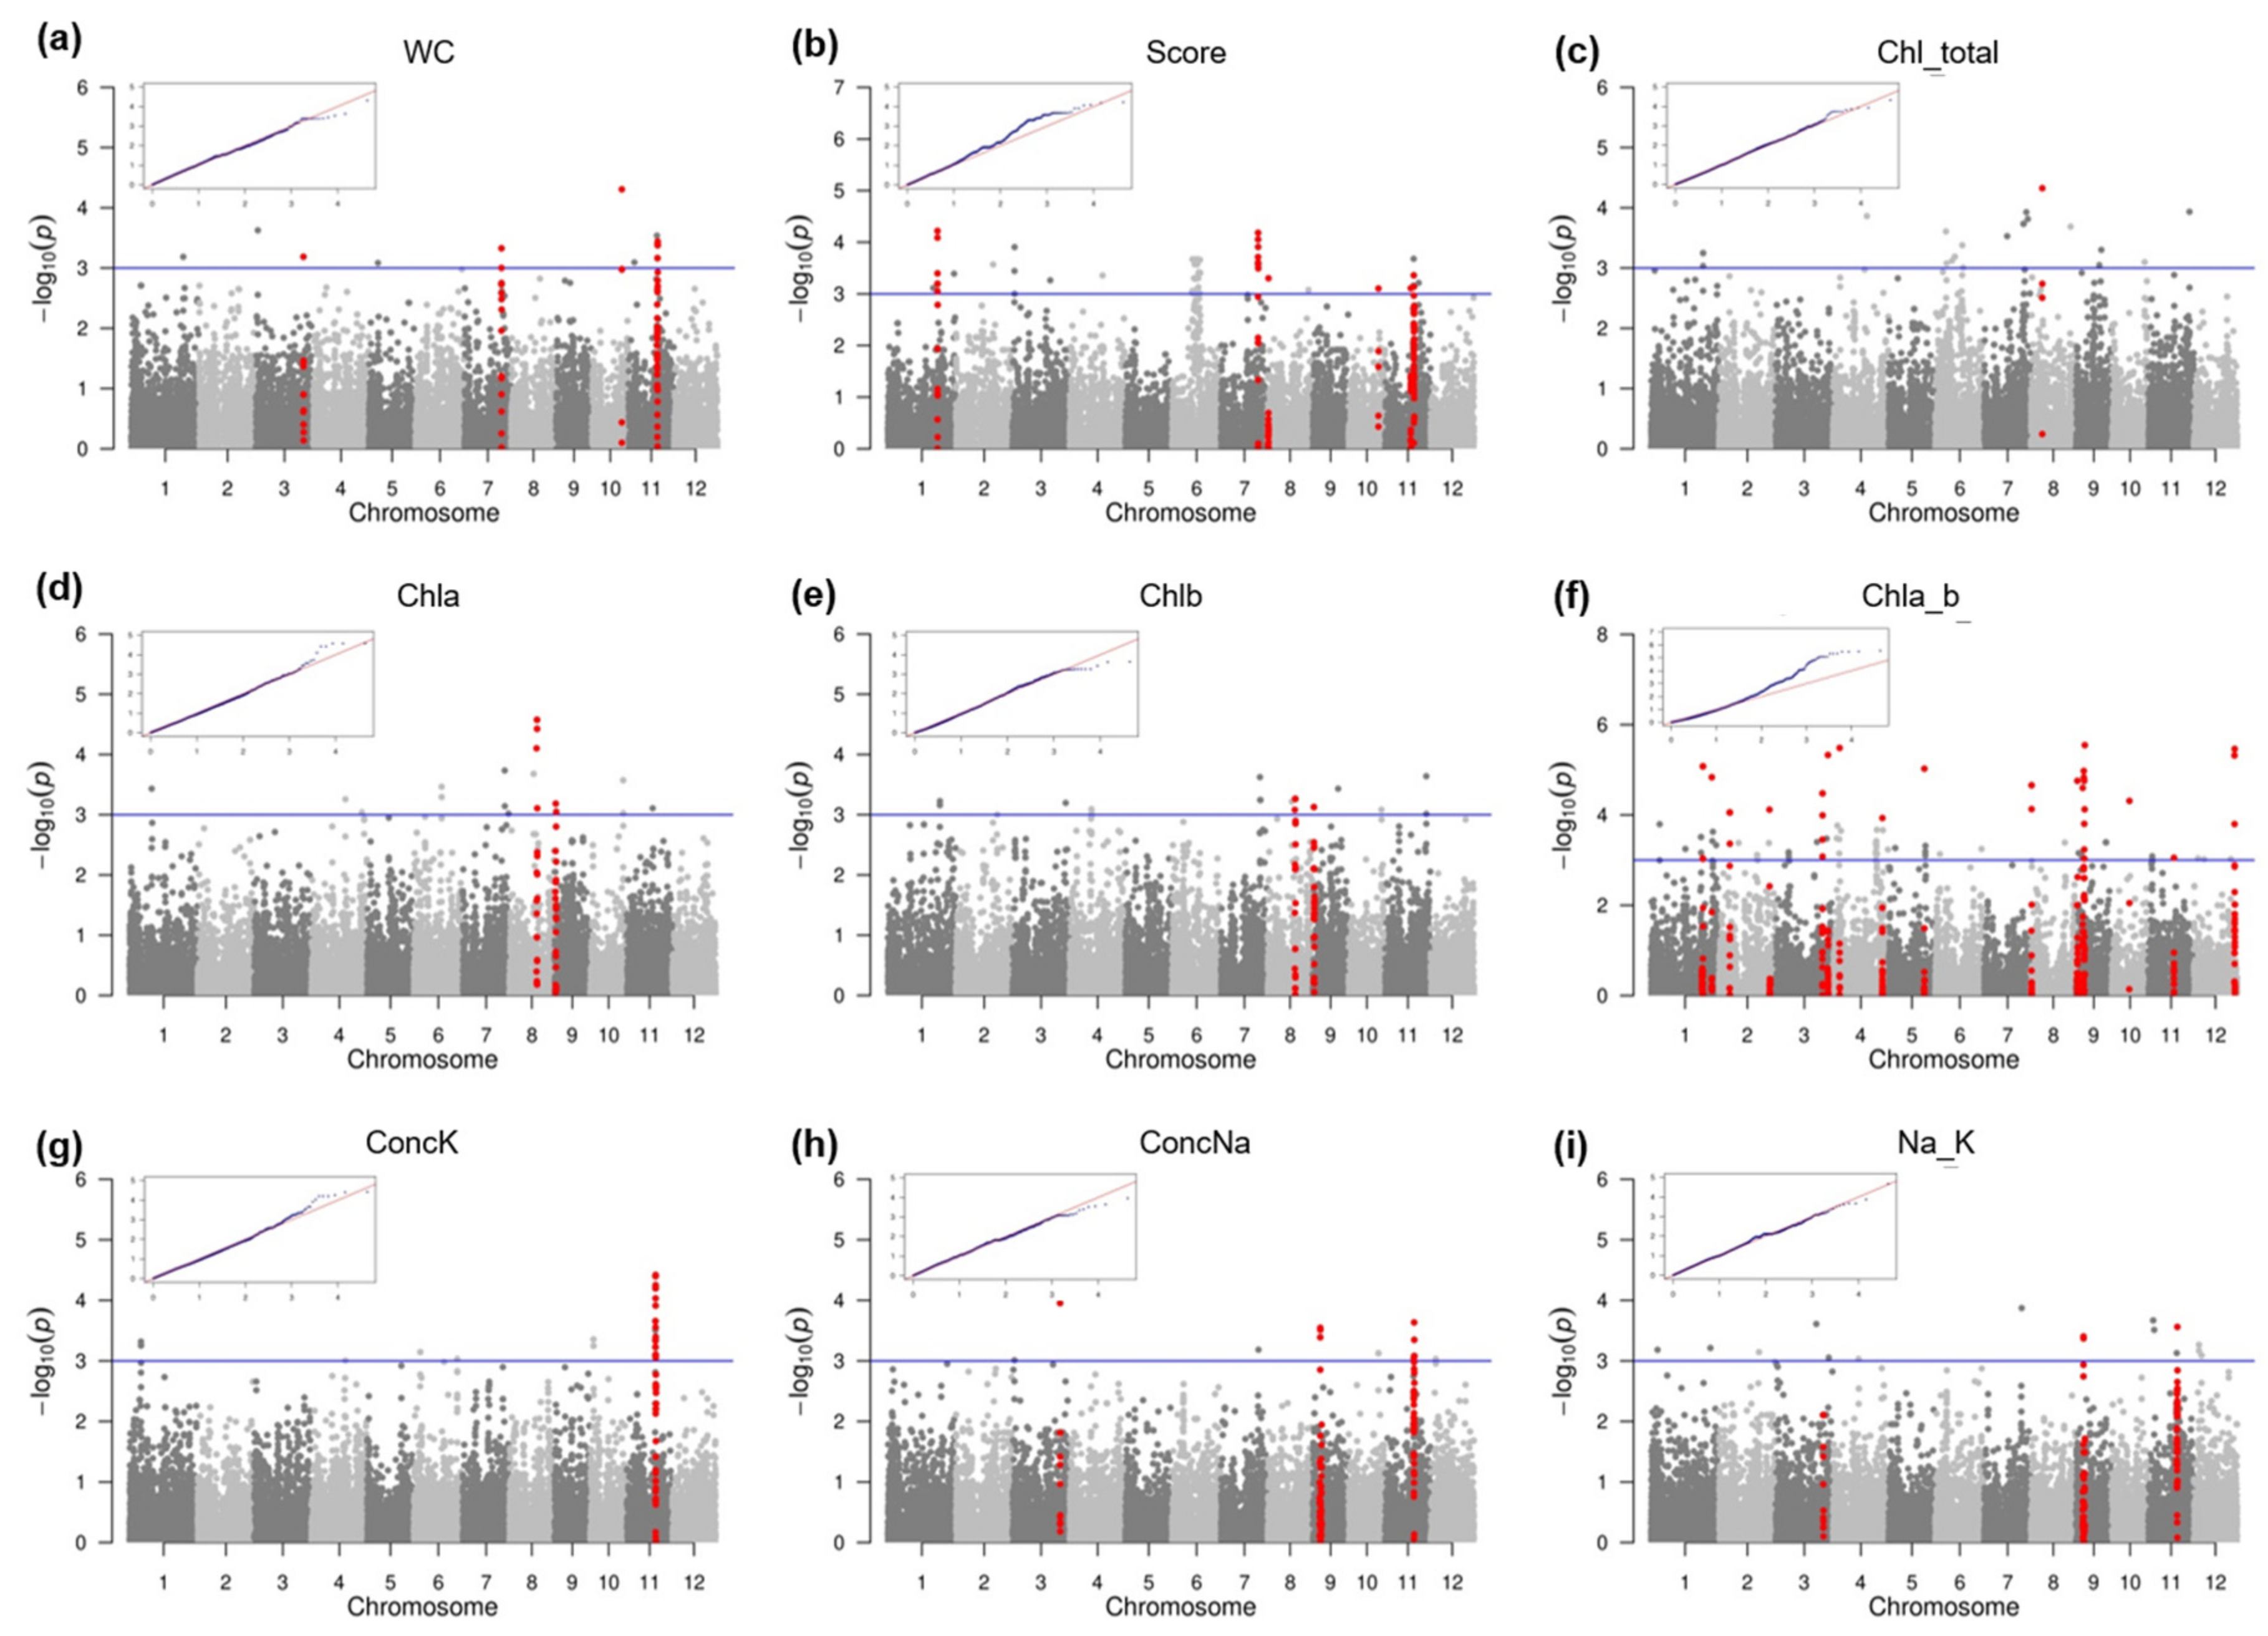
2.2. SNP-Trait Associations
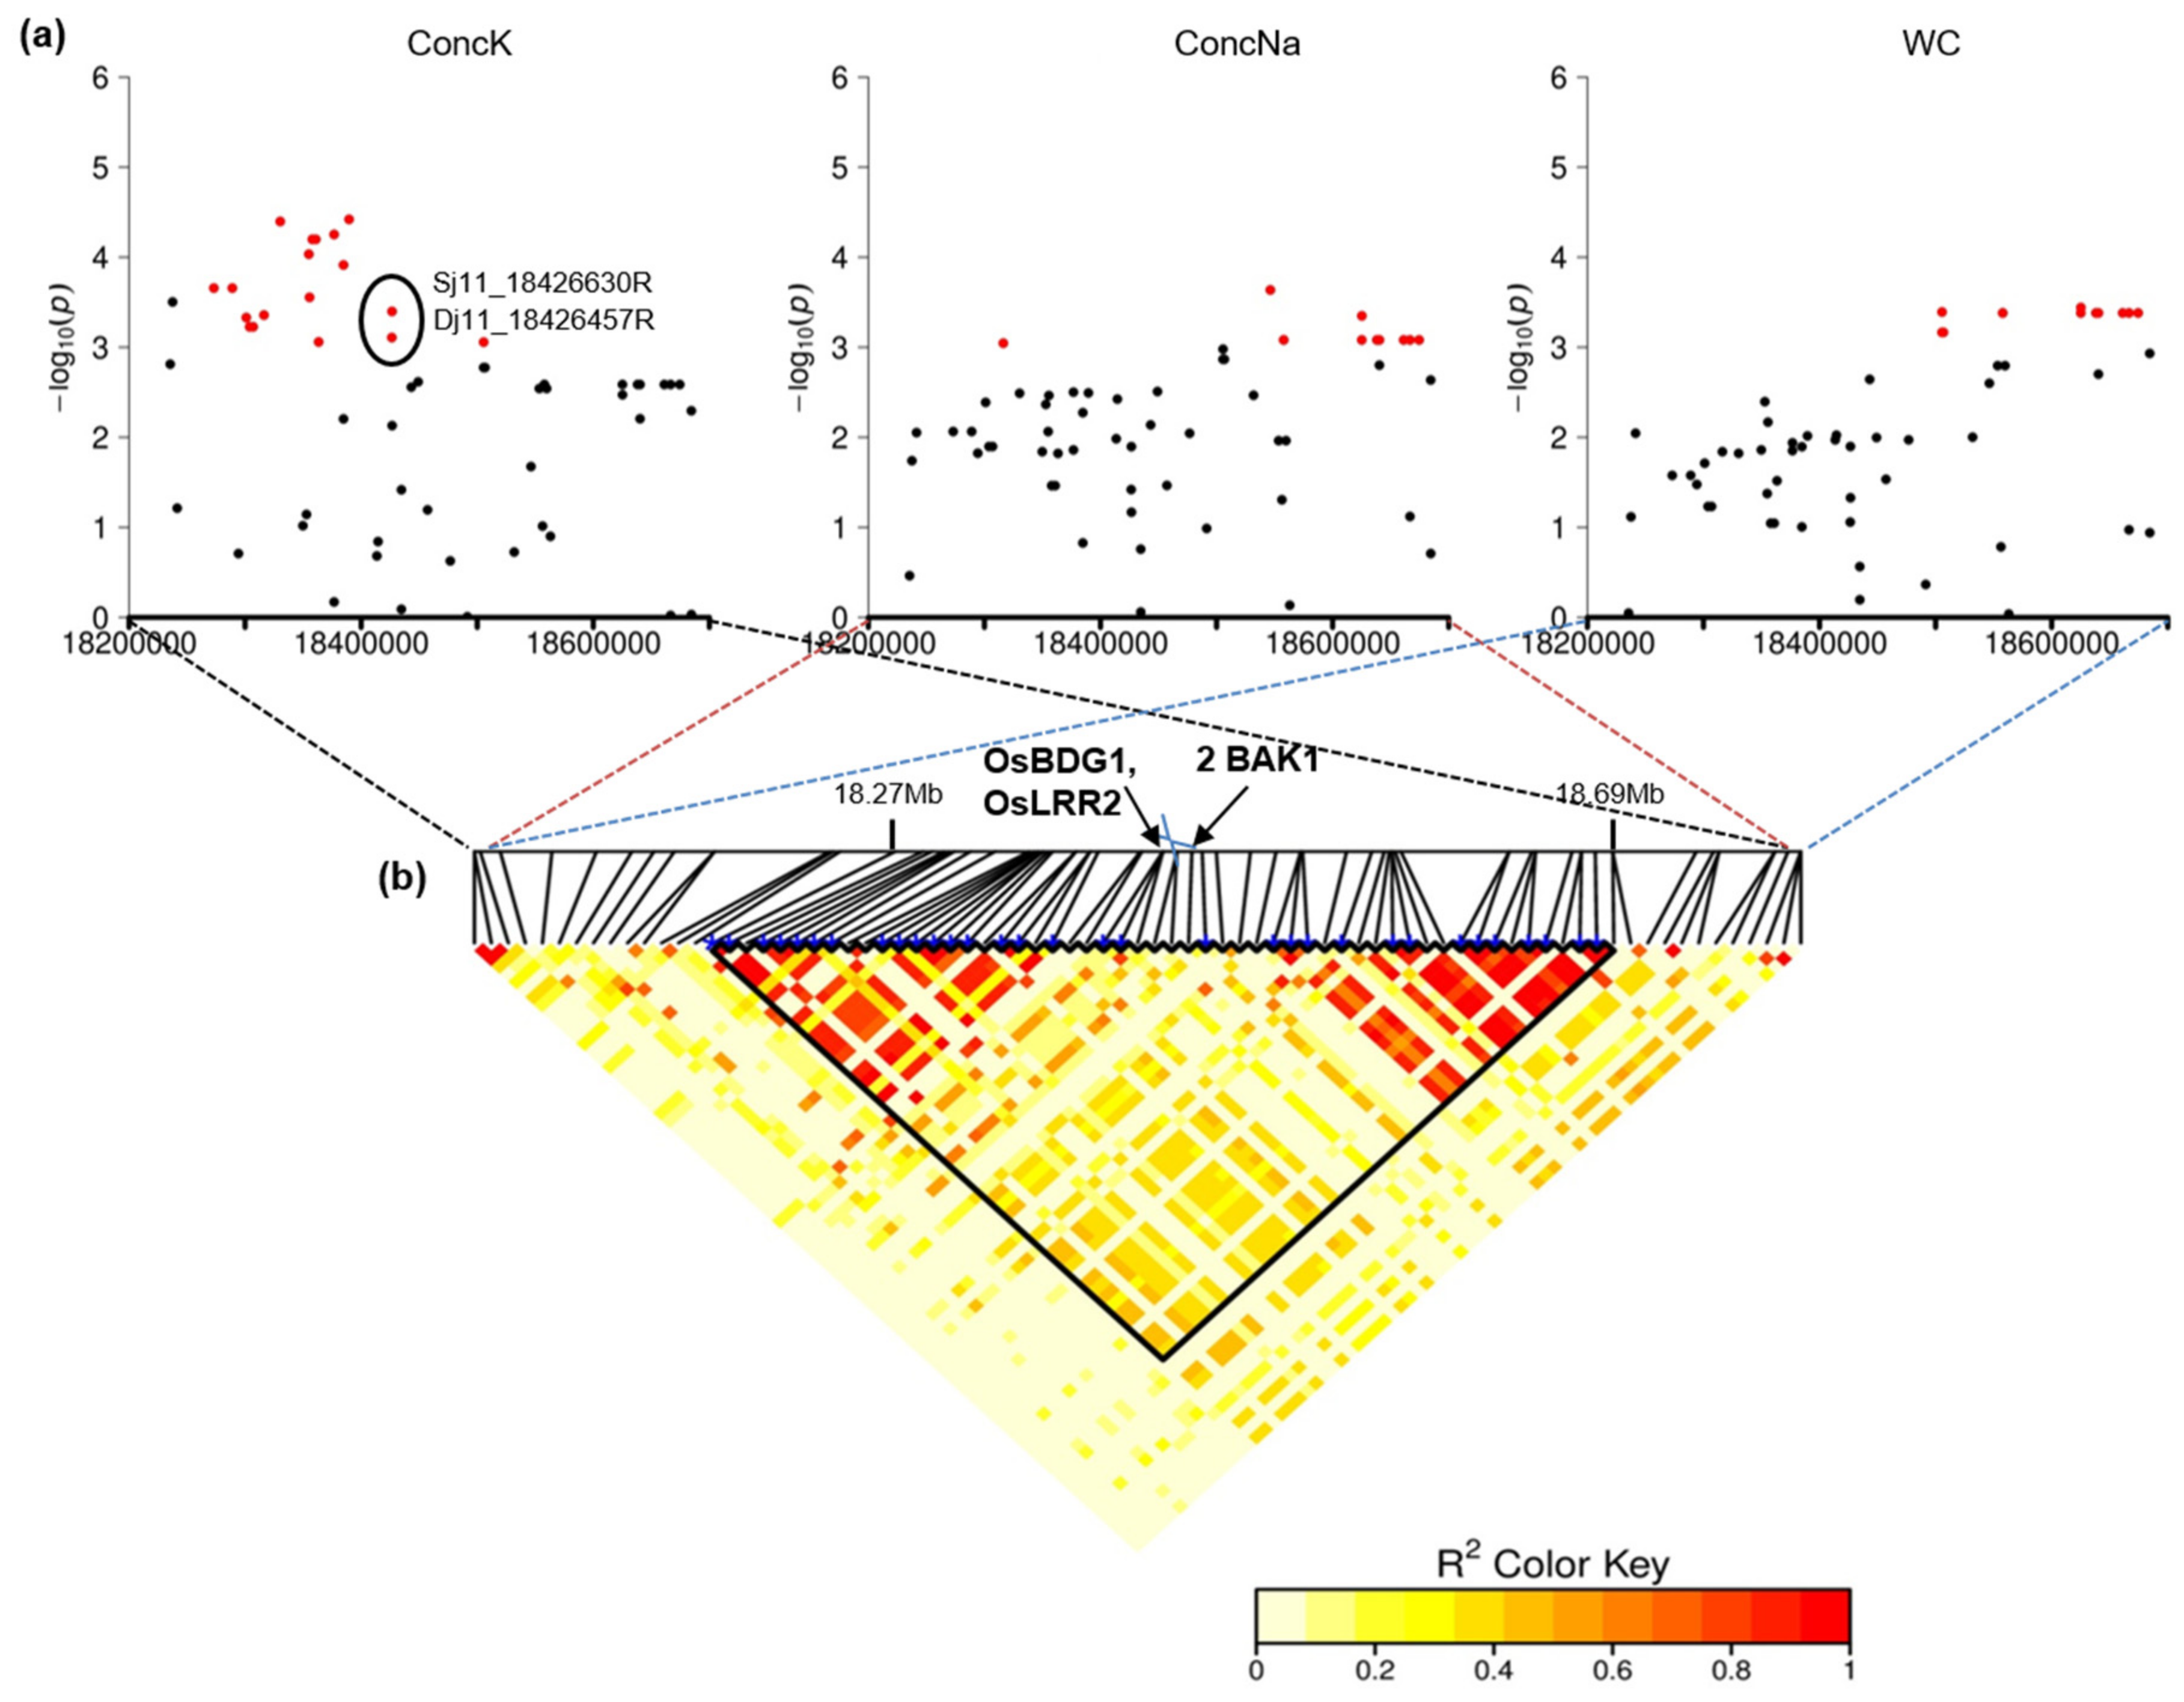
2.3. Colocalizing QTLs and Candidate Genes Underlying the Detected QTLs Involved in Salinity Tolerance

| QTL Name | Chr | QTL Position (bp) | Panel | Traits | No. of Signif. SNPs | Candidate Gene | References | |||
|---|---|---|---|---|---|---|---|---|---|---|
| Locus | Gene | Protein | Description | |||||||
| QTL_1 | 1 | 31,557,933–31,695,659 | F | Score | 8 | Os01g54890 | OsERF922 | Ethylene-responsive transcription factor 2 | Ethylene response transcription factor, negative regulation of salt resistance | [46] |
| Os01g54930 | OsVOZ1/EIP8 | Vascular one zinc-finger 1/EBR1-interacting protein 8 | ||||||||
| QTL_2 | 1 | 32,165,198–33,076,887 | F | Chla_b | 6 | Os01g55940 | OsGH3.2 | IAA-amido synthetase | Modulation of free IAA and ABA homeostasis and drought and cold tolerance | [47] |
| Os01g55974 | STRIPE 2, ALR | Deoxycytidylate deaminase | Chloroplast development | [48,49] | ||||||
| Os01g56040 | OsSAP3 | A20/AN1 zinc-finger protein 3 | Inducibility to drought and salinity stress | [50] | ||||||
| Os01g56070 | OsRDCP3 | RING finger protein 5 | increase tolerance to drought stress in rice | [51] | ||||||
| Os01g56400 | OsABCI6 | ABC transporter ATP-binding protein | response to abiotic stress | [52,53] | ||||||
| Os01g56680 | PsbW | Photosystem II reaction center W protein | photosynthesis regulation | [54] | ||||||
| QTL_3 | 1 | 38,515,041–38,722,651 | F, I | Chla_b | 1 | Os01g66590 | OsAS2 | LOB domain protein | Regulation of shoot differentiation and leaf development | [55] |
| Os01g66610 | Lectin receptor-like kinase (LecRLK) | Regulation of plant growth and developmental processes in response to stress | [56] | |||||||
| Os01g66420 | OsPHD7 | PHD finger protein (ZF-TF) | Up-regulated under drought stress | [57] | ||||||
| QTL_4 | 2 | 6,668,466–6,853,020 | F, I | Chla_b | 8 | Os02g12750 | OsTET2 | Tetraspanin domain containing protein | Response to heat, salt and water deficit stresses at seedling stage | [58] |
| Os02g12790 | OsCga1 | GATA transcription factor (ZF-TF) | Regulation of chloroplast development and plant architecture, relating to natural variation in strong stay-green | [59,60] | ||||||
| Os02g12794 | eEF-1B gamma | Elongation factor 1-gamma | Salinity stress adaptation | [61] | ||||||
| Os02g12800 | EF-1gamma | Elongation factor 1-gamma | Salinity stress adaptation | [61] | ||||||
| QTL_5 | 2 | 32,011,340–32,679,510 | F | Chla_b | 1 | Os02g52290 | OsFKBP12 | Peptidyl-prolyl cis-trans isomerase | Salinity stress response | [62,63] |
| Os02g52650 | LhCa5 | Chlorophyll a/b-binding protein | Light-harvesting chlorophyll a/b-binding protein | [64] | ||||||
| Os02g52670 | OsERF#103 | Ethylene-responsive transcription factor | Responsive to drought and salinity stress | [65] | ||||||
| Os02g52744 | DCL chloroplast precursor | |||||||||
| Os02g52780 | OsbZIP23 | bZIP transcription factor | Regulation of ABA signaling and biosynthesis, salinity and drought tolerance | [66,67] | ||||||
| Os02g53030 | OsRLCK84 | MAPK kinase | Response to salinity stress | [68] | ||||||
| QTL_6 | 3 | 526,748–1,177,466 | I | Chla_b | 1 | Os03g02010 | OsDRM2 | DNA methyltransferase | Tissue- and genotype-dependent response to salinity stress | [69] |
| Os03g02280 | OsS40-4 | S40-like protein | Response to leaf senescence and salinity stress | [70,71] | ||||||
| Os03g02590 | OsPEX11-1 | Peroxisomal biogenesis factor 11 | Relating to leaf senescence, salt responsive | [72,73] | ||||||
| QTL_7 | 3 | 7,197,414–7,297,414 | I | Chlb | 1 | |||||
| QTL_8 | 3 | 29,719,291–29,898,084 | F, I | Chla_b | 5 | Os03g51970 | OsGRF6 | Growth-regulating factor | Targeted by osa-miR396 and drought-up sRNA56202 responsive to salt and drought stress | [74,75,76] |
| Os03g52090 | OsECA2 | Calcium-transporting ATPase 3 | P-type Ca2+ ATPase IIA, harboring multiple stress-induced cis-acting elements | [77] | ||||||
| QTL_9 | 3 | 30,313,283–30,481,199 | F | WC, ConcNa, Na_K | 1 | Os03g53060 | ||||
| QTL_10 | 3 | 33,128,341–33,501,467 | F | Chla_b | 1 | Os03g58250 | OsbZIP33 | bZIP transcription factor | ABA-dependent enhancer of drought tolerance, responsive to high salinity, H2O2 and high temperature stress | [78] |
| Os03g58300 | OsIGL | Indole-3-glycerol phosphate lyase | Chloroplast precursor | |||||||
| Os03g58390 | OsSIRP2 | RING Ub E3 ligase | Salt and osmotic stress tolerance enhancer | [79] | ||||||
| Os03g58540 | TSV3/OsObgC2 | Obg-like GTPase protein | Chloroplast development at the early leaf stage under cold stress | [80] | ||||||
| QTL_11 | 4 | 4,254,414–4,354,414 | F, I | Chla_b | 1 | |||||
| QTL_12 | 4 | 31,433,085–31,558,275 | F, I | Chla_b | 1 | Os04g52960 | OsNUC1 | Nucleolin-like protein | Photosynthesis adaptation, reduction of oxidative stress and yield loss under salinity stress, enhancement of salt-stress tolerance | [81,82] |
| QTL_13 | 5 | 22,437,918–22,840,944 | F, I | WC, Chla_b | 2 | Os05g38370 | OsFKBP20-1a | Peptidyl-prolyl cis-trans isomerase FKBP-type | Drought and heat stress-response | [83] |
| Os05g38290 | OsPP2C49 | Protein phosphatase 2C | Regulation of ABA-mediated signaling pathways | [84] | ||||||
| QTL_14 | 7 | 7,040,925–7,140,925 | I | Chl_total | 1 | |||||
| QTL_15 | 7 | 21,360,003–21,460,003 | I | Chl_total | 1 | |||||
| QTL_16 | 7 | 23,502,762–23,623,244 | F | WC, Score | 7 | Os07g39270 | OsGGPPS1 | Geranylgeranyl pyrophosphate synthase | Chlorophyll biosynthesis | [85] |
| Os07g39350 | Sugar transporter | osmo protection | ||||||||
| Os07g39360 | Sugar transporter | osmo protection | ||||||||
| QTL_17 | 8 | 235,171–472,039 | F, I | Score, Chla_b | 4 | |||||
| QTL_18 | 8 | 7,116,026–7,249,222 | F | Chl_total | 1 | |||||
| QTL_19 | 8 | 17,191,665–17,648,853 | F, I | Chla, Chlb | 7 | Os08g28710 | OsRLCK253 | Receptor-like kinase | Improvement of water-deficit and salinity stress tolerance | [86] |
| QTL_20 | 9 | 799,160–1,286,768 | F | Chla, Chlb, Chla_b | 5 | Os09g02270 | OsCYL4 | Protein containing cyclase domain | Negative regulation of abiotic stress tolerance in relation to accumulation of ROS | [76] |
| QTL_21 | 9 | 4,452,802–5,809,538 | F, I | WC, Chla_b, ConcNa, Na_K | 14 | Os09g10600 | NADH-dependent enoyl-ACP reductase | Chloroplast precursor | ||
| QTL_22 | 10 | 11,126,654–11,242,896 | F | Chla_b | 1 | |||||
| QTL_23 | 10 | 18,944,166–19,070,983 | F | WC, Score, ConcNa | 2 | Os10g35640 | Rf1 mitochondrial precursor (Nin-like) | Down-regulated salt-responsive, up-regulated cold-responsive | [87,88] | |
| Os10g35560 | OsSFR6 | Expressed protein | Osmotic stress and chilling tolerance | [89] | ||||||
| QTL_24 | 11 | 16,335,298–16,441,782 | F, I | Score, Chla_b | 1 | |||||
| QTL_25 | 11 | 18,273,105–18,684,503 | F, I | WC, Score, ConcK, ConcNa, Na_K | 33 | Os11g31530 | OsBDG1 | BRASSINOSTEROID INSENSITIVE 1-associated receptor kinase 1, OsBri1 | Salinity tolerance (upregulated in roots in response to salinity) | [90] |
| Os11g31540 | OsLRR2 | BRASSINOSTEROID INSENSITIVE 1-associated receptor kinase 1, OsBri1 | Stress tolerance (upregulated in leaves in response to cold and drought stress) | [91] | ||||||
| Os11g31550 | BRASSINOSTEROID INSENSITIVE 1-associated receptor kinase 1, OsBri1 | |||||||||
| Os11g31560 | BRASSINOSTEROID INSENSITIVE 1-associated receptor kinase 1, OsBri1 | |||||||||
| QTL_26 | 12 | 25,841,227–26,215,713 | F | Chla_b | 5 | Os12g41860 | OsHox33 | HDZIP III transcription factor | Targeted by a miRNA responsive to salinity stress, control of leaf senescence | [75,92] |
| Os12g41950 | OsARF6b, OsARF25 | Auxin response factor | Candidate salinity tolerance-related gene at the seedling stage | [93] | ||||||
| Os12g42060 | OsWAK128 | OsWAK receptor-like kinase | Candidate salinity tolerance-related gene at the seedling stage | [93] | ||||||
| Os12g42070 | OsRLCK375, OsWAK129 | OsWAK receptor-like kinase | Down-regulated in cold, salt and drought stress conditions at the seedling stage | [94] | ||||||
| Os12g42090 | 37 kDa inner envelope membrane protein | Chloroplast precursor, salinity-inducible | [93,95] | |||||||
| Os12g42200 | OsCHX15 | ATCHX protein | Cation H+ antiporter, candidate salinity tolerance-related gene at the seedling stage | [93] | ||||||
| Os12g42250 | OsZFP213, PINE1 | C2H2 transcription factor | Interacting with OsMAPK3 to enhance salinity tolerance by enhancing ROS-scavenging ability, regulating internode elongation and photoperiodic signals | [96,97] | ||||||
3. Discussion
4. Materials and Methods
4.1. Plant Materials and Genotyping
4.2. Phenotyping Experiment
4.2.1. Salt Treatment
4.2.2. Scoring and Sampling
4.2.3. Chlorophyll Determination
4.2.4. Water Content Measurement
4.2.5. Ion Content Measurement
4.3. Statistical Analysis of Phenotypic Data
4.4. Genome-Wide Association Study
5. Conclusions and Future Prospects
Supplementary Materials
Author Contributions
Funding
Data Availability Statement
Conflicts of Interest
References
- Rengasamy, P. Soil Processes Affecting Crop Production in Salt-Affected Soils. Funct. Plant Biol. 2010, 37, 613. [Google Scholar] [CrossRef]
- Wassmann, R.; Nelson, G.; Peng, S.; Sumfleth, K.; Jagadish, K.; Hosen, Y.; Rosegrant, M. Rice and global climate change. In Rice in the Global Economy: Strategic Research and Policy Issues for Food Security; IRRI: Los Banos, Philippines, 2010; pp. 411–433. [Google Scholar]
- Timmer, C.P.; Block, S.; Dawe, D. Long-run dynamics of rice consumption, 1960–2050. In Rice in the Global Economy: Strategic Research and Policy Issues for Food Security; IRRI: Los Banos, Philippines, 2010; pp. 139–174. [Google Scholar]
- Sarah, K.B. System of Rice Intensification in Vietnam: Doing More with Less; 52 Profiles on Agroecology; Oxfam: Food and Agriculture Organisation of the United States: Washington, DC, USA, 2016. [Google Scholar]
- Ngoc Huyen Việt Nam chịu ảnh hưởng ra sao bởi biến đổi khí hậu? Báo Đồng Khởi. 2008. Available online: https://baodongkhoi.vn/viet-nam-chiu-anh-huong-ra-sao-boi-bien-doi-khi-hau-14012008-a543.html (accessed on 24 May 2021).
- Ha, P.V.; Nguyen, H.T.M.; Kompas, T.; Che, T.N.; Trinh, B. Rice Production, Trade and the Poor: Regional Effects of Rice Export Policy on Households in Vietnam. J. Agric. Econ. 2015, 66, 280–307. [Google Scholar] [CrossRef]
- Maitah, K.; Smutka, L.; Sahatqija, J.; Maitah, M.; Phuong Anh, N. Rice as a Determinant of Vietnamese Economic Sustainability. Sustainability 2020, 12, 5123. [Google Scholar] [CrossRef]
- Loc, H.H.; Van Binh, D.; Park, E.; Shrestha, S.; Dung, T.D.; Son, V.H.; Truc, N.H.T.; Mai, N.P.; Seijger, C. Intensifying Saline Water Intrusion and Drought in the Mekong Delta: From Physical Evidence to Policy Outlooks. Sci. Total Environ. 2021, 757, 143919. [Google Scholar] [CrossRef] [PubMed]
- Tin, H.Q.; Loi, N.H.; Labarosa, S.J.E.; McNally, K.L.; McCouch, S.; Kilian, B. Phenotypic Response of Farmer-selected CWR-derived Rice Lines to Salt Stress in the Mekong Delta. Crop Sci. 2021, 61, 201–218. [Google Scholar] [CrossRef]
- Ganie, S.A.; Molla, K.A.; Henry, R.J.; Bhat, K.V.; Mondal, T.K. Advances in Understanding Salt Tolerance in Rice. Theor. Appl. Genet. 2019, 132, 851–870. [Google Scholar] [CrossRef]
- Negrão, S.; Courtois, B.; Ahmadi, N.; Abreu, I.; Saibo, N.; Oliveira, M.M. Recent Updates on Salinity Stress in Rice: From Physiological to Molecular Responses. Crit. Rev. Plant Sci. 2011, 30, 329–377. [Google Scholar] [CrossRef]
- Pang, Y.; Chen, K.; Wang, X.; Wang, W.; Xu, J.; Ali, J.; Li, Z. Simultaneous Improvement and Genetic Dissection of Salt Tolerance of Rice (Oryza Sativa L.) by Designed QTL Pyramiding. Front. Plant Sci. 2017, 8, 1275. [Google Scholar] [CrossRef] [Green Version]
- Wang, Z.; Cheng, J.; Chen, Z.; Huang, J.; Bao, Y.; Wang, J.; Zhang, H. Identification of QTLs with Main, Epistatic and QTL × Environment Interaction Effects for Salt Tolerance in Rice Seedlings under Different Salinity Conditions. Theor. Appl. Genet. 2012, 125, 807–815. [Google Scholar] [CrossRef] [PubMed]
- Phung, N.T.P.; Mai, C.D.; Mournet, P.; Frouin, J.; Droc, G.; Ta, N.K.; Jouannic, S.; Lê, L.T.; Do, V.N.; Gantet, P.; et al. Characterization of a Panel of Vietnamese Rice Varieties Using DArT and SNP Markers for Association Mapping Purposes. BMC Plant Biol. 2014, 14, 371. [Google Scholar] [CrossRef] [Green Version]
- Fukuoka, S.; Alpatyeva, N.V.; Ebana, K.; Luu, N.T.; Nagamine, T. Analysis of Vietnamese Rice Germplasm Provides an Insight into Japonica Rice Differentiation. Plant Breed. 2003, 122, 497–502. [Google Scholar] [CrossRef]
- Li, J.-Y.; Wang, J.; Zeigler, R.S. The 3000 Rice Genomes Project: New Opportunities and Challenges for Future Rice Research. GigaScience 2014, 3, 8. [Google Scholar] [CrossRef] [Green Version]
- Hoang, G.T.; Van Dinh, L.; Nguyen, T.T.; Ta, N.K.; Gathignol, F.; Mai, C.D.; Jouannic, S.; Tran, K.D.; Khuat, T.H.; Do, V.N.; et al. Genome-Wide Association Study of a Panel of Vietnamese Rice Landraces Reveals New QTLs for Tolerance to Water Deficit during the Vegetative Phase. Rice 2019, 12, 4. [Google Scholar] [CrossRef] [PubMed] [Green Version]
- Hoang, G.T.; Gantet, P.; Nguyen, K.H.; Phung, N.T.P.; Ha, L.T.; Nguyen, T.T.; Lebrun, M.; Courtois, B.; Pham, X.H. Genome-Wide Association Mapping of Leaf Mass Traits in a Vietnamese Rice Landrace Panel. PLoS ONE 2019, 14, e0219274. [Google Scholar] [CrossRef] [PubMed]
- Phung, N.T.P.; Mai, C.D.; Hoang, G.T.; Truong, H.T.M.; Lavarenne, J.; Gonin, M.; Nguyen, K.L.; Ha, T.T.; Do, V.N.; Gantet, P.; et al. Genome-Wide Association Mapping for Root Traits in a Panel of Rice Accessions from Vietnam. BMC Plant Biol. 2016, 16, 64. [Google Scholar] [CrossRef] [PubMed] [Green Version]
- Ta, K.N.; Khong, N.G.; Ha, T.L.; Nguyen, D.T.; Mai, D.C.; Hoang, T.G.; Phung, T.P.N.; Bourrie, I.; Courtois, B.; Tran, T.T.H.; et al. A Genome-Wide Association Study Using a Vietnamese Landrace Panel of Rice (Oryza Sativa) Reveals New QTLs Controlling Panicle Morphological Traits. BMC Plant Biol. 2018, 18, 282. [Google Scholar] [CrossRef]
- Egdane, J.; Vispo, N.; Mohammadi, R.; Amas, J.; Katimbang, M.; Platten, J.; Ismail, A.; Gregorio, G. Phenotyping Protocols for Salinity and Other Problem Soils; International Rice Research Institute: Los Banos, Philippines, 2007. [Google Scholar]
- Batayeva, D.; Labaco, B.; Ye, C.; Li, X.; Usenbekov, B.; Rysbekova, A.; Dyuskalieva, G.; Vergara, G.; Reinke, R.; Leung, H. Genome-Wide Association Study of Seedling Stage Salinity Tolerance in Temperate Japonica Rice Germplasm. BMC Genet. 2018, 19, 2. [Google Scholar] [CrossRef] [Green Version]
- Frouin, J.; Languillaume, A.; Mas, J.; Mieulet, D.; Boisnard, A.; Labeyrie, A.; Bettembourg, M.; Bureau, C.; Lorenzini, E.; Portefaix, M.; et al. Tolerance to Mild Salinity Stress in Japonica Rice: Agenome-Wide Association Mapping Study Highlights Calcium Signaling and Metabolism Genes. PLoS ONE 2018, 13, e0190964. [Google Scholar] [CrossRef] [Green Version]
- Kumar, V.; Singh, A.; Mithra, S.V.A.; Krishnamurthy, S.L.; Parida, S.K.; Jain, S.; Tiwari, K.K.; Kumar, P.; Rao, A.R.; Sharma, S.K.; et al. Genome-Wide Association Mapping of Salinity Tolerance in Rice (Oryza Sativa). DNA Res. 2015, 22, 133–145. [Google Scholar] [CrossRef] [Green Version]
- Lekklar, C.; Pongpanich, M.; Suriya-arunroj, D.; Chinpongpanich, A.; Tsai, H.; Comai, L.; Chadchawan, S.; Buaboocha, T. Genome-Wide Association Study for Salinity Tolerance at the Flowering Stage in a Panel of Rice Accessions from Thailand. BMC Genom. 2019, 20, 76. [Google Scholar] [CrossRef] [Green Version]
- Yuan, J.; Wang, X.; Zhao, Y.; Khan, N.U.; Zhao, Z.; Zhang, Y.; Wen, X.; Tang, F.; Wang, F.; Li, Z. Genetic Basis and Identification of Candidate Genes for Salt Tolerance in Rice by GWAS. Sci. Rep. 2020, 10, 9958. [Google Scholar] [CrossRef]
- Ammar, M.H.M.; Pandit, A.; Singh, R.K.; Sameena, S.; Chauhan, M.S.; Singh, A.K.; Sharma, P.C.; Gaikwad, K.; Sharma, T.R.; Mohapatra, T.; et al. Mapping of QTLs Controlling Na+, K+ and CI− Ion Concentrations in Salt Tolerant Indica Rice Variety CSR27. J. Plant Biochem. Biotechnol. 2009, 18, 139–150. [Google Scholar] [CrossRef]
- Cheng, L.; Wang, Y.; Meng, L.; Hu, X.; Cui, Y.; Sun, Y.; Zhu, L.; Ali, J.; Xu, J.; Li, Z. Identification of Salt-Tolerant QTLs with Strong Genetic Background Effect Using Two Sets of Reciprocal Introgression Lines in Rice. Genome 2012, 55, 45–55. [Google Scholar] [CrossRef] [PubMed]
- De Leon, T.B.; Linscombe, S.; Subudhi, P.K. Molecular Dissection of Seedling Salinity Tolerance in Rice (Oryza Sativa L.) Using a High-Density GBS-Based SNP Linkage Map. Rice 2016, 9, 52. [Google Scholar] [CrossRef] [Green Version]
- Ghomi, K.; Rabiei, B.; Sabouri, H.; Sabouri, A. Mapping QTLs for Traits Related to Salinity Tolerance at Seedling Stage of Rice (Oryza Sativa L.): An Agrigenomics Study of an Iranian Rice Population. OMICS 2013, 17, 242–251. [Google Scholar] [CrossRef]
- Gimhani, D.R.; Gregorio, G.B.; Kottearachchi, N.S.; Samarasinghe, W.L.G. SNP-Based Discovery of Salinity-Tolerant QTLs in a Bi-Parental Population of Rice (Oryza Sativa). Mol. Genet. Genom. 2016, 291, 2081–2099. [Google Scholar] [CrossRef] [PubMed]
- Hemamalini, G.S.; Shashidhar, H.E.; Hittalmani, S. Molecular Marker Assisted Tagging of Morphological and Physiological Traits under Two Contrasting Moisture Regimes at Peak Vegetative Stage in Rice (Oryza Sativa L.). Euphytica 2000, 112, 69–78. [Google Scholar] [CrossRef]
- Hossain, H.; Rahman, M.A.; Alam, M.S.; Singh, R.K. Mapping of Quantitative Trait Loci Associated with Reproductive-Stage Salt Tolerance in Rice. J. Agron. Crop Sci. 2015, 201, 17–31. [Google Scholar] [CrossRef]
- Koyama, M.L.; Levesley, A.; Koebner, R.M.D.; Flowers, T.J.; Yeo, A.R. Quantitative Trait Loci for Component Physiological Traits Determining Salt Tolerance in Rice. Plant Physiol. 2001, 125, 406–422. [Google Scholar] [CrossRef] [Green Version]
- Lafitte, R.H.; Courtois, B. Genetic Variation in Performance under Reproductive-Stage Water Deficit in a Doubled Haploid Rice Population in Upland Fields. In Proceedings of the Molecular Approaches for the Genetic Improvement of Cereals for Stable Production in Water-Limited Environments, CIMMYT, El Batan, Mexico, 21 June 1999. [Google Scholar]
- Mohammadi, R.; Mendioro, M.S.; Diaz, G.Q.; Gregorio, G.B.; Singh, R.K. Mapping Quantitative Trait Loci Associated with Yield and Yield Components under Reproductive Stage Salinity Stress in Rice (Oryza Sativa L.). J. Genet. 2013, 92, 433–443. [Google Scholar] [CrossRef]
- Prasad, S.R.; Bagali, P.G.; Hittalmani, S.; Shashidhar, H.E. Molecular Mapping of Quantitative Trait Loci Associated with Seedling Tolerance to Salt Stress in Rice (Oryza Sativa L.). Curr. Sci. 2000, 78, 162–164. [Google Scholar]
- Price, A.H.; Steele, K.A.; Moore, B.J.; Jones, R.G.W. Upland Rice Grown in Soil-Filled Chambers and Exposed to Contrasting Water-Deficit Regimes II. Mapping Quantitative Trait Loci for Root Morphology and Distribution. Field Crops Res. 2002, 76, 25–43. [Google Scholar] [CrossRef]
- Puram, V.R.R.; Ontoy, J.; Linscombe, S.; Subudhi, P.K. Genetic Dissection of Seedling Stage Salinity Tolerance in Rice Using Introgression Lines of a Salt Tolerant Landrace Nona Bokra. J. Hered. 2017, 108, 658–670. [Google Scholar] [CrossRef] [PubMed]
- Sabouri, H.; Rezai, A.M.; Moumeni, A.; Kavousi, A.; Katouzi, M.; Sabouri, A. QTLs Mapping of Physiological Traits Related to Salt Tolerance in Young Rice Seedlings. Biol. Plant. 2009, 53, 657–662. [Google Scholar] [CrossRef]
- Thomson, M.J.; de Ocampo, M.; Egdane, J.; Rahman, M.A.; Sajise, A.G.; Adorada, D.L.; Tumimbang-Raiz, E.; Blumwald, E.; Seraj, Z.I.; Singh, R.K.; et al. Characterizing the Saltol Quantitative Trait Locus for Salinity Tolerance in Rice. Rice 2010, 3, 148–160. [Google Scholar] [CrossRef] [Green Version]
- Ul Haq, T.; Gorham, J.; Akhtar, J.; Akhtar, N.; Steele, K.A. Dynamic Quantitative Trait Loci for Salt Stress Components on Chromosome 1 of Rice. Funct. Plant Biol. 2010, 37, 634–645. [Google Scholar] [CrossRef]
- Wang, Z.; Chen, Z.; Cheng, J.; Lai, Y.; Wang, J.; Bao, Y.; Huang, J.; Zhang, H. QTL Analysis of Na+ and K+ Concentrations in Roots and Shoots under Different Levels of NaCl Stress in Rice (Oryza Sativa L.). PLoS ONE 2012, 7, e51202. [Google Scholar] [CrossRef] [PubMed] [Green Version]
- Wang, Z.; Wang, J.; Bao, Y.; Wu, Y.; Zhang, H. Quantitative Trait Loci Controlling Rice Seed Germination under Salt Stress. Euphytica 2011, 178, 297–307. [Google Scholar] [CrossRef]
- Yue, B.; Xue, W.; Xiong, L.; Yu, X.; Luo, L.; Cui, K.; Jin, D.; Xing, Y.; Zhang, Q. Genetic Basis of Drought Resistance at Reproductive Stage in Rice: Separation of Drought Tolerance from Drought Avoidance. Genetics 2006, 172, 1213–1228. [Google Scholar] [CrossRef] [Green Version]
- Liu, D.; Chen, X.; Liu, J.; Guo, Z. The Rice ERF Transcription Factor OsERF922 Negatively Regulates Resistance to Magnaporthe Oryzae and Salt Tolerance. J. Exp. Bot. 2012, 63. [Google Scholar] [CrossRef] [Green Version]
- Du, H.; Wu, N.; Fu, J.; Wang, S.; Li, X.; Xiao, J.; Xiong, L. A GH3 Family Member, OsGH3-2, Modulates Auxin and Abscisic Acid Levels and Differentially Affects Drought and Cold Tolerance in Rice. J. Exp. Bot. 2012, 63, 6467–6480. [Google Scholar] [CrossRef] [Green Version]
- Niu, M.; Wang, Y.; Wang, C.; Lyu, J.; Wang, Y.; Dong, H.; Long, W.; Wang, D.; Kong, W.; Wang, L.; et al. ALR Encoding DCMP Deaminase Is Critical for DNA Damage Repair, Cell Cycle Progression and Plant Development in Rice. J. Exp. Bot. 2017, 68, 5773–5786. [Google Scholar] [CrossRef] [PubMed]
- Xu, J.; Deng, Y.; Li, Q.; Zhu, X.; He, Z. STRIPE2 Encodes a Putative DCMP Deaminase That Plays an Important Role in Chloroplast Development in Rice. J. Genet. Genom. 2014, 41, 539–548. [Google Scholar] [CrossRef] [PubMed]
- Vij, S.; Tyagi, A.K. Genome-Wide Analysis of the Stress Associated Protein (SAP) Gene Family Containing A20/AN1 Zinc-Finger(s) in Rice and Their Phylogenetic Relationship with Arabidopsis. Mol. Genet. Genom. 2006, 276, 565–575. [Google Scholar] [CrossRef]
- Bae, H.; Kim, S.K.; Cho, S.K.; Kang, B.G.; Kim, W.T. Overexpression of OsRDCP1, a Rice RING Domain-Containing E3 Ubiquitin Ligase, Increased Tolerance to Drought Stress in Rice (Oryza Sativa L.). Plant Sci. 2011, 180, 775–782. [Google Scholar] [CrossRef] [PubMed]
- Nguyen, V.N.T.; Moon, S.; Jung, K.-H. Genome-Wide Expression Analysis of Rice ABC Transporter Family across Spatio-Temporal Samples and in Response to Abiotic Stresses. J. Plant Physiol. 2014, 171, 1276–1288. [Google Scholar] [CrossRef]
- Saha, J.; Sengupta, A.; Gupta, K.; Gupta, B. Molecular Phylogenetic Study and Expression Analysis of ATP-Binding Cassette Transporter Gene Family in Oryza Sativa in Response to Salt Stress. Comput. Biol. Chem. 2015, 54, 18–32. [Google Scholar] [CrossRef]
- Wang, Y.; Jiang, Q.; Liu, J.; Zeng, W.; Zeng, Y.; Li, R.; Luo, J. Comparative Transcriptome Profiling of Chilling Tolerant Rice Chromosome Segment Substitution Line in Response to Early Chilling Stress. Genes Genom. 2017, 39, 127–141. [Google Scholar] [CrossRef]
- Ma, Y.; Wang, F.; Guo, J.; Zhang, X.S. Rice OsAS2 Gene, a Member of LOB Domain Family, Functions in the Regulation of Shoot Differentiation and Leaf Development. J. Plant Biol. 2009, 52, 374–381. [Google Scholar] [CrossRef]
- Passricha, N.; Saifi, S.; Ansari, M.W.; Tuteja, N. Prediction and Validation of Cis-Regulatory Elements in 5′ Upstream Regulatory Regions of Lectin Receptor-like Kinase Gene Family in Rice. Protoplasma 2017, 254, 669–684. [Google Scholar] [CrossRef] [PubMed]
- Sun, M.; Jia, B.; Yang, J.; Cui, N.; Zhu, Y.; Sun, X. Genome-Wide Identification of the PHD-Finger Family Genes and Their Responses to Environmental Stresses in Oryza Sativa L. Int. J. Mol. Sci. 2017, 18, 2005. [Google Scholar] [CrossRef] [PubMed] [Green Version]
- Mani, B.; Agarwal, M.; Katiyar-Agarwal, S. Comprehensive Expression Profiling of Rice Tetraspanin Genes Reveals Diverse Roles during Development and Abiotic Stress. Front. Plant Sci. 2015, 6. [Google Scholar] [CrossRef] [Green Version]
- Hudson, D.; Guevara, D.R.; Hand, A.J.; Xu, Z.; Hao, L.; Chen, X.; Zhu, T.; Bi, Y.-M.; Rothstein, S.J. Rice Cytokinin GATA Transcription Factor1 Regulates Chloroplast Development and Plant Architecture. Plant Physiol. 2013, 162, 132–144. [Google Scholar] [CrossRef] [Green Version]
- Zhao, Y.; Qiang, C.; Wang, X.; Chen, Y.; Deng, J.; Jiang, C.; Sun, X.; Chen, H.; Li, J.; Piao, W.; et al. New Alleles for Chlorophyll Content and Stay-Green Traits Revealed by a Genome Wide Association Study in Rice (Oryza Sativa). Sci. Rep. 2019, 9, 2541. [Google Scholar] [CrossRef] [PubMed] [Green Version]
- Hossain, M.R.; Bassel, G.W.; Pritchard, J.; Sharma, G.P.; Ford-Lloyd, B.V. Trait Specific Expression Profiling of Salt Stress Responsive Genes in Diverse Rice Genotypes as Determined by Modified Significance Analysis of Microarrays. Front. Plant Sci. 2016, 7. [Google Scholar] [CrossRef] [PubMed] [Green Version]
- Lakra, N.; Kaur, C.; Singla-Pareek, S.L.; Pareek, A. Mapping the ‘Early Salinity Response’ Triggered Proteome Adaptation in Contrasting Rice Genotypes Using ITRAQ Approach. Rice 2019, 12, 3. [Google Scholar] [CrossRef] [PubMed]
- Lim, S.D.; Jung, C.G.; Park, Y.C.; Lee, S.C.; Lee, C.; Lim, C.W.; Kim, D.S.; Jang, C.S. Molecular Dissection of a Rice Microtubule-Associated RING Finger Protein and Its Potential Role in Salt Tolerance in Arabidopsis. Plant Mol. Biol. 2015, 89, 365–384. [Google Scholar] [CrossRef] [PubMed]
- Umate, P. Genome-Wide Analysis of the Family of Light-Harvesting Chlorophyll a/b-Binding Proteins in Arabidopsis and Rice. Plant Signal. Behav. 2010, 5, 1537–1542. [Google Scholar] [CrossRef] [Green Version]
- Mishra, M.; Kanwar, P.; Singh, A.; Pandey, A.; Kapoor, S.; Pandey, G.K. Plant Omics: Genome-Wide Analysis of ABA Repressor1 (ABR1) Related Genes in Rice during Abiotic Stress and Development. OMICS 2013, 17, 439–450. [Google Scholar] [CrossRef]
- Park, S.-H.; Jeong, J.S.; Lee, K.H.; Kim, Y.S.; Do Choi, Y.; Kim, J.-K. OsbZIP23 and OsbZIP45, Members of the Rice Basic Leucine Zipper Transcription Factor Family, Are Involved in Drought Tolerance. Plant Biotechnol. Rep. 2015, 9, 89–96. [Google Scholar] [CrossRef]
- Xiang, Y.; Tang, N.; Du, H.; Ye, H.; Xiong, L. Characterization of OsbZIP23 as a Key Player of the Basic Leucine Zipper Transcription Factor Family for Conferring Abscisic Acid Sensitivity and Salinity and Drought Tolerance in Rice. Plant Physiol. 2008, 148, 1938–1952. [Google Scholar] [CrossRef] [Green Version]
- Mirdar Mansuri, R.; Shobbar, Z.-S.; Babaeian Jelodar, N.; Ghaffari, M.R.; Nematzadeh, G.-A.; Asari, S. Dissecting Molecular Mechanisms Underlying Salt Tolerance in Rice: A Comparative Transcriptional Profiling of the Contrasting Genotypes. Rice 2019, 12, 13. [Google Scholar] [CrossRef]
- Ferreira, L.J.; Azevedo, V.; Maroco, J.; Oliveira, M.M.; Santos, A.P. Salt Tolerant and Sensitive Rice Varieties Display Differential Methylome Flexibility under Salt Stress. PLoS ONE 2015, 10, e0124060. [Google Scholar] [CrossRef] [PubMed] [Green Version]
- Jehanzeb, M.; Zheng, X.; Miao, Y. The Role of the S40 Gene Family in Leaf Senescence. Int. J. Mol. Sci. 2017, 18, 2152. [Google Scholar] [CrossRef] [PubMed] [Green Version]
- Zheng, X.; Jehanzeb, M.; Habiba; Zhang, Y.; Li, L.; Miao, Y. Characterization of S40-like Proteins and Their Roles in Response to Environmental Cues and Leaf Senescence in Rice. BMC Plant Biol. 2019, 19, 174. [Google Scholar] [CrossRef] [PubMed]
- Liu, L.; Zhou, Y.; Zhou, G.; Ye, R.; Zhao, L.; Li, X.; Lin, Y. Identification of Early Senescence-Associated Genes in Rice Flag Leaves. Plant Mol. Biol. 2008, 67, 37–55. [Google Scholar] [CrossRef] [PubMed]
- Molla, K.A.; Debnath, A.B.; Ganie, S.A.; Mondal, T.K. Identification and Analysis of Novel Salt Responsive Candidate Gene Based SSRs (CgSSRs) from Rice (Oryza Sativa L.). BMC Plant Biol. 2015, 15, 122. [Google Scholar] [CrossRef] [PubMed] [Green Version]
- Gao, P.; Bai, X.; Yang, L.; Lv, D.; Li, Y.; Cai, H.; Ji, W.; Guo, D.; Zhu, Y. Over-Expression of Osa-MIR396c Decreases Salt and Alkali Stress Tolerance. Planta 2010, 231, 991–1001. [Google Scholar] [CrossRef]
- Huang, X.; Feng, J.; Wang, R.; Zhang, H.; Huang, J. Comparative Analysis of MicroRNAs and Their Targets in the Roots of Two Cultivars with Contrasting Salt Tolerance in Rice (Oryza Sativa L.). Plant Growth Regul. 2019, 87, 139–148. [Google Scholar] [CrossRef]
- Qin, J.; Ma, X.; Tang, Z.; Meng, Y. Construction of Regulatory Networks Mediated by Small RNAs Responsive to Abiotic Stresses in Rice (Oryza Sativa). Comput. Biol. Chem. 2015, 58, 69–80. [Google Scholar] [CrossRef]
- Huda, K.K.; Yadav, S.; Banu, M.S.A.; Trivedi, D.K.; Tuteja, N. Genome-Wide Analysis of Plant-Type II Ca2+ ATPases Gene Family from Rice and Arabidopsis: Potential Role in Abiotic Stresses. Plant Physiol. Biochem. 2013, 65, 32–47. [Google Scholar] [CrossRef]
- Chen, H.; Dai, X.J.; Gu, Z.Y. OsbZIP33 Is an ABA-Dependent Enhancer of Drought Tolerance in Rice. Crop Sci. 2015, 55, 1673–1685. [Google Scholar] [CrossRef]
- Chapagain, S.; Park, Y.C.; Kim, J.H.; Jang, C.S. Oryza Sativa Salt-Induced RING E3 Ligase 2 (OsSIRP2) Acts as a Positive Regulator of Transketolase in Plant Response to Salinity and Osmotic Stress. Planta 2018, 247, 925–939. [Google Scholar] [CrossRef] [PubMed]
- Lin, D.; Jiang, Q.; Ma, X.; Zheng, K.; Gong, X.; Teng, S.; Xu, J.; Dong, Y. Rice TSV3 Encoding Obg-Like GTPase Protein Is Essential for Chloroplast Development during the Early Leaf Stage under Cold Stress. Genes Genomes Genet. 2018, 8, 253–263. [Google Scholar] [CrossRef] [PubMed] [Green Version]
- Boonchai, C.; Udomchalothorn, T.; Sripinyowanich, S.; Comai, L.; Buaboocha, T.; Chadchawan, S. Rice Overexpressing OsNUC1-S Reveals Differential Gene Expression Leading to Yield Loss Reduction after Salt Stress at the Booting Stage. Int. J. Mol. Sci. 2018, 19, 3936. [Google Scholar] [CrossRef] [Green Version]
- Sripinyowanich, S.; Chamnanmanoontham, N.; Udomchalothorn, T.; Maneeprasopsuk, S.; Santawee, P.; Buaboocha, T.; Qu, L.-J.; Gu, H.; Chadchawan, S. Overexpression of a Partial Fragment of the Salt-Responsive Gene OsNUC1 Enhances Salt Adaptation in Transgenic Arabidopsis Thaliana and Rice (Oryza Sativa L.) during Salt Stress. Plant Sci. 2013, 213, 67–78. [Google Scholar] [CrossRef]
- Ahn, J.C.; Kim, D.-W.; You, Y.N.; Seok, M.S.; Park, J.M.; Hwang, H.; Kim, B.-G.; Luan, S.; Park, H.-S.; Cho, H.S. Classification of Rice (Oryza Sativa l. Japonica Nipponbare) Immunophilins (Fkbps, Cyps) and Expression Patterns under Water Stress. BMC Plant Biol. 2010, 10, 253. [Google Scholar] [CrossRef] [PubMed] [Green Version]
- Xue, T.; Wang, D.; Zhang, S.; Ehlting, J.; Ni, F.; Jakab, S.; Zheng, C.; Zhong, Y. Genome-Wide and Expression Analysis of Protein Phosphatase 2C in Rice and Arabidopsis. BMC Genomics 2008, 9, 550. [Google Scholar] [CrossRef] [PubMed] [Green Version]
- Zhou, F.; Wang, C.-Y.; Gutensohn, M.; Jiang, L.; Zhang, P.; Zhang, D.; Dudareva, N.; Lu, S. A Recruiting Protein of Geranylgeranyl Diphosphate Synthase Controls Metabolic Flux toward Chlorophyll Biosynthesis in Rice. Proc. Natl. Acad. Sci. USA 2017, 114, 6866–6871. [Google Scholar] [CrossRef] [PubMed] [Green Version]
- Giri, J.; Vij, S.; Dansana, P.K.; Tyagi, A.K. Rice A20/AN1 Zinc-Finger Containing Stress-Associated Proteins (SAP1/11) and a Receptor-like Cytoplasmic Kinase (OsRLCK253) Interact via A20 Zinc-Finger and Confer Abiotic Stress Tolerance in Transgenic Arabidopsis Plants. New Phytol. 2011, 191, 721–732. [Google Scholar] [CrossRef] [PubMed]
- Goswami, K.; Tripathi, A.; Sanan-Mishra, N. Comparative MiRomics of Salt-Tolerant and Salt-Sensitive Rice. J. Integr. Bioinform. 2017, 14. [Google Scholar] [CrossRef] [PubMed]
- Pradhan, S.K.; Pandit, E.; Nayak, D.K.; Behera, L.; Mohapatra, T. Genes, Pathways and Transcription Factors Involved in Seedling Stage Chilling Stress Tolerance in Indica Rice through RNA-Seq Analysis. BMC Plant Biol. 2019, 19, 352. [Google Scholar] [CrossRef] [Green Version]
- Lakmini, W.G. The Role of SENSITIVE TO FREEZING6 (SFR6) in Plant Tolerance to Stress. In Durham Theses; Durham University: Durham, UK, 2010. [Google Scholar]
- Senadheera, P.; Maathuis, F.J.M. Differentially Regulated Kinases and Phosphatases in Roots May Contribute to Inter-Cultivar Difference in Rice Salinity Tolerance. Plant Signal. Behav. 2009, 4, 1163–1165. [Google Scholar] [CrossRef]
- Liao, Y.; Hu, C.; Zhang, X.; Cao, X.; Xu, Z.; Gao, X.; Li, L.; Zhu, J.; Chen, R. Isolation of a Novel Leucine-Rich Repeat Receptor-like Kinase (OsLRR2) Gene from Rice and Analysis of Its Relation to Abiotic Stress Responses. Biotechnol. Biotechnol. Equip. 2017, 31, 51–57. [Google Scholar] [CrossRef] [Green Version]
- Luan, W.; Shen, A.; Jin, Z.; Song, S.; Li, Z.; Sha, A. Knockdown of OsHox33, a Member of the Class III Homeodomain-Leucine Zipper Gene Family, Accelerates Leaf Senescence in Rice. Sci. China Life Sci. 2013, 56, 1113–1123. [Google Scholar] [CrossRef] [PubMed] [Green Version]
- Yu, J.; Zao, W.; He, Q.; Kim, T.-S.; Park, Y.-J. Genome-Wide Association Study and Gene Set Analysis for Understanding Candidate Genes Involved in Salt Tolerance at the Rice Seedling Stage. Mol. Genet. Genom. 2017, 292, 1391–1403. [Google Scholar] [CrossRef] [PubMed]
- Vij, S.; Giri, J.; Dansana, P.K.; Kapoor, S.; Tyagi, A.K. The Receptor-like Cytoplasmic Kinase (OsRLCK) Gene Family in Rice: Organization, Phylogenetic Relationship, and Expression during Development and Stress. Mol. Plant 2008, 1, 732–750. [Google Scholar] [CrossRef]
- Hedayati, P.; Monfard, H.H.; Isa, N.M.; Hwang, D.J.; Zain, C.R.C.M.; Uddin, M.I.; Zuraida, A.R.; Ismail, I.; Zainal, Z. Construction and Analysis of an Oryza Sativa (Cv. MR219) Salinity-Related CDNA Library. Acta Physiol. Plant. 2015, 37, 91. [Google Scholar] [CrossRef]
- Gómez-Ariza, J.; Brambilla, V.; Vicentini, G.; Landini, M.; Cerise, M.; Carrera, E.; Shrestha, R.; Chiozzotto, R.; Galbiati, F.; Caporali, E.; et al. A Transcription Factor Coordinating Internode Elongation and Photoperiodic Signals in Rice. Nat. Plants 2019, 5, 358–362. [Google Scholar] [CrossRef]
- Zhang, Z.; Liu, H.; Sun, C.; Ma, Q.; Bu, H.; Chong, K.; Xu, Y. A C2H2 Zinc-Finger Protein OsZFP213 Interacts with OsMAPK3 to Enhance Salt Tolerance in Rice. J. Plant Physiol. 2018, 229, 100–110. [Google Scholar] [CrossRef]
- Flowers, T.J.; Yeo, A.R. Variability in the Resistance of Sodium Chloride Salinity within Rice (Oryza Sativa L.) Varieties. New Phytol. 1981, 88, 363–373. [Google Scholar] [CrossRef]
- Lutts, S.; Kinet, J.M.; Bouharmont, J. Changes in plant response to NaCl during development of rice (Oryza sativa L.) varieties differing in salinity resistance. J. Exp. Bot. 1995, 46, 1843–1852. [Google Scholar] [CrossRef]
- Gregorio, G.B.; Senadhira, D.; Mendoza, R.D. Screening Rice for Salinity Tolerance; IRRl Discussion Paper Series; IRRI: Los Banos, Philippines, 1997; pp. 2–23. [Google Scholar]
- Lee, K.-S.; Choi, W.-Y.; Ko, J.-C.; Kim, T.-S.; Gregorio, G.B. Salinity Tolerance of Japonica and Indica Rice (Oryza Sativa L.) at the Seedling Stage. Planta 2003, 216, 1043–1046. [Google Scholar] [CrossRef] [PubMed]
- Neang, S.; de Ocampo, M.; Egdane, J.A.; Platten, J.D.; Ismail, A.M.; Seki, M.; Suzuki, Y.; Skoulding, N.S.; Kano-Nakata, M.; Yamauchi, A.; et al. A GWAS Approach to Find SNPs Associated with Salt Removal in Rice Leaf Sheath. Ann. Bot. 2020, 126, 1193–1202. [Google Scholar] [CrossRef] [PubMed]
- Negrão, S.; Schmöckel, S.M.; Tester, M. Evaluating Physiological Responses of Plants to Salinity Stress. Ann. Bot. 2017, 119, 1–11. [Google Scholar] [CrossRef] [PubMed] [Green Version]
- Verslues, P.E.; Agarwal, M.; Katiyar-Agarwal, S.; Zhu, J.; Zhu, J.-K. Methods and Concepts in Quantifying Resistance to Drought, Salt and Freezing, Abiotic Stresses That Affect Plant Water Status. Plant J. 2006, 45, 523–539. [Google Scholar] [CrossRef]
- Zhu, J.-K. Regulation of Ion Homeostasis under Salt Stress. Curr. Opin. Plant Biol. 2003, 6, 441–445. [Google Scholar] [CrossRef]
- Chakraborty, K.; Chattaopadhyay, K.; Nayak, L.; Ray, S.; Yeasmin, L.; Jena, P.; Gupta, S.; Mohanty, S.K.; Swain, P.; Sarkar, R.K. Ionic Selectivity and Coordinated Transport of Na+ and K+ in Flag Leaves Render Differential Salt Tolerance in Rice at the Reproductive Stage. Planta 2019, 250, 1637–1653. [Google Scholar] [CrossRef]
- Gregorio, G.B.; Senadhira, D. Genetic Analysis of Salinity Tolerance in Rice (Oryza Sativa L.). Theoret. Appl. Genet. 1993, 86, 333–338. [Google Scholar] [CrossRef] [PubMed]
- Moradi, F.; Ismail, A.M. Responses of Photosynthesis, Chlorophyll Fluorescence and ROS-Scavenging Systems to Salt Stress during Seedling and Reproductive Stages in Rice. Ann. Bot. 2007, 99, 1161–1173. [Google Scholar] [CrossRef] [Green Version]
- Yeo, A.R.; Yeo, M.E.; Flowers, S.A.; Flowers, T.J. Screening of Rice (Oryza Sativa L.) Genotypes for Physiological Characters Contributing to Salinity Resistance, and Their Relationship to Overall Performance. Theoret. Appl. Genet. 1990, 79, 377–384. [Google Scholar] [CrossRef] [PubMed]
- Bonilla, P.; Dvorak, J.; Mackill, D.; Deal, K.; Gregorio, G. RFLP and SSLP Mapping of Salinity Tolerance Genes in Chromosome 1 of Rice (Oryza Sativa L.) Using Recombinant Inbred Lines. Philipp. Agric. Sci. 2002, 85, 68–76. [Google Scholar]
- Gregorio, G.B. Tagging Salinity Tolerance Genes in Rice Using Amplified Fragment Length Polymorphism (AFLP); University of the Philippines: Los Baños, Philippines, 1997. [Google Scholar]
- To, H.T.M.; Nguyen, H.T.; Dang, N.T.M.; Nguyen, N.H.; Bui, T.X.; Lavarenne, J.; Phung, N.T.P.; Gantet, P.; Lebrun, M.; Bellafiore, S.; et al. Unraveling the Genetic Elements Involved in Shoot and Root Growth Regulation by Jasmonate in Rice Using a Genome-Wide Association Study. Rice 2019, 12, 69. [Google Scholar] [CrossRef] [Green Version]
- Baillo, E.H.; Kimotho, R.N.; Zhang, Z.; Xu, P. Transcription Factors Associated with Abiotic and Biotic Stress Tolerance and Their Potential for Crops Improvement. Genes 2019, 10, 771. [Google Scholar] [CrossRef] [Green Version]
- Srivastava, A.K.; Zhang, C.; Yates, G.; Bailey, M.; Brown, A.; Sadanandom, A. SUMO Is a Critical Regulator of Salt Stress Responses in Rice. Plant Physiol. 2016, 170, 2378–2391. [Google Scholar] [CrossRef] [Green Version]
- Srivastava, A.K.; Zhang, C.; Caine, R.S.; Gray, J.; Sadanandom, A. Rice SUMO Protease Overly Tolerant to Salt 1 Targets the Transcription Factor, OsbZIP23 to Promote Drought Tolerance in Rice. Plant J. 2017, 92, 1031–1043. [Google Scholar] [CrossRef] [Green Version]
- Kamal; Alnor Gorafi; Abdelrahman; Abdellatef; Tsujimoto Stay-Green Trait: A Prospective Approach for Yield Potential, and Drought and Heat Stress Adaptation in Globally Important Cereals. IJMS 2019, 20, 5837. [CrossRef] [Green Version]
- Li, J.; Wen, J.; Lease, K.A.; Doke, J.T.; Tax, F.E.; Walker, J.C. BAK1, an Arabidopsis LRR Receptor-like Protein Kinase, Interacts with BRI1 and Modulates Brassinosteroid Signaling. Cell 2002, 110, 213–222. [Google Scholar] [CrossRef] [Green Version]
- Wang, X. Brassinosteroids Regulate Dissociation of BKI1, a Negative Regulator of BRI1 Signaling, from the Plasma Membrane. Science 2006, 313, 1118–1122. [Google Scholar] [CrossRef]
- Jang, S.; Li, H.-Y. Oryza Sativa BRASSINOSTEROID UPREGULATED1 LIKE1 Induces the Expression of a Gene Encoding a Small Leucine-Rich-Repeat Protein to Positively Regulate Lamina Inclination and Grain Size in Rice. Front. Plant Sci. 2017, 8, 1253. [Google Scholar] [CrossRef]
- Shang, Y.; Dai, C.; Lee, M.M.; Kwak, J.M.; Nam, K.H. BRI1-Associated Receptor Kinase 1 Regulates Guard Cell ABA Signaling Mediated by Open Stomata 1 in Arabidopsis. Mol. Plant 2016, 9, 447–460. [Google Scholar] [CrossRef] [PubMed] [Green Version]
- Arnon, D.I. Copper Enzymes in Isolated Chloroplasts. Polyphenoloxidase in Beta Vulgaris. Plant Physiol. 1949, 24, 1–15. [Google Scholar] [CrossRef] [PubMed] [Green Version]


| Traits | n | Mean | SD | CV | Replication Effect | Genotype Effect | ||
|---|---|---|---|---|---|---|---|---|
| p-Value | p-Value | F-Value | H2 | |||||
| Full panel | ||||||||
| WC | 182 | 59.98 | 10.49 | 17.49 | <0.001 | <0.001 | 3.500 | 0.71 |
| Score | 182 | 4.41 | 1.16 | 26.30 | <0.001 | <0.001 | 2.576 | 0.61 |
| Chl_total | 182 | 1.4 | 0.65 | 46.43 | <0.001 | <0.001 | 1.924 | 0.48 |
| Chla | 182 | 0.82 | 0.35 | 42.68 | <0.001 | <0.001 | 1.902 | 0.47 |
| Chlb | 182 | 0.52 | 0.28 | 53.85 | <0.001 | <0.001 | 1.675 | 0.40 |
| Chla_b | 182 | 1.75 | 0.99 | 56.57 | 0.0560 | 0.3127 | 1.063 | 0.06 |
| ConcK | 182 | 43.39 | 7.61 | 17.54 | <0.001 | <0.001 | 4.226 | 0.76 |
| ConcNa | 182 | 18.63 | 11.97 | 64.25 | <0.001 | <0.001 | 3.470 | 0.71 |
| Na_K | 182 | 0.42 | 0.27 | 64.29 | <0.001 | <0.001 | 3.342 | 0.70 |
| Indica subpanel | ||||||||
| WC | 112 | 58.99 | 10.74 | 18.21 | <0.001 | <0.001 | 3.570 | 0.72 |
| Score | 112 | 4.51 | 1.1 | 24.39 | <0.001 | <0.001 | 2.644 | 0.62 |
| Chl_total | 112 | 1.39 | 0.72 | 51.80 | <0.001 | <0.001 | 1.849 | 0.46 |
| Chla | 112 | 0.82 | 0.39 | 47.56 | <0.001 | <0.001 | 2.105 | 0.53 |
| Chlb | 112 | 0.51 | 0.3 | 58.82 | <0.001 | <0.001 | 1.859 | 0.46 |
| Chla_b | 112 | 1.82 | 1.22 | 67.03 | 0.0413 | 0.3759 | 1.051 | 0.05 |
| ConcK | 112 | 45.86 | 7.04 | 15.35 | <0.001 | <0.001 | 2.855 | 0.65 |
| ConcNa | 112 | 19.48 | 11.63 | 59.70 | <0.001 | <0.001 | 3.414 | 0.71 |
| Na_K | 112 | 0.42 | 0.25 | 59.52 | <0.001 | <0.001 | 2.992 | 0.67 |
| Japonica subpanel | ||||||||
| WC | 64 | 61.7 | 9.75 | 15.80 | <0.001 | <0.001 | 2.858 | 0.65 |
| Score | 64 | 4.26 | 1.23 | 28.87 | 0.9317 | <0.001 | 2.525 | 0.60 |
| Chl_total | 64 | 1.38 | 0.52 | 37.68 | <0.001 | <0.001 | 2.292 | 0.56 |
| Chla | 64 | 0.81 | 0.29 | 35.80 | 0.0026 | 0.0171 | 1.580 | 0.37 |
| Chlb | 64 | 0.52 | 0.24 | 46.15 | <0.001 | 0.0414 | 1.455 | 0.31 |
| Chla_b | 64 | 1.65 | 0.43 | 26.06 | 0.0072 | 0.4666 | 1.014 | 0.01 |
| ConcK | 64 | 39.38 | 6.8 | 17.27 | <0.001 | <0.001 | 2.698 | 0.63 |
| ConcNa | 64 | 17.61 | 12.41 | 70.47 | <0.001 | <0.001 | 3.056 | 0.67 |
| Na_K | 64 | 0.44 | 0.3 | 68.18 | <0.001 | <0.001 | 2.879 | 0.65 |
| Traits | Panels | WC | Score | Chl_Total | Chla | Chlb | Chla_b | ConcK | ConcNa | Na_K |
|---|---|---|---|---|---|---|---|---|---|---|
| WC | F | 1 | <0.001 | <0.001 | <0.001 | <0.001 | 0.608 | <0.001 | <0.001 | <0.001 |
| WC | I | 1 | <0.001 | <0.001 | <0.001 | <0.001 | 0.709 | <0.001 | <0.001 | <0.001 |
| WC | J | 1 | <0.001 | <0.001 | 0.004 | 0.012 | 0.469 | <0.001 | <0.001 | <0.001 |
| Score | F | −0.70 | 1 | <0.001 | <0.001 | 0.004 | 0.896 | <0.001 | <0.001 | <0.001 |
| Score | I | −0.71 | 1 | <0.001 | <0.001 | 0.004 | 0.803 | <0.001 | <0.001 | <0.001 |
| Score | J | −0.66 | 1 | 0.062 | 0.093 | 0.102 | 0.611 | 0.033 | <0.001 | <0.001 |
| Chl_total | F | −0.34 | 0.17 | 1 | <0.001 | <0.001 | <0.001 | 0.065 | <0.001 | <0.001 |
| Chl_total | I | −0.44 | 0.24 | 1 | <0.001 | <0.001 | <0.001 | 0.027 | <0.001 | <0.001 |
| Chl_total | J | −0.26 | 0.13 | 1 | <0.001 | <0.001 | <0.001 | 0.507 | 0.165 | 0.315 |
| Chla | F | −0.31 | 0.18 | 0.82 | 1 | <0.001 | 0.278 | 0.231 | 0.001 | 0.002 |
| Chla | I | −0.39 | 0.24 | 0.85 | 1 | <0.001 | 0.704 | 0.042 | <0.001 | <0.001 |
| Chla | J | −0.21 | 0.12 | 0.78 | 1 | <0.001 | 0.180 | 0.941 | 0.664 | 0.793 |
| Chlb | F | −0.24 | 0.12 | 0.75 | 0.76 | 1 | <0.001 | 0.845 | 0.007 | 0.008 |
| Chlb | I | −0.29 | 0.16 | 0.73 | 0.72 | 1 | <0.001 | 0.192 | <0.001 | <0.001 |
| Chlb | J | −0.18 | 0.12 | 0.78 | 0.81 | 1 | <0.001 | 0.865 | 0.556 | 0.739 |
| Chla_b | F | 0.02 | 0.01 | −0.27 | −0.05 | −0.61 | 1 | 0.763 | 0.525 | 0.591 |
| Chla_b | I | 0.02 | 0.01 | −0.24 | −0.02 | −0.62 | 1 | 0.835 | 0.586 | 0.638 |
| Chla_b | J | 0.05 | -0.04 | −0.32 | −0.10 | −0.62 | 1 | 0.438 | 0.611 | 0.817 |
| ConcK | F | −0.41 | 0.32 | 0.08 | 0.05 | 0.01 | 0.01 | 1 | <0.001 | <0.001 |
| ConcK | I | −0.43 | 0.39 | 0.12 | 0.11 | 0.07 | 0.01 | 1 | <0.001 | <0.001 |
| ConcK | J | −0.33 | 0.15 | 0.05 | 0.01 | 0.01 | −0.06 | 1 | <0.001 | 0.005 |
| ConcNa | F | −0.84 | 0.63 | 0.16 | 0.14 | 0.11 | −0.03 | 0.42 | 1 | <0.001 |
| ConcNa | I | −0.83 | 0.63 | 0.25 | 0.24 | 0.19 | −0.03 | 0.41 | 1 | <0.001 |
| ConcNa | J | −0.84 | 0.59 | 0.10 | 0.03 | 0.04 | −0.04 | 0.41 | 1 | <0.001 |
| Na_K | F | −0.79 | 0.59 | 0.15 | 0.13 | 0.11 | −0.02 | 0.20 | 0.96 | 1 |
| Na_K | I | −0.79 | 0.61 | 0.23 | 0.22 | 0.18 | −0.03 | 0.23 | 0.97 | 1 |
| Na_K | J | −0.81 | 0.59 | 0.07 | 0.02 | 0.02 | −0.02 | 0.20 | 0.97 | 1 |
Publisher’s Note: MDPI stays neutral with regard to jurisdictional claims in published maps and institutional affiliations. |
© 2021 by the authors. Licensee MDPI, Basel, Switzerland. This article is an open access article distributed under the terms and conditions of the Creative Commons Attribution (CC BY) license (https://creativecommons.org/licenses/by/4.0/).
Share and Cite
Le, T.D.; Gathignol, F.; Vu, H.T.; Nguyen, K.L.; Tran, L.H.; Vu, H.T.T.; Dinh, T.X.; Lazennec, F.; Pham, X.H.; Véry, A.-A.; et al. Genome-Wide Association Mapping of Salinity Tolerance at the Seedling Stage in a Panel of Vietnamese Landraces Reveals New Valuable QTLs for Salinity Stress Tolerance Breeding in Rice. Plants 2021, 10, 1088. https://doi.org/10.3390/plants10061088
Le TD, Gathignol F, Vu HT, Nguyen KL, Tran LH, Vu HTT, Dinh TX, Lazennec F, Pham XH, Véry A-A, et al. Genome-Wide Association Mapping of Salinity Tolerance at the Seedling Stage in a Panel of Vietnamese Landraces Reveals New Valuable QTLs for Salinity Stress Tolerance Breeding in Rice. Plants. 2021; 10(6):1088. https://doi.org/10.3390/plants10061088
Chicago/Turabian StyleLe, Thao Duc, Floran Gathignol, Huong Thi Vu, Khanh Le Nguyen, Linh Hien Tran, Hien Thi Thu Vu, Tu Xuan Dinh, Françoise Lazennec, Xuan Hoi Pham, Anne-Aliénor Véry, and et al. 2021. "Genome-Wide Association Mapping of Salinity Tolerance at the Seedling Stage in a Panel of Vietnamese Landraces Reveals New Valuable QTLs for Salinity Stress Tolerance Breeding in Rice" Plants 10, no. 6: 1088. https://doi.org/10.3390/plants10061088