1. Introduction
Social media platforms offer users the opportunity to inform themselves about topics and events and to express and exchange thoughts, opinions, ideas, and feelings publicly or within a particular group of people. Occasionally, a spatial reference is assigned to social media messages or posts by adding a coordinate or a location. The link to a certain topic can be explicitly built by the use of hashtags or keywords. Implicit ways to link a topic may include, but are not limited to, contextualizing one’s remarks by embedding a topical post, embedding a relevant image or URL, referencing a relevant quote directly or indirectly, etc. If social media content, for instance, a tweet, addresses a specific event, then this tweet can be regarded as a reaction to the event. An event is an indicator of change and is considered to be a segment of time that is ‘carved out of processes’ [
1] (p. 2273); thus, it is bounded in time and space and can be distinguished, memorized, and referenced. Human reactions comprise a feeling, a thought, or an action caused by a stimulus, such as an event. This implies that reactions to events include not only direct actions, but also cognitive and perceptive elements [
2].
Factual information about an event to which people are reacting can be obtained from different types of (geo-)sensors, official authorities, or the public press, but not the emotional or attitudinal impact of events on people. This emotional impact is, for instance, reflected in their reactions as expressed in location-based social media (LBSM). Among other methods, emotions or sentiments within a tweet can be expressed through the use of emojis. In social networks, instant messaging clients and similar platforms, the use of emojis, and the number of available emojis is increasing [
3,
4]. Emojis are pictorial symbols that show faces, people, animals, places, activities, or objects. Since some emojis express emotions, the use of these emojis adds emotive information to the content that they are used in. Therefore, emojis are the main focus of this work and a means to comprehend emotional reactions to events in LBSM.
Our motivation for conducting this work can be seen from a socio-scientific and a rather methodological point of view. The methodological perspective is that we see potential in emojis as language-independent indicators of emotions [
5,
6], which can help to avoid error-prone language processing applied to realize sentiment or affect analysis and thus the commitment to mostly one or seldom very few languages. Our socio-scientific motivation is that the reactions of people (and particularly emotional reactions) towards either upcoming or past events are not captured and documented like event-related ‘hard data’, such as election results or weather data. However, these ‘soft data’ are contained in a vast amount of LBSM posts. Their extraction out of these posts is less costly, time consuming, and resource-intense than empirical surveys. In this way, reactions can be made explicit and can provide insight into the thoughts and feelings of people concerning an event.
Therefore, the presented research aims at better understanding the geographic and temporal patterns of how people feel and think about events, whereas the focus of this work is not on the event itself, but on the reactions to it. To conceive the emotional semantics of reactions, two approaches are proposed, and both utilize emojis. On the one hand, hashtags and emojis classified as positive or negative are combined to determine the sentiment of a reaction; on the other hand, emojis assigned to emotional categories are used as indicators of joy, fear, sadness, and other emotions within a reaction. Both approaches are applied to and discussed for the example case of Brexit, i.e., the withdrawal of the United Kingdom (UK) from the European Union (EU). This investigation of emotional reactions in LBSM to Brexit, which is regarded from different perspectives by focusing on space, time, or topic of the reactions to describe, visualize, and thus analyze them, shows which kinds of insight emoji-filled social media data can give.
Accordingly, this paper presents the development of a framework for using emojis as an extra variable in addition to time and topic to augment spatial analysis. This paper also presents a case study to review the validity of this approach.
2. Related Work
2.1. Reactions to Events in Social Media
The domains that specifically investigate reactions to events as expressed in social media are diverse (e.g., computer sciences, social sciences, geography, linguistics, and natural sciences), which implies that the purposes of these analyses will also vary widely. In all of the studies that we analyzed, a message or post published on a social media platform related to a given event is considered to be a reaction. The most commonly examined social media platform is the microblogging service Twitter, but Facebook and the Chinese microblogging service Sina Weibo are examples of other platforms studied. Typically, references to a given event are made through particular keywords or hyperlinks contained in a message and by using a temporal window to limit data collection to the issue attention cycle around the event [
7], i.e., the period in which public attention to an event rises and drops off.
The study purpose of related work includes investigating the diffusion of reactions [
8,
9,
10,
11]; analyzing the way that an event is perceived, i.e., the attitudes and concerns triggered by an event [
12,
13,
14,
15]; identifying trusted or credible information sources [
16]; event detection from reactions including monitoring [
17,
18]; the assessment of the effectiveness of advertising campaigns [
19]; sales prediction [
20]; or interrelationships with the news media [
21,
22,
23,
24].
Although in the studies mentioned before, space is partially regarded, the interdependence between reactions and space is rarely investigated [
9,
10,
13,
14]. However, since events are occurring at a certain place or are at least related to a place, interesting research questions emerge, for instance, how do reactions change (quantitatively and qualitatively) with increasing distance to the location of the event? Do reactions differ inside and outside the impact area of an event or when grouped spatially, e.g., by country?
2.2. Emojis in Social Media
The term emoji is of Japanese origin (えもじ) and means pictograph. The similarity to the English words emotion and emoticon is coincidental. Emojis are pictorial symbols that replace words or concepts, especially in electronic messages. Emojis need to be distinguished from emoticons which are a sequence of ASCII characters that express emotional states within written communication, e.g., :-).
In October 2010, emojis were included in Unicode 6.0; thus, a basis for a worldwide and consistent encoding was established. In total, 2789 emojis are currently registered in the Unicode emoji characters list (
http://unicode.org/emoji/charts/full-emoji-list.html) (state: November 2018) and are subdivided into eight categories (Smileys & People, Animals & Nature, Food & Drink, Travel & Places, Activities, Objects, Symbols, and Flags) that are again divided into multiple sub-categories.
In 2013 and 2014, more than ten billion emojis were used on Twitter [
5]. The web application emojitracker (
http://emojitracker.com/) tracks the emoji use on Twitter in real-time. [
4] discussed a competition between emoticons and emojis since the introduction of emojis and found that Twitter users, who were adopting emojis, were using fewer emoticons than before. Thus, emojis will probably take over the task of emoticons, which fulfills paralinguistic functions. [
5] even raised the question on whether future textual communication will gradually turn into a pictorial language. Aptly, the Chinese artist Bing Xu published the first belletristic work written only with emojis and other ideograms [
25].
According to [
5], tweets containing emojis are more emotional. These researchers created a sentiment lexicon (
http://kt.ijs.si/data/Emoji_sentiment_ranking/) for the 751 most frequently used emojis, and the majority of them are positive. [
26] developed a method for creating emotional vectors of emojis by automatically using the collocation relationship between emotional words and emojis derived from weblogs.
Several research projects elaborate extracting emotions from Twitter messages by including hashtags, emojis, emoticons, internet slang, etc., e.g., [
27,
28,
29,
30], without considering space. Likewise, numerous space-related approaches analyze social media data by applying emotion detection or sentiment analysis, e.g., [
31,
32,
33,
34,
35,
36,
37]. However, both the spatial reference of social media posts and emojis are hardly regarded in combination. [
38] considered space and (not emojis but) emoticons, in addition to the key words and phrases, in tweets to determine sentiment in New York City. [
39] developed an interdisciplinary approach for urban planning purposes to assess the emotions of citizens in different locations in a city by analyzing the similarity of space, time, and linguistics of tweets. This approach includes the consideration of emojis, in addition to spelling, punctuation, etc.
The main fault susceptibility of the most last-quoted publications is that natural language processing (NLP) is involved, which is quite complex and thus error-prone. Although sentiment analysis from textual data emerged in the early 2000s, it is far from providing accurate results as written language is interpreted differently by computers and humans. Jokes, sarcasm, irony, slang, and negations are typically understood correctly by humans, but can cause errors in computational analysis. Texts can be difficult to access by computers due to missing information regarding the context that the text was written in or refers to [
40,
41]. Moreover, this type of analysis is usually restricted to one language (most commonly to English) by which the data basis is reduced due to language dependency. Sentiment analysis from textual data involves diverse approaches, but the inclusion of emojis has not been fundamentally established yet and is still at the very beginning, which a survey of the state-of-the-art methods by [
41] illustrates.
3. Utilizing Emojis for Sentiment and Affect Analysis
The overall emotional reaction of humans consists of several components, and one of these components is expressive motoric reactions, such as gestures and countenance [
42], that can also be found in emojis: particular emojis depict countenance and gestures and thus represent emotions. These specific emojis show faces or persons. Emojis are much more diverse in emotional expression than emoticons because as pictorial symbols, they allow a more creative scope and possibilities of expression than a concatenation of ASCII characters. The addressed emojis can be seen as emotional signals [
5,
6] that add sentimental information to a social media post. Nevertheless, the latest research has found that emojis of objects communicate a positive sentiment [
43].
According to [
44], emojis are used when it is difficult to express emotions only with words, which may be due to the absence of non-verbal cues in written communication, and the inability to express countenances, physical gestures, and intonations that are an essential part of face-to-face communication [
45,
46]. Accordingly, an emoji can increase the expressivity and sentiment of a text message [
44]. [
4,
45,
46,
47,
48] suggest that emojis are used for conveying emotions, and [
44,
49] report that the utilization of emojis in sentiment analysis contributes to improving sentiment scores.
Although the usage of the emojis of faces for emotional analysis is limited since they are not contained in every social media post, the main advantage is that they are emotional indicators independent from language and culture. This universality is underpinned by seven basic emotions (joy, anger, disgust, fear, contempt, sadness, and surprise) that [
50] empirically proved to be recognized in facial expressions irrespective of culture. This means that humans worldwide, regardless of where and how they were raised and socialized, are able to decode these emotions not only in the expressions of human faces, but also in emoji faces. The emotional meaning of an emoji is unambiguous at a denotative level of expression, although a different interpretation due to cultural differences may occur merely at the connotative level of meaning [
48]. However, the extent to which these emotions are expressed within social contact differs, which is associated with the fact that according to the cultural context, emotions are either desired or undesired in certain situations.
A disadvantage of emojis is that the sentimental and semantic interpretation of them and thus their usage might differ between individual users. Moreover, variations in interpretation (regarding sentiment and semantics) can also be caused by different viewing platforms (e.g., Android, iOS) as emojis render differently [
52,
53].
Our work aims at utilizing emojis to analyze reactions in LBSM regarding emotions. Sentiment analysis and affect analysis are applied. Sentiment analysis measures the overall polarity of opinions and sentiments, usually in the sense of positive, negative, and neutral. In contrast, affect analysis considers emotional content and thus a significantly larger number of potential emotions, such as joy, sadness, hate, excitement, fear, etc.
Therefore, two approaches are proposed as follows:
combining emojis and hashtags for sentiment analysis, which is built on an existing classification of emojis (see
Section 3.1);
utilizing emojis for affect analysis by using a self-developed emoji classification (see
Section 3.2).
Both approaches utilize the emojis of faces. [
5] developed a sentiment lexicon of the 751 most frequently used emojis that contains these emojis of faces, but mainly emojis of objects. We decided to not use this lexicon and to restrict ourselves to face emojis as they are more obvious representations of sentiment and emotions and because the lexicon of [
5] lacks the emojis that we want to utilize. The sentiment of object emojis can vary strongly, depending on the context that they are used in. In addition, it is more difficult to assign emotions to object emojis than to the emojis that show an emotional facial expression.
Subsequently, both approaches are applied to the example case of Brexit (see
Section 4). Although the presented work is primarily a case study, it nevertheless proposes two methods for extracting emotional reactions from LBSM.
3.1. Combining Emojis and Hashtags
The occurrence of a certain hashtag within a social media post indicates that the post addresses the topic that the hashtag refers to, but not whether it is addressed in a positive or negative way. Therefore, emojis (if they occur in the same post) can be involved to determine this binary polarity.
Unicode divides all 2789 listed emojis into different categories and sub-categories, among which are the sub-categories of ‘face-positive’ and ‘face-negative’. These two subcategories were selected to define the sentiment of an emoji. In this way, gross errors are possible regarding the aforementioned findings of [
52] and [
53] concerning differences in interpretation. On the contrary, these two sub-categories are quite an elementary division that can be assumed to coincide with the most common emoji usage.
Using the co-occurrence of hashtags and particular emojis for determining the positive or negative thematization of a topic is a form of sentiment analysis since it considers the polarity of a social media post and not a larger number of potential emotions, such as joy, sadness, hate, etc., as affect analysis does.
3.2. Assigning Emojis to Emotional Categories
The potential of emojis has not yet been exploited by this approach. The countenance and gesture of particular emojis have a much higher emotional significance than merely positive/negative. Thus, the classification of emojis into emotional categories such as joy, anger, fear, etc., seems to be appropriate to realize affect analysis, which goes beyond the positive-negative view of sentiment analysis.
All existing emojis that show faces or persons with a countenance or gesture were selected to assign emotions to them. The emojis that depict faces or persons in combination with an object (e.g., face with medical mask) were excluded since in such cases, the focus is on the object and not on the face itself. Altogether, 85 emojis were selected from the Unicode emoji characters list, version 11.0 (state: November 2018).
Assigning these emojis to emotional categories was conducted in three steps by utilizing the emoji names from the Unicode emoji characters list. The basis for this is the categorization of [
54], which distinguishes six emotional categories, namely, love, joy, surprise, anger, sadness, and fear. Love, joy, and surprise are rated as positive, and anger, sadness, and fear are rated as negative.
As a first step, the emojis that contain a clear emotional expression due to a countenance or gesture in their name from the Unicode emoji characters list were assigned to one of the six emotional categories following [
54]. For instance, laughing indicates joy, crying indicates sadness, kissing indicates love, etc. [
55].
Within the categorization of [
54], in total, 135 emotional terms are ascribed to the six categories (e.g.,
satisfaction is ascribed to joy,
anguish is ascribed to sadness,
anxiety is ascribed to fear). In the second step, for each emoji name, the contained emotional term was looked up in the emotional structure of [
54]. The assignment followed the emotional category in which the respective emotional term appears (e.g.,
angry face was assigned to anger,
fearful face was assigned to fear,
astonished face was assigned to surprise).
A third step was applied if the emotional term within an emoji name does not exist in the emotional structure of [
54]. In this case, a synonym of it was looked up instead. For example,
frowning face indicates dislike, and in the categorization of [
54], the word
dislike appears in the emotional category of anger; therefore, this emoji represents anger.
In one case, the assignment of an emoji to two emotional categories was necessary:
sad but relieved face belongs both to sadness and joy. Afterwards, some emojis remained that did not fit into any emotional category. Thus, an additional emotional category was introduced, namely, neutral, which describes a rather indifferent or weary state.
Table 1 summarizes the assignment of emojis to the seven emotional categories. Although the joy category is overrepresented, positive and negative emotional categories balance one another in contrast to [
5] (where their criterion for emoji selection was the frequency of use, i.e., the majority of used emojis is positive, perhaps because more positive emojis exist).
4. Example Case of Brexit
The previously described approaches for determining sentiment and emotions in LBSM posts were applied to the example case of Brexit. Accordingly, visual presentations were created, which allowed the investigation of emotional reactions in georeferenced tweets. A dataset was used that comprised 428,097 georeferenced tweets from Europe posted between 01 June 2016 and 31 July 2016 and that contained the keywords brexit or euref.
The problem of a different rendering of emojis depending on the viewing platform, thus leading to different interpretation, is slightly diminished for Twitter because Twitter created and owns an open source emoji set called Twemoji. Only Apple operating systems do not use Twemoji, but native emojis are provided by Apple instead. In the used Twitter dataset (which was described in the previous paragraph), 47% of the Tweets are sent from devices that run an Apple operating system. Advantageously, Twitter and Apple emojis have a high degree of similarity, which is evident in the Unicode emoji characters list1.
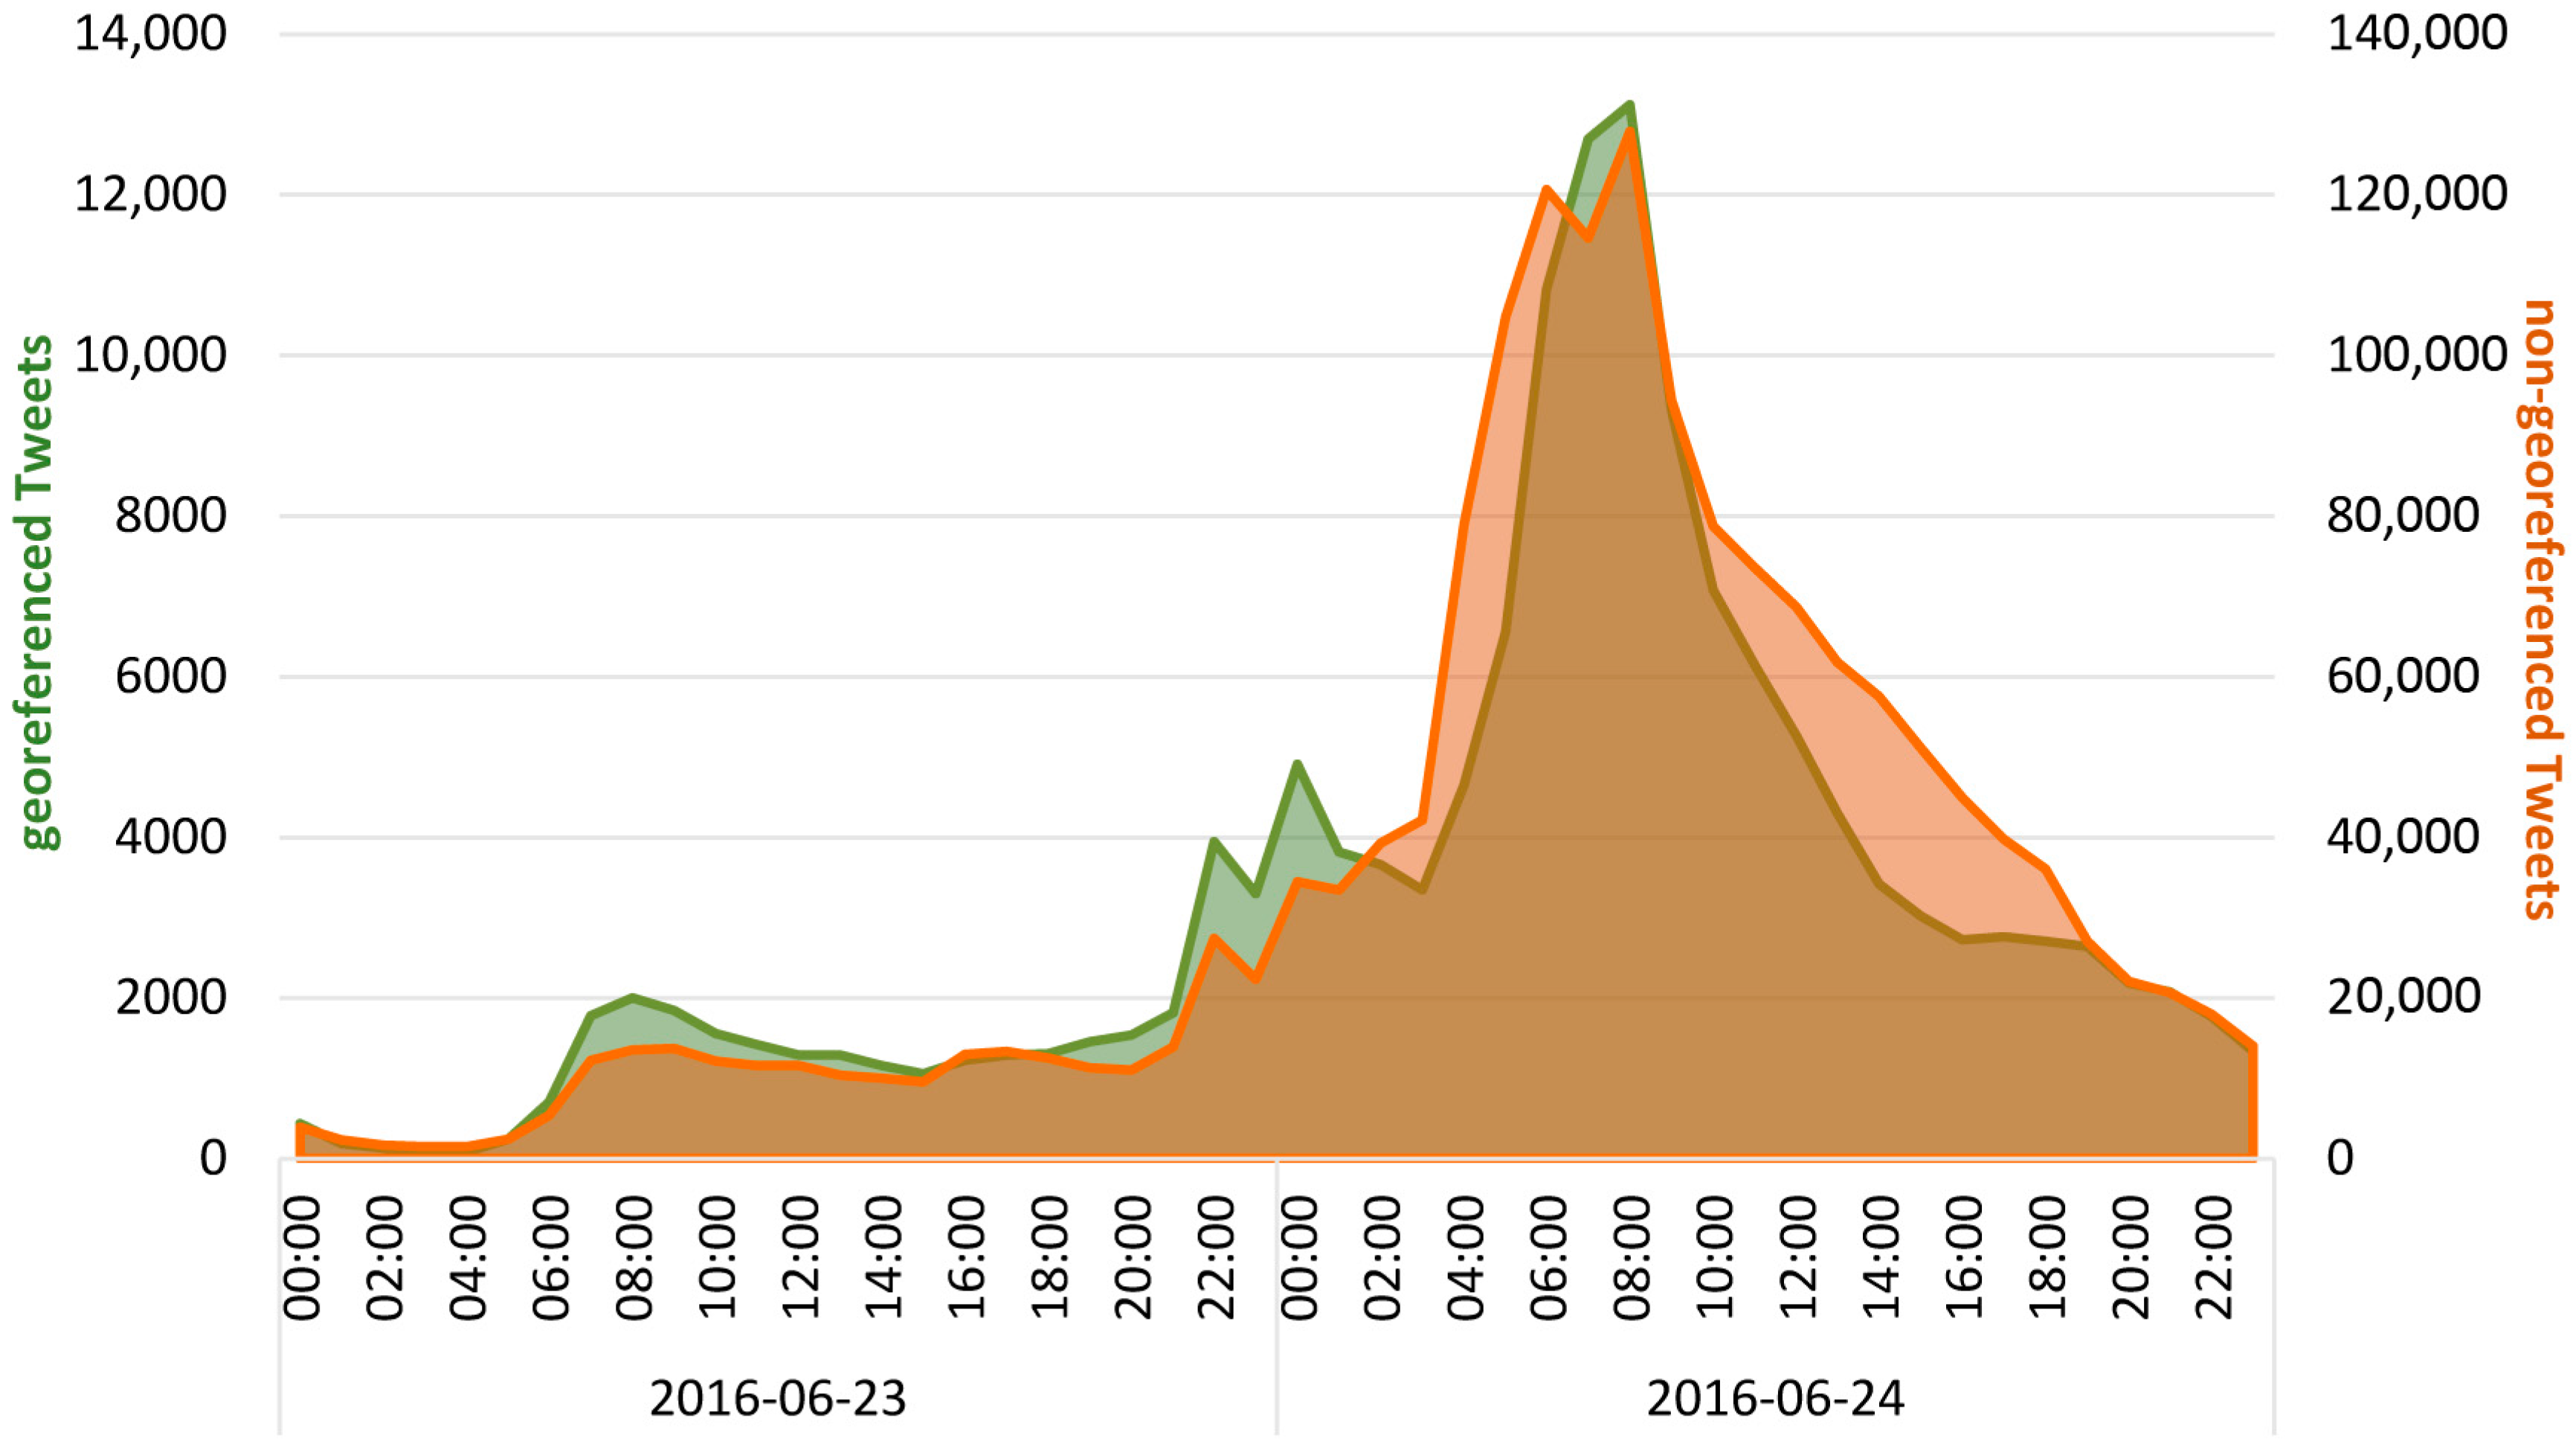
Georeferenced tweets usually constitute approximately 2% of all tweets [
56,
57,
58]. For the two days of 23 and 24 June 2016 (the day of the referendum and the day after), a comparison of the used dataset with all public non-georeferenced tweets that contain
brexit or
euref (see
Figure 1) showed that in this case, 9% of all tweets have a spatial reference. This reflects the findings of [
59] indicating that the proportion of tweets with geolocation varies by event type. The correlation coefficient between the number of georeferenced and non-georeferenced tweets of these two days is 0.95, which affirms that the used dataset is a representable subset of all available data regarding volume.
The georeferenced tweets in the used dataset were sent from 122,680 users, which means that each user sent an average of 3.5 tweets within the investigated time frame. Overall, 73,999 users were tweeting from the UK. By far the most influential user contributed 2566 tweets (i.e., 0.6%), which are in most cases, a sequence of almost identical hashtags occasionally followed by a link, and all were sent from three different places in the UK. The tweets posted by this user contain only emojis that show country flags or a globe and thus do not distort the following emotional analyses.
Within the total amount of georeferenced tweets in the used dataset, 67% were sent from the UK. This illustrates that people from all over Europe were following Brexit with interest. At the same time, the tweet density of the UK with 1.18 tweets/km2 compared to the tweet density of the rest of Europe with 0.01 tweets/km2 underlines that the UK is most affected by Brexit and its consequences.
4.1. Overview Analysis
Since the used dataset consists of tweets that contain the keywords
brexit and
euref, it is ensured that the reactions are Brexit-related and that they all refer to the same event. The Brexit event can hardly be reduced to a specific point in time, but rather should be considered as an ongoing opinion formation process and a series of several sub-events. Sub-events are, for instance, the day of the referendum, 23 June 2016, or the moment when the results of the referendum were announced at Manchester Town Hall on 24 June 2016 at 07:20. The referendum was predictable (i.e., it was previously known that the referendum would take place), and it was mentioned and discussed on Twitter not only before, but also afterwards.
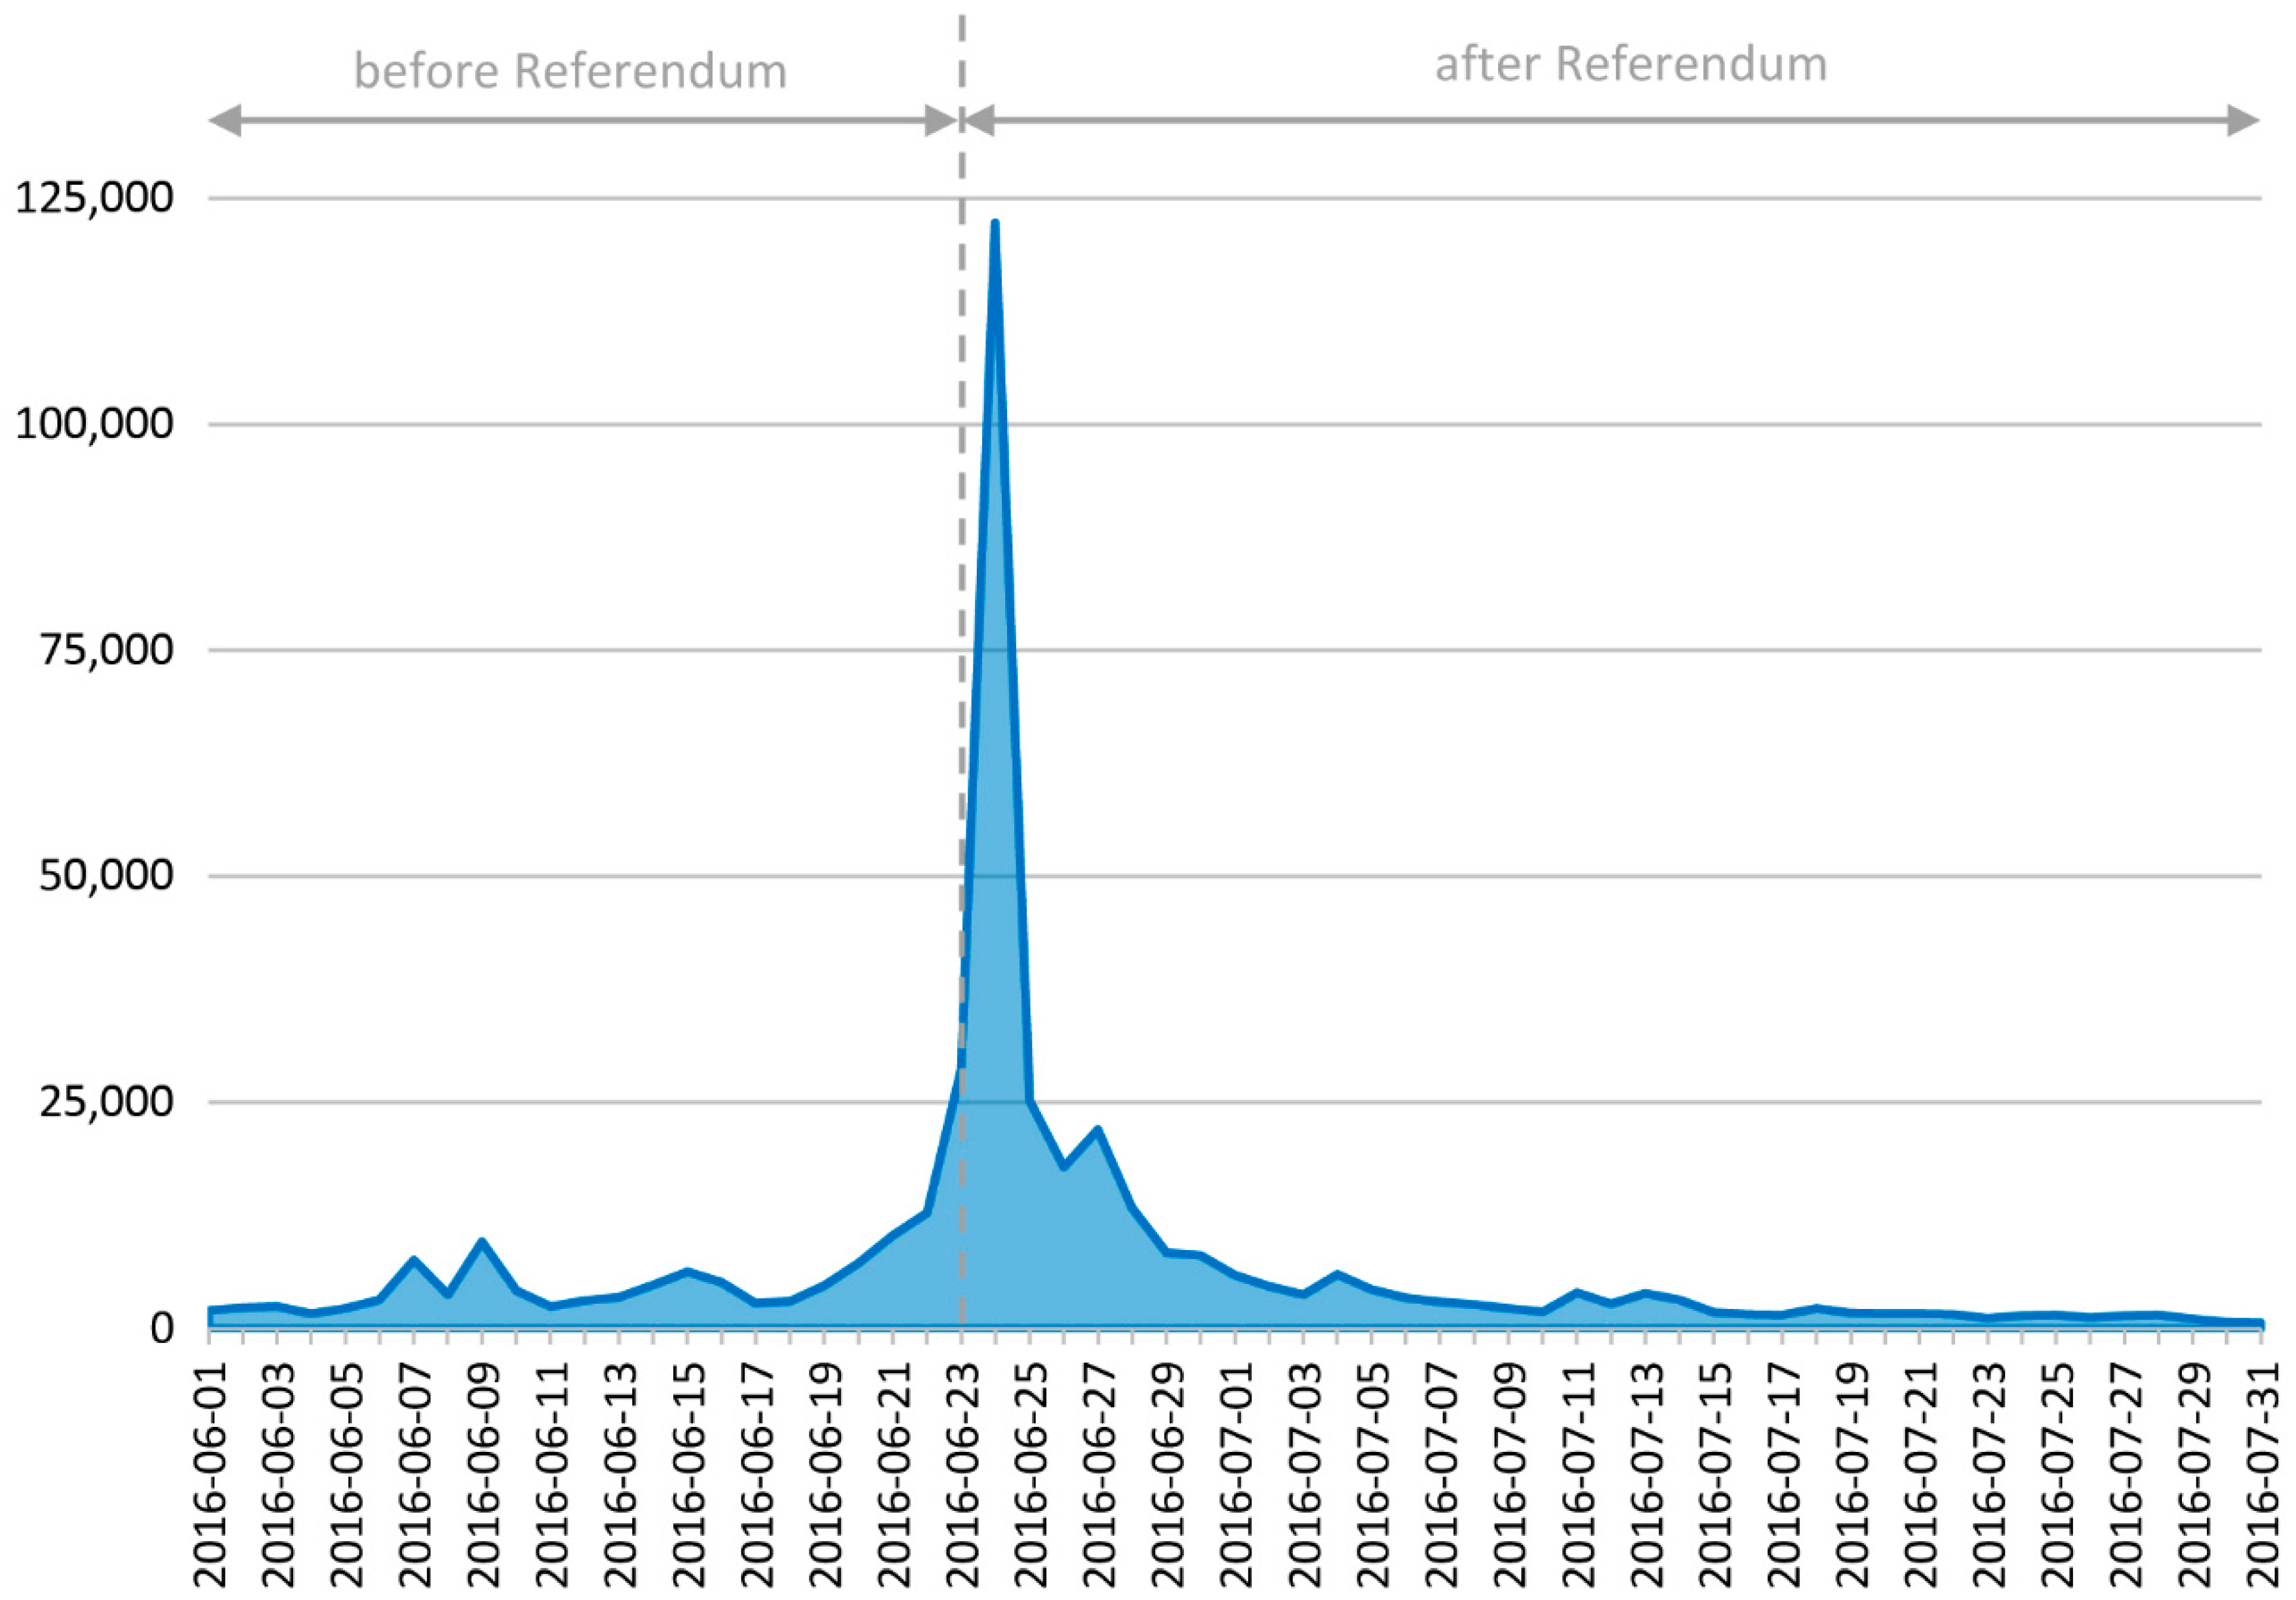
Figure 2 shows the number of reactions for each day of the entire dataset. The day after the referendum, when the results were announced, is clearly identifiable as a peak. The following analyses will focus on the day of the referendum and the day after (23 and 24 June 2016) since these two days provide the most substance to study in terms of the data amount and sub-events.
4.2. Detail Analysis
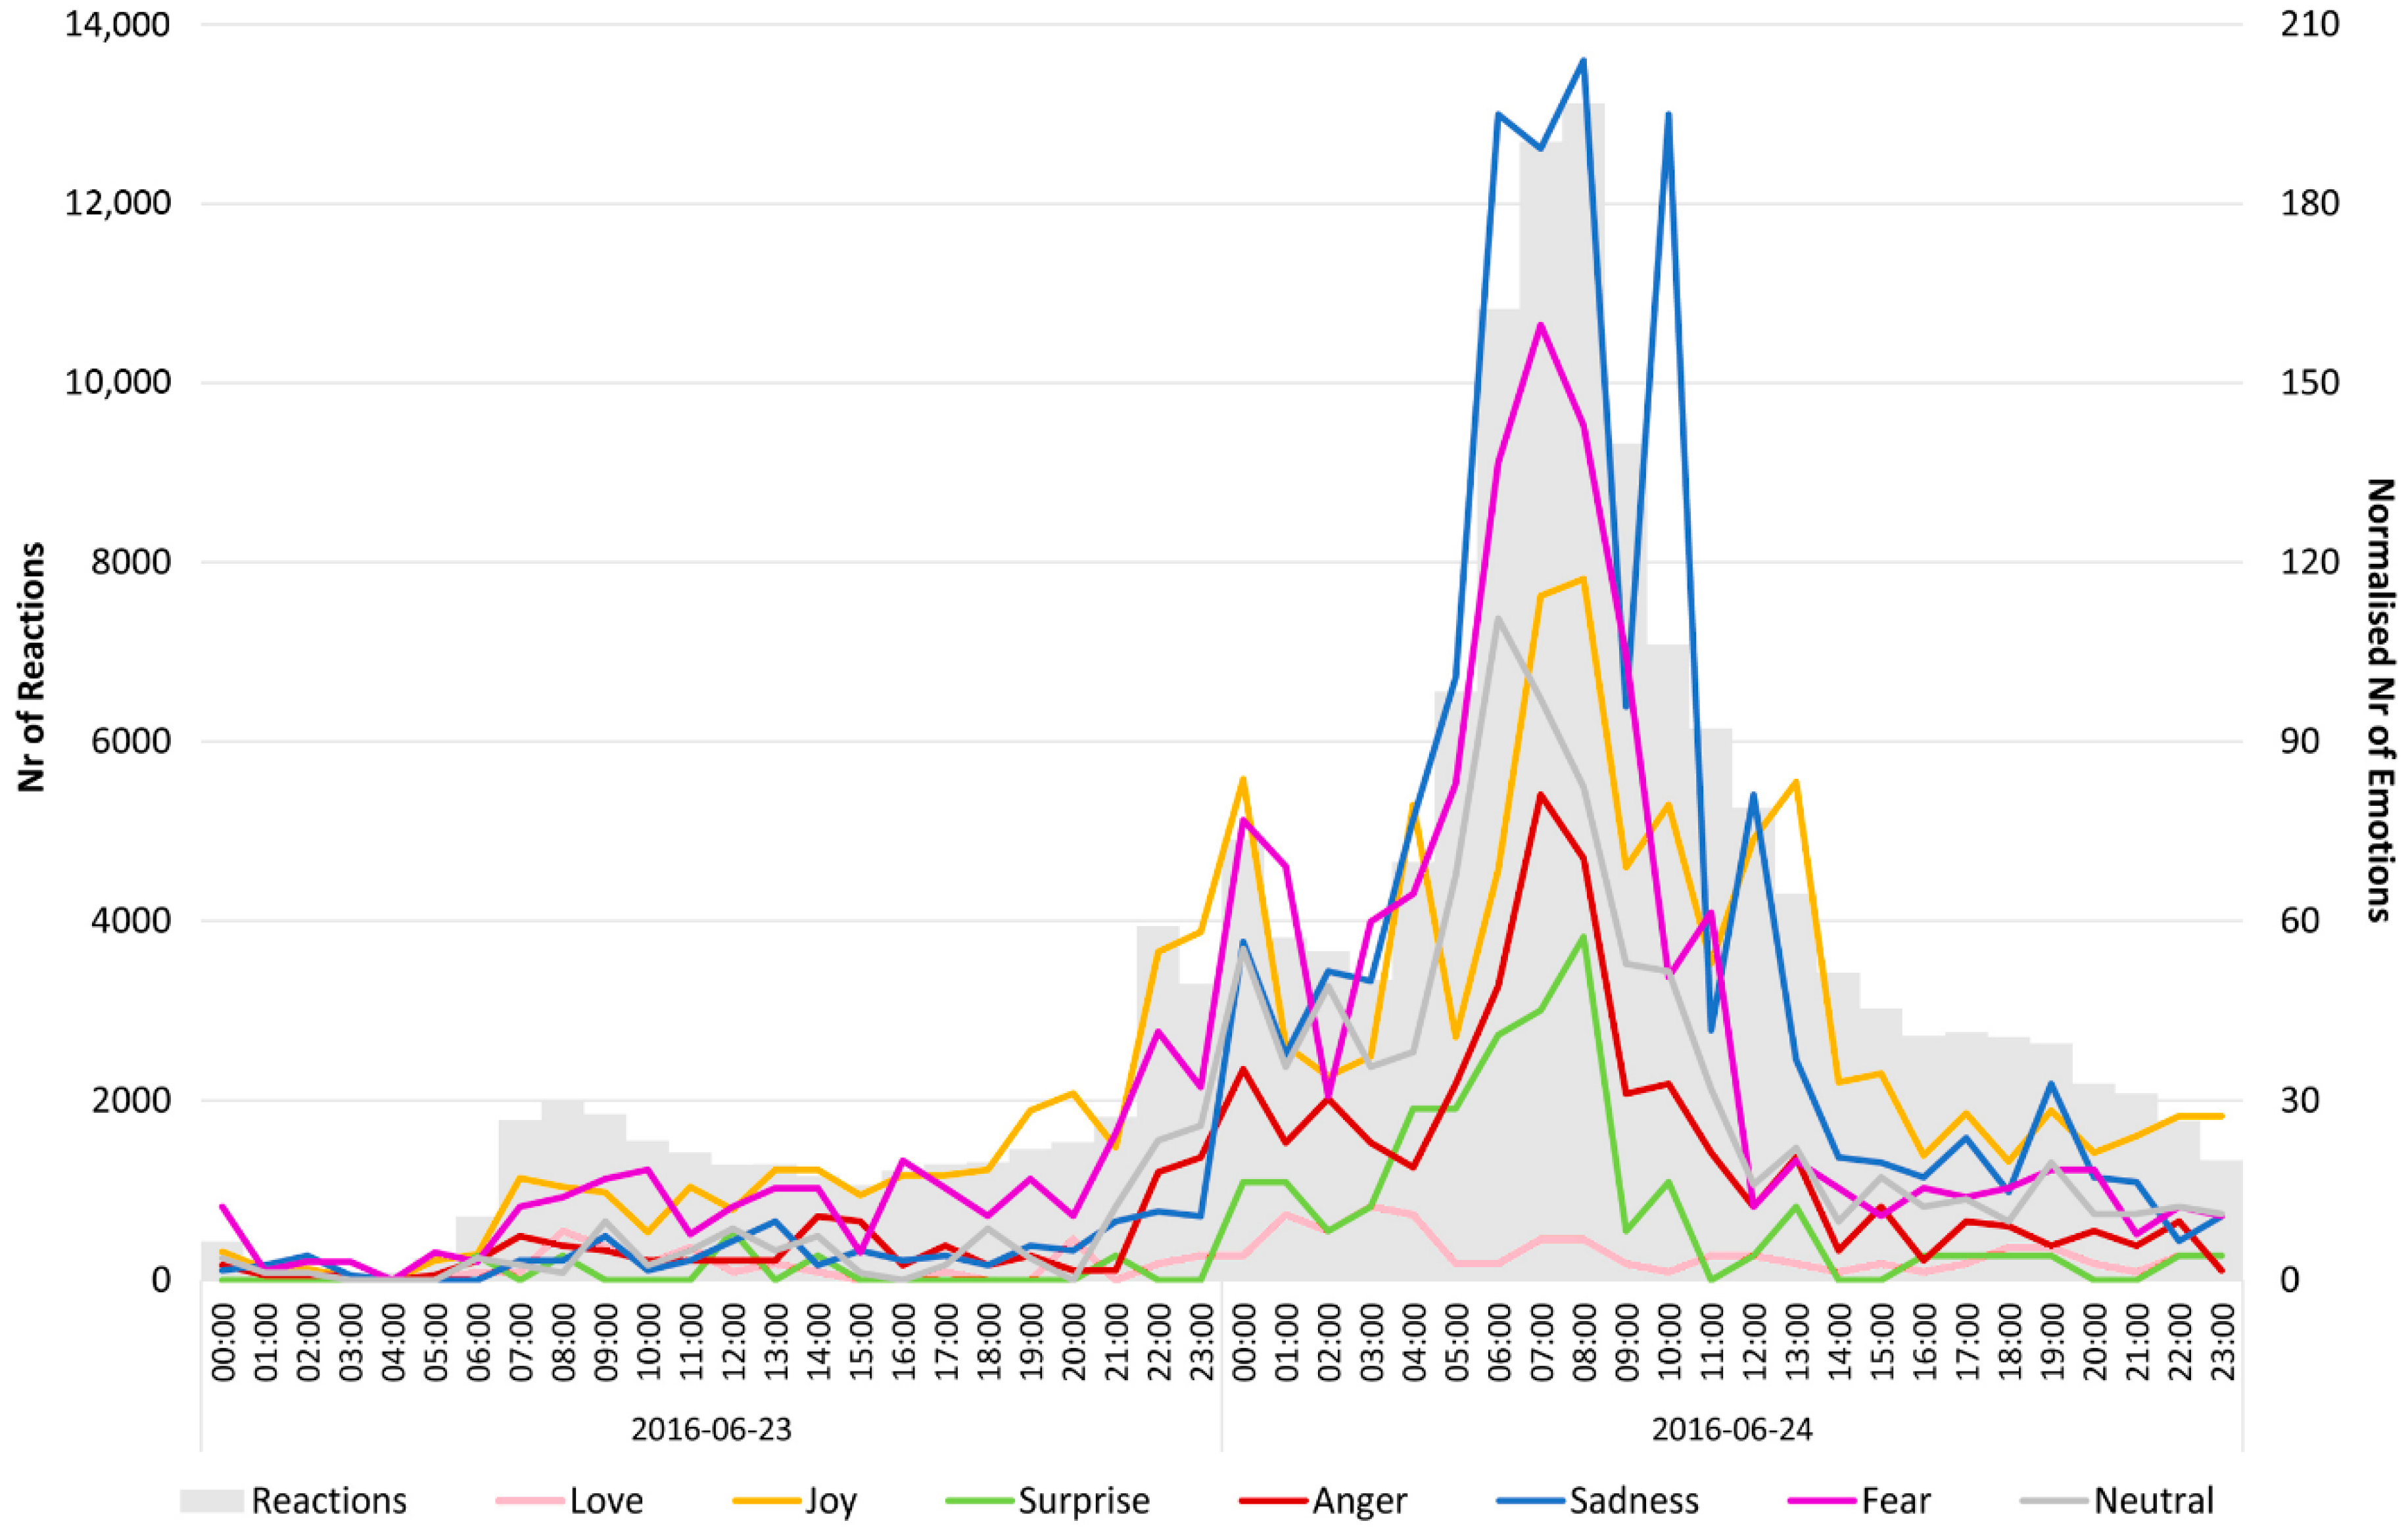
4.2.1. Time
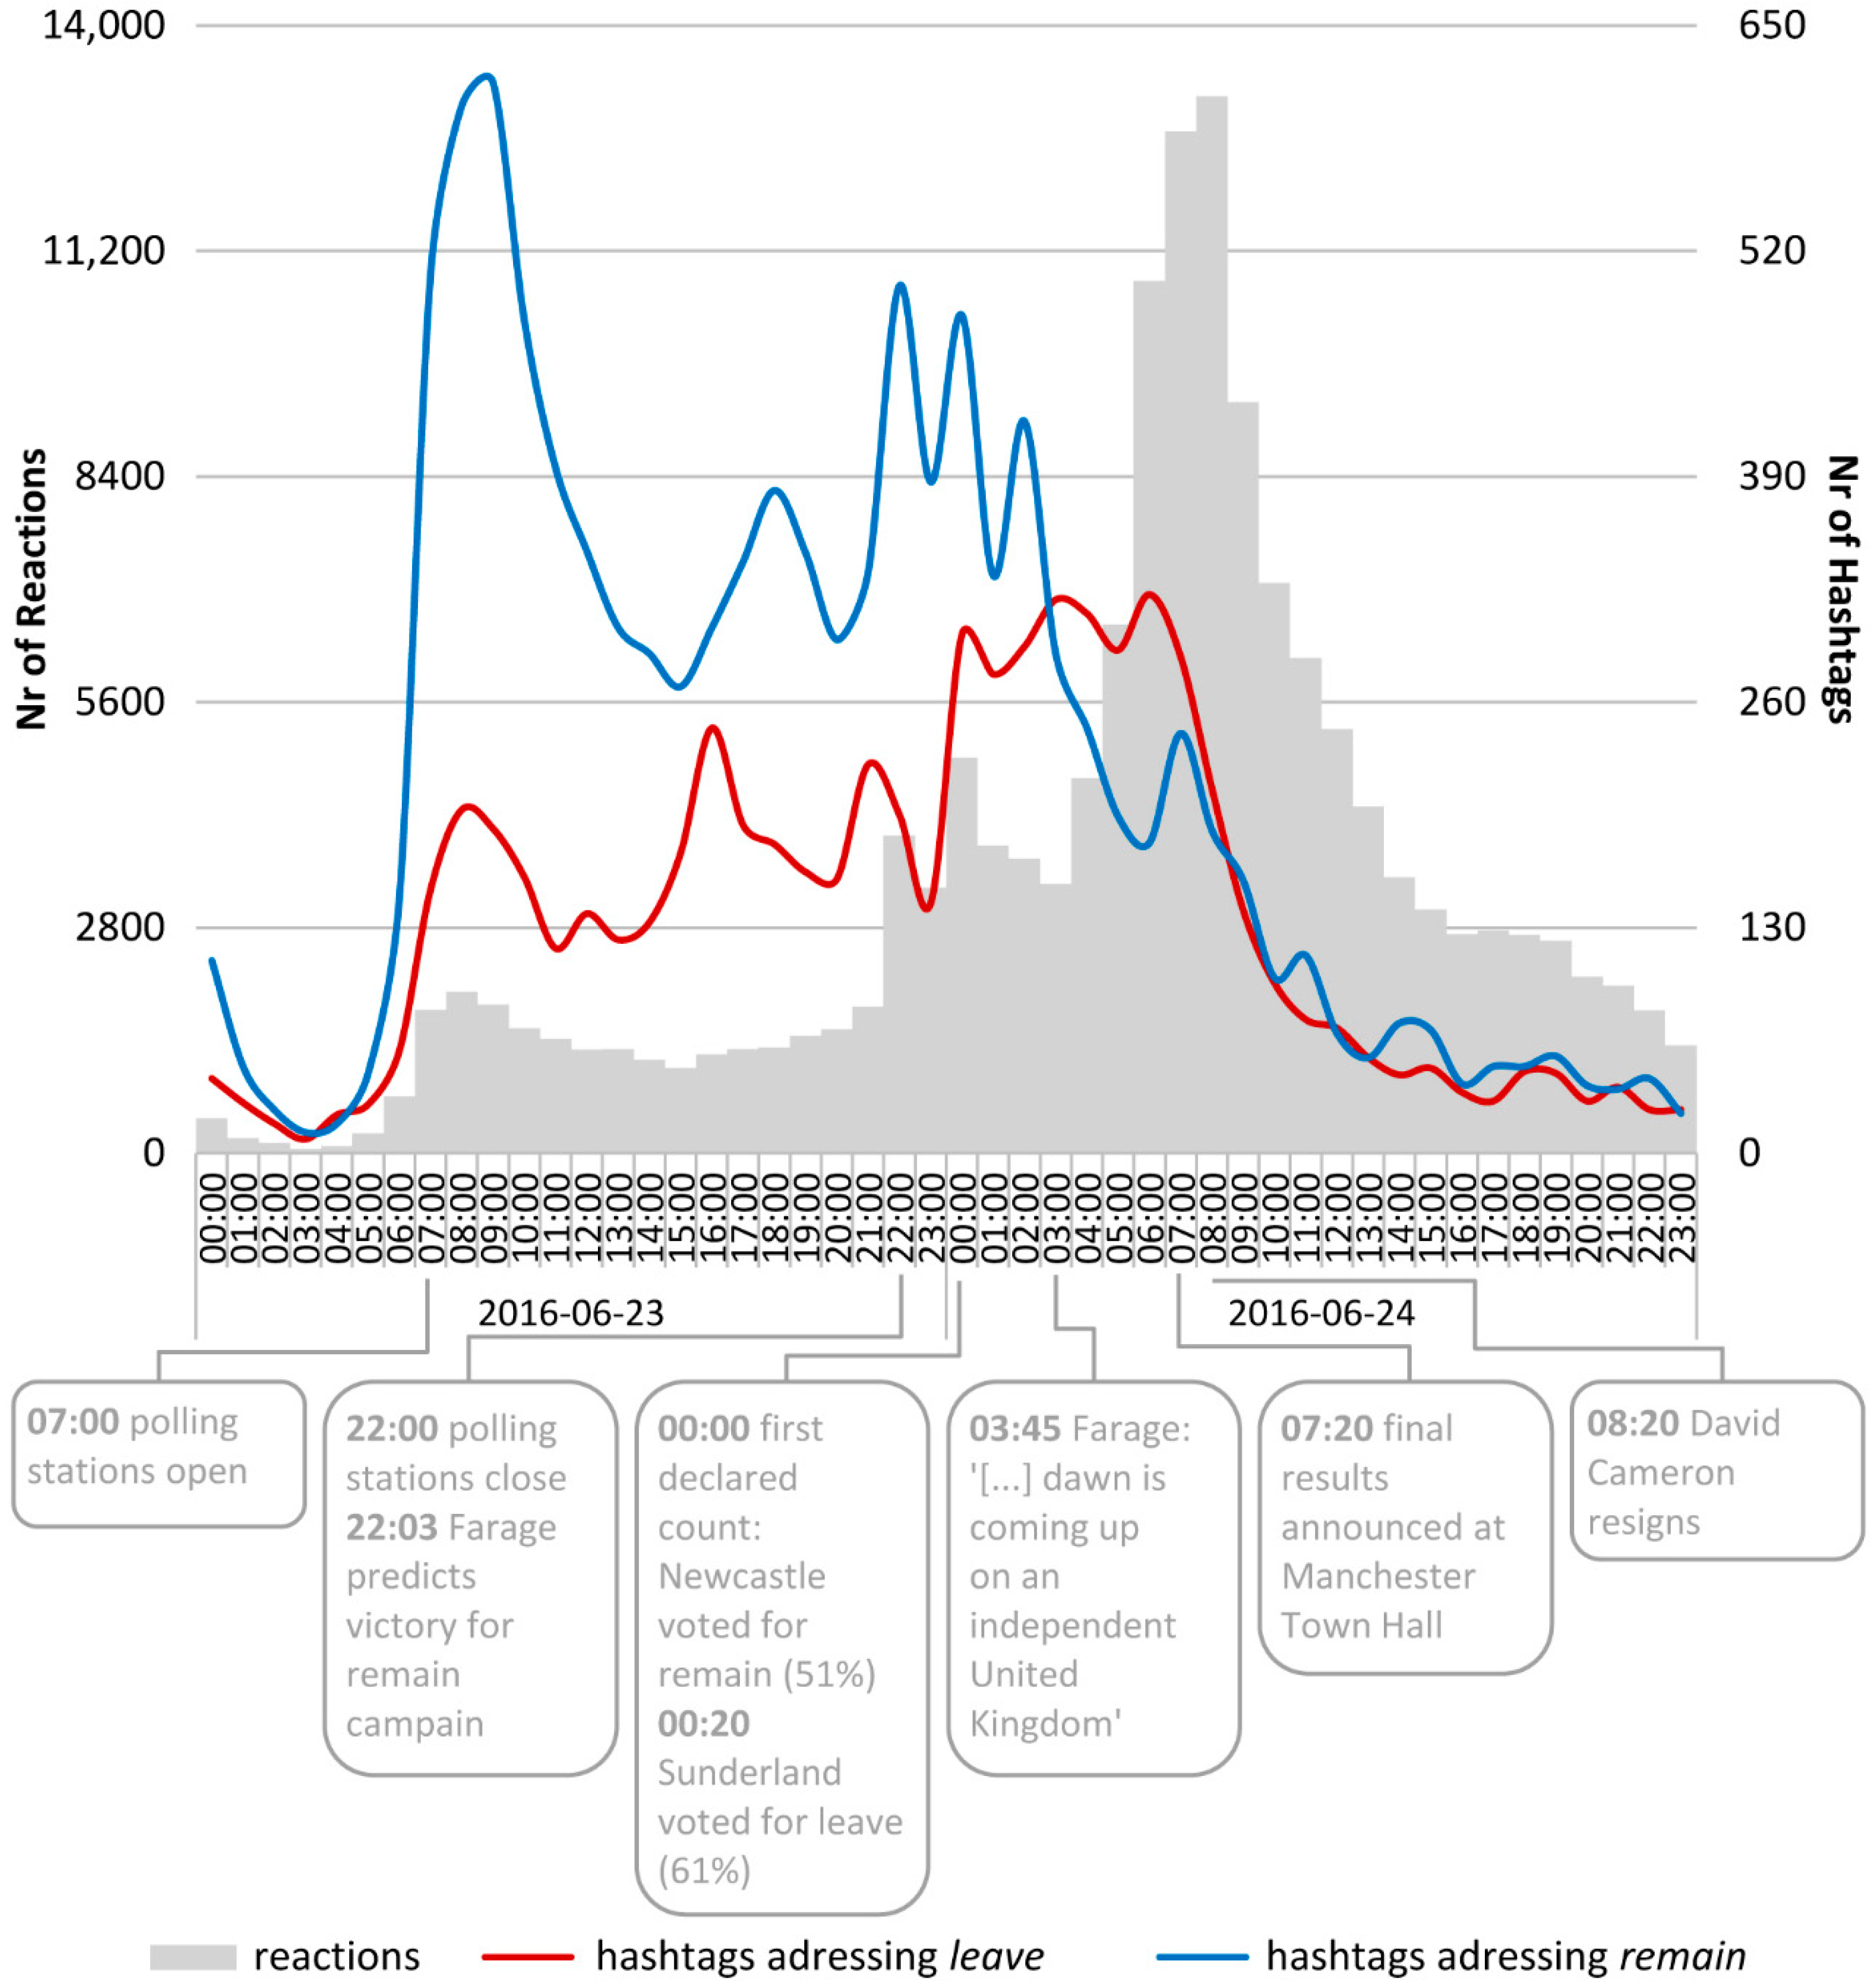
Focusing on the amount of reactions per hour on the day of the referendum and on the day after, i.e., on another granularity of time, allows the recognition of further sub-events of the superordinate Brexit event that are indicated by peaks (the grey bars in
Figure 3). These sub-events are the opening of the polling stations at 07:00 on the day of the referendum and their closing at approximately the same time when Nigel Farage predicted the victory of the
remain campaign, the first declared counts at midnight, the announcement of the final referendum results at 07:20 on the next day, and the resignation of David Cameron one hour later.
4.2.2. Topic
Reactions to Brexit can address different topics within the entire Brexit debate, for instance, leaving the EU or remaining in the EU, which is indicated by the use of certain hashtags. Most of these hashtags were established by different interest groups that were deployed before the referendum to fight for or against EU withdrawal. From all hashtags with more than 100 occurrences in the used dataset, the hashtags that addressed one of these two topics (
leave or
remain) were manually selected and assigned.
Table 2 provides an overview of these hashtags, which are sorted in descending order by their frequency.
Topic modelling was not chosen as a method because the topics to be studied are already known. The hashtag-based formation of these two topics are evident since the hashtags that are used for this (see
Table 2) express and formulate one of the topics. Furthermore, hashtag- and keyword-based filtering is a common and useful approach for data selection [
60,
61].
The following semantic analysis, which distinguishes leave and remain, is rather superficial thus far since it has not yet been considered whether a tweet is a positive or negative reaction to leave or remain; only the addressed topic of a tweet is regarded. This means that it is ignored if the tweet supports or rejects the respective topic.
In total, 19,932
leave-related hashtags are contained in 18,291 tweets, and 27,497
remain-related hashtags are contained in 24,136 tweets; the diversity (see
Table 2) and the total number of
remain-related hashtags and the number of tweets that they occur in is higher. Thus, in total, 47,429 of these hashtags are contained in 38,787 tweets within the dataset and can be used for subdividing the reactions into addressing
leave or
remain. However, it is possible that one tweet contains hashtags of both groups and thus refers to both
leave and
remain, and it was thus counted in both topic categories. This subdivision allows a temporal-thematic reflection of the reactions to Brexit on 23 and 24 June 2016 (the red and blue lines in
Figure 3).
The reactions that relate to
remain prevail until 03:00 on 24 June 2016. This seems to be the moment when it became clear that the majority of people in the UK voted for
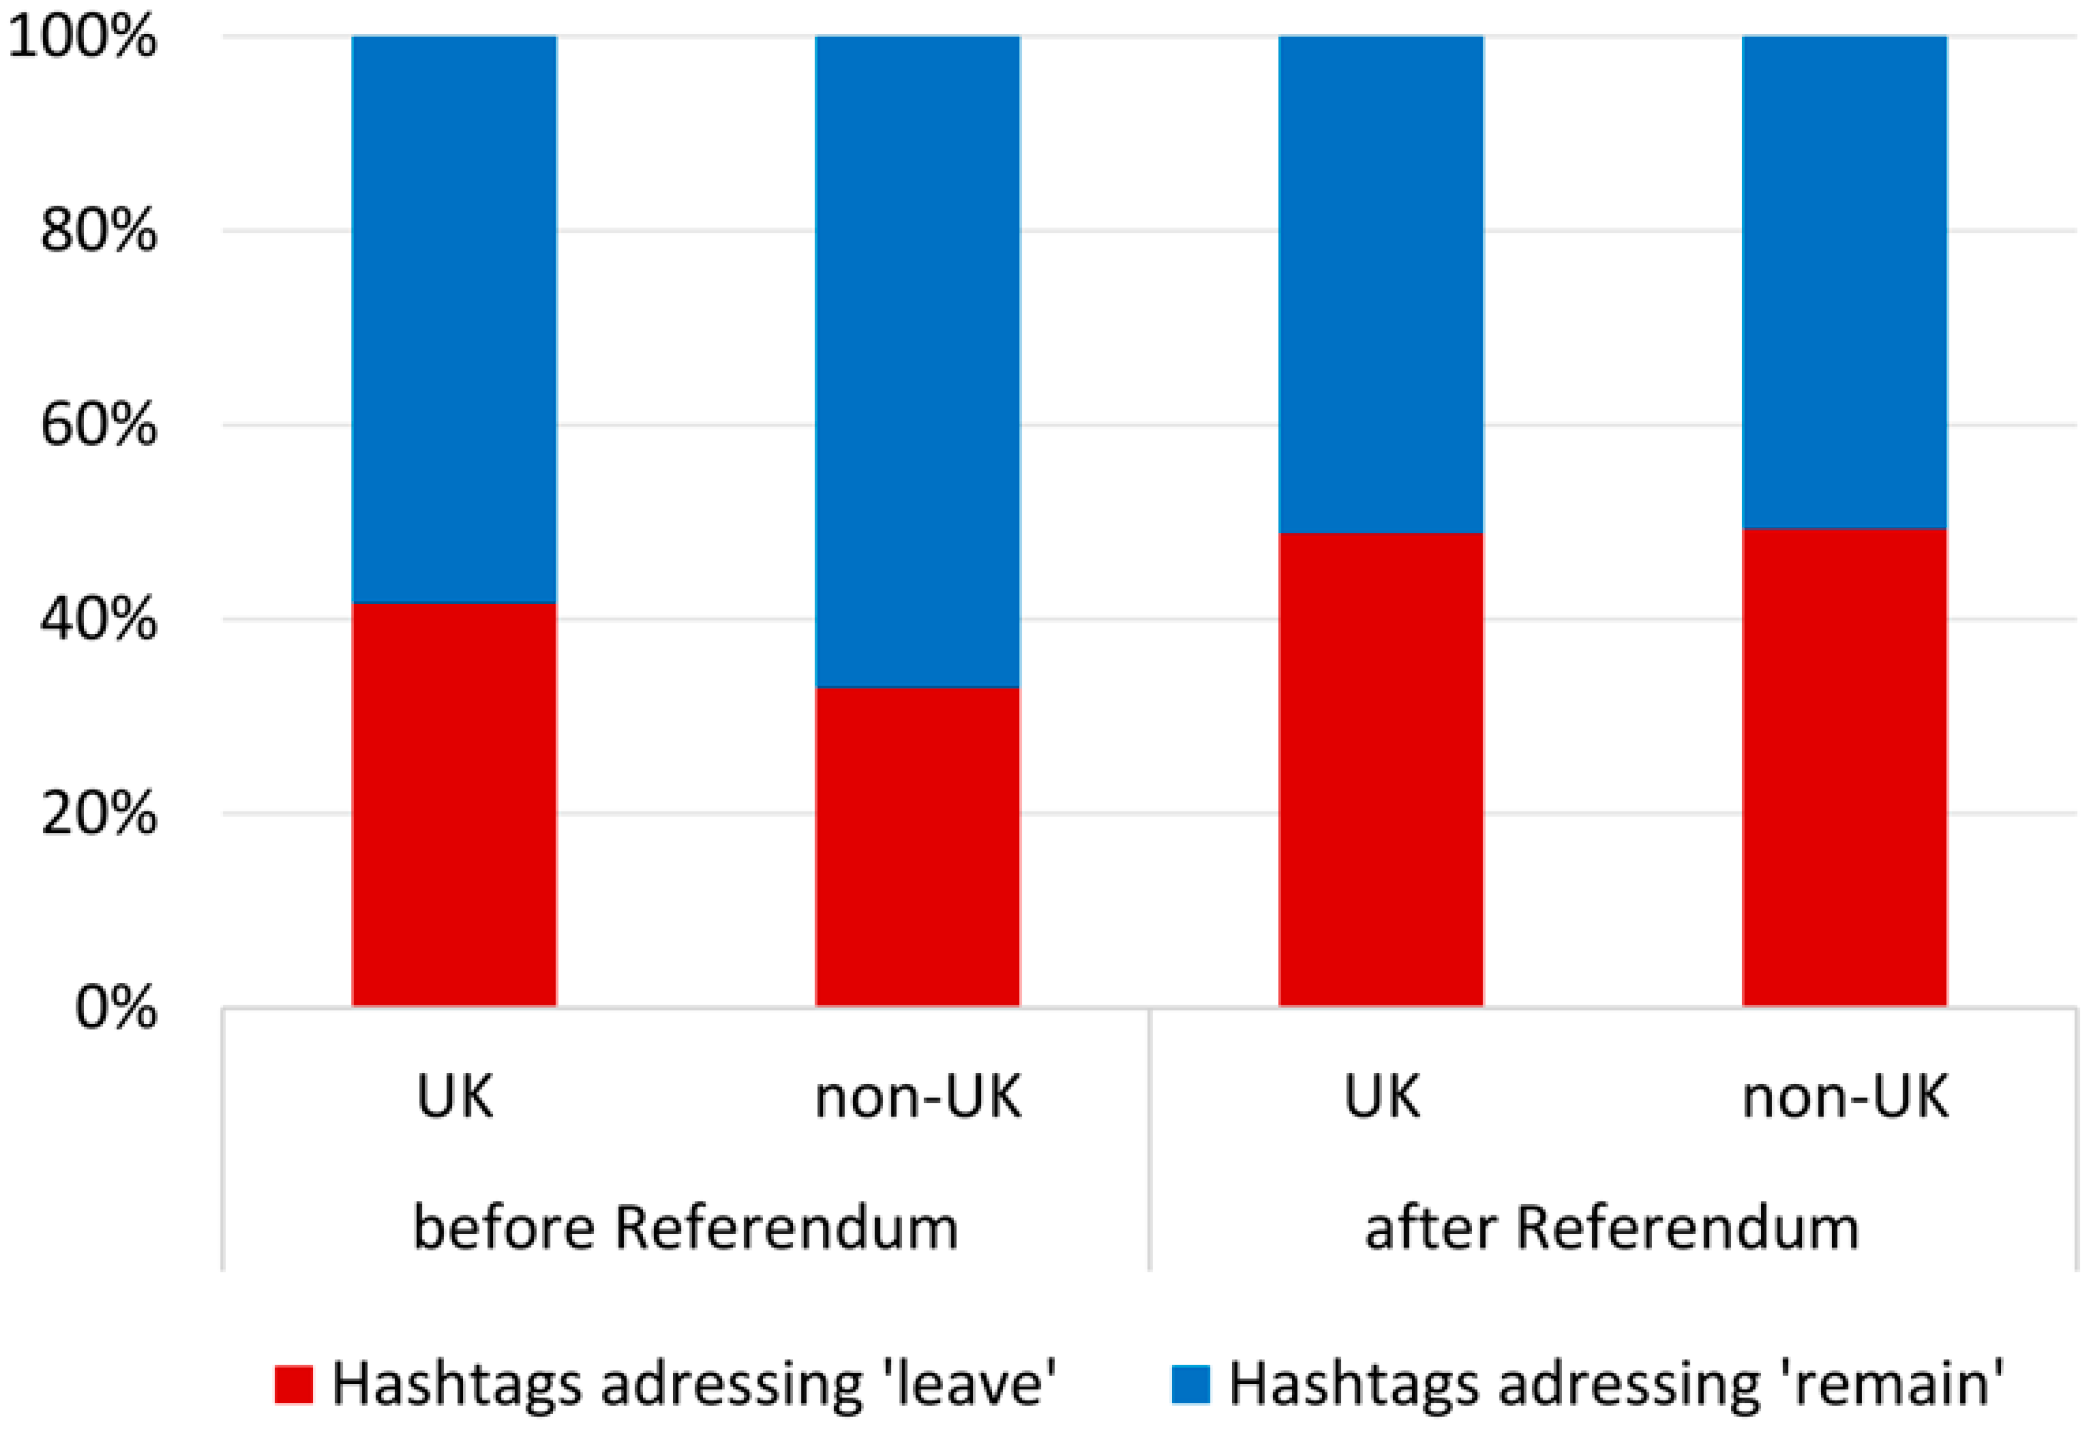
leave, which is emphasized by Nigel Farage, who tweeted at 03:45 that “I now dare to dream that the dawn is coming up on an independent United Kingdom”. Thus, attention was increasingly shifting to the EU withdrawal. The percentages of hashtags that address
leave and
remain do not differ between the UK and the rest of Europe after the referendum (see
Figure 4), but before, the
remain prevalence is higher outside the UK than within the UK.
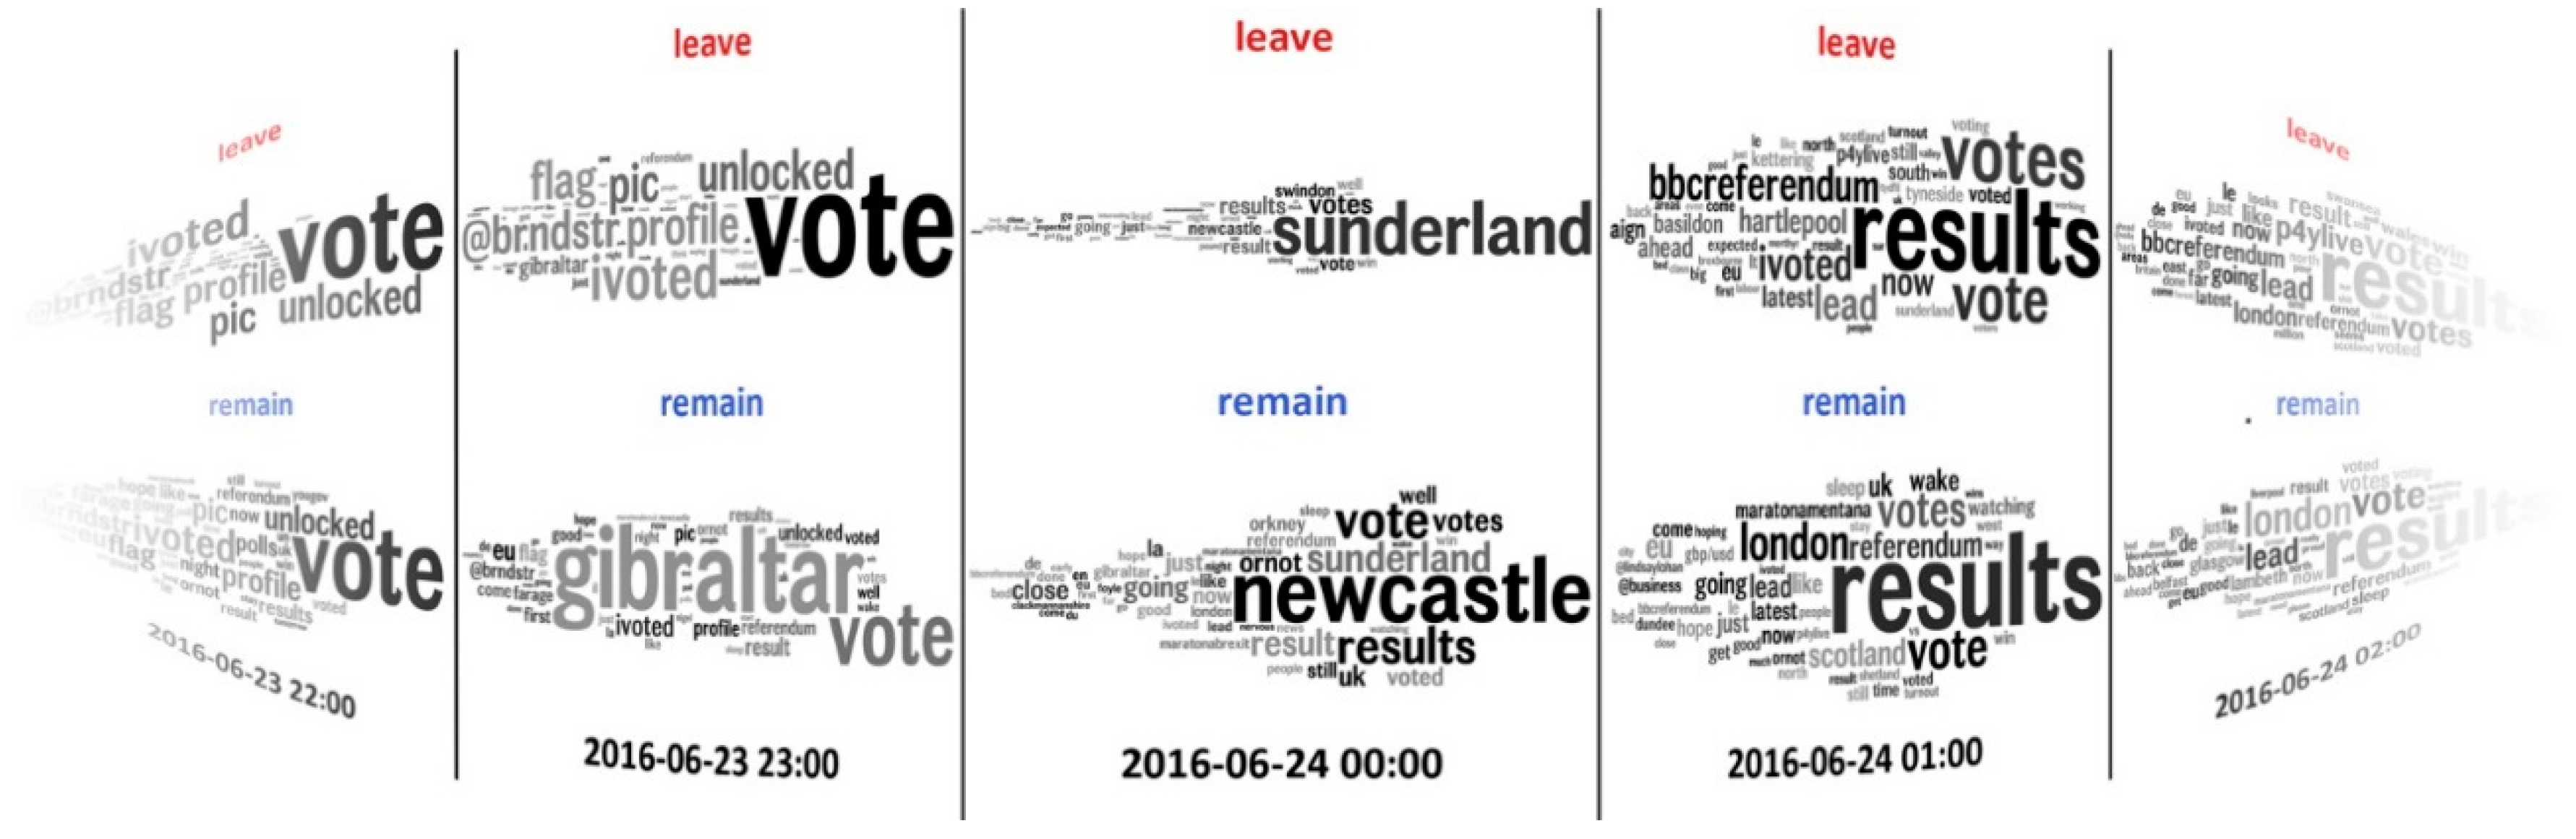
Word clouds created from tweets distinguished into
leave- and
remain-related for a one-hour-timeframe can provide further information on the semantics of the reaction, i.e., on what happened in this hour. For example,
Figure 5 focuses on the first hour of 24 June 2016, when the first counts were declared.
Sunderland appears to be mainly in the
leave-related reactions and
Newcastle appears to be in the
remain-related reactions, which corresponds to the referendum results of the respective borough. For each word cloud,
brexit,
euref, and all
leave- or
remain-related hashtags (from
Table 2) are filtered out.
4.2.3. Space and Sentiment
Reactions to Brexit can semantically be further broken down by whether they address
leave or
remain in a positive or negative way—thus, they represent the sentiment towards the respective matter. The previously described binary sentiment approach (positive/negative) that utilizes the co-occurrence of hashtags and emojis (see
Section 3.1) will be applied to
leave- and
remain-related reactions to study this attitudinal viewpoint and rather subjective side of reactions.
Therefore, the emojis of the Unicode sub-categories of ‘face-positive’ and ‘face-negative’ (13,282 positive and 6859 negative faces are contained in the dataset) were combined with the hashtags from
Table 2. A positive reaction to
leave and a negative reaction to
remain indicates a support of Brexit, whereas a negative reaction to
leave and a positive reaction to
remain designates a rejection of the EU withdrawal. Accordingly, 837 Brexit-supporting and 785 Brexit-rejecting reactions could be distinguished in the used dataset. Since more filtering is applied, the available data are thinned out.
Including the spatial component into this consideration allows a comparison of the results of the EU referendum and prior reactions on Twitter within space. In advance,
Table 3 provides basic statistics for each NUTS1 region, which is the highest level of geocode standard for the subdivisions of countries. Although 832 voting areas exist in the UK, the coarser subdivision NUTS1 was used because tweets were not available in all of these 832 voting areas; even in NUTS1 regions, the
leave-supporting and -rejecting reactions are few in number. For all regions, the average numbers of tweets per user range between 3.1 and 3.9 and therefore correspond to the average value of 3.5 for the entire dataset.
Table 4 lists the referendum results and the prior reactions on Twitter for each NUTS1 region. A red number indicates that a region voted for
leave in the referendum (second column) or that the
leave-supporting reactions on Twitter are prevailing in a region (third column), whereas a blue number indicates a rejection of
leave. The discrepancy in the fourth column of
Table 4 presents the absolute value of the difference between the two previous columns. The consistency in the last column states if the overall referendum result and the prevailing reactions on Twitter (
leave support or rejection) for each region are consistent or not. The last table line shows that the referendum outcome is close to the percentage of
leave-supporting reactions that were expressed on Twitter, and a consistency could be reached for 75% of all NUTS1 regions.
Excluding emojis, i.e., the sentiment of reactions, from this spatial consideration and regarding only if
leave or
remain is the dominating topic in each NUTS1 statistical region of the UK (based on the assumption that the percentage of
leave-related reactions is especially high in regions voting for
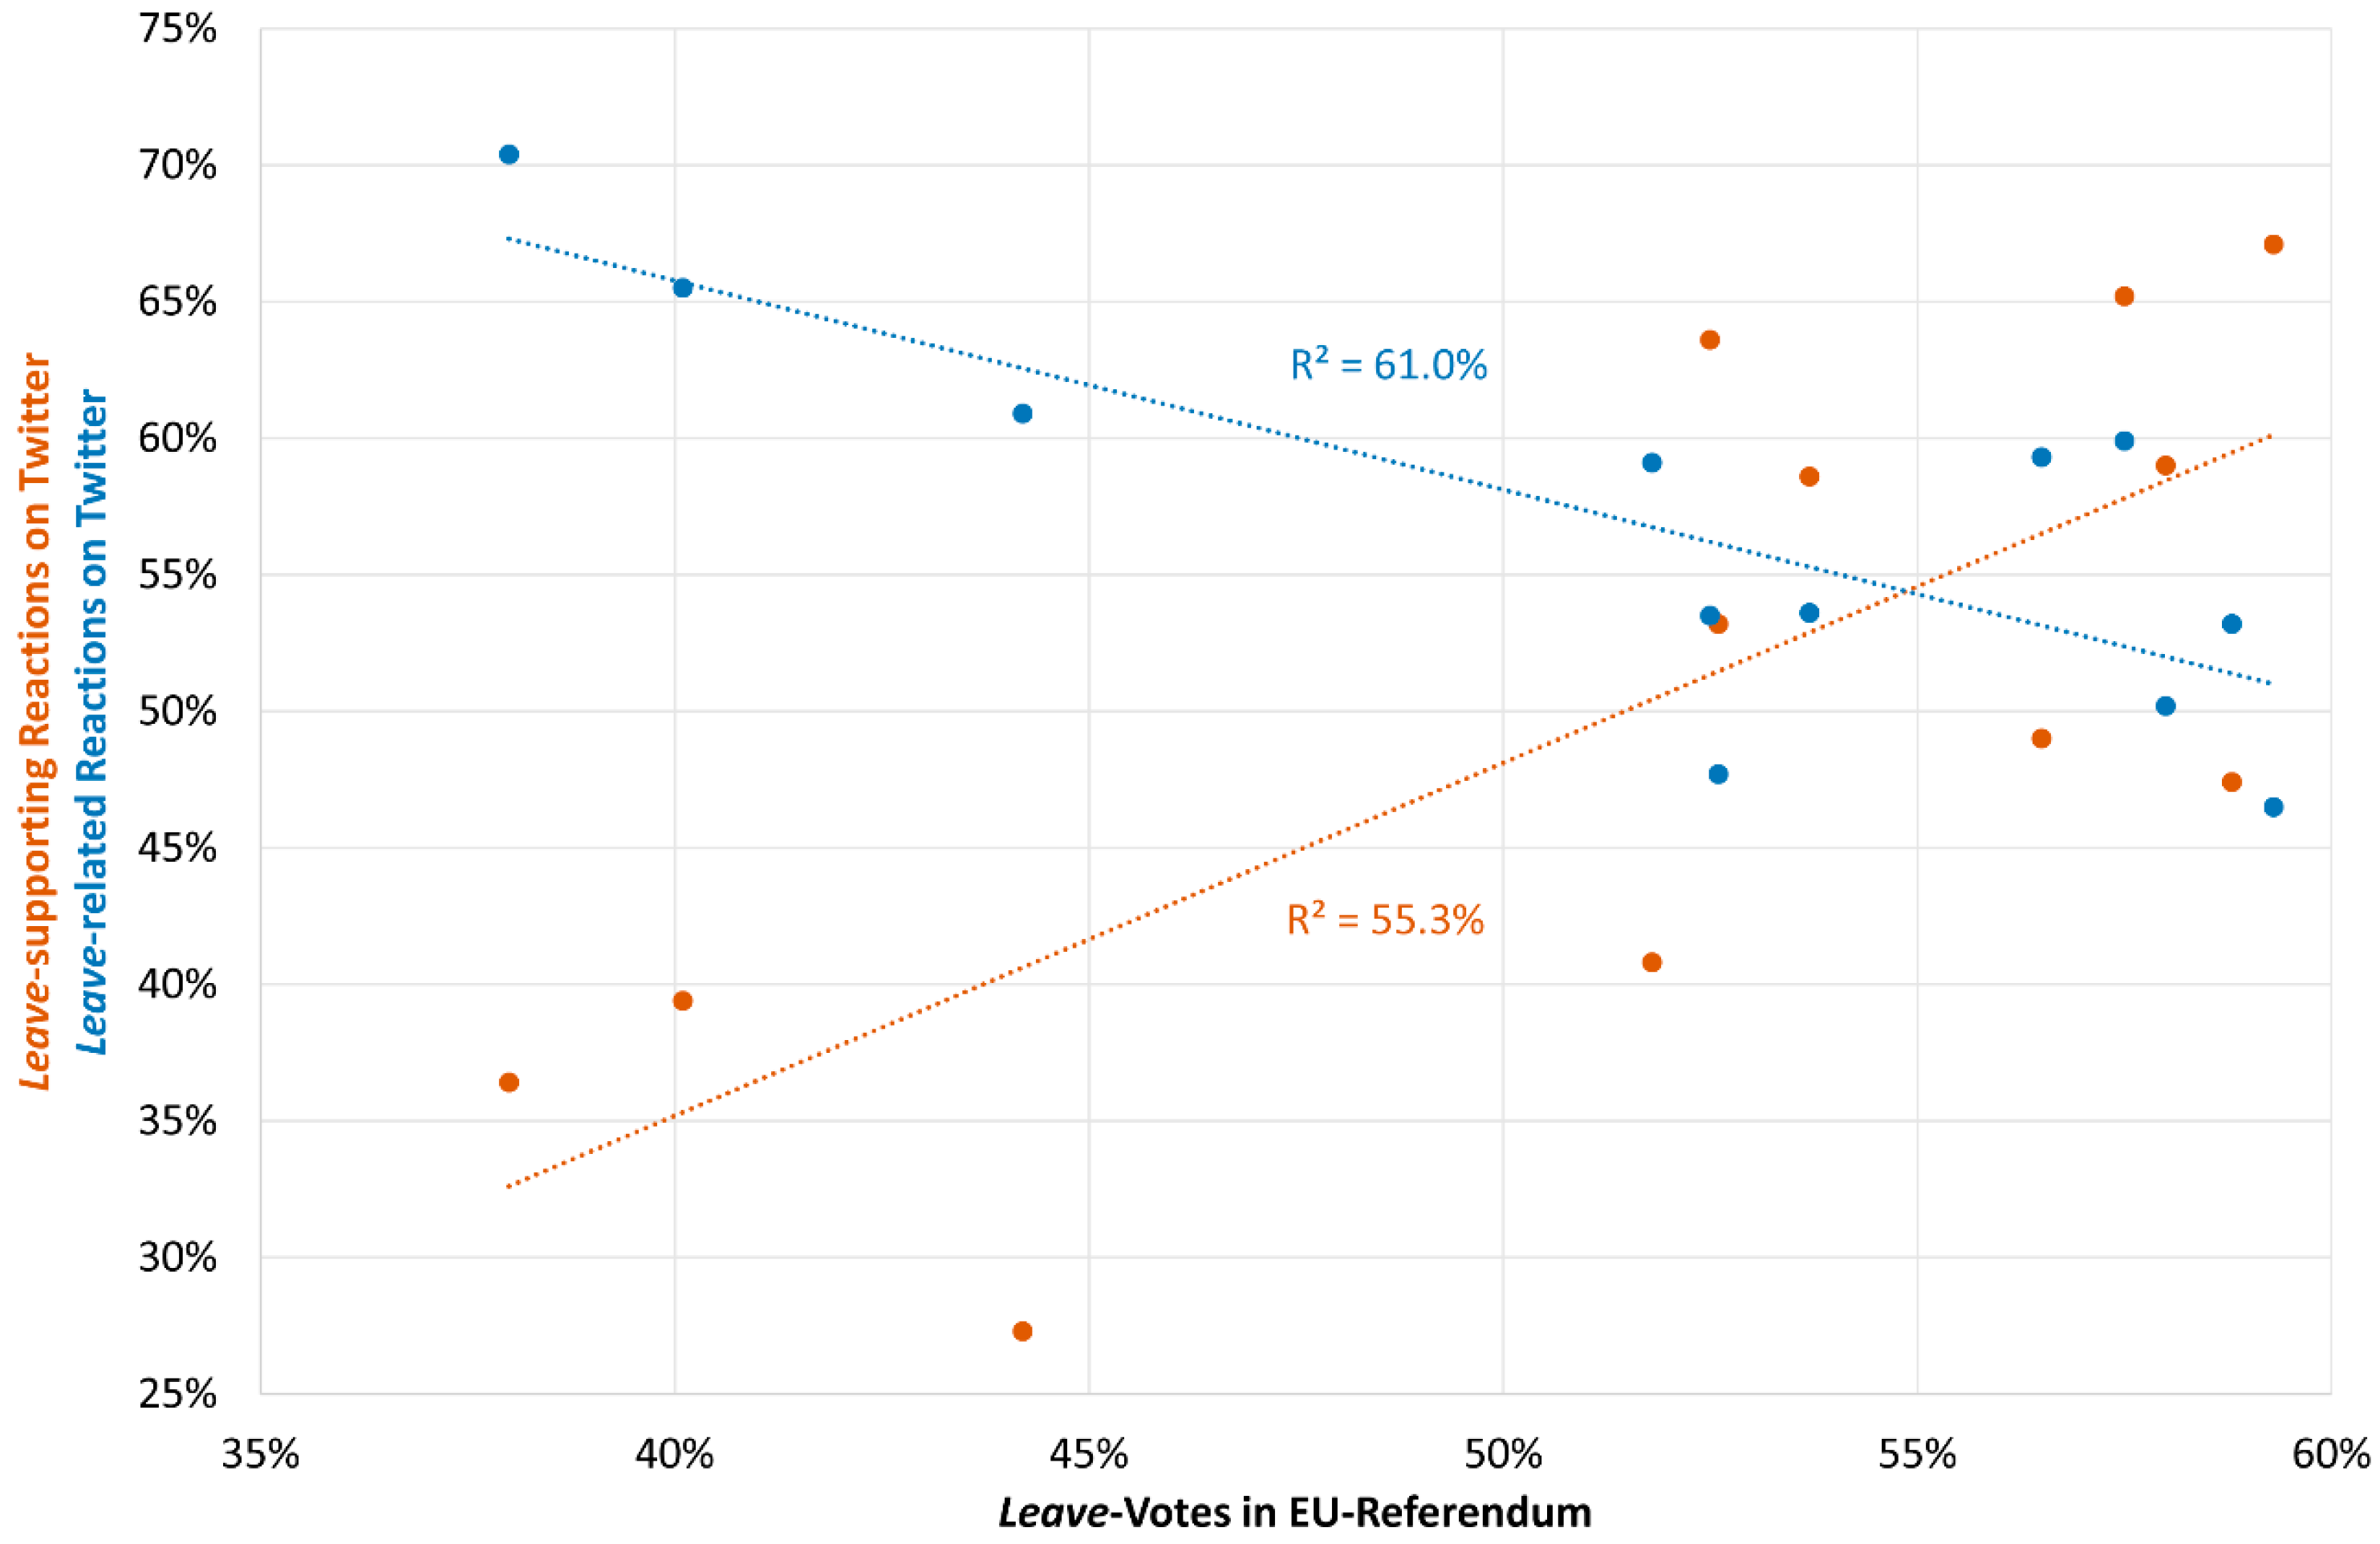
leave) provides a result that reflects the real referendum results not so well: the mean discrepancy is higher, with 9.9%, and a consistency can be reached for only seven out of 12 regions. Thus, a spatial examination of the reactions including emojis gives results that are closer to the referendum outcome than without emojis. This finding is underlined by
Figure 6, which shows an XY plot of both methods including the trend lines and the coefficients of correlation (r) and determination (R
2). Although R
2 is higher for the pure hashtag-based analysis, the respective trend line is descending, which means that the correlation is negative (r = −78%). This result illustrates that this method mirrors the referendum results worse than the applied sentiment analysis (with a positive correlation r of 74% and a relatively high R
2 of 55%).
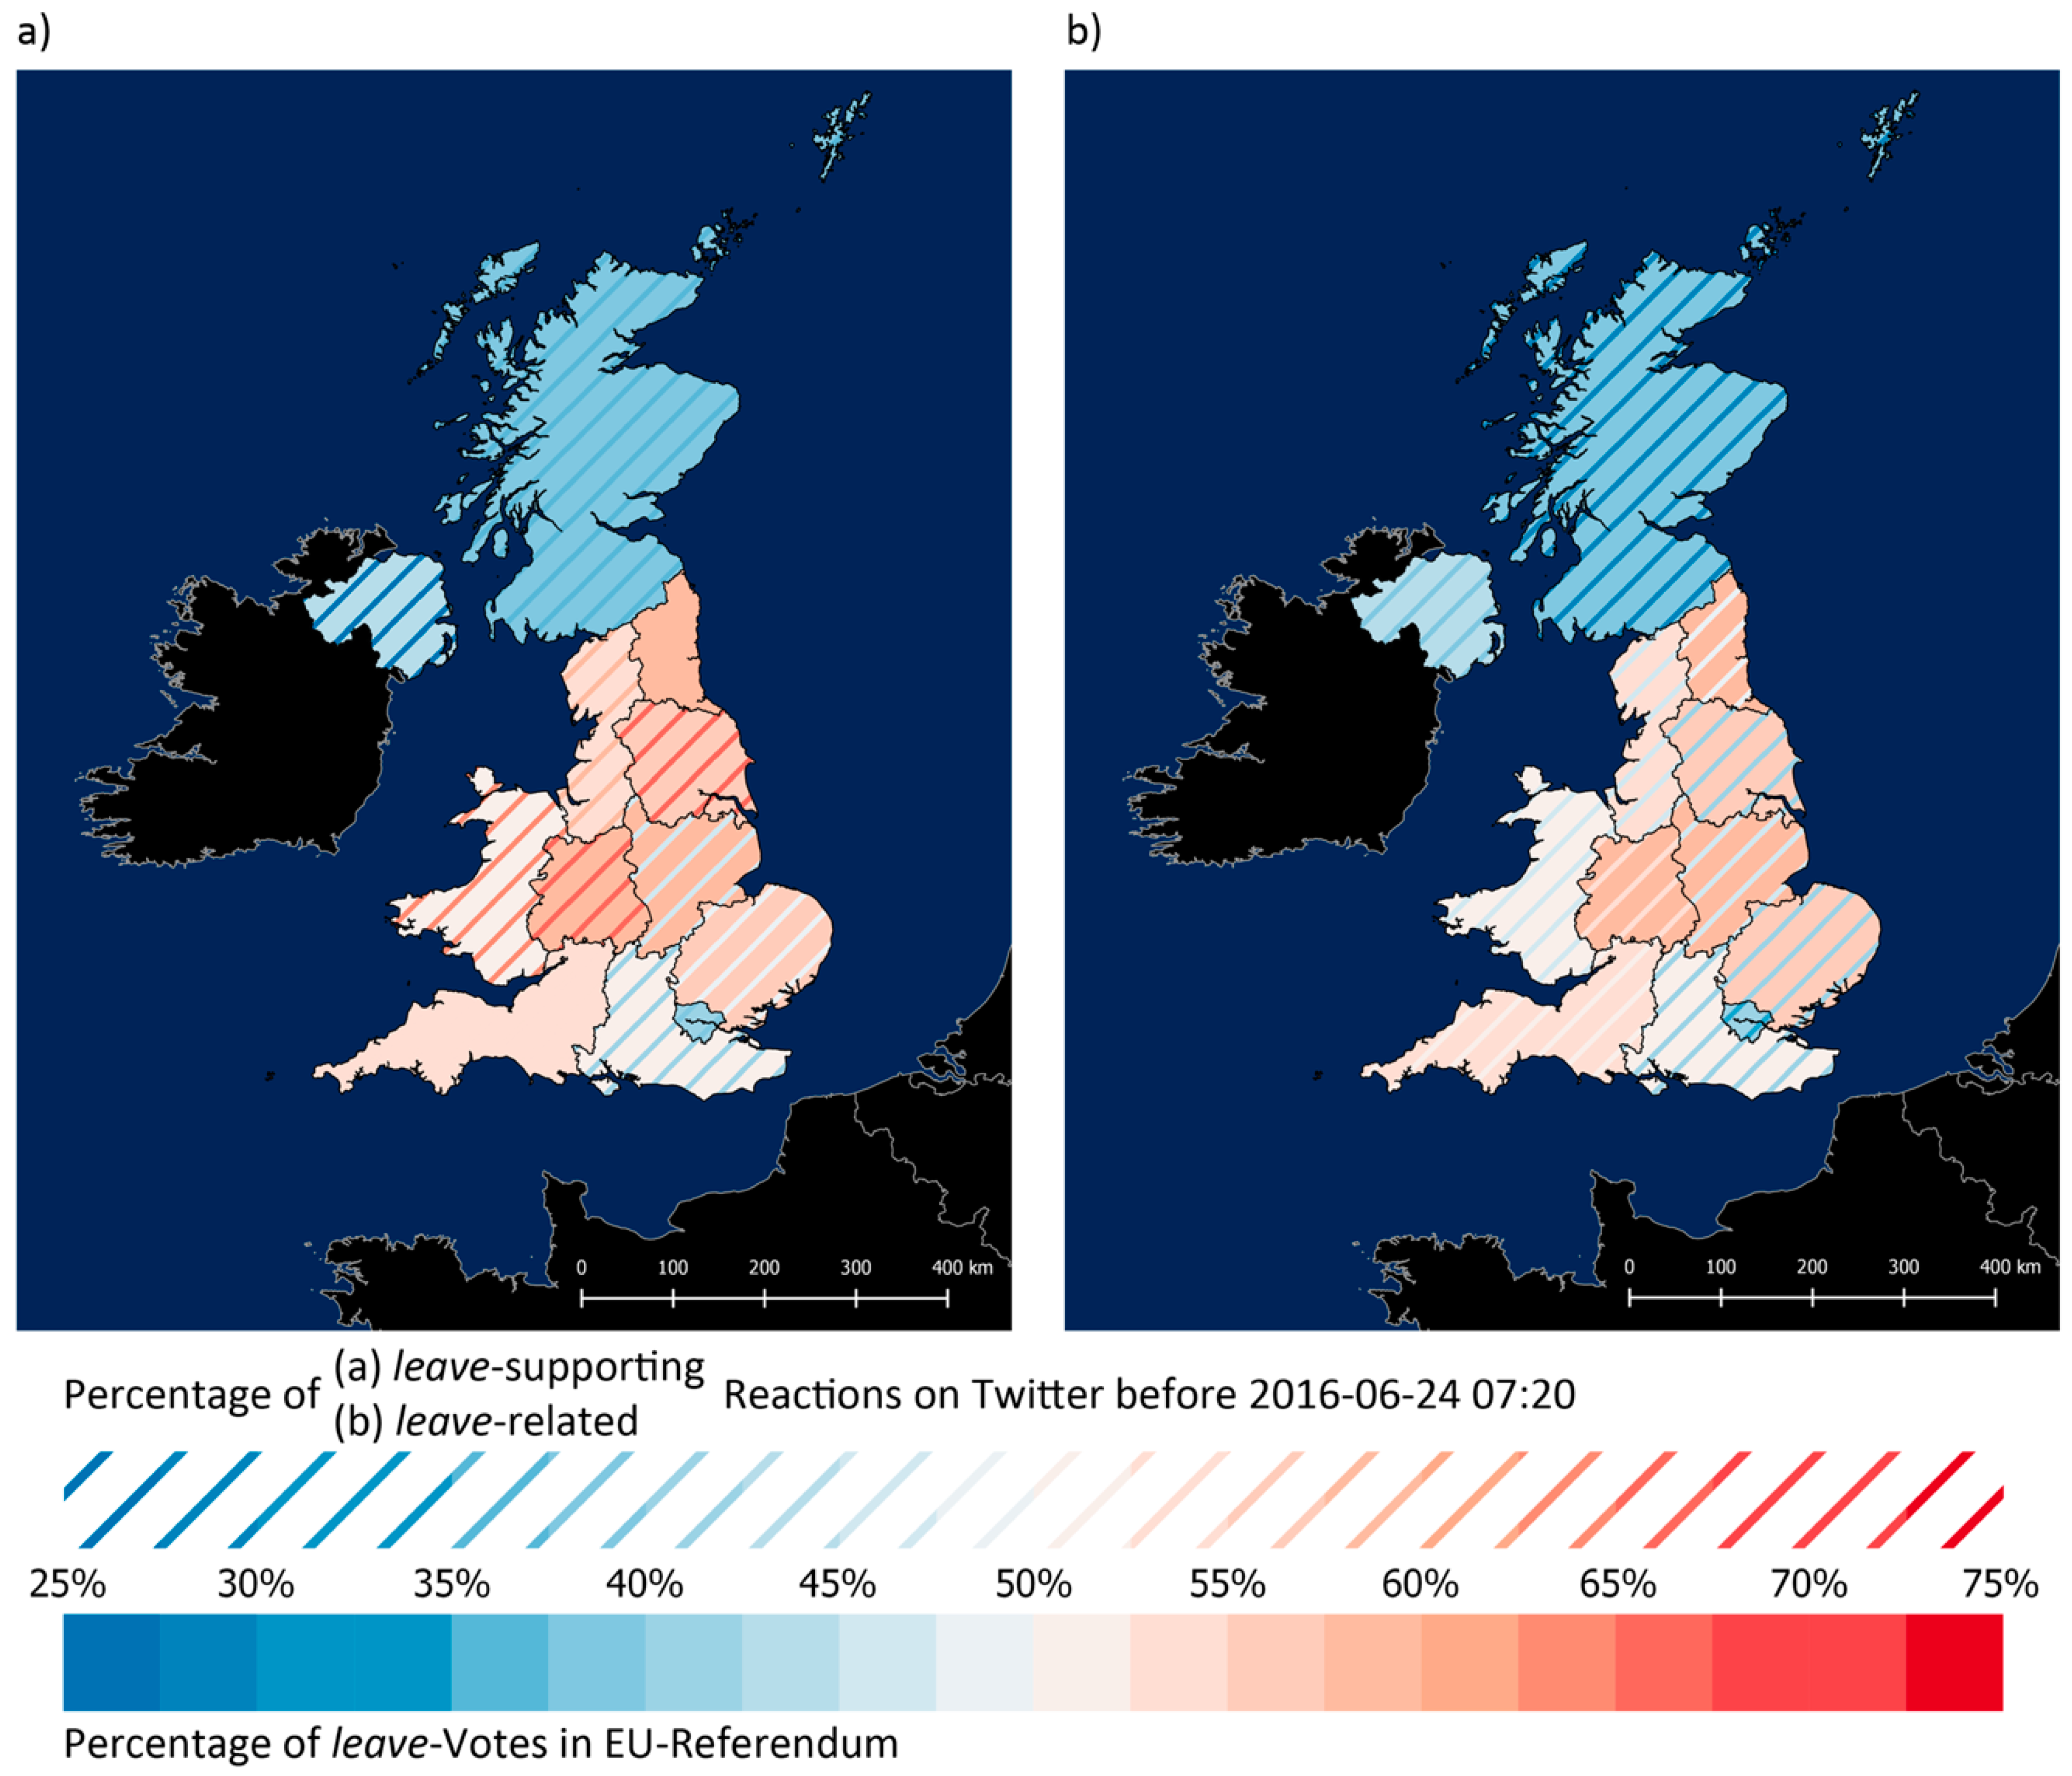
Figure 7 visualizes these analyses in the form of maps. In both maps, the percentage of
leave votes for each NUTS1 region is represented by choropleth mapping. The superimposed hachured choropleth mapping represents the percentage of
leave-supporting reactions in
Figure 7a (i.e., including sentiment) and the percentage of
leave-related reactions in
Figure 7b (i.e., excluding sentiment). All of these reactions were tweeted before 2016-06-24 07:20. If no hachures are visible, they have the same color as the background.
Compared to
Figure 7b, the higher consistency in
Figure 7a is visible since more red hachures on a red background and blue hachures on a blue background appear in this map. In
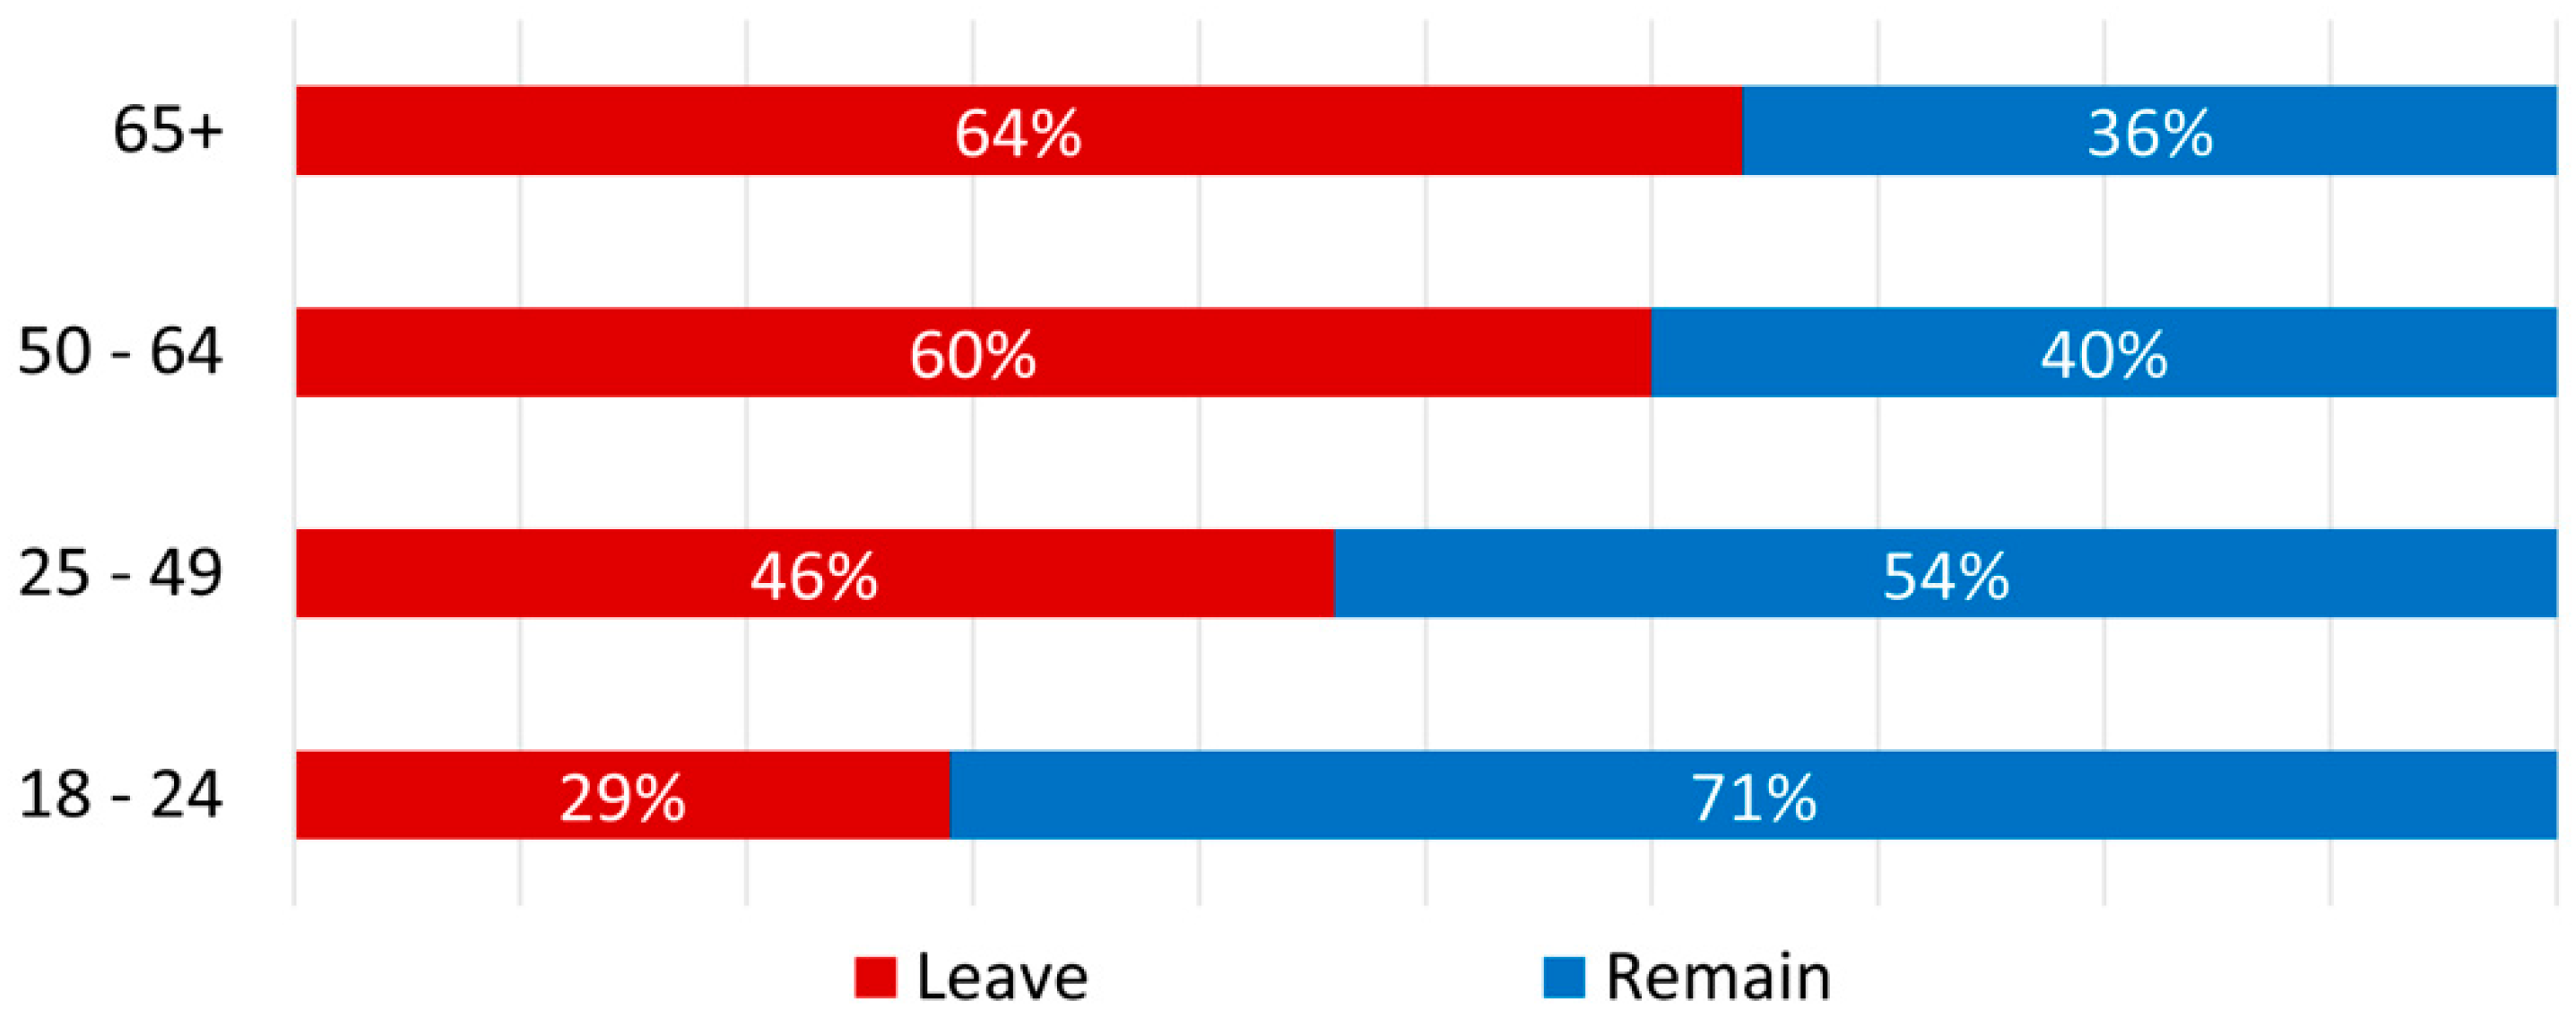
Figure 7a, the only three regions for which the referendum results do not correspond to the mainly beforehand expressed reactions on Twitter are the three regions around London in the southeast of England, which is probably no coincidence. Especially London is a very young area in the UK: the median age is 34.6 years, whereas the median age for the entire nation was 40.0 years in mid-2015 (
https://www.ons.gov.uk/). As British Twitter users are relatively young (67.5% of all users are aged between 16 and 22 years [
62]), the reactions are likely to be biased by this age group. According to different statistics, for example, statistics by YouGov (a market research and data analytics firm headquartered in London) that are shown in
Figure 8, the majority of people under the age of 50 years voted against the EU withdrawal. These facts suggest that the Brexit-rejecting reactions around and from London were tweeted from young elite people who live there or commute to London (which is the region that voted against Brexit with the highest percentage (see
Table 4)). Furthermore, the higher diversity and the higher number of
remain-related hashtags are another indicator that younger people with their respective opinions are in general overrepresented in the dataset as the typical Twitter user group. Nevertheless, in addition to the demographics of twitter usage, the dynamics of self-representation on social media might be another reason for the discrepancies between the referendum results and the reactions on Twitter.
4.2.4. Time and Emotions
Before applying the second described approach for affect analysis with the help of emojis (see
Section 3.2), a weighting factor is calculated for each of the seven emotional categories since the category joy is otherwise overrepresented in the data: 0.143 (= 1/7, which is the reciprocal of the total number of categories) was divided by the percentage amount of each category (see
Table 1). In the following analyses, the derived weighting factors are multiplied by the number of emotions contained in the Brexit dataset for normalization purposes.
Overall, 26,580 emotions in 16,546 tweets are contained in the used dataset (17,745 emotions in 11,397 tweets from the UK). Hereafter, as tweets can have multiple emojis, the number of emotions is regarded, not the number of tweets holding emotions. The percentages of the seven emotional categories (after including the mentioned weighting factors) and the difference between these percentages prior to and past the announcement of the referendum results are listed in
Table 5.
None of the categories show significant changes, except for sadness, which increases by more than 5%. This growth of sadness after the announcement of the referendum results seems to be plausible as the investigated reactions within the Twitter dataset to a great extent refer to
remain and as the contained
remain-supporting reactions are slightly in the majority. Thus, hopes for remaining in the EU were not confirmed with the announcement of the referendum results, which caused disappointment (belonging to the category of sadness according to [
54]). This causality can be underpinned with a structure of emotions proposed by [
63]. According to this structure, emotions concerning a past event (in this case, the referendum result announcement) or its consequences depend on whether related expectations (hope or fear) are confirmed or disconfirmed, which results in either satisfaction, confirmed fears, relief or, otherwise, disappointment. The increase of sadness with the announcement of the referendum results is also recognizable in the temporal distribution of the seven emotional categories (
Figure 9).
After the referendum, [
64] conducted a study among British citizens. When asked for their emotions concerning the referendum results, 32% answered that they felt like crying. Among voters between 18 and 24 years, 46% had these emotions. Furthermore, the study found that 51% of all voters were angry at people who voted differently, and 46% felt disgusted. It is not evident if anger and disgust were felt by the
leave or
remain voters. Nevertheless, the feeling to cry most likely expresses sadness and disappointment. Therefore, this statement might come from the
remain voters as particularly young people had this emotion, which is the age group that voted largely against the EU withdrawal. This study supports the detected increase of sadness in the Twitter reactions after the announcement of the referendum results, especially since Twitter users are usually young and thus probably
remain voters; their sad reactions are strongly represented in the used dataset.
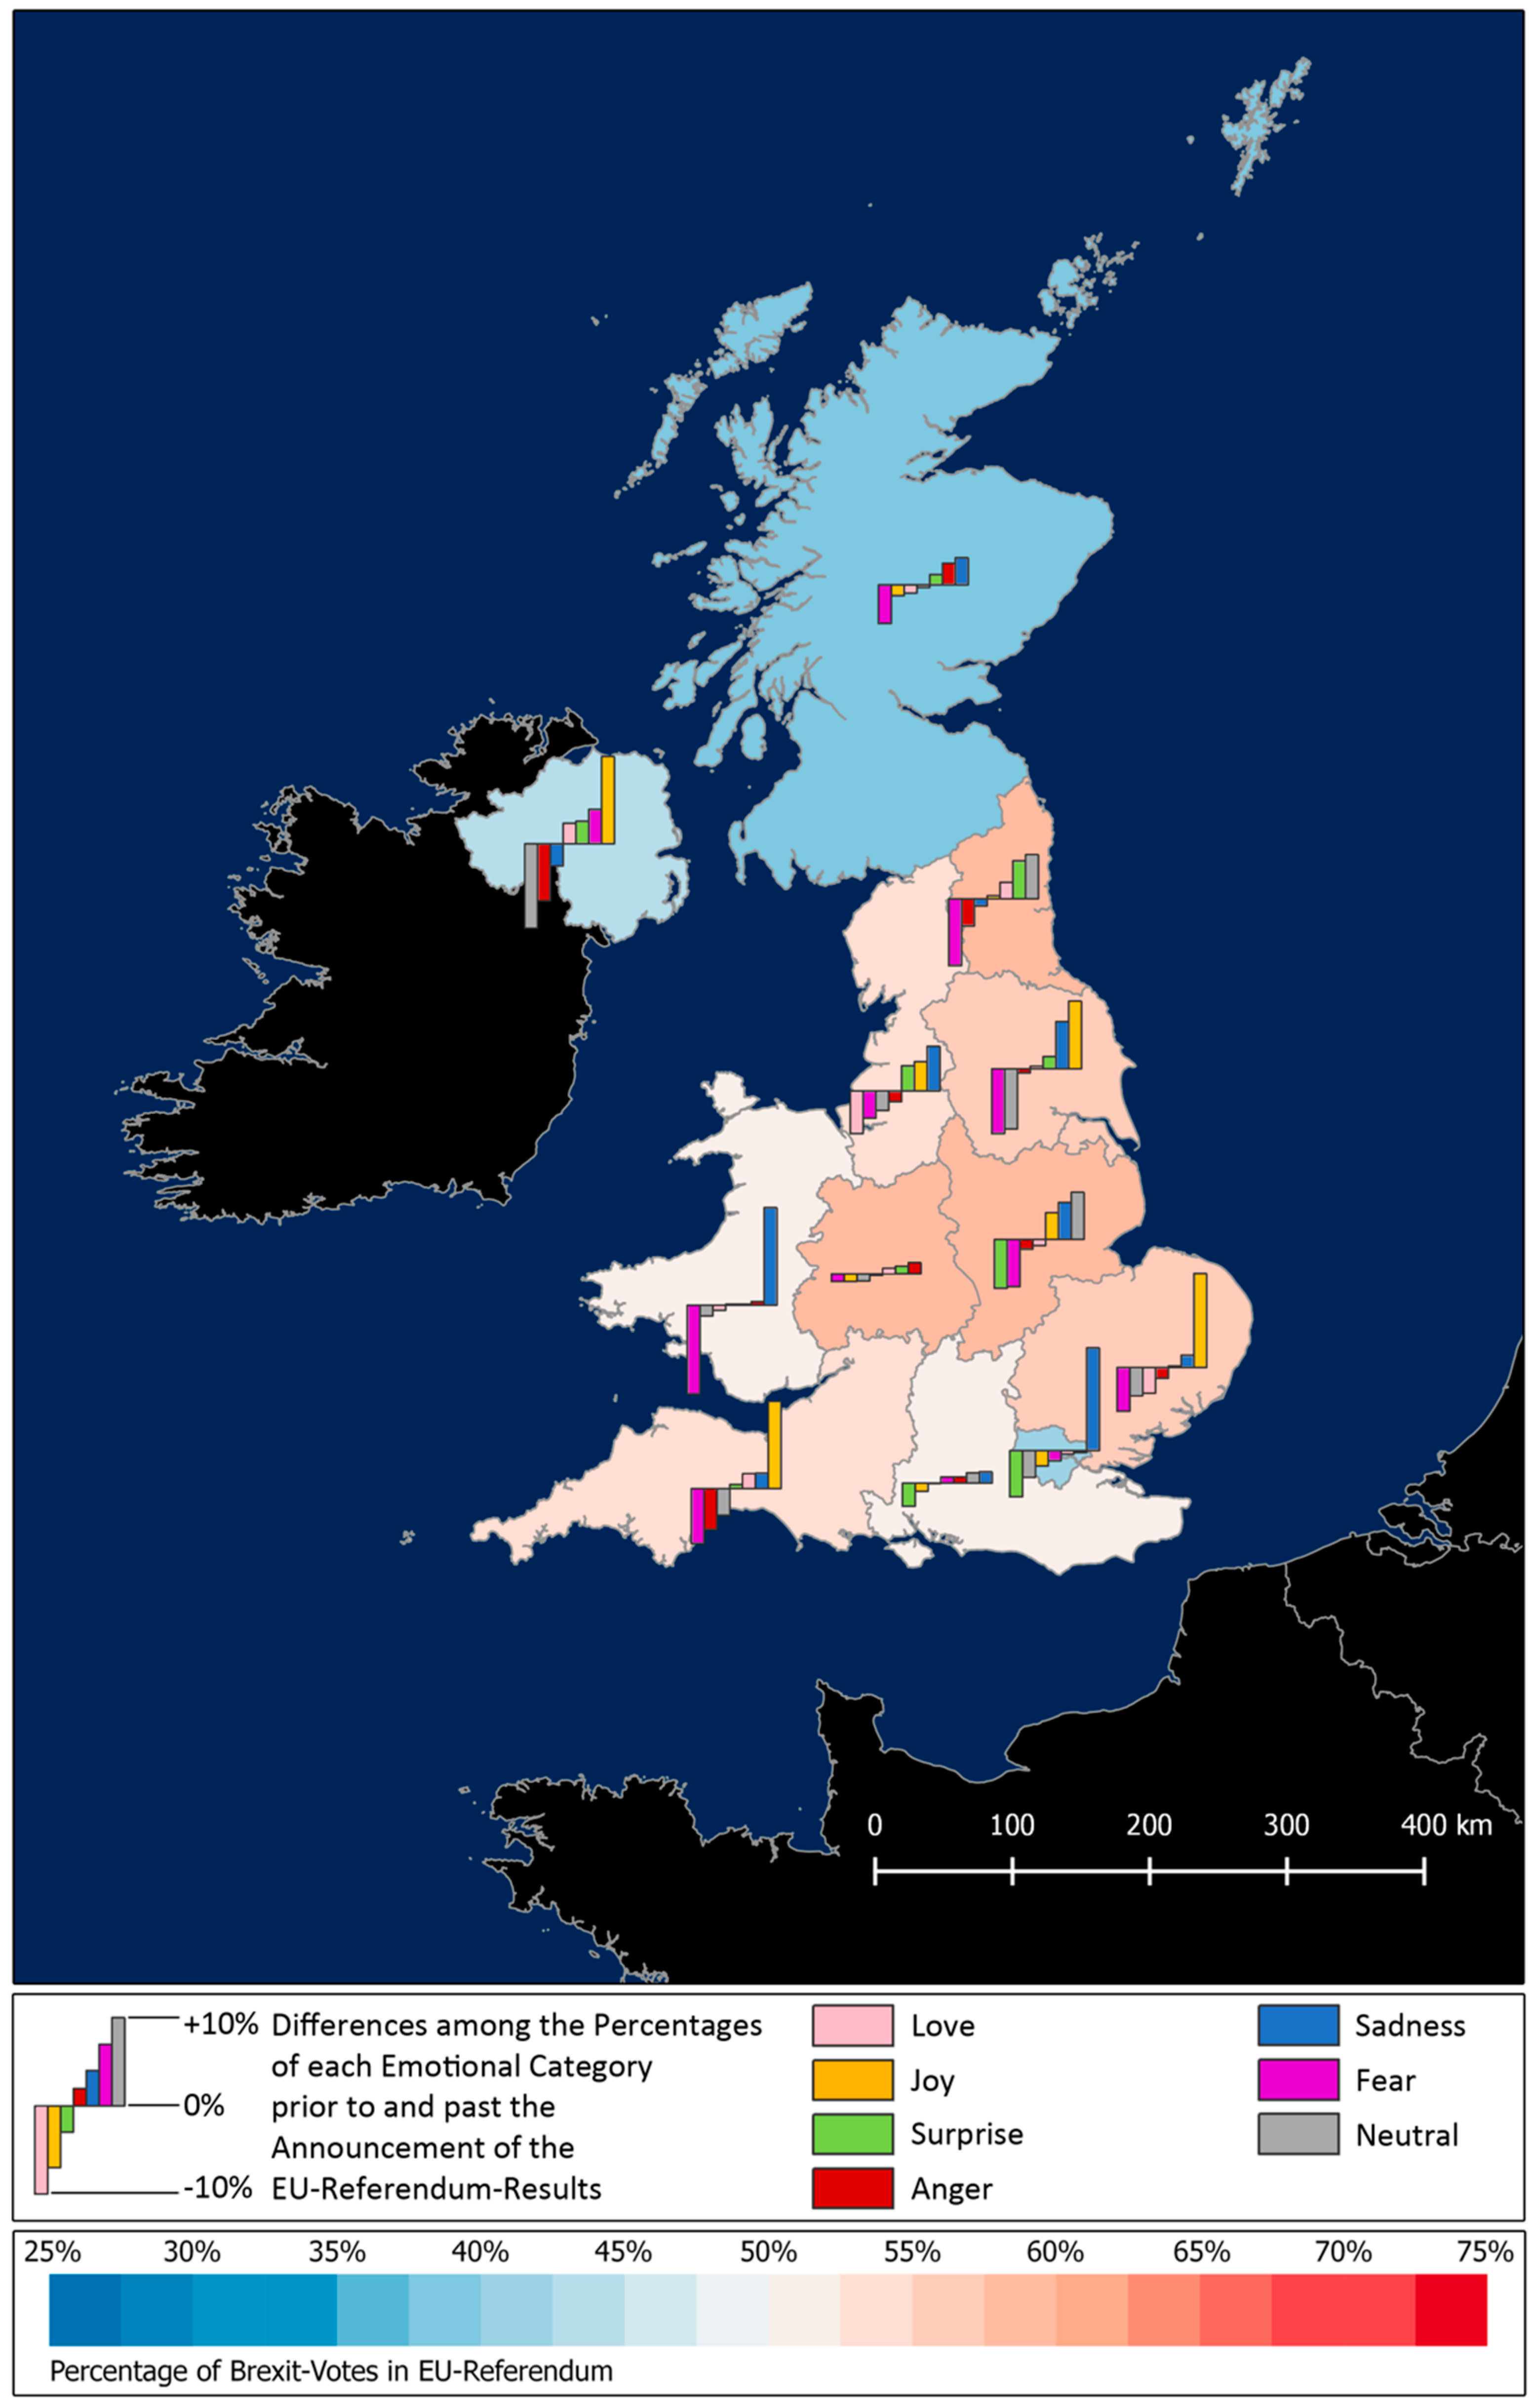
4.2.5. Space and Emotions
The previously described emotional reactions towards the consequences of an event, in this case, the announcement of the voted withdrawal of the UK from the EU, depending on the prior expectations, can also be regarded in space. The percentage of
leave votes in each NUTS1 region indicates whether the expectations for
leave or
remain were either confirmed or disconfirmed. Correspondingly, this disappointment or satisfaction can be expected to be reflected in the differences among the percentages of each emotional category prior to and past the announcement of the referendum results.
Figure 10 shows a map that visualizes this matter.
For the NUTS1 regions with a blue coloring, i.e., which voted against leave, sadness can be assumed to increase (as the expectations were disconfirmed), whereas an increase of joy can be expected for the reddish-colored NUTS1 regions (as the expectations were confirmed). The supposed increase of sadness applies to London and Scotland, and the increase of joy pertains to five out of nine red regions. In total, seven of the altogether twelve NUTS1 regions meet the expected outcome. Interestingly, except for two regions, fear declines everywhere, which might be because the uncertainty before the announcement of the referendum results is over.
In terms of numbers, the second approach that utilizes the emojis of faces for affect analysis provides more results than the first approach for sentiment analysis (see
Table 3) as the emojis are considered to be stand-alone and not in combination with particular hashtags, which significantly reduces the number of results.
5. Discussion and Conclusions
Two proposed approaches regarding how to utilize emojis for sentiment and affect analysis were applied, which involved the spatial component of the reactions, in addition to temporal and thematic analyses of Twitter reactions, to the example case of Brexit. The case study showed that the sentiment analysis that combined hashtags and emojis classified as positive or negative (i.e., Brexit support and rejection, respectively) reflects the referendum results better than a pure hashtag-based and, thus, topic-based analysis. The affect analysis with the help of face emojis subdivided into seven emotional categories produced the expected results only partially in the case study. One reason for this may be the findings of [
52] and [
53] that the interpretation and usage of emojis can differ among individual users and also due to the platform. These findings have certainly more impact on a classification of emojis into seven categories than on a classification with only two categories. Furthermore, it is conceivable that social media posts that address ‘serious’ topics such as politics are not as emoji-loaded as other subjects. Therefore, the application of the proposed approach for affect analysis to another example case with a higher emoji affinity might provide more representative results. Regarding the hashtags, the online discussions about Brexit evolved around a well-defined set of positive and negative hashtags, which might not necessarily be the case for other types of events. Thus, the two presented approaches are not applicable to every event as they require the sufficient occurrence of case-specific hashtags and particular emojis that are highly dependent on the nature of the event. Another general limitation of utilizing emojis for sentiment and affect analysis is that emojis are not contained in every tweet. However, as the number of different emojis and their use is increasing, this problem is likely to decrease in the future, although a higher diversity of emojis will raise the probability of ambiguity and thus provoke other limitations. Additionally, the differences among users regarding their interpretation and use of emojis can never be excluded.
Since the selected event, Brexit, includes a referendum and is well-documented by press reports, a comparison of the real happenings and the conducted social media analysis is possible regarding the support and rejection of Brexit. As the outcomes of the referendum and our analyses approximate to a large extent, it can be concluded that this approach could provide new und useful insights when applied to other cases that do not allow such a comparison and countercheck. However, the results of the analysis that considers emotional categories are difficult to validate as empirical surveys regarding emotions in combination with a spatial reference rarely exist. Nevertheless, or even precisely for this reason, location-based social media data can be seen as a valuable support for interpretation of the investigated situation.
To support the analyses conducted on different aspects of LBSM reactions and their semantics at different levels, various visualizations were created and used. Although none of the applied visualization methods are new, they are applied and combined in a useful way that allows in-depth insights into the reactions expressed in LBSM by heuristic, infographic, and cartographic analyses. Thus, the contribution of the presented work is the analysis of LBSM reactions to events by including emojis as language-independent emotional signals. The proposed methods that utilize emojis are less time-consuming than empirical surveys, less complex than sentiment/affect analysis based on NLP, and therefore less prone to typical language processing errors, such as errors caused by negations. This finding highlights the potential of the methods. If available, data sources, in addition to social media platforms (in the case of Brexit, press reports on the day of the referendum and official referendum results), can be involved for better interpretability, as shown in the discussed example.
6. Future Work
For future work, a possible extension regarding the case study of Brexit would be the inclusion of statistical data, similar to [
65], who considers education, economic power, and age distribution to be factors influencing the voting behavior concerning the EU referendum. The reactions to Brexit in LBSM could be treated as another influencing variable or could also serve as a basis for subdividing the reactions by demographic factors, such as age. Certain demographic information could also be extracted from the Twitter profile of the user, for instance, the home town.
The proposed approach for sentiment analysis could be extended in the future by an additional consideration of neutral attitudes (as Unicode also uses ‘face-neutral’ as a subdivision of emojis) or even a sliding scale of the ‘full’ sentiment range (i.e., very negative–negative–slightly negative–neutral–slightly positive–positive–very positive). Another issue worth considering regarding the self-developed emotional classification of emojis is the conspicuousness that the emotions represented by emojis seem to have different intensities. For instance, the emoji slightly frowning face constitutes an attenuation of frowning face, whereas intensifications can be indicated by a modified shape of the eyes and/or mouth. For example, frowning face with open mouth intensifies frowning face, or kissing face with heart-shaped eyes intensifies kissing face. In addition, other types of intensifications can be found, such as loudly crying face intensifies crying face and face screaming in fear intensifies fearful face. Examining the intensities of the emojis considered in this work shows that weak intensity is strongly underrepresented, which is the reason for disregarding the weak, normal, and strong intensity of emojis thus far. Moreover, emojis could help to detect sarcasm, which is hardly detectable with NLP, but strongly influences the meaning of an expressed reaction. For instance, a winking emoji can be an indicator of a statement that was meant sarcastically.


