Article

Spatial Relationship of Inter-City Population Movement and Socio-Economic Determinants: A Case Study in China Using Multiscale Geographically Weighted Regression

1
College of Architecture and Urban Planning, Tongji University, Shanghai 200092, China
2
Key Laboratory of Spatial Intelligent Planning Technology, Ministry of Natural Resources, Shanghai 200092, China
*
Author to whom correspondence should be addressed.
ISPRS Int. J. Geo-Inf. 2024, 13(4), 129; https://doi.org/10.3390/ijgi13040129
Submission received: 6 December 2023 / Revised: 9 April 2024 / Accepted: 10 April 2024 / Published: 12 April 2024

Abstract

:
In the current field of regional studies, there is a growing focus on regional spatial relationships from the perspective of functional linkages between cities. Inter-city population movement serves as an embodiment of the integrated functionality of cities within a region, and this is closely tied to the socio-economic development of urban areas. This study utilized Location-Based Services (LBSs) to collect the scale of inter-city population movement across 355 cities in China. Additionally, socio-economic data published by local governments were incorporated. By establishing a Multiscale Geographically Weighted Regression (MGWR) model, this research explores the spatial relationships between inter-city population movement and socio-economic influencing factors in China. This study aims to elucidate the spatial scales of the relationships between various variables. Our research findings indicate that the relationship between inter-city population movement and potential socio-economic determinants exhibits spatial non-stationarity. It is better to explore this spatial relationship through the MGWR model as there are different determinants operating on inter-city population movement at different spatial scales. The spatial distribution of the coefficient estimates shows significant regional differences and numerical variations. In China’s economically developed coastal regions, there is relatively balanced development among cities, with advanced manufacturing and producer service industries acting as significant drivers of mobility. In inland regions of China, city size is the most influential variable, directing a substantial flow of human and economic resources towards regional socio-economic hubs such as provincial capitals. The main contribution of this study is the re-examination of the relationship between inter-city population movement and socio-economic factors from the perspective of spatial scales. This approach will help China to consider the heterogeneity of different regions more extensively when formulating regional development policies, thereby facilitating the targeted promotion of regional element flow.

1. Introduction

In contemporary regional studies, understanding the functional linkages and spatial relationships between cities is gaining increased amounts of attention. This perspective posits that the configuration of regional space is influenced by the closeness of functional interactions among cities, such as those identified by the POLYNET program in Europe in terms of business connections between cities [1,2]. The mobility of various functional elements, including information [3] and economic elements [4], and particularly human mobility, has become a focal point in this context.
Over the past decade, there has been a notable change in inter-city population movement, with short-term and frequent travel greatly increasing. This change is considered to be a manifestation of the integration of regional industries, the job market, and the process of consumer and public service integration [5]. It has been notably underpinned by the rapid development of inter-city transportation systems in recent years [6]. Benefiting from the advancement of Information and Communication Technology (ICT), researchers can now capture such inter-city population movement using data sources such as Location-Based Services (LBSs), mobile signaling data, and GPS, among others. This new trend in inter-city travel and the resulting mobile population within cities have become significant subjects in urban studies and geographical research [7,8,9].
China’s rapid economic growth and development of rapid inter-city transportation networks have led to increased mobility across cities for various purposes [10,11]. However, this growth has also resulted in widening regional disparities [12,13]. As a medium for the dissemination of labor, capital, and information, inter-city population movement serves as a functional linkage between cities [5], highlighting the underlying socio-economic factors driving these flows. Consequently, the heterogeneity of socio-economic elements across Chinese cities has resulted in differentiated inter-city population movement, with a substantial influx of individuals moving towards economically developed coastal areas, city agglomerations, and provincial capitals located inland [14].
While existing studies acknowledge the impact of socio-economic disparities on population movement [15,16], there is a notable lack of research on the spatial relationships and spatial non-stationarity between these socio-economic factors and inter-city population movement. This gap underscores the importance of investigating how these factors interact spatially across different regions in China. Understanding the spatial dimension of these relationships is crucial to understand regional variations in the underlying drivers and to develop targeted regional development policies that consider functional linkages. Such exploration is vital to uncover the nuanced spatial dynamics that shape inter-city population movement and to inform more effective policy interventions.

1.1. Spatial Characteristics of Inter-City Population Movement

Inter-city population movement research encompasses two primary areas: foundational scientific inquiries and social science perspectives. The former focuses on fundamental laws such as scale rules and distance decay laws [17,18,19], while the latter delves into movement characteristics and driving mechanisms. The key aspects examined include the scale of movement between cities, indicative of urban functional linkage [5], and city agglomeration and centrality dynamics, inspired by Castells’ “Space of Flows” theory [20].
Existing empirical studies in China have revealed distinct spatial heterogeneity in inter-city population movement networks. Developed urban agglomerations show balanced network characteristics [21], whereas other regions display inter-city population movement predominantly towards core cities and their surroundings, with limited interaction among non-central cities [8]. The scale of inter-city population movement reflects regional or city developmental levels, with notable spatial variations. Economically developed coastal cities in eastern China like Beijing, Shanghai, Guangzhou, and Shenzhen attract the majority of mobile individuals nationwide, while provincial capitals in Central China emerge as focal points for spatial aggregation on an inter-city population movement scale. The western region, however, shows lower continuous values [7].
This significant spatial heterogeneity in the network and scale characteristics of inter-city population movement in China suggests that global models may not accurately capture local variations and spatial scale impacts. Therefore, investigating the spatial relationship between inter-city population movement and its determinants is crucial for reliable spatial planning and economic strategy formulation.

1.2. Variables Affecting Inter-City Population Movement

Although inter-city population movement has emerged as a new trend in recent years, inter-city migration has long been an important topic for scholars in various fields. Given their many similarities, the construction of a theoretical framework for inter-city population movement can draw insights from and reference the study of migration.
Key theoretical frameworks in this area include the “push and pull theory” initiated by R. Herberle and E. S. Lee et al. [16], which examines socio-economic factors in both origin and destination regions. The neoclassical theory, which combines macro labor supply with micro individual demand, considers labor migration as a form of human capital investment that maximizes individual benefits, while the macro view analyzes from the perspective of labor force changes between the agricultural and industrial sectors and the resulting wage differences [22,23,24]. The new economic migration theory shifts the focus to household decisions, aiming to minimize income risks and navigate market constraints [25]. Economic globalization has brought about new changes. The dual-labor market theory [26], world systems theory [27], and network theory [28] have all attempted to elaborate and explain population migration from various aspects, including macro-social economic and cultural structures.
In empirical studies, several key variables have been identified as potential determinants of inter-city population movement. GDP is often considered a general indicator of a city’s economic strength, attracting population inflow [29]. The industrial structure also plays a crucial role, with the tertiary sector positively influencing migration, while the primary and secondary sectors have a contrasting effect [30,31]. Mean wage levels, indicating job opportunities and economic wellbeing, are also significant factors [32,33,34,35]. Public service levels, encompassing education, healthcare, and living facilities, impact migration decisions and have spatial spillover effects on neighboring cities [36,37,38]. Housing prices are another critical factor, with disparities in housing costs significantly influencing household migration [33].
In addition, geographic proximity, as outlined in Ravenstein’s “The Laws of Migration” [16], asserts that people tend to move towards neighboring areas with more developed economies and better opportunities. Many early empirical studies also identified distance and accessibility as important factors influencing migration [39,40]. However, recent advancements in China’s high-speed railway (HSR) network have significantly altered traditional patterns of migration and spatial distance considerations, particularly in the more developed eastern and central regions of China [6,41]. The increasing homogenization of rapid inter-city transport services across China led to a diminishing influence of transportation variables on population mobility by 2019 [32]. Based on the support from this literature, we decided not to include transportation as a covariate in our model during the modeling process.
In summary, related studies have shown that GDP, industrial structure, mean wage, and public service level are all potential determinants that may affect the scale of inter-city population movement, which are important references for the construction of this paper’s model. In addition, related studies have also suggested that spatial non-stationarity is an important issue in inter-city population movement, but there is still a lack of in-depth research on the scale of multiple processes.

1.3. Methods Used to Investigate the Determinants of Inter-City Population Movement

Inter-city population movement, characterized by pronounced spatial heterogeneity, cannot be fully explored through global modeling approaches alone. Local modeling is crucial in conducting a comprehensive investigation as spatial autocorrelation plays a significant role in the distribution of inter-city population movements and socio-economic factors, aligning with the first law of geography [42]. To address spatial autocorrelation in residuals, spatial lag and spatial error have been incorporated into spatial regression models, enhancing accuracy by discussing inter-city population movement scales [43,44]. These models effectively quantify the relationships of socio-economic factors with population movements, considering spatial heterogeneity.
Nevertheless, traditional global models assume stable variable relationships across all spatial units, overlooking spatial non-stationarity [45,46]. This limitation has led to the adoption of Geographically Weighted Regression (GWR) models in recent studies. Through the GWR model, it has been discovered that the relationships between various socio-economic factors and inter-city population movement differ across different regions in China [47,48]. However, GWR assumes uniform spatial scales for all determinants, a potentially flawed premise given that different factors may operate at varying scales [49].
Consequently, this study introduces the Multiscale Geographically Weighted Regression (MGWR) model, an advancement in GWR. MGWR builds upon the GWR model by obtaining a set of optimal covariate-specific bandwidths, where each bandwidth represents the spatial scale at which a specific factor influences inter-city population flows. With this feature, MGWR enables the exploration of relationships between variables at both the global and local spatial levels simultaneously [50]. MGWR’s efficacy is demonstrated in diverse fields, including air pollution [51], land surface temperature [52], and housing prices [53], showing improved results over GWR.

1.4. Contribution

This paper addresses a gap in understanding, namely the mechanism behind inter-city population movement on normal days in China, a phenomenon distinct from long-term migration and indicative of urban functional attractiveness. Previous studies, primarily focused on long-term migration, have not fully explored the spatial relationship and potential spatial non-stationarity between these movements and socio-economic determinants. Our research thus poses two questions: (1) What is the spatial relationship between inter-city population movement on normal days and socio-economic factors? (2) How do these movements vary across different Chinese regions?
The main contribution of this paper lies in its use of LBS data to measure inter-city population movement on normal days in China, which is distinct from traditional population migration and represents the functional attractiveness of a city. Furthermore, the paper introduces the MGWR model to establish a spatial relationship between inter-city population movement and socio-economic factors. By analyzing the spatial scales and parameter estimates of each socio-economic variable, this study provides a more nuanced analysis of regional development dynamics across different areas in China, thus filling a research gap in the factors influencing inter-city population movement and their spatial relationships. Additionally, understanding these spatial relationships can offer valuable insights for formulating regional development policies in China.

2. Materials and Methods

2.1. Data

2.1.1. The Study Area and Definition of Inter-City Population Movement

The area of this study includes 355 cities in the Chinese mainland, each divided according to their prefecture-level administrative division, including all urban areas and rural areas. The data for the Ali Prefecture of the Xizang Autonomous Region, the Taiwan Region, and the Hong Kong and Macau Special Administrative Regions are not available for this research; therefore, they are not included in this study.
LBS data are used to identify and estimate inter-city population movement between all cities in China. Internet LBS data refer to all data generated by the use of Location-Based Services. LBSs use various types of positioning technologies, such as network-based positioning and GPS positioning, to allow service providers to obtain the current location of mobile terminals with the positioning function when the user actively requests or enables passive location access. One advantage of LBS data is that, compared with traditional census data and statistics, this type of data has increased timeliness and can measure the short-term, real-time travel behavior of people between cities. According to statistics, the number of mobile internet users in China reached 986 million in 2020, of whom more than 99.7% were cell phone internet users [54]. In this context, the trajectory of almost every smart phone user can be efficiently traced, meaning that an ultra-large number of samples of trajectories is assembled to reflect inter-city population movement.
The internet LBS data utilized in this study originate from Baidu Inc.(Beijing, China), the largest search engine operator in China. The dataset is known as “Baidu Migration”. The reason for using this data source to measure inter-city population movement is that Baidu is one of the most widely used LBS providers in China; they receive 130 billion location service requests daily and provide LBSs for over 600,000 APPs [55]. Indeed, Baidu can be considered analogous to Google in the Western world. Therefore, the use of Baidu LBS data essentially meets the requirements of diverse sampling groups, a large sample size, and wide coverage, making the description of the characteristics of inter-city population movement in China as realistic as possible. Baidu Migration data define cities where users stay for more than one day as their origin cities, and they define cities where users arrive after leaving their origin cities and stay for more than 4 h as their incoming cities. Through the records of origin and destination cities, inter-city population movement is identified.
The year 2019 was the final year before China implemented movement control policies because of the COVID-19 pandemic, meaning that the inter-city population movement data from this year are not affected by external policy factors; they best reflect natural population movement under the influence of socio-economic factors. Therefore, the data for this year were used to analyze inter-city population movement and its processes. The data used in this case cover a total of 14 days from 11 April 2019 to 24 April 2019, which was a normal working period and included four weekends. The original format of Baidu Migration LBS data comprises six fields, namely date, departure province, departure city, destination province, destination city, and the number of users Table 1.
When processing the Baidu Migration LBS data, our focus is on inter-city population movement on normal days. Inter-city population movement on normal days refers to travel behavior between cities, differing significantly from traditional concepts of population migration. Its essence lies in the sum of various types of passenger traffic between cities. Due to the different acquisition times of data (weekends, weekdays), it may encompass various types and purposes of travel, such as inter-city commuting, business trips, visiting family and friends, vacations, and leisure activities. The scale of inter-city population movement (ICPM) refers to the total number of people flowing in and out of a city during the study period. Therefore, based on the original Baidu data, we calculated the total inflow and outflow of a city over a period of 14 days. The addition of inflow and outflow yields the inter-city population movement scale of that city. Considering the potential differences in travel purposes between weekends and weekdays, which may result in variations in the scale of inter-city population movement, we initially calculated the scales separately for weekends and weekdays. The results indicate no significant differences in scale or ranking between the two Table A1, Figure A1. Moreover, as inter-city population movement during weekdays mostly involves short-term travel, the inflow and outflow of cities are nearly equal over a certain period. Therefore, the scale of inter-city population movement can be considered to be representative of the overall mobility of a city’s population. The spatial distribution of China’s inter-city population movement scale in 2019 is illustrated in Figure 1. In that year, a total of 209,130,313 people were identified to have moved between Chinese cities. Among the 355 cities in China, developed cities along the east coast and provincial capitals had the largest scales of inter-city population movement. The scale of inter-city population movement exhibits a significant difference among western, central, and eastern regions Figure 2.

2.1.2. Independent Variables

The scale of inter-city population movement is considered to be associated with various factors. In comprehensive reference to prior relevant research and data availability, we selected 6 variables to represent different aspects of urban characteristics. GDP was chosen to represent the overall economic scale of the city, while the added value of the primary sector per capita (PSPC), added value of the secondary sector per capita (SSPC), and added value of the tertiary sector per capita (TSPC) were selected to represent the city’s industrial structure. General public budget expenditure per capita (GPBEPC) was chosen as a proxy for the level of urban public services, and average wage (AW) was used to represent employment attractiveness. These six variables serve as alternative explanatory variables Table 2. All alternative explanatory variables were obtained from the official statistical websites of governments across various regions in China. We visited the official statistical websites of each city’s respective province and acquired the statistical data from the provincial statistical yearbooks of 2020, which present data up to the end of 2019. Due to the unavailability of the required data for the Ali Prefecture in the Tibet Autonomous Region, Taiwan, Hong Kong, and Macao Special Administrative Regions, these areas are not included in this study.
Due to the different measurement units of the aforementioned variables and their substantial numerical differences, we employed their logarithmic forms. These log-transformed records were then standardized to have a mean of 0 and a variance of 1, allowing for unit-independent parameter estimation and facilitating comparisons. Taking the logarithm of variables can also mitigate nonlinearity in the original relationships [56].
Further collinearity tests were performed on the log-transformed variables. Calculating Tolerance and VIF values revealed that the Tolerance values for each independent variable were significantly greater than 0.1, and the VIF values were all less than 5. Consequently, there is no significant issue of multicollinearity among the independent variables, ensuring the accuracy of the model estimates.

2.2. Methodologies

In order to comprehensively analyze the spatial relationship between inter-city population movement on normal days and socio-economic determinants, and to examine the underlying processes and mechanisms, three models were introduced in this study: the classical Ordinary Least Squares (OLS) model, the widely used Geographically Weighted Regression (GWR) model, and the recently proposed Multiscale Geographically Weighted Regression (MGWR) model. The performance of these three models in the context of inter-city population movement was compared in terms of three aspects: goodness-of-fit, distribution of residuals, and accuracy of coefficient estimates. The optimal model was selected, and its performance was analyzed in terms of bandwidth and spatial scale, as well as parameter estimates. This analysis aimed to thoroughly examine the spatial relationships and mechanisms behind each determinant in the context of inter-city population movement on normal days and socio-economic factors.

2.2.1. Ordinary Least Squares

The OLS model was used to determine the relationships between independent and dependent variables to identify globally significant influencing factors for inter-city population movement and to serve as a benchmark for comparison with the next two local regression models.
The classic OLS model can be written as the following equation according to inter-city population movement:
y i = β 0 + j β j x i j + ϵ i
where i represents a city, y i represents the scale of inter-city population movement in city i, x i j represents the jth explanatory variable for city i, β 0 is a constant term, β j is an unknown coefficient to be estimated, and ϵ i is an error term that obeys a mean of 0 and a normal distribution.
After conducting OLS modeling, to ascertain whether the relationships between variables are influenced by their respective spatial distributions, the next step involved assessing the spatial autocorrelation of the residuals from the OLS model. It is commonly believed that if the residuals of a global model exhibit significant spatial autocorrelation, the spatial distribution of variables within the model significantly impacts the estimation results. Therefore, this study employed the global Moran’s I to further validate the spatial distribution characteristics of residuals in the OLS model. This verification process serves to test the usability of the global model in exploring the relationship between inter-city population movement and socio-economic determinants. Additionally, it establishes a basis for demonstrating the spatial relationships between local models. The OLS global regression model was estimated using SPSS, and the spatial autocorrelation of residuals was calculated using the spatial analysis toolbox in ArcGIS PRO software (version 3.0).

2.2.2. Geographically Weighted Regression

GWR was also used in this study, a local spatial model, to estimate coefficients based on spatial location for local variables with distance attenuation weights, and to model spatial heterogeneity through coefficients that change with space.
The classical GWR model used in the context of inter-city population movement can be written as the following equation [46]:
  y i = β 0 ( u i , v i ) + j = 1 n β j ( u i , v i ) x i j + ϵ i
where ( u i , v i ) is the coordinate of the spatial sampling unit (i.e., city centroid) i, y i represents the scale of inter-city population movement of city i, x i j represents the jth explanatory variable of city i, β 0 ( u i , v i ) is the constant term on city i, β j ( u i , v i ) is the jth unknown coefficient to be estimated on city i, and ϵ i is the random error with a mean of 0 and a variance of σ 2 .
Building the GWR model requires selecting a spatial weighting matrix to identify spatial relationships between neighboring cities. In this study, the commonly applied adaptive double square space kernel is used, which is a Gaussian-like kernel function [45]:
  W i j = 1 d i j b 2 2 i f   d i j < b 0 o t h e r w i s e
where W i j is the weight between city i and city j, d i j is the distance between city i and city j, and b is the critical distance from regression location I to its Mth nearest cell. M is the optimal number of neighboring cells determined by minimizing the model’s Akaike information criterion (AICc) [57].
The GWR model undergoes multiple iterations during its establishment. In each iteration, a bandwidth is chosen, and a GWR model is constructed using that bandwidth. Fit metrics, typically calculated using the AICc method, are then computed. By comparing the AICc values from each iteration, the bandwidth with the minimum AICc is selected as the optimal bandwidth. The calculation method for AICc is as follows:
A I C c = 2 n   ln σ ^ + n   ln 2 π + n n + t γ ( S ) n 2 t γ ( S )
where σ ^ is the estimated standard deviation of the error term and t γ ( S ) is the trace of the hat matrix S.

2.2.3. Multiscale Geographically Weighted Regression

Although the GWR model adequately addresses the spatial non-stationarity of inter-city population movement and its processes, it operates under the assumption that all these relationships change at the same spatial scale among all covariates. MGWR represents a significant improvement compared to the GWR model as it can generate different optimal bandwidths for different variables. This means that the results of the MGWR model allow for an analysis of how different socio-economic determinants impact inter-city population movement on normal days in distinct ways and at various spatial scales. Consequently, it enables a more in-depth analysis of the spatial relationships between these factors and the underlying mechanisms.
The standard MGWR model can be written as the following equation [49]:
y i = β b w 0 u i , v i + j = 0 m β b w j u i , v i x i j + ϵ i
where ( u i , v i ) is the coordinate of the spatially sampled cell (i.e., city centroid) i, and bw* is the specific optimal bandwidth used during the *th inter-city population movement process. y i represents the size of inter-city population movement in city i, x i j represents the jth explanatory variable in city i, β b w 0 u i , v i is the constant term in sampling cell i, β b w j u i , v i is the jth unknown coefficient to be estimated in sampling cell i, and ϵ i is a random error with a mean of 0 and a variance of σ 2 .
In the crucial bandwidth calculation process, the MGWR model introduces different bandwidths for different variables. Consequently, distinct spatial weight matrices are generated for each variable, rendering the original GWR model’s bandwidth calculation method inappropriate. Therefore, the MGWR model uses a back-fitting algorithm to calibrate the model. The basic idea of back-fitting is to calibrate each term in the model with a smoother one, assuming that all the other terms are known. Thus, in each iteration, the MGWR model fits a coefficient and an optimal bandwidth for each independent variable through multiple iterations to obtain a converged model. During this process, two crucial parameters are manipulated: the initialization state and the termination criterion. In this study, we opted for the parameter estimates from GWR as the initialization state, which does not impact the final results but reduces the number of model iterations. We set SOC-f to 1 × 10⁻⁵ as the threshold for the termination criterion [49]. Both the MGWR model and the GWR model are built using MGWR software (version 2.2. https://sgsup.asu.edu/sparc/mgwr, accessed on 4 December 2023).

3. Results

3.1. Comparison of Three Models

3.1.1. Goodness-of-Fit

The mean absolute error (MAE), residual sum of squares (RSS), AICc value of the model, and the adjusted R2 are used to measure the goodness-of-fit of the OLS, GWR, and MGWR models. For the MAE, RSS, and AICc, smaller values imply better goodness-of-fit, while for Adj. R2, larger values imply better goodness-of-fit (Table 3). The results show that all three models obtain good goodness-of-fit, and the relationships between the size of inter-city population movement and the role of each socio-economic factor are highly significant. In contrast, the GWR results obtain smaller MAE, RSS, and AICc values and higher Adj. R2 compared to OLS. The local regression model demonstrated a significant improvement over the global regression model, confirming the existence of a spatial relationship between the inter-city population movement of a city and socio-economic determinants. The spatial distribution of variables significantly influences the interaction processes between them. Moreover, the MGWR results are better than GWR, as, considering the differences in the special scales of the roles of different variables, they have a significant improvement in the goodness-of-fit.

3.1.2. Residuals

The residuals of the three models reconfirm the conclusions obtained from the goodness-of-fit above. The OLS model has larger residuals with a more dispersed distribution of values, while the other two have a smaller value and a more concentrated distribution of residuals, and the MGWR model has no residuals with absolute values above 1 Figure 3.
The spatial distribution of the residuals is another issue that deserves attention. The characteristics of the spatial distribution of the residuals for the three models indicate that the OLS model can hardly obtain reliable results in large cities in China, as shown in Figure 2, with relatively high residuals in almost all provincial capitals in the central and eastern regions, as well as in the three major urban agglomerations along the Chinese coast. In the OLS model, significant high residuals are observed around Beijing in the vicinity of Langfang and Baoding, as well as around Guangzhou, one of China’s most developed cities, including Huizhou and Zhongshan, and around Xi’an, an important provincial capital in northwest China, including Xianyang. This could be attributed to two possible reasons: either there are factors not considered by the model influencing inter-city population movement, or the spatial heterogeneity of the variables affects the model’s fitting results. In contrast, both the GWR and MGWR models achieved better fit values in these areas, and the residuals exhibited a more stable spatial distribution. This suggests that the instability in the spatial autocorrelation of residuals in the OLS model is due to the neglect of the spatial heterogeneity of the variables. The relationship between China’s inter-city population movement and socio-economic influencing factors is significantly influenced by spatial relationships. In contrast, the GWR and MGWR models generate better-fitting results in these regions, and the residuals are relatively more stably distributed in space.
The global Moran’s I is further used to determine the spatial autocorrelation of the residuals of the three models. The spatial distribution of the residuals of the OLS model shows a very strong clustered feature, while the GWR model still has a clustered spatial pattern despite a significantly decreased Z score. Only MGWR has a random pattern Table 4. Moran’s I indicates that the process of inter-city population movement is spatially non-stationary. However, the GWR model’s residual distribution still exhibits some spatial autocorrelation, indicating that there are deeper spatial relationships influencing this process. After further considering the scale of the relationships between variables, the residuals of MGWR show a random distribution, and the residual distribution of the MGWR model in China’s three major urban agglomerations is more stable compared to that of the GWR model, better fitting the scale of inter-city population movement in developed regions (Figure 3), which are often areas of focus in urban research. Therefore, the results of the MGWR model are more meaningful in practice than those of the GWR model. The spatial heterogeneity of the variables and the spatial relationships between them vary significantly for different independent variables, influencing the relationship between inter-city population movement and socio-economic factors.

3.1.3. Local Parameter Estimates Accuracy

As shown in Figure 4, RMSE (root mean squared error) is used to assess the accuracy of the local parameter estimates. From the results, it can be clearly interpreted that the MGWR model has much better parameter estimation accuracy than the GWR model. The GWR model can obtain more accurate parameter estimates for three processes, i.e., the intercept, GDP, and SSPC, but has significantly inferior results to MGWR for the remaining four processes. According to Fotheringham et al. [49], this is because the “mean” bandwidth of the GWR model is closer to the specific bandwidth of the MGWR model for the intercept, GDP, and SSPC, while for the remaining four variables, the specific bandwidth is much larger than the mean bandwidth of the GWR model. For the variables exhibiting a broad regional trend, the GWR model would have yielded a poor replication of the parameter surface. For the accuracy of the parameter estimates, the GWR model will yield better results if all the variables in the model are similarly spatially heterogeneous. Conversely, if all variables put into the model have very different spatial heterogeneity, then it is particularly important to calculate individual bandwidths associated with different covariates, which means that the results of the MGWR model will be more accurate. Clearly, for inter-city population movement, the spatial heterogeneity of the processes with socio-economic factors is very different, and therefore, the scale of the different processes can be varied, which has been neglected in many previous studies.
In summary, based on the goodness-of-fit of the models, the values and spatial distribution of the residuals, and the accuracy of the local parameter estimates, the performance of the MGWR model surpasses that of the OLS model, which does not consider spatial relationships, and the GWR model, which measures spatial relationships at a fixed spatial scale. Moving forward, we will delve into the results of the MGWR model, incorporating insights from the GWR model to further analyze the spatial relationships between inter-city population movement and socio-economic factors.

3.2. Spatial Relationship of Inter-City Population Movement and Socio-Economic Determinants

3.2.1. Optimized Bandwidths and Spatial Scale

The results show that the GWR model generates the same optimal bandwidth, of 90, for all variables, which is quite different from the specific optimal bandwidth that MGWR calculates for each variable, suggesting that the relationship between each explanatory variable and inter-city population movement operates at significantly different spatial scales. In the MGWR model, GDP has the closest bandwidth to the GWR model, while the optimal bandwidths for the intercept and TSPC are significantly smaller than those of the GWR model, and both processes should occur at a more local spatial scale, thus showing stronger spatial non-stationarity than the GWR model estimates. The specific bandwidths of the remaining four variables are significantly higher than those of the GWR model. SSPC and GPBEPC, although not global variables, have bandwidths of 279 and 173, respectively, and these two processes tend to be more spatially stationary than those estimated by the GWR model. The relationships between PSPC, AW, and inter-city population movement are entirely on a global scale, but the GWR still models it as a local process, which obviously leads to inaccurate results (Table 5). This indicates that the MGWR model not only considers the spatial relationships of certain independent variables in their effects but also globally simulates the relationships between other independent variables and the dependent variable. Different socio-economic factors significantly influence inter-city population movement at distinct spatial scales. This aids in analyzing how cities with different economic scales, industrial structures, and levels of social services impact the dynamics of population mobility in various regions of China. Consequently, it helps disentangle the differences in developmental disparities and economic vitality among different regions.

3.2.2. Parameter Estimates

Table 6 presents a description of the coefficient estimates of the MGWR model for each explanatory variable, including the min, max, and mean values of the local coefficients, as well as the proportion of cities that pass the t-test at the 95% level for all cities, and the proportions of significant positive correlations and significant negative correlations on this basis. Overall, the model results show that the effects of the intercept and GPBEPC at the local level vary significantly with space. In terms of intercept values, 45.92% of the cities have intercept values significantly different from zero, of which 76.69% are positive values, implying that a city actually has a larger inter-city mobility despite taking into account all the explanatory variables in the model, while the remaining 23.31% are negative intercept values. GPBEPC is a very insignificant factor, having an impact on less than one-tenth of the cities, and it is negatively correlated to inter-city population movement. In contrast, four variables, GDP, PSPC, TSPC, and SSPC, are significant influencing factors in basically all spatial units. Among them, GDP and SSPC are the two most significant influencing factors, and like the trend shown by the global model, GDP locally exhibits the most significant and strongest positive correlation with the size of inter-city population movement. SSPC has a slightly smaller coefficient compared to GDP, but it remains a strong positive influencing factor. TSPC is a relatively significant influencing factor, producing a negative correlation with nearly all cities. AW is also consistent with the results of the global model; it is not a significant influencing factor in all cities.
There are two values that are usually important for the parameter estimation of a model, namely the p value and the coefficient value. Both can be used to reflect spatial non-stationarity, and for the results of the GWR and MGWR models, comparing the spatial distribution of parameter estimates can further analyze the roles played by the scales in them.
Figure 5 and Figure 6 show the spatial distributions of all the parameter estimates for the GWR and MGWR models, which are quite different from each other. In terms of passing the significance test, the GWR model has more spatial units that fail the t-test, which means that the model results do not work in a significant amount of space. Moreover, these spatial units that pass or fail the test are clustered, implying that these processes have a strong spatial non-stationarity. This situation is particularly significant in the two processes, PSPC and TSPC, both of which pass the test in all spatial units in the MGWR model, and the distribution of the p value is spatially stationary. However, only 76.62% and 41.97% of the spatial units pass the test in the GWR model, respectively (Figure 5c,e and Figure 6c,e). Similarly, the distributions of the p values of the GPBEPC and AW of the two models have no similarity, which is related to the fact that the specific bandwidths of these variables are significantly larger than the mean bandwidths of the GWR model. Conversely, for GDP and intercept with specific bandwidths close to the mean bandwidth of the GWR model, the two models not only have the same units which pass the significance test but the spatial distribution of their coefficients is closer. This trend in the distribution of p values further validates that without considering the issues of scale and spatial stationarity, it becomes difficult to effectively explain how inter-city population movement and the interaction between socio-economic factors operate at the local level in China. Consequently, it becomes challenging to comprehend how the differential development of various regions in China influences urban functionality.
This is also the case for the coefficient values. Taking the PSPC and TSPC processes as two examples, the coefficient distributions of the GWR model show stronger spatial heterogeneity, with coefficient values distributed in [−0.31, −0.06] and [0.17, 0.39], respectively, and clustered in space. In the MGWR model, these two processes are spatially stationary, their coefficient distributions are spatially stable and asymptotic, and the coefficient values are only distributed in small intervals of [−0.09, −0.05] and [0.10, 0.19]. The distribution of GPBEPC and AW coefficients is similar. In the GWR model, the GPBEPC coefficients that passed the significance test are distributed in the southern and central regions and some cities in the eastern coastal region of China, while in the MGWR model, this process is valid only in the northeast region. AW fails the significance test completely and is not a functional factor in the MGWR model. Thus, the effect of scale on parameter estimates is reflected not only in the significance tests but also largely in the coefficient values.
Given that the coefficient value is an important parameter for analyzing the extent to which a given independent variable contributes to the dependent variable, this effect can significantly change the understanding of the factors behind inter-city population movement. In the general trend, the spatial distribution of the coefficients of GDP shows a change from inland areas to coastal regions, which is most conspicuous in eastern coastal regions (Figure 6). This implies that, in eastern coastal regions, the impact of GDP on inter-city population movement on normal days is relatively smaller compared to inland regions. On the other hand, the spatial distribution of the coefficient values for SSPC exhibits a more concentrated pattern. The high absolute values are concentrated in the northern and central–western regions of China, such as Hebei, Inner Mongolia, and Chongqing. Another interesting aspect is the distribution of the SSPC coefficient in the Yangtze River Delta (YRD) and Pearl River Delta (PRD) regions. It is worth noting that the SSPC coefficient distribution in the PRD fails to pass the test, suggesting that this negative correlation relationship does not hold in the PRD.

4. Discussion

4.1. Different Regions in China Are Undergoing Completely Distinct Processes of Economic/Regional Development

Inter-city population movement represents a functional linkage, wherein the magnitude of population flows between cities reflects their functional centrality within the country. Under the paradigm of “flowing space”, the status and importance of cities are no longer solely reflected in their economic size but rather in their ability to serve as critical nodes within the functional connectivity network [58,59]. Exploring the factors and mechanisms that influence the scale of inter-city population movement is, in essence, an inquiry into the factors and mechanisms that determine a city’s capacity to function as a node. Numerous studies have discussed regional disparities in China’s economic development. It is evident that different regions in China are undergoing distinct processes of urbanization, globalization, and industrial development, each with their own unique set of underlying mechanisms [12,60,61]. However, there is a lack of reliable research conclusions regarding how these disparities in development and their mechanisms can be explained from the perspective of functional linkage. By employing the MGWR model and considering the spatial relationship and spatial scale of different processes, this study aims to address and discuss this issue.
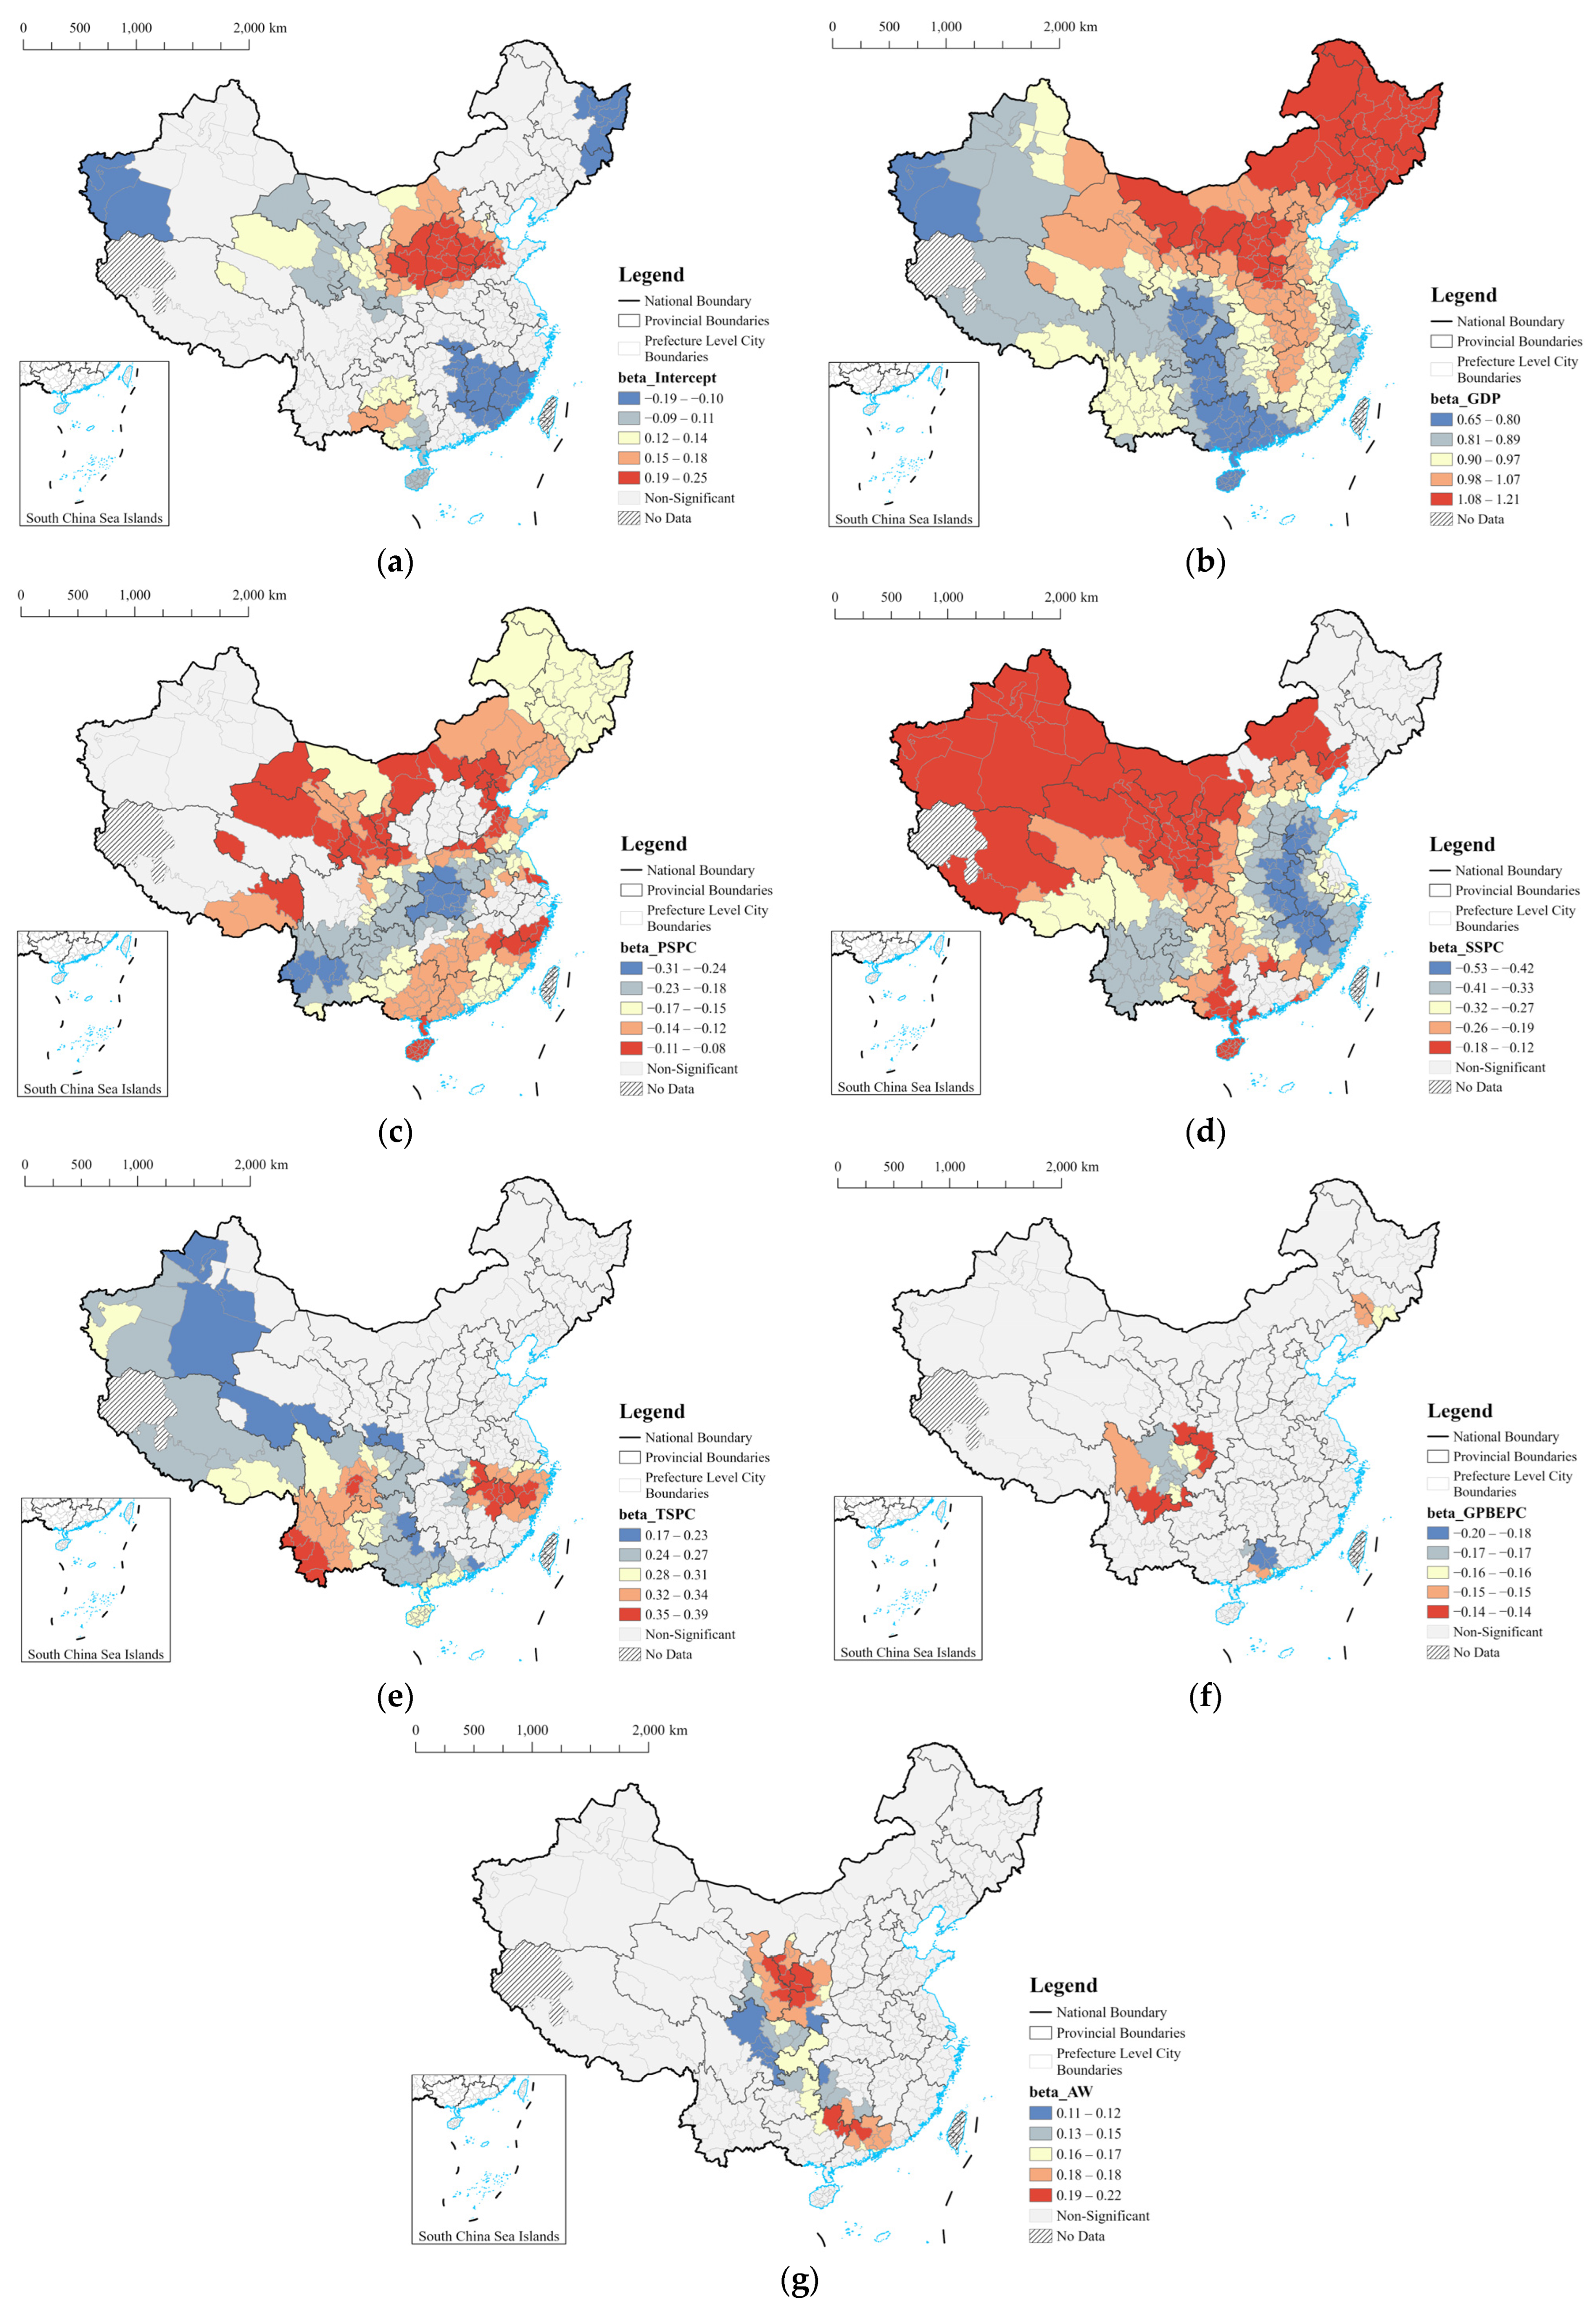
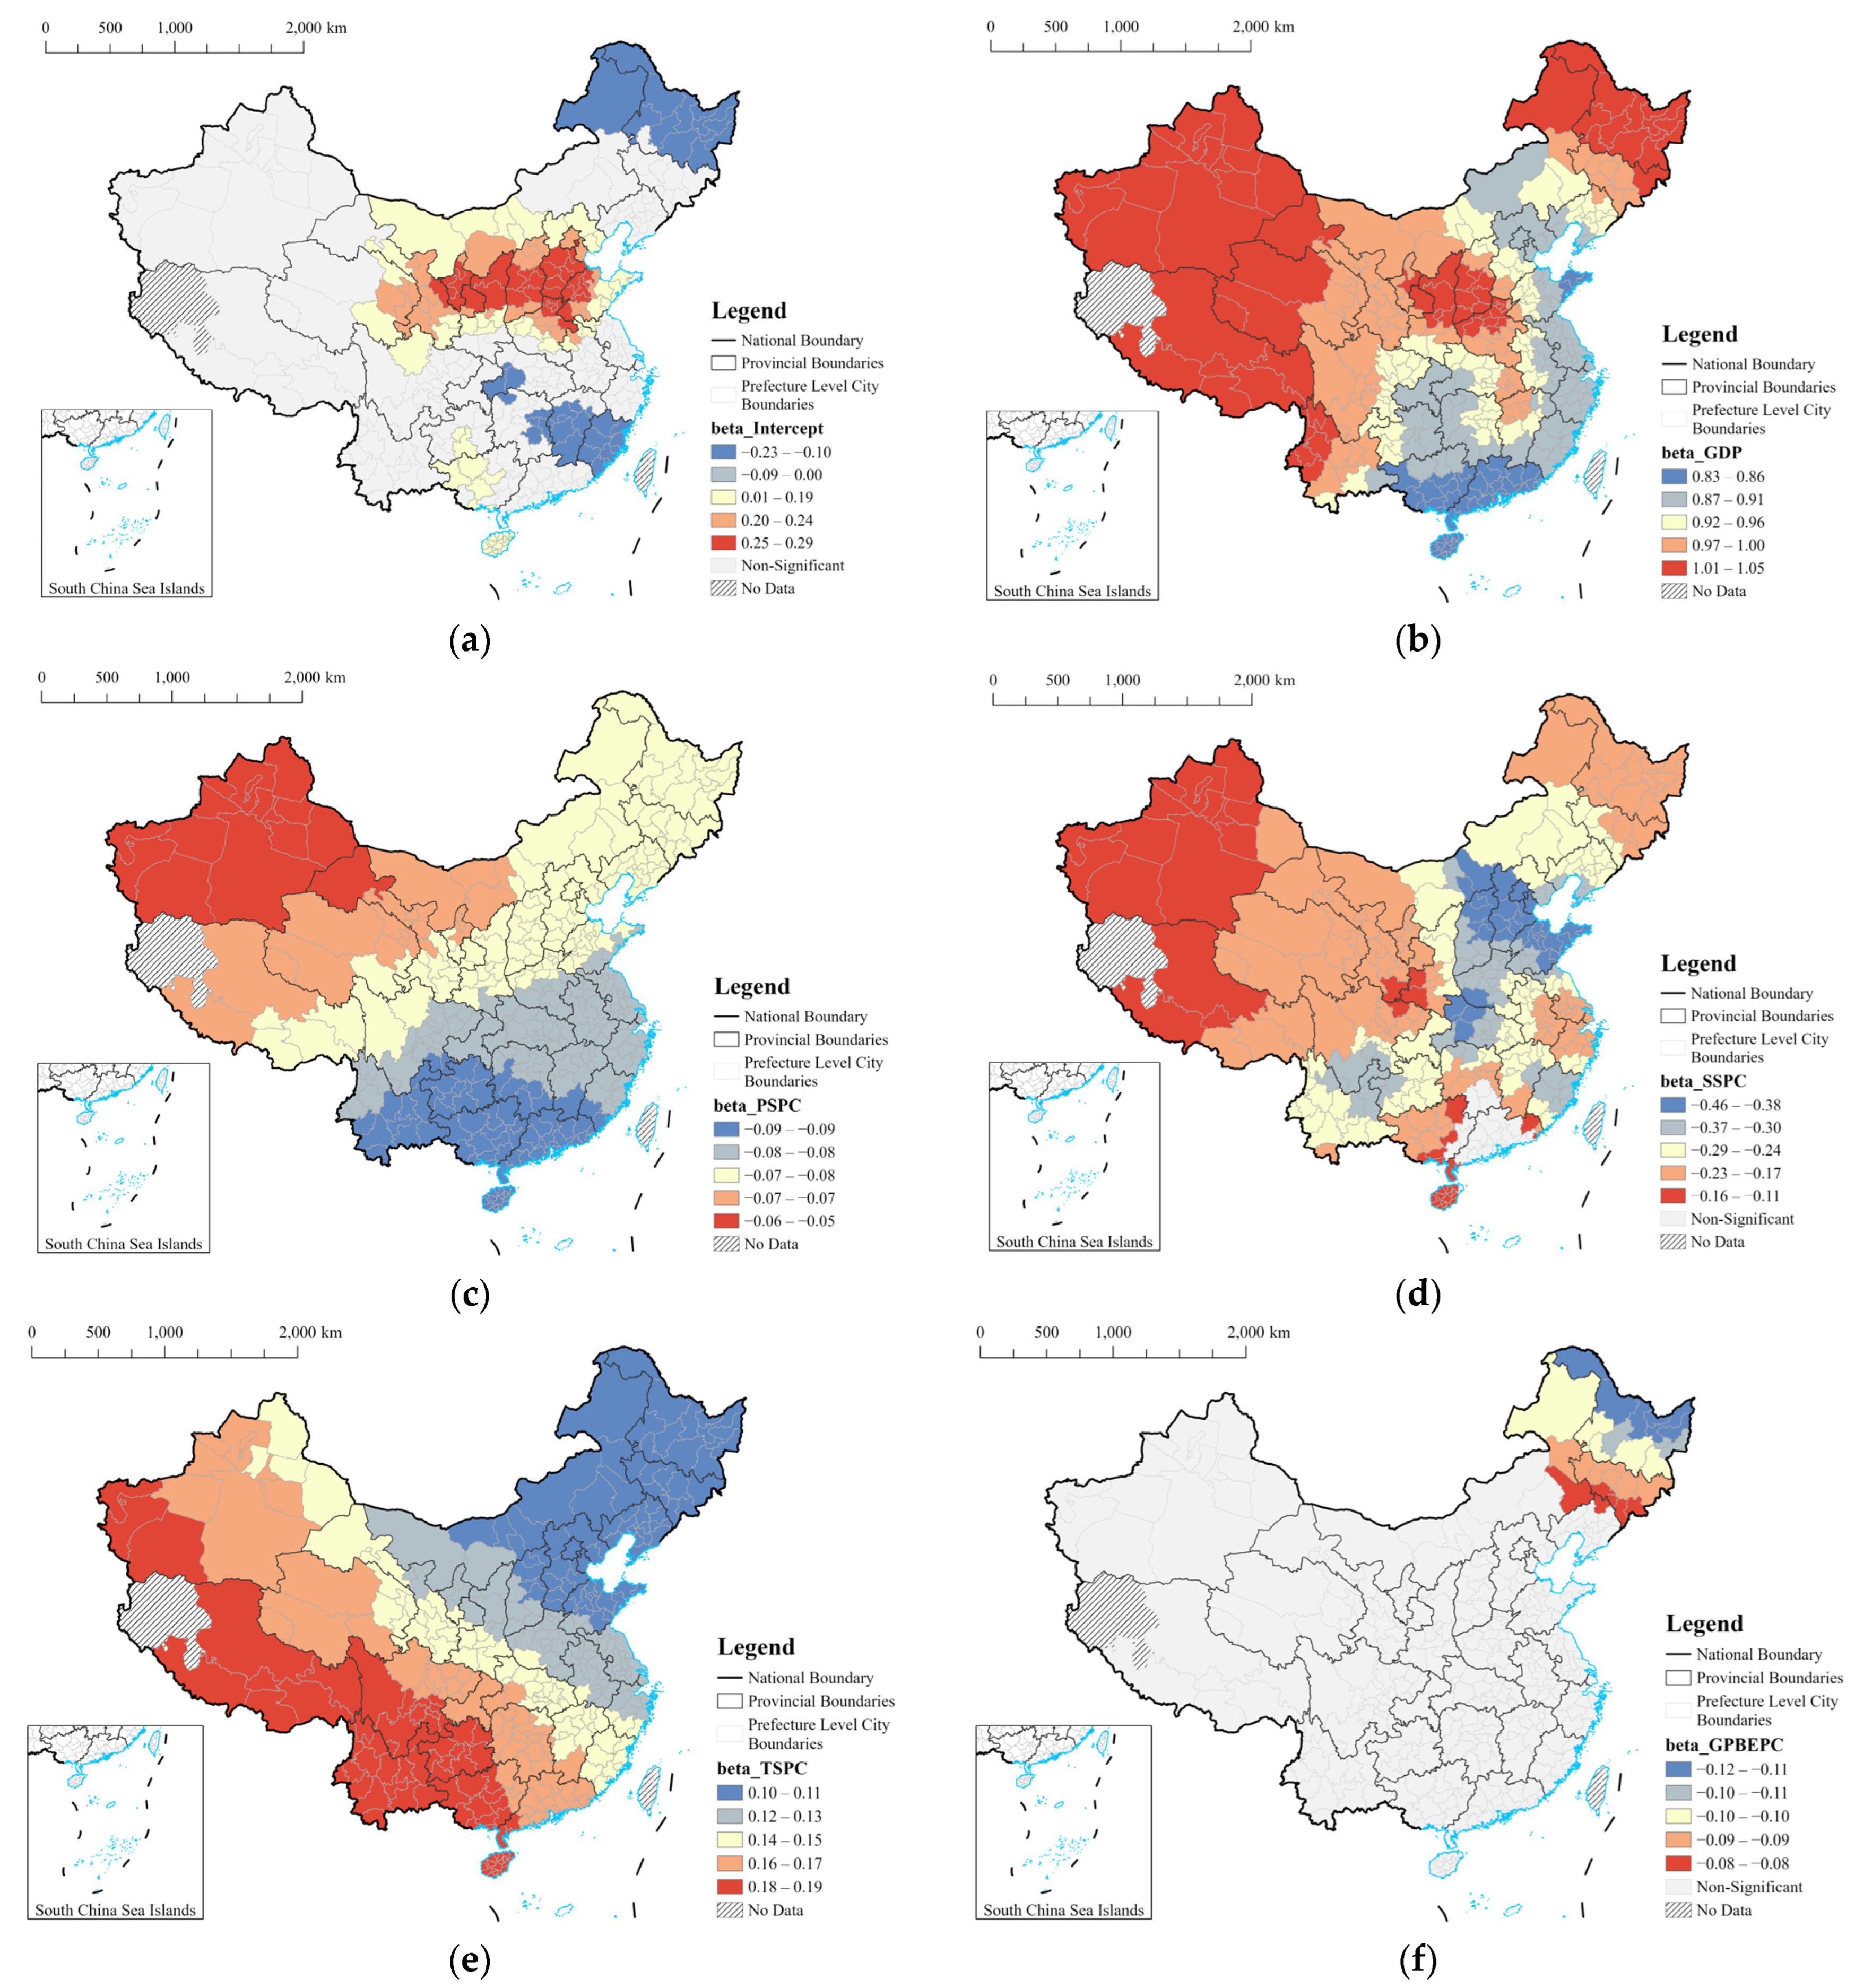
The research results reveal that the inter-city population movement of cities in different regions of China is evidently influenced by distinct factors. Among all the socio-economic factors, GDP and SSPC exhibit the strongest spatial non-stationarity. GDP reflects the comprehensive economic strength of a city. This positive correlation indicates a strong trend where inter-city population movement is influenced by economic factors. In the developed eastern coastal regions of China, where the differences in city size and economic scale are smaller, a functional linkage between cities has developed most rapidly and early. Inter-city functional linkages tend to exhibit a multicentric, networked character in this region. The movement of people between cities is often influenced more by specific differences in industrial structures than by a strong hierarchical structure based on city size and scale. The PRD and YRD regions serve as representatives of such urban regions where inter-city population movement has formed a network and established a more functional polycentric structure compared to other urban regions [62]. We argue that these functional urban regions no longer focus solely on the economic size and hierarchy of individual cities but emphasize the role played by specific city functions in shaping inter-city connections. Taking the YRD region as an example, a large number of people commute or engage in business travel between Shanghai and its surrounding areas on a daily basis. The mechanisms driving inter-city population movement in this region can be categorized into two types: the attraction of advanced producer services in Shanghai’s central urban area and the attraction of advanced manufacturing in Shanghai’s suburbs [11]. Similar processes also occur in the PRD, taking Guangzhou and Shenzhen as examples, whose industrial structures can also support such daily travel [63,64]. In the underdeveloped regions of western and northeastern China, where there is greater disparity in city size represented by GDP, the coefficients for GDP in these areas are larger. This suggests that, for an equivalent economic scale, when located in the western and northeastern regions, a city tends to exhibit stronger centrality within the region. This results in more inter-city population movement, with individuals flowing towards these economically significant cities for various activities.
For SSPC, the primary industrial sector often exhibits agglomeration effects, where industry chains and related industrial categories tend to cluster in close spatial proximity, thereby reducing costs related to labor, transportation, and more. Additionally, for many industries, especially capital-intensive ones like mining and traditional heavy industries, there is no frequent need for population movement along with its associated informational and economic effects. Traditional mining and heavy industries in China are concentrated in the northern and inland regions, such as coal mining in Shanxi and heavy industries in Wuhan and Chongqing. These areas are currently undergoing industrial transformation, and their SSPC presents a more profound hindrance to inter-city population movement. Another perspective to consider in the discussion of industrial functions is industrial agglomeration and division of labor. Cities with similar industrial structures have similar labor demands [65], and cities with complementary industries are more likely to interact with each other [66]. Both theories support the findings of this study, as the distribution of SSPC coefficients in the YRD and PRD regions intuitively reflects this phenomenon. Unlike other regions, the PRD, especially cities like Guangzhou and Shenzhen, is the most developed area in the country for the manufacturing of electronic information, including computers, electronics, and new energy. As noted in other studies, innovation cities are becoming hubs for population movement, with emerging industries such as healthcare, sports, tourism, electronics, and the internet serving as pillars and sources of vitality for urban innovation [31]. The emerging manufacturing-oriented secondary industry in the PRD is not only labor-intensive but also technology-intensive. This characteristic leads to a significant flow of both labor and technical personnel within this region, resulting in an increase in inter-city population movement. The YRD is undergoing a similar process, where a portion of SSPC with a similar output has a promoting effect on inter-city population movement rather than an inhibiting one, making its coefficient values closer to 0 compared to other regions. However, in the case of the Beijing–Tianjin–Hebei region (BTH), which is also the most developed city agglomeration in China, the underlying processes driving inter-city population movement differ from the aforementioned regions. On the one hand, the economic disparities among cities in the BTH are substantial, with Beijing exerting a pronounced polarizing effect [67]. On the other hand, the industrial structure in the BTH significantly differs from that in the YRD and the PRD. Beijing, as the political and economic core, possesses strong centrality due to a large number of central enterprises and headquarters. This has resulted in high inter-city population movement within the city. However, for surrounding cities, this centrality does not radiate or contribute to their development [68]. The industrial structure in these surrounding cities is less advanced, lacking the formation of an industrial chain, which hinders population mobility [69].
Therefore, this study employed the MGWR model to explore the spatial distribution of the relationship between socio-economic factors and inter-city population movement from the perspectives of spatial non-stationarity and scale. The findings of this study, as indicated by the bandwidth and coefficient distributions of the model, reveal that various socio-economic factors influence inter-city population movement at different scales. Moreover, the economic disparities among Chinese cities and regions have led to different processes shaping the pattern of functional linkages. While the notion of factor mobility and functional centers is frequently mentioned in the development strategies and planning of various regions in China, this study provides compelling evidence that even among the well-known mature urban agglomerations of the BTH, the YRD, and the PRD, the coefficient distributions of the model parameters exhibit significant variations. This indicates that the driving mechanisms behind the centrality of urban functions also differ considerably, so it is problematic to directly use developed urban agglomerations as a reference for the development of urban regions in eastern and western China. Therefore, it is crucial to acknowledge the implications of such spatial non-stationarity and formulate regional development strategies based on the differences observed across regions.

4.2. The Role and Limitations of MGWR Model

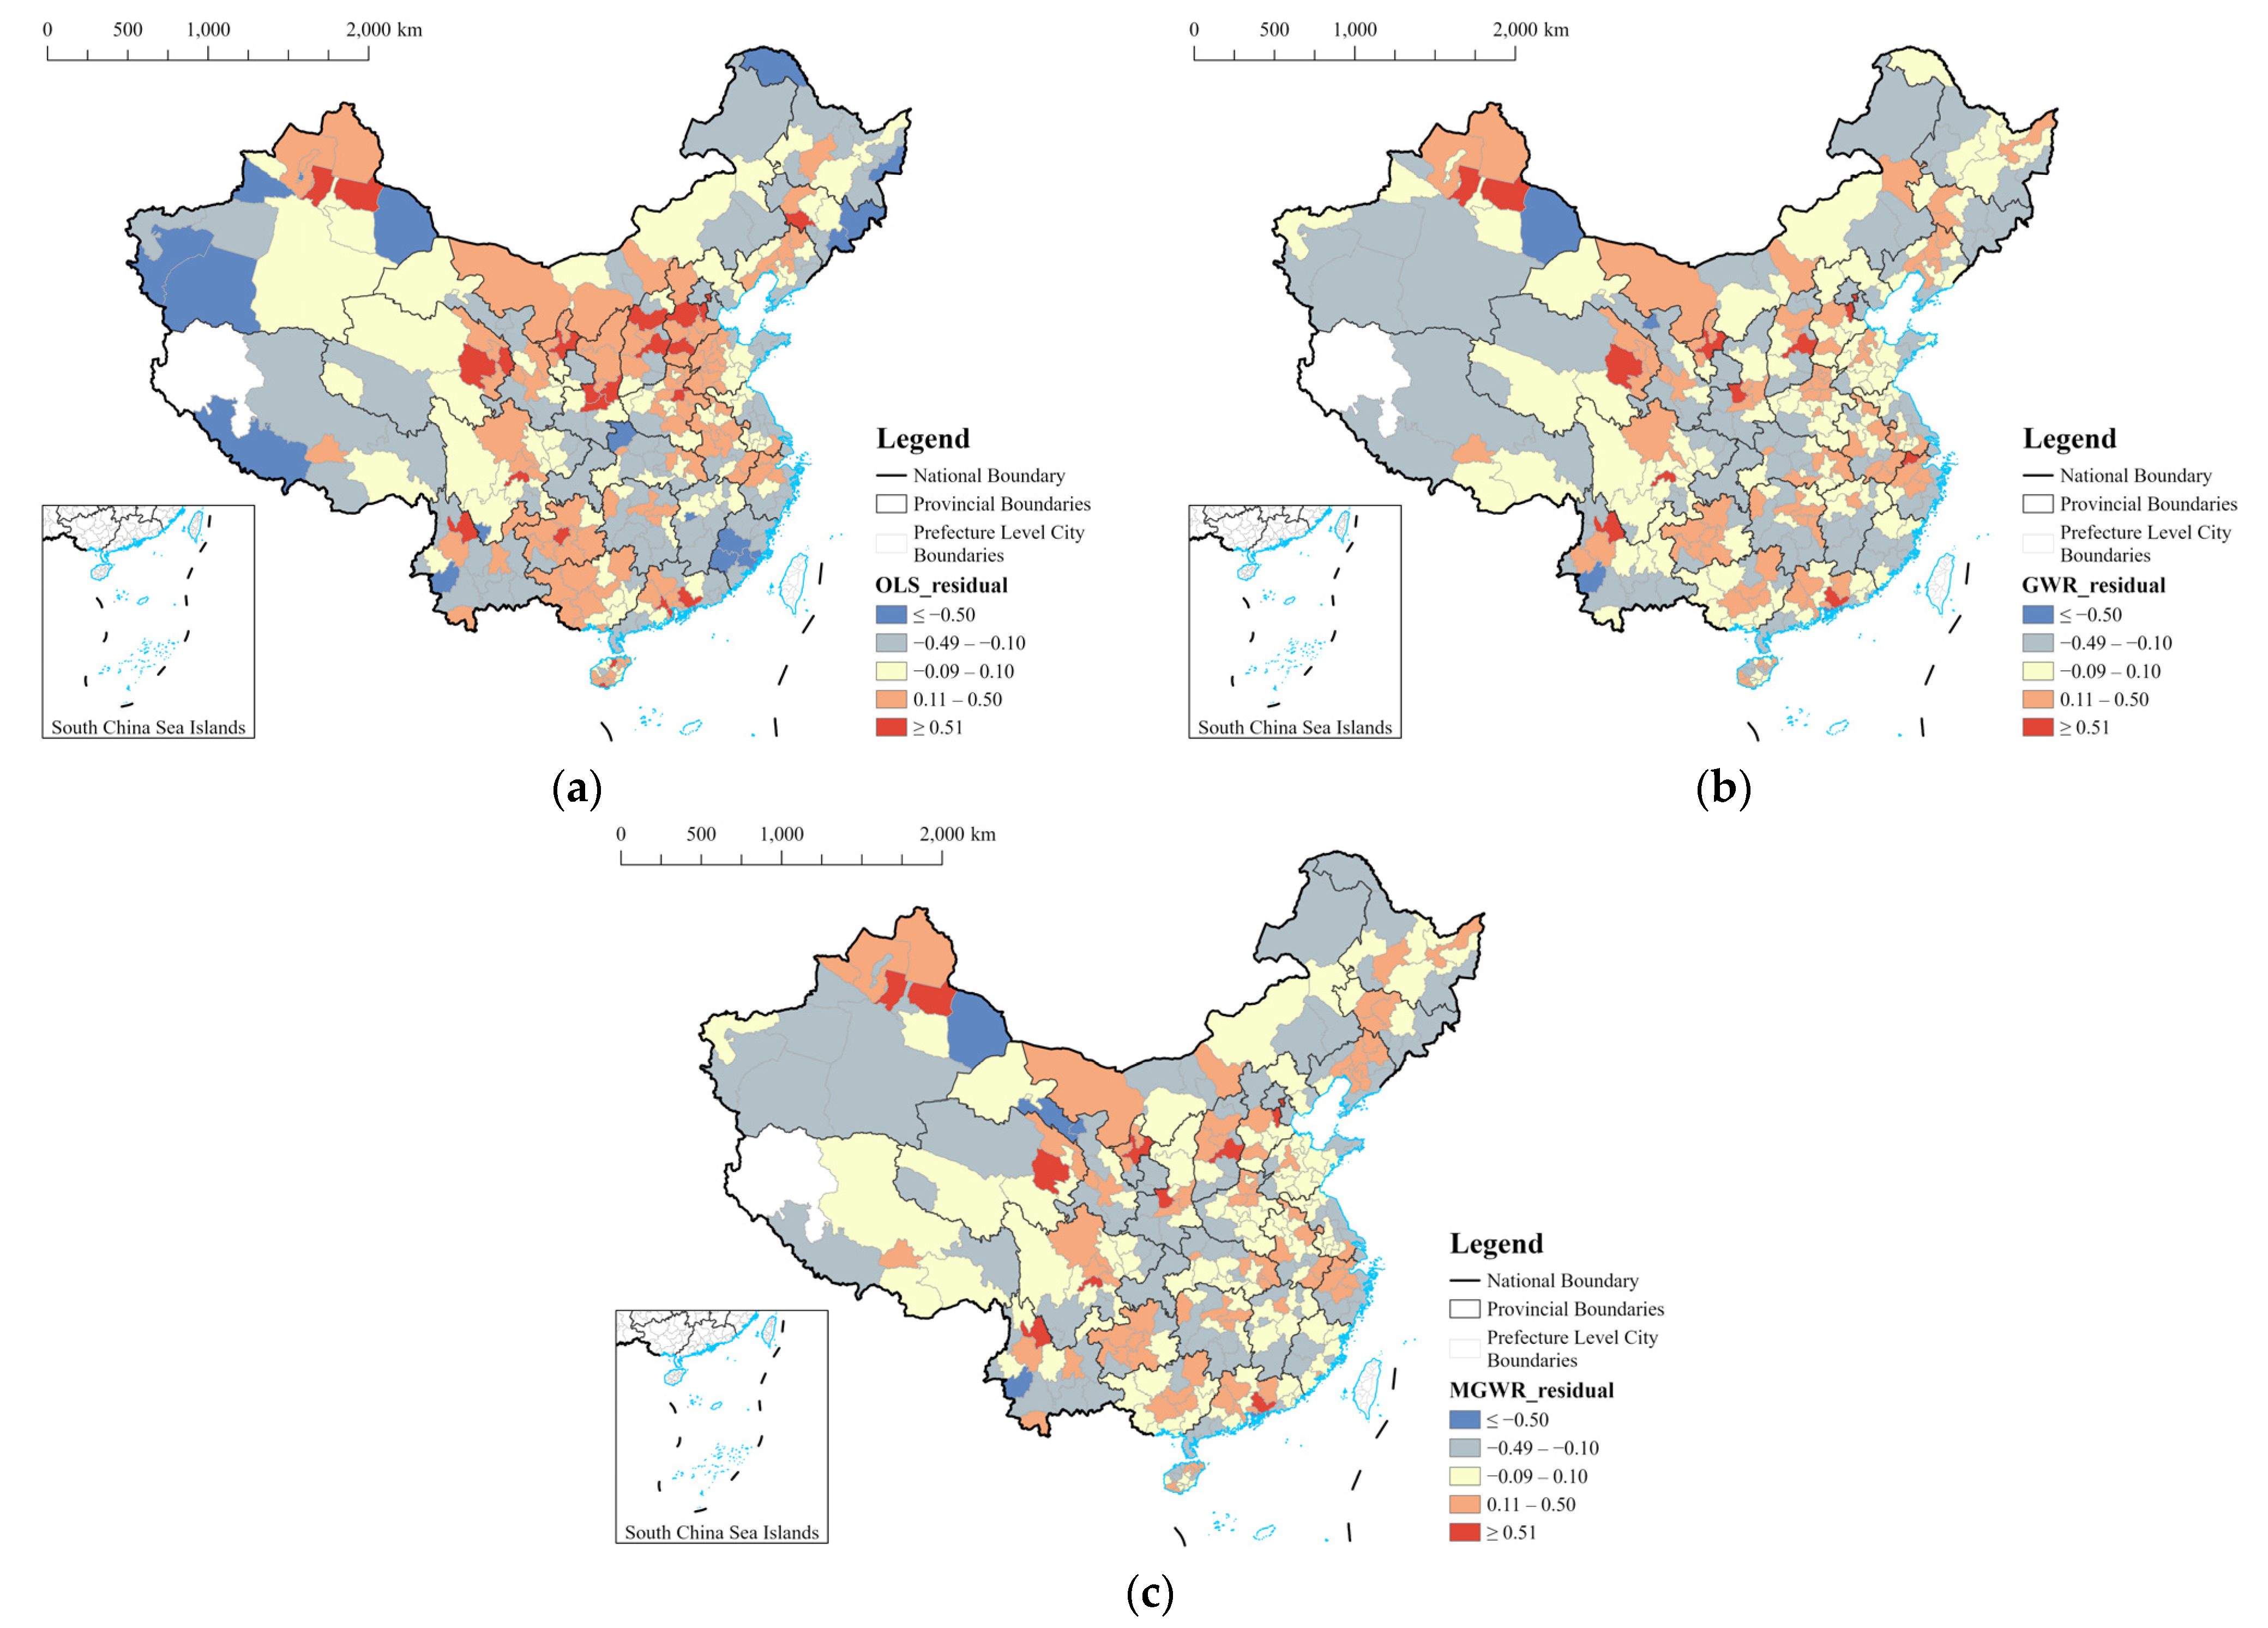
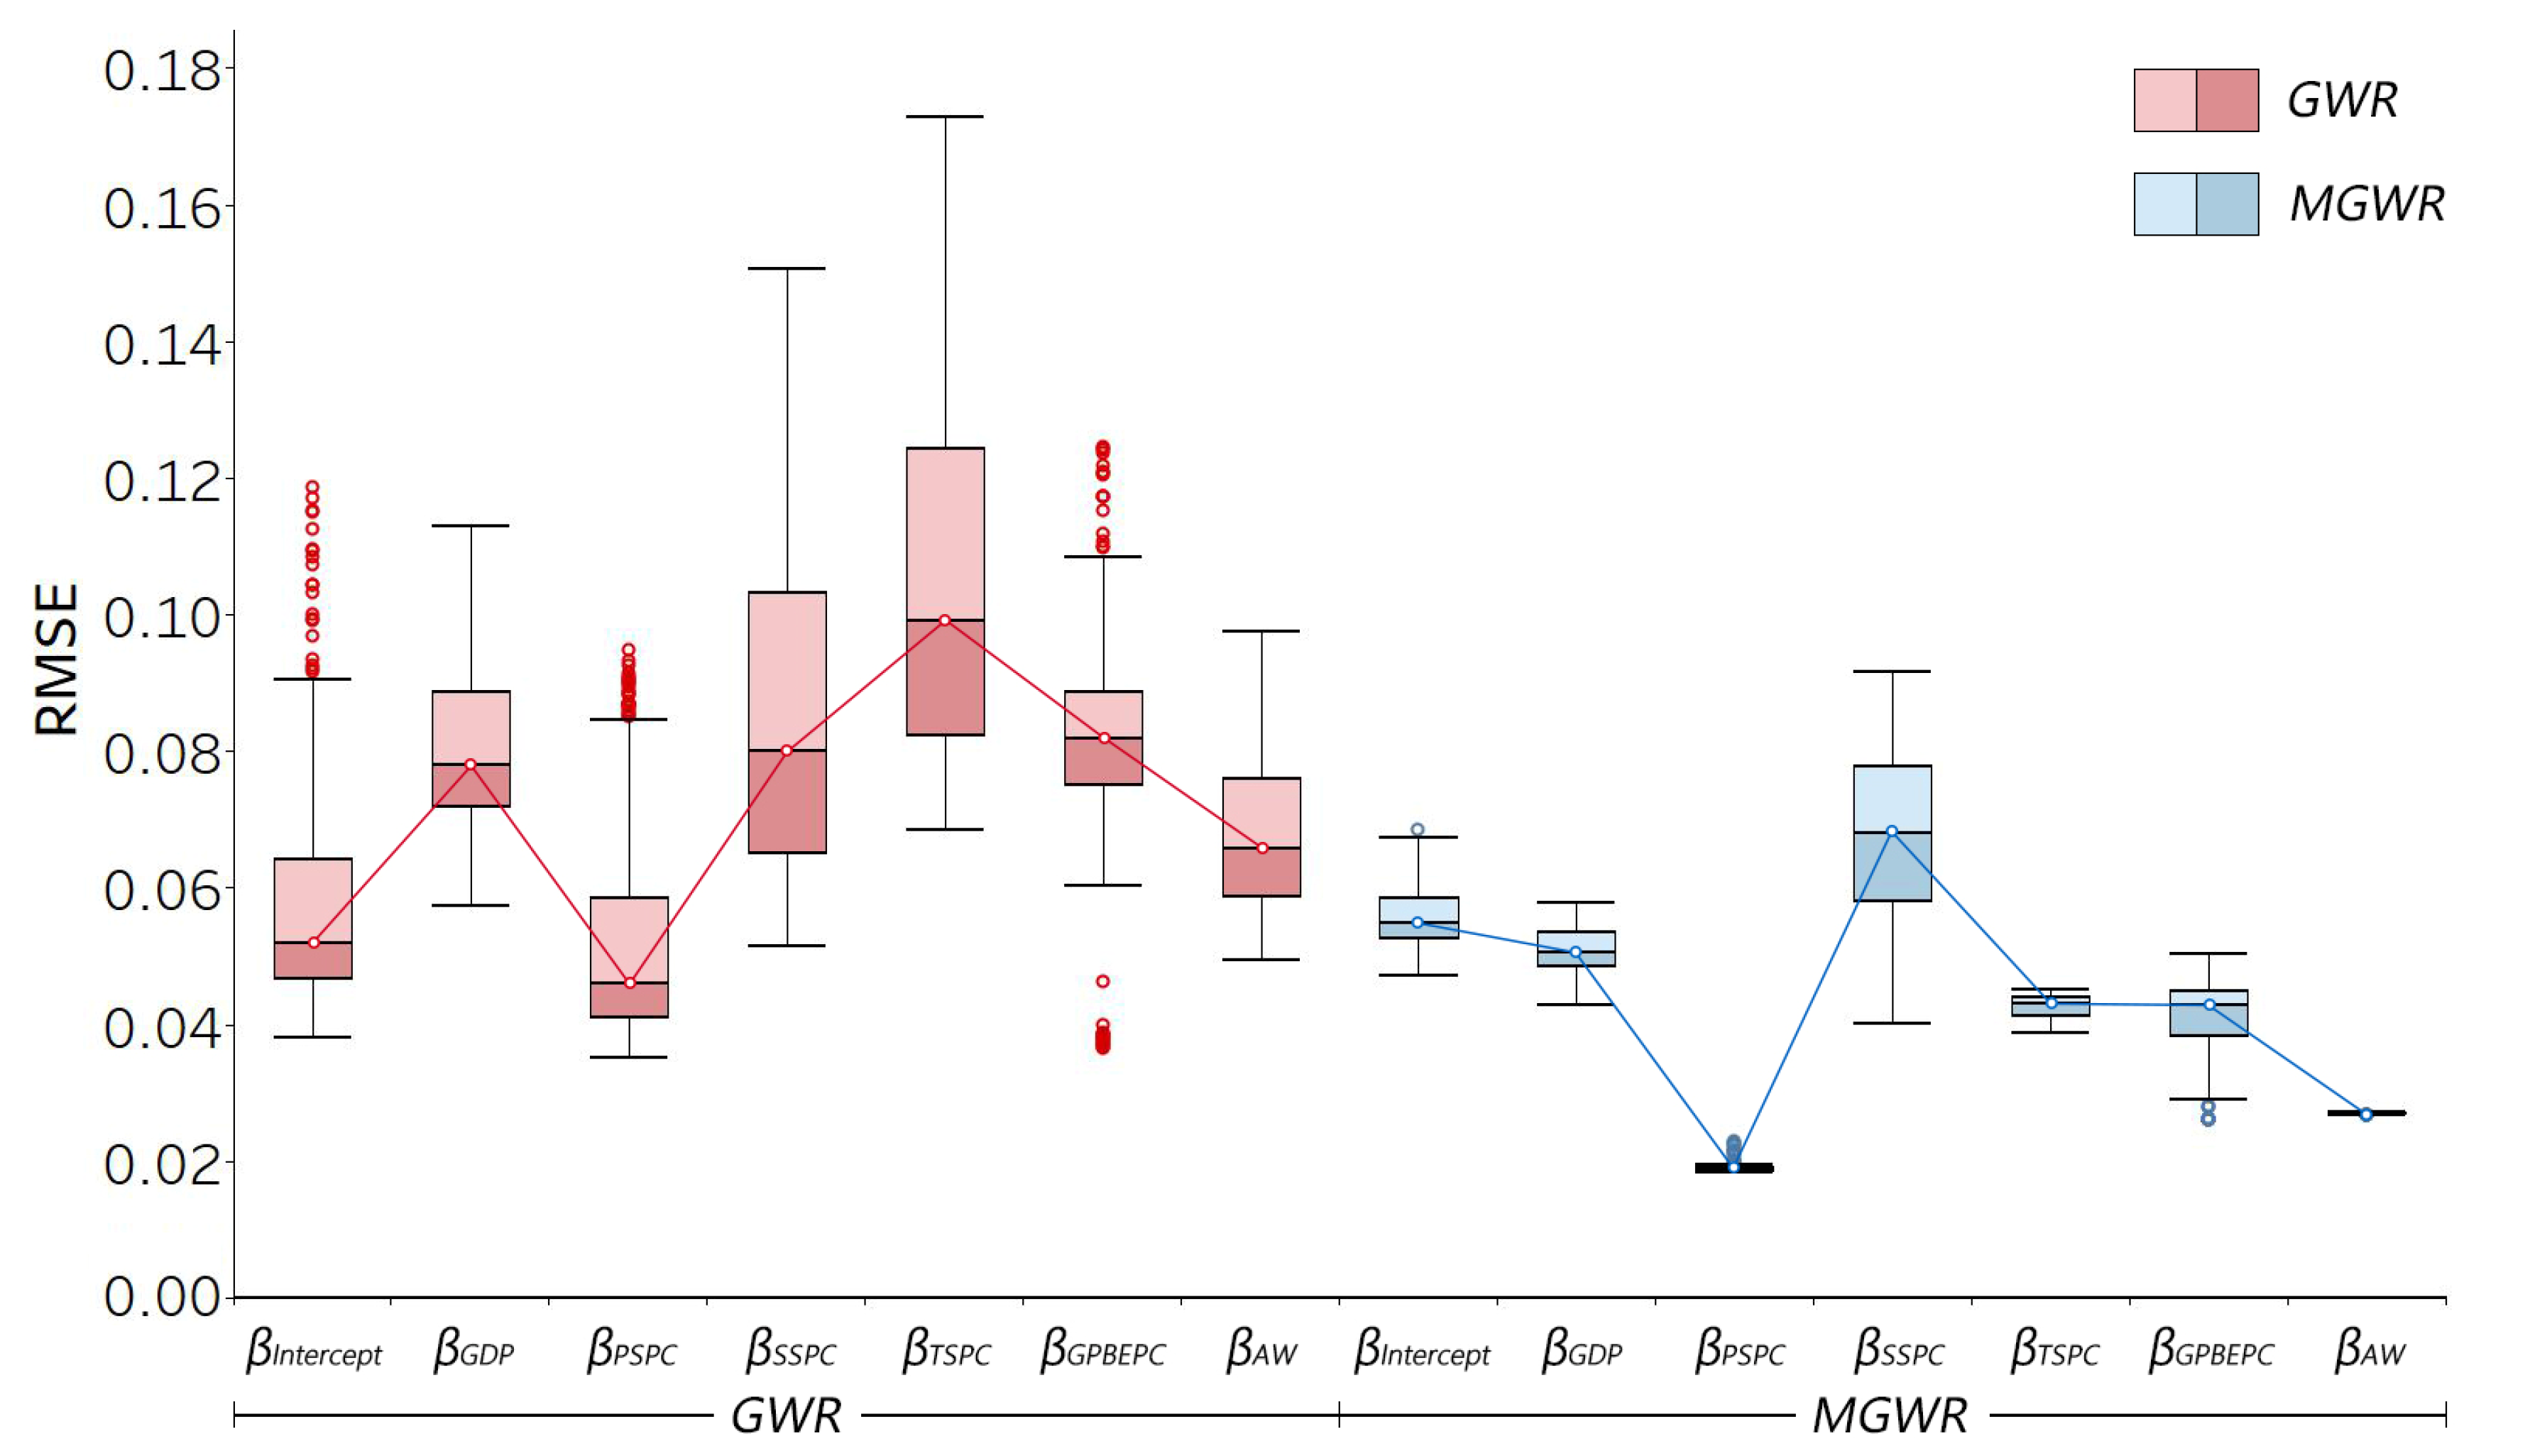
This study compared three models and ultimately found that the MGWR model shows advantages over the other two, both global and local, when discussing the spatial relationships between inter-city population movement and socio-economic determinants. This superiority is mainly attributed to the MGWR model breaking the assumption of discussing relationships at a fixed spatial scale. It facilitates the discussion of the underlying mechanisms. Through the establishment of the MGWR model, this study discovered that GDP and SSPC influence inter-city population movement at a smaller spatial scale. This allows for a more in-depth exploration of the mechanisms behind the economic development imbalance and the impact of industrial structure on inter-city population movement in eastern and western Chinese cities. Another crucial finding is that PSPC, TSPC, and GPBEPC influence the scale of inter-city population movement at an almost global scale, a result not revealed by the GWR model. The implied mechanisms behind this result could be that the first sector tends to have a more localized industrial chain, requiring less frequent population movement and the associated support of information and economic flows. In contrast, the third sector relies less on geographical proximity, leading to population and information flows that are more network-oriented. Numerous studies on global cities support this explanation, emphasizing that advanced producer service centers in cities like New York and London primarily serve a global rather than local function [58,70]. Similarly, China’s advanced producer service centers often function as national rather than regional hubs [64]. These conclusions owe much to the MGWR model’s ability to consider variable scales, representing the core findings and results of this paper.
Expanding from the conclusions of this study, another advantage of MGWR is that it can be used as a model to explore large-scale and fine-grained spatial processes, providing the possibility of exploring the influencing factors behind population movement in smaller spatial units, for example, further discussing inter-city population movement and the influencing factors behind it in the whole of China (or a similarly large country or region) with smaller units (e.g., districts and counties). In regions like China, which faces huge geographical disparities and immensely variable spatial heterogeneity of all kinds of factors, the results obtained from the general global model should be locally unreliable, and the single optimal bandwidth of the GWR model will be meaningless. In this sense, the advantages of MGWR in creating different scales for each process will be even more pronounced.
Despite its advantages, MGWR, as a multiscale local regression model, also has limitations. While multiscale regression provides more detailed information for each process, contributing to a more accurate model fit, increased information would complicate the interpretation of the model outcomes. As the MGWR model operates with moving window regression, challenges lie in aligning the spatial scale with fixed real-world policy boundaries. For instance, the optimal bandwidth for SSPC obtained in this study is 50. This implies a relatively homogeneous spatial relationship with the surrounding 50 cities for each city, but this scale may not correspond directly to any specific regional policy in China. Therefore, variable scaling can offer a more accurate reference for explaining mechanisms, but it may not be directly applicable to specific regional policies due to the difficulty of aligning spatial scales with real-world regional planning and management boundaries.

4.3. The Role and Limitations of Big Data

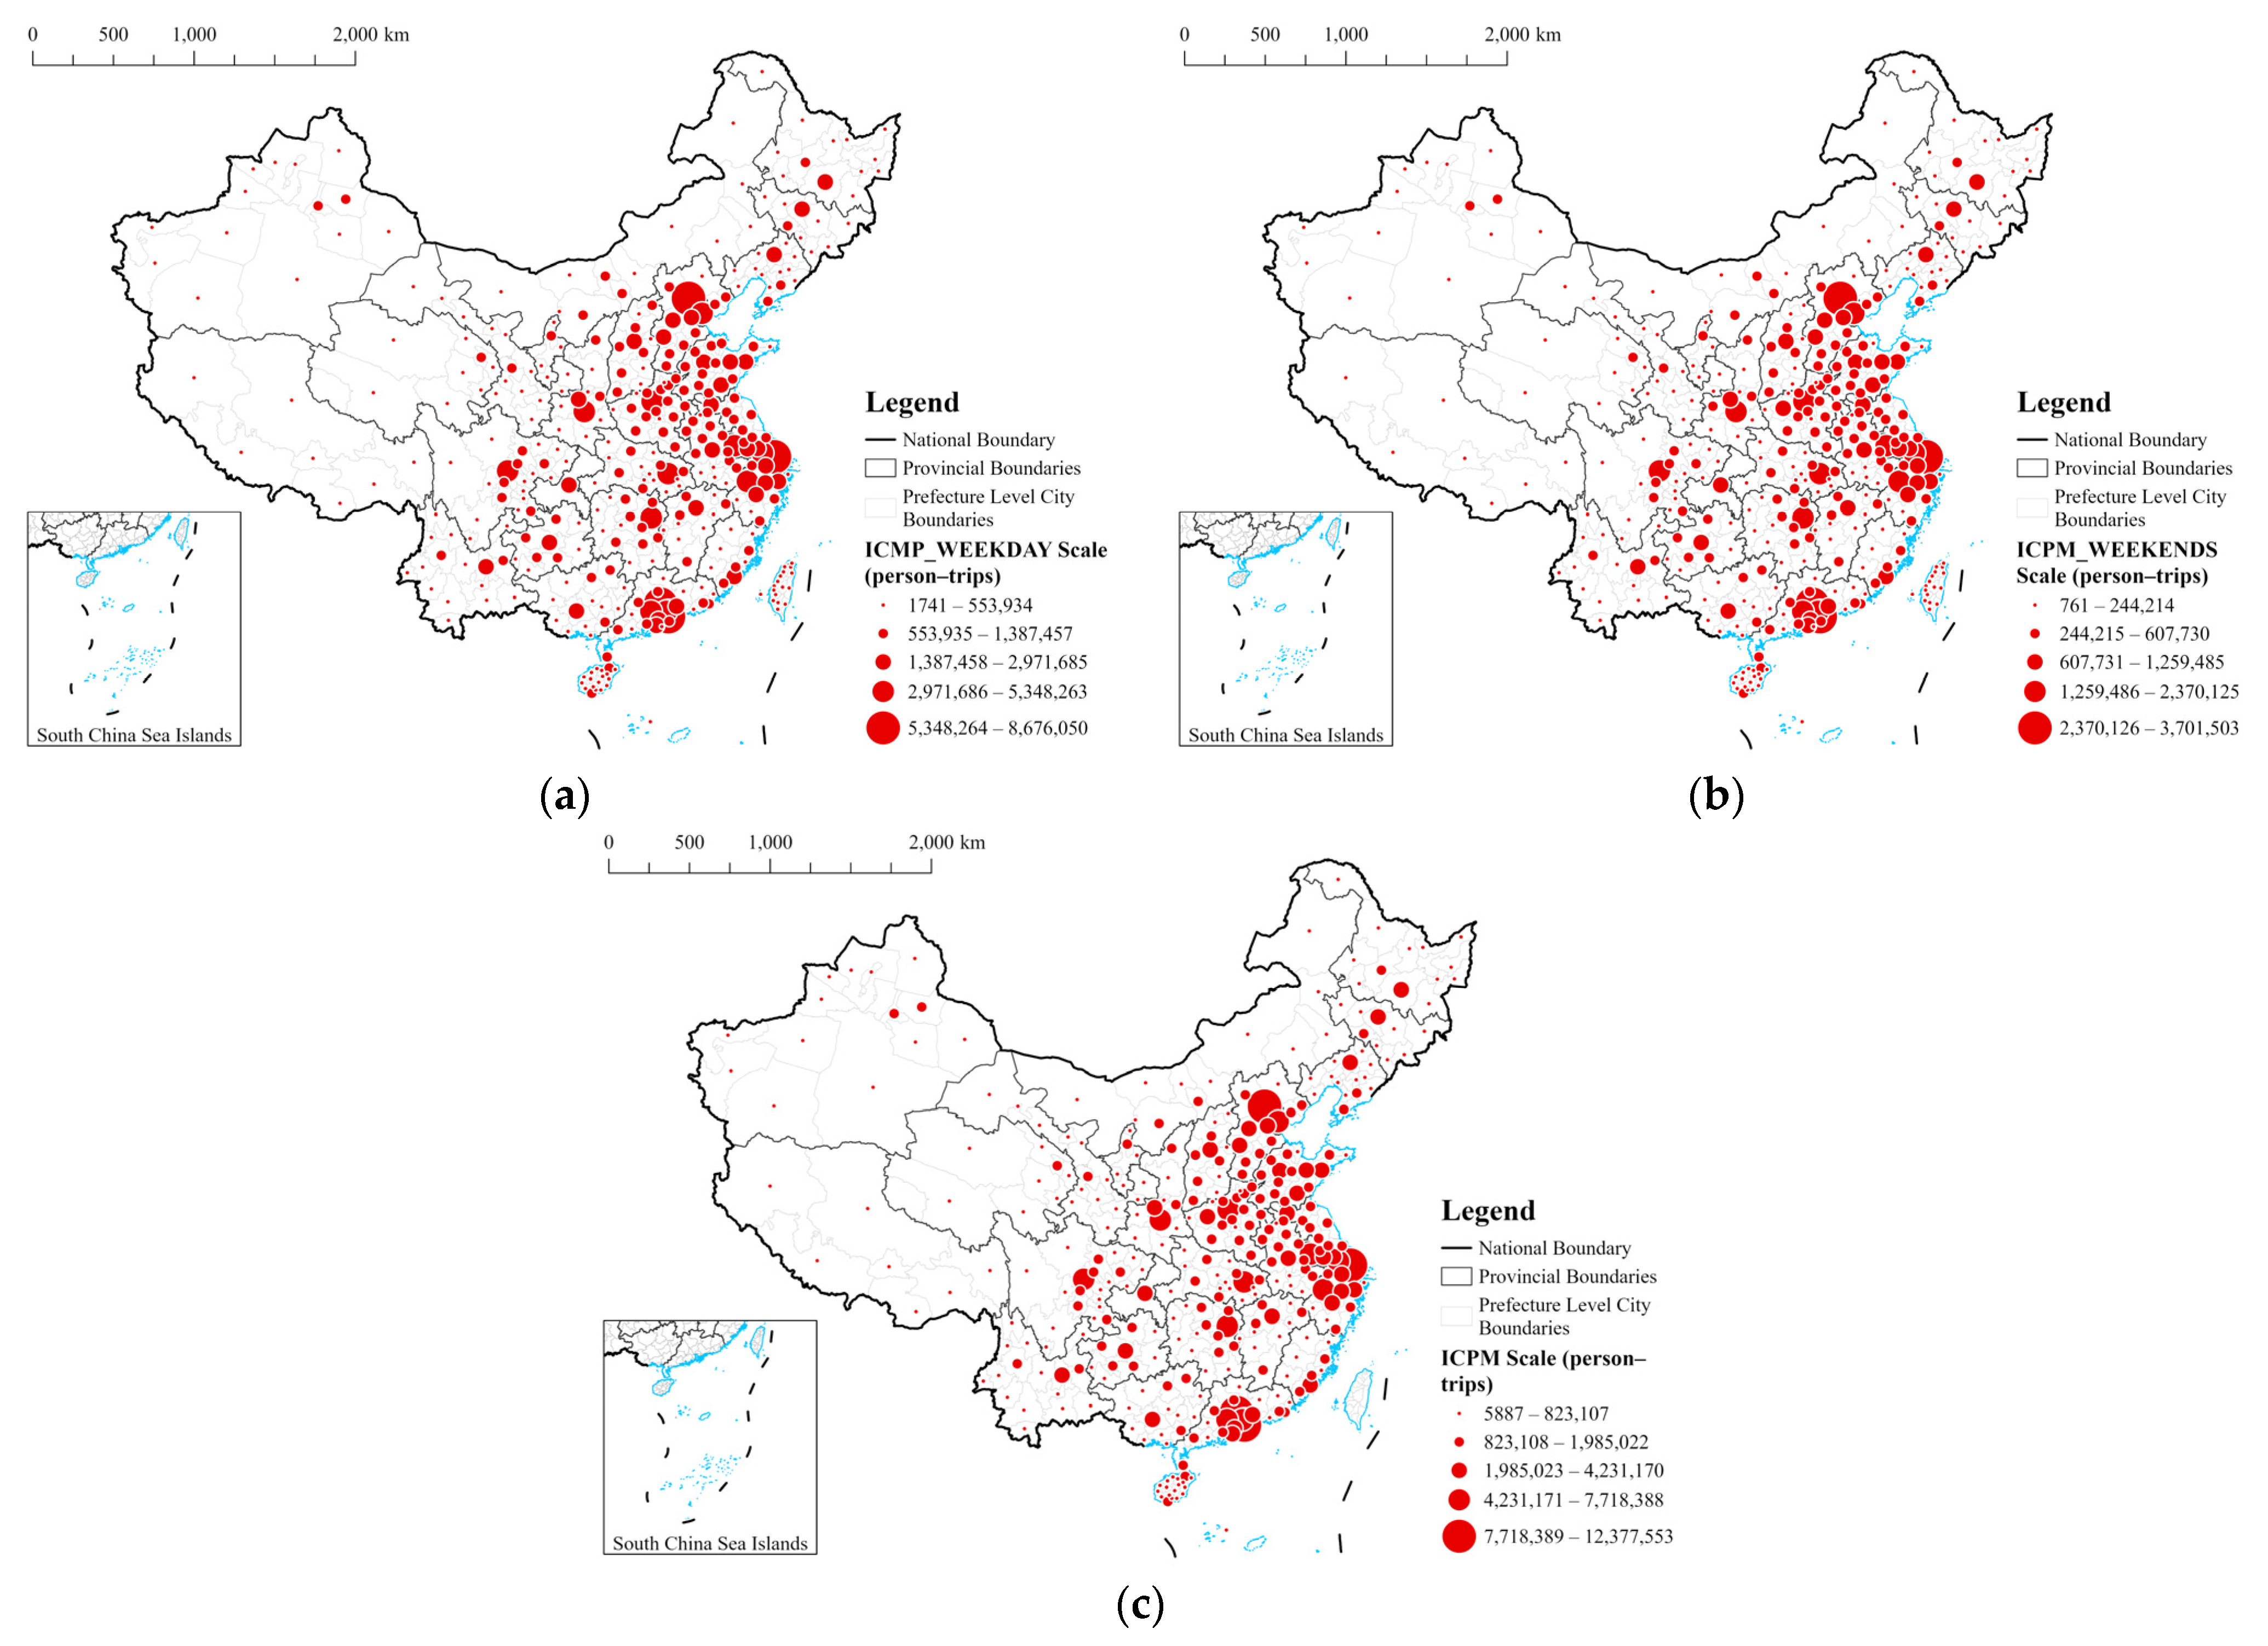
Traditional statistics are inadequate in discussing inter-city population movement and its associated socio-economic factors. In China, government statistics on population movement in 5- or 10-year intervals only reflect the results and distribution of long-term population movement, thus ignoring the real-time dynamics of short-term inter-city population movement. However, in the modern regional development trend where people and factors are increasingly mobile, this short-term inter-city population movement represents a more important inter-city functional linkage. For example, in the Yangtze River Delta urban agglomeration, one of the most regionally integrated areas in China, inter-city commuting has become an important research object, and its underlying socio-economic linkages have far-reaching implications for formulating regional development policies [11]. Inter-city business travel, non-commuting travel, and other types of travel also provide important references for outlining the regional spatial structure [10]. Furthermore, statistics from traditional transportation modes such as highways, railways, and airlines are limited by their own characteristics (for example, highways mostly for short-distance travel, while airlines for long-distance movements). They lack comprehensiveness as they only reveal the characteristics of real-time population movement between cities from one perspective. Spatiotemporal big data capturing a large number of population activities provide an excellent opportunity to explore such short-term, real-time inter-city population movement linkages because they reveal instantaneous population movement characteristics that encompass the full range of means of transport. Thus, the use of big data is the basis for quantitatively measuring the influences behind inter-city population movement, allowing the question to expand from traditional population migration to the exploration of the relationships between day-to-day inter-city population movement and socio-economic factors. The findings of this study not only support part of the theory of population migration, that migration in China is primarily driven by economic disparities between regions [29,34], but also discover differences in the driving forces behind short-term versus long-term population migration, in which average wage and public services are not the strongest drivers.
Yet big data also have their limitations. Due to the need to protect personal privacy, the LBS data that can be accessed have already been added into a prefecture-level city-wide unit, with prefecture-level cities as the starting points and arriving points. This makes it impossible to further subdivide the arriving city spatial unit. If the population movement could be counted in smaller spatial units (e.g., district and county units, which could distinguish between urban and rural areas), the model might yield new results that would better reveal the influencing factors and their spatial non-stationarity and scale variation. And the current findings are valid only for prefecture-level city spatial units. Therefore, our further research may be based on obtaining more precise data on population movement in spatial units to further discuss the influencing factors of inter-city population movement with the MAPE problem in mind (e.g., the average wage level may become a significant influencing factor when rural and urban areas are distinguished).

5. Conclusions

Spatial non-stationarity has become an important strand to consider when exploring spatial issues such as the factors influencing inter-city population movement. However, the spatial heterogeneity of the individual spatial variables, as a rule, leads to significant differences in the scales of action of the individual processes. Building global models or GWR models with a single optimal bandwidth alone can no longer accurately describe spatial processes in this context. We demonstrate the following conclusions by building three models, namely OLS, GWR, and MGWR, for the scale of inter-city population movement and socio-economic factors in China.
A spatial relationship exists between inter-city population movement and socio-economic factors, and the MGWR model proves to be a powerful tool for exploring this spatial relationship. Local regression models are more reliable than global regression models for the relationships between inter-city population movement and socio-economic factors, and considering different scales of the relationships between variables is a very important factor for exploring spatial non-stationarity. The results of this study show that the goodness-of-fit and the spatial heterogeneity of the residual distribution of both local regression models are better than the global regression model. Furthermore, the traditional GWR model has unrobust results in more spatial units, while the biggest change and advantage of MGWR is that it can reflect the scale of influence of different independent variables on the dependent variables, and its regression results are more reliable and pass the significance test in more spatial units.
Different socio-economic factors exhibit varying impacts on inter-city population movement at different spatial scales. Another important conclusion of this study is the identification of the optimal bandwidth for each variable, providing a scale of the relationships between different socio-economic factors and inter-city population movement, which change with spatial variation. The results show that each socio-economic factor does act on inter-city population movement at different scales due to the large differences in their spatial autocorrelation. For example, PSPC, TSPC, and GPBEPC act at global and near-global scales, while SSPC affects inter-city population movement at a very local scale.
The MGWR model provides a more precise mechanism for explaining regional development disparities in China, highlighting significant differences in the driving forces of development across various regions. This study further analyzes the spatial distribution characteristics of the parameter estimates for each independent variable and seeks to acquire a further understanding of the spatial non-stationarity of each type of these relationships through parameter estimation and the role played by the spatial scale. The research findings indicate that there is relatively balanced development among cities in the economically developed eastern coastal regions of China. The YRD and PRD, characterized by the second sector dominated by advanced manufacturing and the third sector represented by advanced producer service sectors, significantly promote inter-city population movement. In contrast, the BTH maintains a pronounced polarization effect in terms of economic scale and industrial structure, following the lead of Beijing. Meanwhile, China’s inland regions continue to uphold the scale effect, with the economic volume represented by GDP being the most significant factor driving inter-city population movement.
Through the above conclusions, this paper addresses two research questions, revealing the spatial relationships between inter-city population movement and socio-economic determinants in China. Furthermore, it delves into the driving factors and mechanisms behind the uneven regional development represented by these spatial relationships. The primary contribution of this paper lies not only in uncovering regional differences in the driving factors behind inter-city population movement in China but also in emphasizing that such differences may have a reference value in other regions worldwide. Firstly, for developing countries and regions, an increase in total economic output is crucial. Through quantitative research, this paper finds that, in underdeveloped regions similar to China’s central and western areas, the economic scale represented by GDP is the most important factor attracting population mobility. This implies that, in developing regions, policymakers should prioritize increasing the overall scale to stimulate the aggregation of the overall job market and factor mobility, thereby enhancing overall regional competitiveness. Secondly, in relatively developed regions where the general economic scale has reached a certain level, the adjustment of industrial structure becomes more critical. Developed regions worldwide have generally formed industrial systems based on advanced manufacturing and advanced producer service industries, such as in New York and London. The findings of this paper support existing research conclusions about these two types of industries. The high-tech and innovative attributes of advanced manufacturing stimulate inter-city population movement within their agglomerated regions, while the globalized nature of advanced producer services neglects geographical proximity. Therefore, although this paper is based on empirical research in China, its results have general applicability and can provide a reference foundation for relevant studies in other countries and regions worldwide. Therefore, in subsequent research, it is advisable to attempt to extend the MGWR method to other countries and regions to further explore and demonstrate the differences and commonalities in the driving mechanisms of inter-city population mobility across different regions.

Author Contributions

Conceptualization, Sihan Liu and Xinyi Niu; data curation, Sihan Liu and Xinyi Niu; formal analysis, Sihan Liu and Xinyi Niu; funding acquisition, Xinyi Niu; methodology, Sihan Liu; project administration, Xinyi Niu; resources, Xinyi Niu; software, Sihan Liu and Xinyi Niu; supervision, Xinyi Niu; validation, Sihan Liu and Xinyi Niu; visualization, Sihan Liu; writing—original draft, Sihan Liu; writing—review and editing, Xinyi Niu. All authors will be informed about each step of manuscript processing, including submission, revision, revision reminder, etc., via email from our system or assigned Assistant Editor. All authors have read and agreed to the published version of the manuscript.

Funding

This research was funded by the National Key Research and Development Program of China, grant number 2022YFC3800804.

Data Availability Statement

LBS data are not publicly available to preserve privacy. Social-economic data were obtained from public websites (http://www.stats.gov.cn/sj/, accessed on 1 June 2023).

Conflicts of Interest

The authors declare no conflicts of interest.

Appendix A

Table A1. Comparison of inter-city population movement scale on weekdays and weekends (top 25).
CityAverage ICPM on WeekdaysAverage ICPM on WeekendsAverage ICPMRank of ICPM on WeekdaysRank of ICPM on WeekendsRank of ICPM
Beijing867,605925,376884,111111
Shanghai717,205772,691733,058222
Guangzhou702,078767,433720,751333
Shenzhen577,905646,263597,436444
Chengdu534,826592,531551,313555
Zhengzhou481,768538,264497,910666
Hangzhou476,662530,953492,173777
Suzhou466,610513,835480,103888
Xian442,618491,297456,526999
Dongguan419,376461,324431,361101010
Foshan395,914426,039404,521111111
Wuhan366,952403,589377,420121212
Nanjing356,433401,243369,236131313
Changsha349,479387,844360,440141414
Tianjin312,637341,661320,929151515
Chongqing297,169314,871302,226161616
Jinan269,413296,731301,325181717
Hefei264,813295,163273,484191818
Langfang269,868279,966272,754172019
Wuxi258,828289,644267,632201920
Kunming237,331249,196240,721212121
Shenyang236,646245,556239,192222222
Shijiazhuang224,252236,818227,842232523
Guiyang215,103235,793221,014242624
Baoding212,001241,722220,493252325
Figure A1. (a) Spatial distribution of average inter-city population movement scale on weekdays; (b) spatial distribution of average inter-city population movement scale on weekends; (c) spatial distribution of average inter-city population movement scale in all research periods.
Ijgi 13 00129 g0a1

References

  1. Hall, P.G.; Pain, K. The polycentric metropolis: Emerging mega-city regions. In The Polycentric Metropolis: Learning from Mega-City Regions in Europe, 1st ed.; Earthscan: London, UK, 2006; pp. 3–18. Available online: https://books.google.com/books?id=UYb6Kfgo8O8C&lpg=PR1&ots=-jc-B0rWd5&dq=The%20polycentric%20metropolis%3A%20emerging%20mega-city%20regions&lr&hl=zh-CN&pg=PR2#v=onepage&q=The%20polycentric%20metropolis:%20emerging%20mega-city%20regions&f=false (accessed on 20 January 2024).
  2. Hall, P.G. Looking backward, looking forward: The city region of the mid-21st century. Reg. Stud 2009, 43, 803–817. [Google Scholar] [CrossRef]
  3. Hall, P.G.; Pain, K.; Green, N. The information geography of Europolis: Mapping the flow of information. In The Polycentric Metropolis: Learning from Mega-City Regions in Europe, 1st ed.; Hall, P.G., Pain, K., Eds.; Earthscan: London, UK, 2006; pp. 70–90. Available online: https://books.google.com/books?id=UYb6Kfgo8O8C&lpg=PR1&ots=-jc-B0rWd5&dq=The%20polycentric%20metropolis%3A%20emerging%20mega-city%20regions&lr&hl=zh-CN&pg=PR2#v=onepage&q=The%20polycentric%20metropolis:%20emerging%20mega-city%20regions&f=false (accessed on 20 January 2024).
  4. Zhen, F.; Qin, X.; Ye, X.; Sun, H.; Luosang, Z. Analyzing urban development patterns based on the flow analysis method. Cities 2019, 86, 178–197. [Google Scholar] [CrossRef]
  5. Burger, M.J.; Van der Knaap, B.; Wall, R.S. Polycentricity and the Multiplexity of Urban Networks. Eur. Plan. Stud. 2014, 22, 816–840. [Google Scholar] [CrossRef]
  6. Liu, Y.H.; Tang, D.S.; Bu, T.; Wang, X.Y. The spatial employment effect of high-speed railway: Quasi-natural experimental evidence from China. Ann. Reg. Sci. 2022, 69, 333–359. [Google Scholar] [CrossRef]
  7. Pan, J.H.; Lai, J.B. Spatial pattern of population mobility among cities in China: Case study of the National Day plus Mid-Autumn Festival based on Tencent migration data. Cities 2019, 94, 55–69. [Google Scholar] [CrossRef]
  8. Zhu, R.X.; Wang, Y.J.; Lin, D.; Jendryke, M.; Xie, M.X.; Guo, J.Z.; Meng, L.Q. Exploring the rich-club characteristic in internal migration: Evidence from Chinese Chunyun migration. Cities 2021, 114, 14. [Google Scholar] [CrossRef]
  9. Lu, D.; Xiao, W.; Xu, G.; Ha, L.; Yang, D. Spatiotemporal patterns and influencing factors of human migration networks in China during COVID-19. Geogr. Sustain. 2021, 2, 264–274. [Google Scholar] [CrossRef]
  10. Li, K.K.; Niu, X.Y. Delineation of the Shanghai Megacity Region of China from a Commuting Perspective: Study Based on Cell Phone Network Data in the Yangtze River Delta. J. Urban Plan. Dev. 2021, 147, 04021022. [Google Scholar] [CrossRef]
  11. Li, Z.P.; Niu, X.Y. Exploring Spatial Nonstationarity in Determinants of Intercity Commuting Flows: A Case Study of Suzhou-Shanghai, China. ISPRS Int. J. Geo-Inf. 2022, 11, 335. [Google Scholar] [CrossRef]
  12. Zhang, L.; Han, S.S. Regional disparities in China’s urbanisation An examination of trends 1982–2007. Int. Dev. Plan. Rev. 2009, 31, 355–376. [Google Scholar] [CrossRef]
  13. Chen, Z.H.; Haynes, K.E. Impact of high-speed rail on regional economic disparity in China. J. Transp. Geogr. 2017, 65, 80–91. [Google Scholar] [CrossRef]
  14. Qi, R.Z.; Pan, J.H.; Zhang, R. Comparison of Intercity Travel Network Structure during Daily Time and Holiday in China. Complexity 2021, 2021, 15. [Google Scholar] [CrossRef]
  15. Shen, J.F. Changing Patterns and Determinants of Interprovincial Migration in China 1985–2000. Popul. Space Place. 2012, 18, 384–402. [Google Scholar] [CrossRef]
  16. Ravenstein, E.G. The Laws of Migration. J. R. Stat. Soc. 1889, 52, 241–305. [Google Scholar] [CrossRef]
  17. Song, C.M.; Qu, Z.H.; Blumm, N.; Barabasi, A.L. Limits of Predictability in Human Mobility. Science 2010, 327, 1018–1021. [Google Scholar] [CrossRef] [PubMed]
  18. Yan, X.-Y.; Wang, W.-X.; Gao, Z.-Y.; Lai, Y.-C. Universal model of individual and population mobility on diverse spatial scales. Nat. Commun. 2017, 8, 1639. [Google Scholar] [CrossRef]
  19. Schlapfer, M.; Dong, L.; O’Keeffe, K.; Santi, P.; Szell, M.; Salat, H.; Anklesaria, S.; Vazifeh, M.; Ratti, C.; West, G.B. The universal visitation law of human mobility. Nature 2021, 593, 522. [Google Scholar] [CrossRef] [PubMed]
  20. Castells, M. Grassrooting the space of flows. Urban Geogr. 1999, 20, 294–302. [Google Scholar] [CrossRef]
  21. Chen, M.X.; Luo, X.Y.; Hu, M.G.; Zhang, X.P. Club Characteristic and the Proximity Effect of Travel Links between Cities in China. Complexity 2020, 2020, 13. [Google Scholar] [CrossRef]
  22. Lewis, W.A. Economic development with unlimited supplies of labour. Manch. Sch. 1954, 22, 139–191. [Google Scholar] [CrossRef]
  23. Ranis, G.; Fei, J.C. A theory of economic development. Am. Econ. Rev. 1961, 51, 533–565. Available online: https://www.jstor.org/stable/1812785 (accessed on 20 January 2024).
  24. Sjaastad, L.A. The Costs and Returns of Human Migration. J. Political Econ. 1962, 70, 80–93. [Google Scholar] [CrossRef]
  25. Stark, O.; Bloom, D.E. The New Economics of Labor Migration. Am. Econ. Rev. 1985, 75, 173–178. Available online: https://www.jstor.org/stable/1805591 (accessed on 20 January 2024).
  26. Piore, M.J. The Dual Labor Market: Theory and Implications. In Social Stratification e, 4th ed.; David, B.G., Ed.; Routledge: New York, NY, USA, 2018; pp. 629–640. Available online: https://www.taylorfrancis.com/chapters/edit/10.4324/9780429494642-75/dual-labor-market-michael-piore (accessed on 20 January 2024).
  27. Straussfogel, D. World-Systems Theory: Toward a Heuristic and Pedagogic Conceptual Tool. Econ. Geogr. 1997, 73, 118–130. [Google Scholar] [CrossRef]
  28. Massey, D.S. Social-Structure, Household Strategies, and The Cumulative Causation of Migration. Popul. Index 1990, 56, 3–26. [Google Scholar] [CrossRef] [PubMed]
  29. Shen, J.F. Explaining Interregional Migration Changes in China, 1985–2000, Using a Decomposition Approach. Reg. Stud. 2015, 49, 1176–1192. [Google Scholar] [CrossRef]
  30. Cheong, T.S.; Wu, Y.R. The impacts of structural transformation and industrial upgrading on regional inequality in China. China Econ. Rev. 2014, 31, 339–350. [Google Scholar] [CrossRef]
  31. Wang, Y.X.; Li, X.; Yao, X.; Li, S.; Liu, Y. Intercity Population Migration Conditioned by City Industry Structures. Ann. Am. Assoc. Geogr. 2022, 112, 1441–1460. [Google Scholar] [CrossRef]
  32. Gu, H.Y.; Shen, J.F.; Chu, J. Understanding Intercity Mobility Patterns in Rapidly Urbanizing China, 2015–2019: Evidence from Longitudinal Poisson Gravity Modeling. Ann. Am. Assoc. Geogr. 2023, 113, 307–330. [Google Scholar] [CrossRef]
  33. Rabe, B.; Taylor, M.P. Differences in Opportunities? Wage, Employment and House-Price Effects on Migration. Oxf. Bull. Econ. Stat. 2012, 74, 831–855. [Google Scholar] [CrossRef]
  34. Shen, J.F.; Liu, Y. Skilled and less-skilled interregional migration in China: A comparative analysis of spatial patterns and the decision to migrate in 2000–2005. Habitat Int. 2016, 57, 1–10. [Google Scholar] [CrossRef]
  35. Cao, Z.; Zheng, X.Y.; Liu, Y.S.; Li, Y.R.; Chen, Y.F. Exploring the changing patterns of China’s migration and its determinants using census data of 2000 and 2010. Habitat Int. 2018, 82, 72–82. [Google Scholar] [CrossRef]
  36. Mueser, P.R.; Graves, P.E. Examining the role of economic-opportunity and amenities in explaining population redistribution. J. Urban Econ. 1995, 37, 176–200. [Google Scholar] [CrossRef]
  37. Liu, Y.; Shen, J.F. Jobs or Amenities? Location Choices of Interprovincial Skilled Migrants in China, 2000–2005. Popul. Space Place. 2014, 20, 592–605. [Google Scholar] [CrossRef]
  38. Su, Y.Q.; Hua, Y.; Liang, X.B. Toward Job or Amenity?: Evaluating the Locational Choice of Internal Migrants in China. Int. Reg. Sci. Rev. 2019, 42, 400–430. [Google Scholar] [CrossRef]
  39. Johansson, B.; Klaesson, J.; Olsson, M. Time distances and labor market integration. Pap. Reg. Sci. 2002, 81, 305–327. [Google Scholar] [CrossRef]
  40. Heuermann, D.F.; Schmieder, J.F. The effect of infrastructure on worker mobility: Evidence from high-speed rail expansion in Germany. J. Econ. Geogr. 2019, 19, 335–372. [Google Scholar] [CrossRef]
  41. Dong, X.F. High-speed railway and urban sectoral employment in China. Transp. Res. Pt. A-Policy Pract. 2018, 116, 603–621. [Google Scholar] [CrossRef]
  42. Brunsdon, C.; Fotheringham, S.; Charlton, M. Geographically weighted regression—Modelling spatial non-stationarity. J. R. Stat. Soc. Ser. D-Stat. 1998, 47, 431–443. [Google Scholar] [CrossRef]
  43. Fan, X.M.; Liu, H.G.; Zhang, Z.M.; Zhang, J. The Spatio-Temporal Characteristics and Modeling Research of Inter-Provincial Migration in China. Sustainability 2018, 10, 618. [Google Scholar] [CrossRef]
  44. Incaltarau, C.; Pascariu, G.C.; Duarte, A.; Nijkamp, P. Migration, regional growth and convergence: A spatial econometric study on Romania. Ann. Reg. Sci. 2021, 66, 497–532. [Google Scholar] [CrossRef]
  45. Brunsdon, C.; Fotheringham, A.S.; Charlton, M.E. Geographically weighted regression: A method for exploring spatial nonstationarity. Geogr. Anal. 1996, 28, 281–298. [Google Scholar] [CrossRef]
  46. Fotheringham, A.S.; Charlton, M.E.; Brunsdon, C. Geographically weighted regression: A natural evolution of the expansion method for spatial data analysis. Environ. Plan. A 1998, 30, 1905–1927. [Google Scholar] [CrossRef]
  47. Yang, Z.; Gao, W.J.; Zhao, X.Y.; Hao, C.B.; Xie, X.D. Spatiotemporal Patterns of Population Mobility and Its Determinants in Chinese Cities Based on Travel Big Data. Sustainability 2020, 12, 4012. [Google Scholar] [CrossRef]
  48. Wang, Y.X.; Dong, L.; Liu, Y.; Huang, Z.; Liu, Y. Migration patterns in China extracted from mobile positioning data. Habitat Int. 2019, 86, 71–80. [Google Scholar] [CrossRef]
  49. Fotheringham, A.S.; Yang, W.B.; Kang, W. Multiscale Geographically Weighted Regression (MGWR). Ann. Am. Assoc. Geogr. 2017, 107, 1247–1265. [Google Scholar] [CrossRef]
  50. Oshan, T.M.; Li, Z.Q.; Kang, W.; Wolf, L.J.; Fotheringham, A.S. MGWR: A Python Implementation of Multiscale Geographically Weighted Regression for Investigating Process Spatial Heterogeneity and Scale. ISPRS Int. J. Geo-Inf. 2019, 8, 269. [Google Scholar] [CrossRef]
  51. Fotheringham, A.S.; Yue, H.; Li, Z.Q. Examining the influences of air quality in China’s cities using multi-scale geographically weighted regression. Trans. GIS 2019, 21, 1444–1464. [Google Scholar] [CrossRef]
  52. Liu, P.Y.; Wu, C.; Chen, M.M.; Ye, X.Y.; Peng, Y.F.; Li, S. A Spatiotemporal Analysis of the Effects of Urbanization’s Socio-Economic Factors on Landscape Patterns Considering Operational Scales. Sustainability 2020, 12, 2543. [Google Scholar] [CrossRef]
  53. Shabrina, Z.; Buyuklieva, B.; Ng, M.K.M. Short-Term Rental Platform in the Urban Tourism Context: A Geographically Weighted Regression (GWR) and a Multiscale GWR (MGWR) Approaches. Geogr. Anal. 2021, 53, 686–707. [Google Scholar] [CrossRef]
  54. The 47th Statistical Report on Internet Development in China. Available online: http://www.cac.gov.cn/2021-02/03/c_1613923423079314.htm (accessed on 3 December 2023).
  55. Baidu Huiyan. Available online: https://mp.weixin.qq.com/s/JVXghcRtKGehgMz7YwUQkg (accessed on 9 April 2024).
  56. Fotheringham, A.S.; Park, B. Localized Spatiotemporal Effects in the Determinants of Property Prices: A Case Study of Seoul. Appl. Spat. Anal. Policy 2018, 11, 581–598. [Google Scholar] [CrossRef]
  57. Lu, B.B.; Charlton, M.; Harris, P.; Fotheringham, A.S. Geographically weighted regression with a non- Euclidean distance metric: A case study using hedonic house price data. Int. J. Geogr. Inf. Sci. 2014, 28, 660–681. [Google Scholar] [CrossRef]
  58. Taylor, P.J.; Evans, D.M.; Hoyler, M.; Derudder, B.; Pain, K. The UK Space Economy as Practised by Advanced Producer Service Firms: Identifying Two Distinctive Polycentric City-Regional Processes in Contemporary Britain. Int. J. Urban Reg. Res. 2009, 33, 700–718. [Google Scholar] [CrossRef]
  59. Pain, K.; Hall, P. Informational quantity versus informational quality: The perils of navigating the space of flows. Reg. Stud. 2008, 42, 1065–1077. [Google Scholar] [CrossRef]
  60. Li, B.; Li, T.; Yu, M.; Chen, M. Can equalization of public services narrow the regional disparities in China? A spatial econometrics approach. China Econ. Rev. 2017, 44, 67–78. [Google Scholar] [CrossRef]
  61. Liu, X.Y.; Wang, X.Q.; Whalley, J.; Xin, X.A. Technological change and China’s regional disparities—A calibrated equilibrium analysis. Econ. Model. 2011, 28, 582–588. [Google Scholar] [CrossRef]
  62. Chen, W.; Golubchikov, O.; Liu, Z.G. Measuring polycentric structures of megaregions in China: Linking morphological and functional dimensions. Environ. Plan. B-Urban Anal. City Sci. 2021, 48, 2272–2288. [Google Scholar] [CrossRef]
  63. Zhang, L. Spatial agglomeration of information services industry and its evolution: Evidence from the Pearl River Delta, China. Growth Chang. 2023, 55, e12696. [Google Scholar] [CrossRef]
  64. Zhang, X. Multiple creators of knowledge-intensive service networks: A case study of the Pearl River Delta city-region. Urban Stud. 2018, 55, 2000–2019. [Google Scholar] [CrossRef]
  65. Kreickemeier, U.; Wrona, J. Two-Way Migration between Similar Countries. World Econ. 2017, 40, 182–206. [Google Scholar] [CrossRef]
  66. Giannetti, M. Skill Complementarities and Migration Decisions. LABOUR 2001, 15, 1–31. [Google Scholar] [CrossRef]
  67. Wang, F.; Fan, W.N.; Lin, X.Y.; Liu, J.; Ye, X. Does Population Mobility Contribute to Urbanization Convergence? Empirical Evidence from Three Major Urban Agglomerations in China. Sustainability 2020, 12, 458. [Google Scholar] [CrossRef]
  68. Huang, X.; Li, G.; Liu, J. The Impact of Spatial Structure on Economic Efficiency of Beijing-Tianjin-Hebei Megalopolis in China. Complexity 2020, 2020, 6038270. [Google Scholar] [CrossRef]
  69. Wang, Y.A.; Yin, S.W.; Fang, X.L.; Chen, W. Interaction of economic agglomeration, energy conservation and emission reduction: Evidence from three major urban agglomerations in China. Energy 2022, 241, 13. [Google Scholar] [CrossRef]
  70. Meijers, E.J.; Burger, M.J.; Hoogerbrugge, M.M. Borrowing size in networks of cities: City size, network connectivity and metropolitan functions in Europe. Pap. Reg. Sci. 2016, 95, 181–198. [Google Scholar] [CrossRef]
Figure 1. Data processing methods.
Ijgi 13 00129 g001
Figure 2. Spatial distribution of inter-city population movement scale.
Ijgi 13 00129 g002
Figure 3. (a) Spatial distribution of residuals of OLS; (b) spatial distribution of residuals of GWR; (c) spatial distribution of residuals of MGWR.
Ijgi 13 00129 g003
Figure 4. Comparison of root mean squared error from Geographically Weighted Regression (GWR, depicted in red) and Multiscale Geographically Weighted Regression (MGWR, depicted in blue) for each parameter surface.
Ijgi 13 00129 g004
Figure 5. (a) Spatial distribution of intercept coefficients of GWR model; (b) spatial distribution of GDP coefficients of GWR model; (c) spatial distribution of PSPC coefficients of GWR model; (d) spatial distribution of SSPC coefficients of GWR model; (e) spatial distribution of TSPC coefficients of GWR model; (f) spatial distribution of GPBEPC coefficients of GWR model; (g) spatial distribution of AW coefficients of GWR model.
Ijgi 13 00129 g005
Figure 6. (a) Spatial distribution of intercept coefficients of MGWR model; (b) spatial distribution of GDP coefficients of MGWR model; (c) spatial distribution of PSPC coefficients of MGWR model; (d) spatial distribution of SSPC coefficients of MGWR model; (e) spatial distribution of TSPC coefficients of MGWR model; (f) spatial distribution of GPBEPC coefficients of MGWR model. (The results of the AW parameter distribution in all cities are non-significant).
Ijgi 13 00129 g006
Table 1. Original table of Baidu Migration LBS data.
DateDeparture ProvinceDeparture CityDestination ProvinceDestination CityThe Number of Users
19 April 2019BeijingBeijingHebeiLangfang112,946
12 April 2019GuangdongGuangzhouGuangdongFoshan102,709
20 April 2019ShanghaiShanghaiJiangsuSuzhou90,500
Table 2. Descriptive statistics of independent variables.
Independent VariablesNotationExplanationMaxMinMean
Gross region productGDPAnnual gross regional product (CNY 10,000) 381,553,200.00328,578.8927,754,368.86
Added value of primary sector per capitaPSPCAdded value of primary sector per capita (CNY per capita)26,484.58187.486112.94
Added value of secondary sector per capitaSSPCAdded value of secondary sector per capita (CNY per capita)279,618.331304.8625,089.49
Added value of tertiary sector per capitaTSPCAdded value of tertiary sector per capita (CNY per capita)142,663.474805.3730,011.69
General public budget expenditure per capitaGPBEPCGeneral public budget expenditure per capita (CNY per capita)51,791.43649.3413,988.88
Average wageAWAverage wage of employed persons in urban non-private units (CNY)173,205.0044,953.0078,715.10
Table 3. Performance of three models.
Model 1_OLSModel 2_GWRModel 3_MGWR
MAE0.2756180.1774350.177418
RSS35.24819.13818.988
AICc203.911135.85593.761
Adj. R20.8990.9340.947
Table 4. Spatial autocorrelation of residuals.
Model 1_OLSModel 2_GWRModel 3_MGWR
Moran’s I index0.2504430.0597970.012448
Expected index−0.002825−0.002825−0.002825
Z score9.8684152.4450380.595742
p Value<0.0010.0144840.551348
PatternClusteredClusteredRandom
Table 5. Optimal bandwidths generated by MGWR and GWR.
Model 2_GWRModel 3_MGWR
BandwidthBandwidthBandwidth Confidence Intervals (95%)
Intercept9045(44.0, 60.0)
GDP9094(70.0, 116.0)
PSPC90354(281.0, 354.0)
SSPC9050(46.0, 70.0)
TSPC90279(235.0, 309.0)
GPBEPC90173(162.0, 235.0)
AW90354(281.0, 354.0)
Table 6. Parameter estimates for the regression of inter-city population movement using MGWR.
MGWR Coefficients
MinMaxMeanPercentage of Cities by Significance (95% Level) of t-Test
p ≤ 0.05 (%)Positive (%)Negative (%)
Intercept−0.2350.2910.05545.9276.6923.31
GDP0.8291.0530.933100.00100.000.00
PSPC−0.088−0.055−0.082100.000.00100.00
SSPC−0.461−0.001−0.24093.240.00100.00
TSPC0.0960.1920.138100.00100.000.00
GPBEPC−0.1210.066−0.0117.320.00100.00
AW0.0270.0410.0330.000.000.00
Disclaimer/Publisher’s Note: The statements, opinions and data contained in all publications are solely those of the individual author(s) and contributor(s) and not of MDPI and/or the editor(s). MDPI and/or the editor(s) disclaim responsibility for any injury to people or property resulting from any ideas, methods, instructions or products referred to in the content.

