Article

Redesigning Graphical User Interface of Open-Source Geospatial Software in a Community-Driven Way: A Case Study of GRASS GIS

1
Department of Geomatics, Faculty of Civil Engineering, Czech Technical University in Prague, Thákurova 2077/7, 166 29 Prague, Czech Republic
2
Center for Geospatial Analytics, North Carolina State University, 2800 Faucette Drive, Raleigh, NC 27695, USA
*
Author to whom correspondence should be addressed.
ISPRS Int. J. Geo-Inf. 2023, 12(9), 376; https://doi.org/10.3390/ijgi12090376
Submission received: 10 July 2023 / Revised: 1 September 2023 / Accepted: 7 September 2023 / Published: 10 September 2023

Abstract

:
Learning to use geographic information system (GIS) software effectively may be intimidating due to the extensive range of features it offers. The GRASS GIS software, in particular, presents additional challenges for first-time users in terms of its complex startup procedure and unique terminology associated with its data structure. On the other hand, a substantial part of the GRASS user community including us as developers recognized and embraced the advantages of the current approach. Given the controversial nature of the whole issue, we decided to actively involve regular users by conducting several formal surveys and by performing usability testing. Throughout this process, we discovered that resolving specific software issues through pure user-centered design is not always feasible, particularly in the context of open-source scientific software where the boundary between users and developers is very fuzzy. To address this challenge, we adopted the user-centered methodology tailored to the requirements of open-source scientific software development, which we refer to as community-driven design. This paper describes the community-driven redesigning process on the GRASS GIS case study and sets a foundation for applying community-driven design in other open-source scientific projects by providing insights into effective software development practices driven by the needs and input of the project’s community.

1. Introduction

While in the past software usability has been identified as one of the biggest issues that open-source software has been neglecting [1,2], the importance of usability issues is now increasingly recognized and addressed by open-source communities [3]. Ignoring the usability aspects of software development may lead to decreased productivity, low acceptance from end-users [4], and even to the abandonment of the software by its developer and user base [5,6]. This risk is especially high for geographic information systems (GIS) because the software’s high complexity and large number of available features may significantly reduce the usability of the whole system [7,8,9], leaving a non-expert confused and discouraged. On top of that, GIS is an indispensable tool in computational science, a field with unique, occasionally counter-intuitive usability requirements, and mixed perceived importance of usability to users and developers [10,11]. Since first-time user experience (UX) plays an important role when choosing software [12], negative feelings when interacting with GIS for the first time represent a major barrier to its adoption, no matter how powerful, accurate, or fast the software is. Understanding the user as an important component of the development process can be achieved by integrating the principles of user-centered design (UCD) which focuses on the interactive process of system development with user participation and evaluation [13]. However, the question arises as to what extent the UCD approach can be effectively employed in the development of open-source scientific software considering its distinctive nature lying in the blurred boundary between users and developers [11,14].
To investigate the feasibility of applying the UCD approach in the development of open-source scientific software, we employed the UCD principles to the development of GRASS GIS (Geographic Resources Analysis Support System) [15]. GRASS is a desktop GIS and geoprocessing engine with a decades-long history of development focused on delivering powerful and fast geospatial algorithms through a command-line interface. Historically, GRASS’s relatively complex startup mechanism and distinctive terminology for its data structures have hindered its adoption in higher education and open science. In contrast, experienced GRASS users (often GRASS developers) have fully appreciated the software’s distinct behavior and did not see the need to improve the user experience. In response to this tension, we, as part of the development team, decided to incorporate UCD principles into the GRASS development process by seeking opinions and suggestions from the broader GRASS community.
This paper introduces a community-driven design methodology which builds upon the established UCD methodology (as described e.g., by Ye et al. [16]) and adapts it to the specific requirements of open-source scientific software development. The subsequent sections are organized as follows: Section 2 reviews relevant literature from diverse fields, highlighting the significance of topics such as first-time user experience and UCD. Section 3 provides background information on GRASS and its usability challenges, while Section 4 describes the methodology consisting of the community-driven redesigning process and the usability testing of the newly developed user interface. In Section 5, we present the intermediate and final outcomes of the community-driven redesign and evaluation of the graphical user interface (GUI) redesign employing eye-tracking technology and retrospective verbal protocol. Section 6 highlights the distinctive aspects of our methodology compared to traditional UCD and discusses its limitations. Finally, Section 7 summarizes the impacts of the community-driven redesigning process on GRASS GIS development itself and concludes the paper.

2. Related Works

The first-time user experience has been a significant focus in various studies exploring the usability of first-time interactions in mobile gaming contexts [17], using novel gesture controls on smartphones [18], and within academic information systems [19]. These studies collectively underscore the importance of designing intuitive and user-friendly initial interactions to enhance overall user satisfaction and engagement. Although, in the domain of GIS software development, there appears to be a lack of studies focused specifically on first-time experience, several GIS usability studies draw attention to the fact that GIS software complexity and an extensive array of features can significantly reduce the overall system usability [7,8,9].
To enhance the usability of scientific software, guidance and case studies often suggest adopting a user-centered design (UCD) process [20,21,22,23]. This process seeks to first understand scientists’ needs before the software is developed by employing a participatory design (PD) approach in which users are actively involved in the design process [11]. PD and UCD are often used interchangeably; in this study, we adopt the UCD definition put forth by Roth et al. [24], which involves gathering input and feedback from target users throughout the interface design and development process. In the context of software development, alternative approaches to UCD or PD also exist, most notably, Agile Software Development (ASD) [25,26] aiming at promptly providing users with functional solutions and Action Design Research (ADR) [27,28] focusing on highly action-oriented implementations in terms of experiments with various designs.
In the domain of open-source scientific software development, the application of UCD and PD has been the subject of multiple studies. For example, while Hellman et al. [29] presents a broad user-centered exploration by developing design guidelines capturing the needs of participatory design tools for open-source software (OSS), Rhinesmith et al. [30] focuses on the actual integration of participatory design into open-source software development, incorporating participatory design workshops and interviews with users before starting the initial development phase. Further, Haskel [31] offers a detailed description of participatory design methodology and its individual phases applied to the development of open-source software.
While the above-mentioned studies emphasize the benefits of involving user input in open-source software development, Bødker et al. [32] underscores that the non-hierarchical community arrangement and the strong sense of emotional belonging to the community tend to put emphasis on internal community motivations and thus hinder addressing end-user issues. Additionally, there is a need for more UCD studies that consider the challenges associated with the development process of open-source scientific software with a globally distributed user base and the increasing significance of social coding platforms for these communities [33].

3. Background

GRASS GIS (Geographic Resources Analysis Support System) is an open-source geographic information software used for analyzing, visualizing, and working with geospatial data. It offers a comprehensive suite of tools for spatial analysis, processing satellite and aerial images, conducting image analysis, creating geospatial models, and many other specialized GIS tasks. The software follows a modular design approach, where different tools are individual building blocks implemented as separate modules. Users have the flexibility to use a graphical user interface (GUI), command-line interface (CLI), or Python application programming interface (API).
GRASS GIS is an appropriate software package for applying the community-driven design based on the following considerations:
1.
Open-source nature: GRASS GIS was first released under the GNU General Public License in 1999 as version 5.0, and subsequent releases have adhered to the principles of open-source software development.
2.
Established project: The significance of GRASS GIS as a well-established project is demonstrated by its founding membership in the Open Source Geospatial Foundation (OSGeo) in 2006 [15]. This affiliation underscores the recognition and acceptance of GRASS GIS within the geospatial community. Currently, GRASS offers over 400 built-in tools and 400 extensions (add-ons) developed and maintained by scientists, catering to highly specialized computation tasks in line with the latest advancements in GIS.
3.
Active and diverse community: The GRASS community consists not only of GIS specialists but also includes scientists from various fields such as hydrology, biology, archaeology, and others. The development team has around twenty active members, including the authors of this study.
4.
Utilization of social coding principles: The development of GRASS GIS takes place on platforms such as GitHub [34], where proposed code changes (pull requests) undergo discussions and modifications until they receive approval from other GRASS developers. Bug reports and ideas for improvements can be shared through GitHub issues. The GRASS community also engages in interactions through several mailing lists and a dedicated chat platform called Gitter [35].
5.
Significance of usability issues: GRASS GIS exhibits notable usability challenges discussed below that require a comprehensive approach.

3.1. GRASS Data Structure

GRASS GIS was conceived from its very beginning as a powerful geospatial computing tool with a strong emphasis on ensuring data integrity and delivering accurate results. To achieve data integrity, GRASS GIS employs a hierarchical data structure. The data import process involves storing the data in the GRASS data storage and reprojecting it to a common coordinate reference system (CRS) determined by the user for each project (Figure 1). At the project level, known as a “location” in GRASS GIS, data is further organized into subprojects called “mapsets”. Mapsets are utilized for managing different subregions or analyses within a project. Furthermore, mapsets have distinct processing settings, including computational extent and resolution. The directory that contains one or more locations in GRASS GIS is referred to as the “GRASS database” and is commonly named “grassdata.” By adhering to this hierarchical data structure, GRASS GIS ensures data consistency and facilitates robust analysis and manipulation of geospatial data.

3.2. Usability Issues and First Steps to UCD

Upon launching the GUI of GRASS GIS, a start-up window (Figure 2a) is presented to the user, prompting them to create a new mapset or select an existing one. Previous discussions within the GRASS community, conducted through mailing lists and the GitHub development platform, revealed that many users familiar with this approach did not perceive any issues. However, community members using GRASS in an educational setting with first-time users were voicing their concerns about the usability of the start-up window and other data management aspects [36].
Recognizing that the source of the problem extended beyond the user interface of the start-up window, in the summer of 2020, we focused our initial efforts on improving the GRASS Data Catalog widget (Figure 2b) to better reflect GRASS data structure and to add data and session management features. The development part of the community unanimously liked those changes, which led to the idea of skipping the start-up window altogether. With the comprehensive data management capabilities provided by the Data Catalog, the start-up window would only be necessary for special circumstances, such as unusual start-up cases. In regular startups, the GUI would directly launch into the previously used mapset, while in first-time startups, it would initialize with a sample mapset.
While the community discussion informed the development of the initial implementation, we decided to solicit more formal feedback that could better capture the opinions of a wider sample of the GRASS community. Specifically, we were interested in the community’s opinions on the complete removal of the start-up window, which could be seen by many long-term users as controversial. More broadly, we wanted to understand the community’s perception of first-time user experience, its importance for the project, and possible approaches to make GRASS GIS more user-friendly.

4. Materials and Methods

Our study was divided into two different phases. The first phase involved the user-centered design (UCD) process addressing usability issues of open-source scientific software with a particular application on GRASS GIS using collaborative efforts within the community and the iterative design of proposals and prototypes facilitated by social platforms. We called the adapted UCD process a community-driven redesigning process. The second phase involved the usability evaluation of the newly developed GUIs (multi-window and single-window) against the original version. We opted to separate the evaluation from the community-driven redesign process since the GRASS community members did not directly participate in it. The methodology schema is included in Figure 3.

4.1. Community-Driven Redesigning Process

We built our community-driven design methodology on the user-centered methodology (UCD) with our primary goal to resolve long-term, controversial topics of start-up mechanism and first-time user experience by actively engaging the GRASS community in the development process. The user-centered design methodology is composed of activities that aim to develop a plan with a strong emphasis on user-centricity. Its primary objectives include understanding and determining the context of use, specifying user and organizational requirements, producing prototypes, and evaluating designs based on established criteria [37,38]. The process we applied in our study and called the community-driven redesigning process, as depicted in Figure 3, integrates the aforementioned UCD activities and tailors them to the development of scientific open-source software.
Individual UCD phases in our work loosely followed phases used by Ye et al. [16] consisting of analysis (setting goals and user requirements), design (prototyping, feedback), and deployment (full realization) and adapted them to the specific requirements of open-source scientific software development. Additionally, we were inspired by the first participatory phase described by Haskel [31] which involves the creation of paper prototypes. In our methodology, we used diagrams or GUI mockups, however, the purpose of both approaches remains the same—to introduce the community to detailed suggestions and open up a channel of communication without any initial implementations.
The GRASS community interacts through multiple channels. The most active communication happens on the GitHub platform (issues, pull requests), on user and developer mailing lists, and on Gitter. While these channels provide efficient ways to discuss technical details and announce important updates, they do not sufficiently engage a large part of the community. To get more structured and comprehensive feedback on GUI usability issues from a broader audience, we developed three online questionnaires (included in Appendix A and referred to as Q1, Q2 and Q3). To best integrate feedback gained from questionnaires while considering the complexity of the software implementation, we and the rest of the developer community engaged in discussions through video calls and comments on GitHub issues. This interaction led to a proposed solution, represented as diagrams or GUI mockups, that was then announced through the existing community channels. We continued refining the proposal until we addressed all concerns. In the next stage, we implemented the proposed solution as GitHub pull request and asked the community to evaluate the prototype through an online questionnaire. Simultaneously, we solicited informal feedback by discussing and testing a respective GitHub pull request.
To obtain reliable and relevant responses, our questionnaires utilized several response types including multi-choice type with open-ended responses, ranking, and a slider as an alternative to the Likert scale used in System Usability Scale (SUS) questionnaires [39]. We also solicited several open-ended responses to capture users’ spontaneous ideas [40]. These open-ended responses were then aggregated using similarity-based grouping [41]. The questionnaires were released on the Survey Monkey platform and distributed through mailing lists and social networks, namely Facebook and X (formerly Twitter). We as authors of the questionnaire did not participate in the questionnaires, other developers could. The questionnaire administration is summarized in Table 1.
During the redesigning process, we addressed two primary areas of GRASS usability issues. First, we focused on enhancing the first-time user experience by developing a special mode for first-time users. Second, we addressed user concerns about the usability of the start-up window. While the special mode is beneficial primarily for first-time users, users with any level of experience can benefit from the enhanced start-up. The next two subsections provide a summary of the most important parts of the questionnaires related to the topics mentioned above—the first-time user mode and the usability of the start-up window. The full content of the questionnaires is provided in Appendix A, Table A1, Table A2 and Table A3.

4.1.1. The First-Time User Mode

In the Q1 questionnaire, we presented respondents with two commonly used approaches for enhancing the first-time user experience in other software packages: an info bar and a first-run wizard. The info bar provides context-specific suggestions in an unobtrusive way, while the first-run wizard highlights and describes individual components of the user interface. In two related questions, we then asked about users’ opinions on both approaches. The questions were of the single-select multiple-choice type, with open-ended responses also allowed. Additionally, we included the following open-ended question to gain a broader understanding of the community’s perception of the first-time user experience and its importance for the project: “Do you have other ideas that would lead to more straightforward navigation in the software?”
Later, in the Q3 questionnaire, we presented respondents with a prototype of the first-time user mode that had already been implemented based on responses from Q1. We asked respondents to choose how they would proceed with the software based on prototype screenshots and to share what they suggest being better clarified. The majority of the Q3 questionnaire was conducted as open-ended responses, allowing users to share ideas for improvements. Assuming prior experience with GRASS GIS would be an important factor, we gathered information about the respondent’s experience with GRASS GIS.

4.1.2. The Use of Start-Up Window

As part of the community-driven redesign, we administrated a questionnaire Q2 to gather feedback on the current and future use of the start-up window. Our primary objective was to solicit the broader community’s opinion on the initial changes described in Section 3.2. To ensure objectivity, we formulated the slider question similarly to the SUS, where a respondent assesses a statement in the range of strong disagreement to strong agreement. The question was phrased as follows: “What is your opinion on the following statement? The partial removal of the start-up screen and improvement of the Data Catalog simplifies the initial introduction to the software and further work.”
Additionally, we presented respondents with two options for how GRASS could launch upon unusual circumstances when the last used mapset is not available: either keep showing the modernized version of the start-up window or immediately show the main software window with the prepared demo project. While preserving the start-up window would require maintaining a huge amount of code, starting the demo project whenever the last used mapset is not available may be unexpected, especially for more advanced users. As we realized that neither option is completely ideal, we supplemented choices with an open-ended question to solicit respondents’ ideas. Overall, our aim was to explore various possibilities for improving the start-up mechanism and gathering community feedback on these options.

4.2. Evaluation of GUI Redesign

The community-driven approach resulted in several new implementations in the GRASS development branch. To evaluate these changes we employed lab usability testing with eye-tracking technology. We recruited ten students in the field of Geomatics at CTU in Prague with no or very limited experience with GRASS GIS and randomly divided them into two groups of five members. In addition, we recruited one more beginner to conduct pilot testing [42]. We tested three different stimuli, each simulating a situation a first-time user would encounter. The first stimulus represented the GRASS GIS version described in Section 3.2, while the second and third stimuli resulted from the redesigning process. As the second and third stimuli differed only in the GUI layout (single-window or multi-window), each participant tested the first stimulus and continued with the second or third stimulus depending on which group they were assigned to.
The task for each stimulus involved importing and displaying one raster and one vector layer, both in the S-JTSK coordinate system (EPSG:5514). While a participant was working on the task, we observed their instinctive behavior using eye-tracking as the main usability testing method. Furthermore, we obtained screen recordings necessary for processing gaze sequences as well as for deriving performance-based measures for effectiveness (error rate) and efficiency (task completion time) [43]. In between the eye-tracking sessions, we asked the participant to explain and theorize about what they remember thinking or doing during the task. This method called retrospective verbal protocol is known to be a good supportive usability testing method for eye-tracking [44]. The complete testing procedure of each participant spanned approximately one hour, with approximately 30 min allocated to stimulus testing. The remaining half-hour was dedicated to engaging in retrospective verbal protocol and discussion.
We presented the stimuli on a 27-inch widescreen monitor and tracked eye gazes using a Tobii Glasses 2 wearable eye-tracker with a sampling rate of 50 Hz. The data processing involved importing an eye-tracking project together with snapshots and mapping snapshots to eye-tracking video to obtain raw gaze plots. We grouped the raw data using a filter that considered eye movement records with a speed of less than 30°/s. Finally, we created heat maps and gaze plots [42]. To derive conclusions from eye-tracking and other used supportive methods, we followed the summative and formative research methodology described by Bojko [45]—we compared stimuli with each other and searched for possible improvements in a new interface.

5. Results

In this section, we describe the resulting community-driven redesign process and its evaluation. The timeline of the process and the important components including questionnaires, proposals, prototypes, full implementations, lab usability testing, and their relations are captured in Figure 4. The informal feedback solicitation and prototype evaluation took place throughout the whole redesigning process via existing channels and were therefore not captured in the figure.

5.1. The First-Time User Mode

In questionnaire Q1 we presented respondents with two different approaches often used in other software packages for enhancing the first-time user experience—an info bar and a first-run wizard. Since both options were favorably rated (85% responded positively to the first-run wizard and 74% to info bars), we decided to implement an info bar as a technically simpler and more flexible solution. We proposed a diagram in Figure 5 including a context-dependent set of hints displayed in the info bar, both informing and prompting users to the next action. Considering the feedback from questionnaire Q1 on what would help a first-time user significantly in their initial orientation in GRASS, we proposed the hint topics as follows:
1.
Startup and Data Structure info
2.
Import data info
3.
Tabs info
Subsequently, while gathering the developer community’s informal feedback via the related pull request, we implemented an info bar prototype. Since we noted doubts expressed within the community regarding the effectiveness of the prototype, we conducted a questionnaire Q3 to collect more comprehensive feedback. Respondents were presented with all three prototype scenes (see an example of the first-time hint in Figure 6) and asked to share their experiences with GRASS GIS.
As a result, advanced users rated the first-time user mode positively (almost 73 out of 100 points on average) while beginners evaluated it with 59.4 points on average. Notably, only half of the beginner group successfully completed the first scene, leading us to explore the potential reasons for these difficulties through open-ended questions.
Both user groups expressed support for the concept of the first-time mode and provided valuable suggestions for improvements. In particular, they offered insights regarding changes to the info bar content and design. Taking these suggestions into consideration, we implemented relevant modifications to enhance the overall user experience with the full implementation of the first-time user mode (see Figure 7).
Additionally, users proposed altering the terminology used for data hierarchy elements, suggesting “projects” instead of “locations” and “subprojects” instead of “mapsets”. Although, at the time of implementing the first-time user mode, we decided to retain the existing terminology, the respondents’ suggestions sparked meaningful discussions that continued in the long term. Ultimately, during the GRASS community code sprint in June 2023, these discussions led to the creation of a pull request (PR) on GitHub [46] modifying the terminology of the “location” data element to “project”.

5.2. The Use of Start-Up Window

As part of the community-driven redesign process, we conducted a questionnaire Q2 to gather feedback regarding the current and future use of the start-up window. The majority of respondents expressed positive views on the partial removal of the start-up window, as described in Section 3.2, with an average rating of 70.8. On the other hand, a significant portion of respondents (62%) indicated a preference for keeping and modernizing the start-up window for unusual GRASS start-up cases.
Taking into account the questionnaire results and considering the opinions expressed within the developer community, we made the decision to pursue the direct start-up option for all unusual start-up cases. This choice was motivated by several factors, including the desire for more consistent GUI behavior and the aim to minimize the number of GUI components that users need to learn and developers need to maintain.
For unusual start-up cases, we suggested using the temporarily created location. Further, we took advantage of the info bars developed for the first-time mode to create a proposal for the start-up mechanism in the form of a diagram outlining the next course of action in unusual start-up scenarios. After fine-tuning the info bar widgets based on questionnaire Q3, we integrated the temporary location hints into GRASS. The resulting info bar appearance is captured in Figure 8.

5.3. Single-Window GUI

While single-window does not directly address start-up or data hierarchy usability concerns, it gained significant importance based on responses to an open-ended question in questionnaire Q1 regarding software navigation. Moreover, subsequent community discussions also highlighted strong support for single-window as an alternative to the current multi-window layout (see Figure 5).
Moving forward with the idea, we presented a mockup of the new single-window layout created based on a demo single-window project (see Figure 9) and described associated changes in GUI behavior in a GitHub issue, that was further shared via community mailing lists. Receiving unanimously positive reactions, we subsequently implemented the proposal into GRASS GIS while keeping the multi-window layout option available.

5.4. Evaluation of GUI Redesign

In evaluating the GUI redesign, we employed three methods. First, we drew conclusions from the eye-tracking visualizations of the first encountered widgets in all three stimuli we tested. Second, we compared the task performance-based measures and explain the reasons for these results with the help of retrospective verbal protocol and screen recordings (summative research). Finally, we gathered participants’ ideas for further improvements (formative research).
The gaze plots for the start-up window, which is the initial widget encountered in the original GRASS version, exhibited significant variations among participants. For example, participant 1 demonstrated longer fixations on relevant elements with fewer rapid eye movements, indicating higher engagement. However, the majority of respondents (six out of ten) displayed a high degree of rapid eye movement, suggesting confusion (see Figure A1 for the most diverse gaze plot selection). These findings provide confirmation that the start-up window is perceived as confusing by users.
In contrast, the heat maps generated for the redesigned GUI (as shown in Figure A2 and Figure A3) demonstrated that beginners directed their visual attention to the first info bar hint in both layouts. Interestingly, we discovered that beginners focused their attention primarily on the upper-left part of the single-window GUI, suggesting that important widgets should be positioned on the left side. Although participants did pay visual attention to the info bar, most of them did not perceive it as relevant, as indicated by the retrospective verbal protocol and screen recordings. Since understanding the concepts conveyed by the info bar is crucial for first-time users, several participants who ignored the information in the info bar incorrectly re-projected their data. This mistake led to a higher task error rate for the new version (Figure 10a).
On the other hand, the theorizing part of the retrospective verbal protocol revealed that the changes made to the start-up mechanism were accepted very positively by participants. To provide the best first-time user experience, they only suggested emphasizing the need for creating a new location and providing a warning about potential data re-projection. Further evidence showing that the new mechanism has the potential to be significantly more user-friendly than the original mechanism is reflected in the completion time of the correct solutions. Figure 10b demonstrates that the time required for achieving correct data import was noticeably shorter in the new version compared to the original version with the start-up window. In the original version, all successful participants spent a substantial amount of time searching for the appropriate import function. However, in the new version, two out of four successful participants efficiently utilized the import data buttons provided in the info bar.
The retrospective verbal protocol not only aided in identifying the reasons behind usability issues but also naturally sparked a discussion that generated ideas for further improvements. For instance, participants suggested the inclusion of a more explicit way to dismiss an info bar (rather than just a simple close [×] button) to prevent an uninformed decision regarding its closure. In addition, participants recommended emphasizing the option to create a new location during the data import if the CRS of the input data differed from the target location.
Regarding the GUI layout, a majority of participants (nine out of ten) expressed a preference for the single-window GUI. While only one participant favored the multi-window design because of her use of multiple monitors, three other participants suggested adding an option to undock the map window into a separate window (a built-in multi-window option within a single-window).

6. Discussion

In this article, we present a community-driven design of GUI on the example of open-source scientific source GRASS GIS, with a specific focus on enhancing the first-time user experience. Through community feedback and formal questionnaires, we iteratively developed a new software startup with a first-time user mode and a single-window layout. Interacting with beginners and advanced users, we aimed at satisfying both groups. While focusing on first-time users, we also engaged advanced users to maximize the benefits of the redesign for the existing community. To assess the resulting GUI design, we conducted lab usability testing that supported the decision to use a single-window layout and identified areas that require further improvements in the GRASS startup process.
Our community-driven design loosely followed the user-centered design methodology described by Ye et al. [16] which consists of analysis (setting goals and user requirements), design (prototyping, feedback), and deployment (full realization). To engage the GRASS community, we relied not only on traditional means such as mailing lists, questionnaires, and social media but also on GitHub, the social coding platform that encourages participation and collaboration in open-source software development [33,48,49]. Besides that, we were gaining feedback based on proposals that we built upon questionnaire results and shared with the community via known channels in the form of diagrams and GUI mockups. In the GRASS community, most developers are at the same time also users, which is the case for most scientific software communities [11,14]. Indeed, in the redesign process, we considered not only user feedback but also our own perspective on software usability in light of the feasibility of the potential implementation.
During the redesign process, we identified certain internal threats of our community-driven redesigning process: suitable selection of usability methods and the selection of the target user group.
To evaluate the prototype of the first-time user mode, we opted for an online questionnaire to get feedback from a large number of respondents. However, we recognized that remote moderated testing would have provided more valuable insights at the prototype stage because the questionnaire’s respondents had difficulties understanding the full context of questions without the simultaneous use of the software. In our specific case, implementing this option would have required substantial preparation since all participants would need access to a test prototype that only exists on GitHub within the proposed pull request. Acknowledging the logistical challenges associated with prototype distribution, we presented the individual scenes of the first-time user mode to the community in the form of a questionnaire. For other projects, however, careful consideration should be given to the trade-offs between remote moderated testing and a questionnaire-based approach, taking into account the specific project requirements and limitations.
In our study, we found that the insights provided by eye-tracking were limited. The wearable eye-tracker we used proved to be less accurate and less suitable for effectively testing stimuli displayed on a monitor. Additionally, the internal changes in the stimulus, such as a user opening a dialog, and the presence of multiple paths leading to a correct task result added complexity to the analysis and interpretation of our eye-tracking data. This outcome was not unexpected, considering the challenges posed by the complex and feature-rich interfaces of GIS, which make real-time observations of user behavior using eye-tracking more challenging [6]. To overcome these limitations, we adopted an additional method: retrospective verbal protocol with screen recording. This approach proved to be effective as it allowed us to analyze the entire process of completing the task. By combining verbal protocols, where participants provided detailed explanations of their thoughts and actions, with screen recordings, we gained valuable insights into users’ decision-making processes and their interaction with the interface. This complementary method offered a comprehensive understanding of user behavior and facilitated a more robust analysis of the task completion process.
Further, extra effort should be given to the thorough selection of the target user group. We primarily distributed the questionnaire Q3 related to the first-time user experience topic through GRASS-related channels. As a result, the majority of respondents were existing GRASS users. At the beginning of the redesigning process, we intentionally searched for input from existing users since they are familiar with how GRASS works and thus can better suggest specific designs for enhancing the first-time user experience. However, as the development progresses, it’s important to give priority to the viewpoints and ideas of the main target group, which, in the case of first-time user mode, are the first-time users.
The lab usability evaluation was conducted with 10 participants who had experience with GIS but minimal or no experience with GRASS. We built upon prior research [40,50,51] indicating that a smaller group in lab testing is sufficient to detect most usability issues. In our specific scenario, we utilized two groups, each consisting of five participants. Every participant tested the old version and then the new version (either Single-Window layout or Multi-Window layout depending on the group assignment). Therefore, in total, we tested three stimuli. Given this added complexity, more participants would definitely enhance the study’s robustness. On the other hand, a smaller group of participants allowed us to spend more time with each of them to gather detailed opinions and ideas for improvements.
To assess the changes made during the redesigning process, we involved only beginners in the lab usability testing. This decision was influenced by the notably more favorable feedback received from current users through Questionnaire 3 (Q3) and informal feedback channels, in contrast to feedback from beginners. Thus, incorporating beginners was a deliberate choice to introduce a more critical viewpoint. However, in a broader context of using the community-driven design in software development, the project community can also be a part of the evaluation of GUI redesign.
The external threats to the validity of community-driven redesigning processes stem from the way open-source development works. Even when taking into account the input from users, decisions are usually taken by only a small group of people (in our case, around five GRASS developers of the GRASS GUI). Moreover, the dynamics of the open-source community, with members being actively engaged at different time periods, can cause some asynchrony in the communication [52], potentially resulting in missing feedback that would improve the software implementation.
The idea for future studies could be to better target diverse groups including users in academia and industry, and users who access GRASS directly or through integrations with other open-source projects like QGIS and R. Engaging a wider user community could yield more varied responses and a larger respondent pool. Moreover, this approach could lead to more insightful answers from respondents with a greater range of expertise. Interestingly, during the community-driven redesign process, we observed a substantial increase of nearly 40% in the number of followers on the GRASS GIS X (formerly Twitter) account. This growth indicates the potential of utilizing social networks as a means to reach and engage with a broader community.
Further, exploring the inclusion of remote moderated testing could offer valuable insights in research targeting the usability of open-source software, especially when the user base is geographically dispersed. This exploration can span across both prototype testing and the evaluation of GUI redesign. Technical challenges associated with distributing a prototype of a desktop software could be alleviated by cloud-based remote desktop solutions.

7. Conclusions

This article has demonstrated a community-driven approach to GUI redesign using the case study of GRASS GIS. The focus was twofold: enhancing the first-time user experience by developing a special mode for beginners and addressing user concerns about the usability of the start-up window. By involving the community, continuously refining the design, and rigorously testing it, we created a new software startup interface that works well for both beginners and experienced users. During the redesigning process, we followed user-centered principles and leveraged traditional as well as modern communication platforms like GitHub to collaborate effectively.
To evaluate the changes introduced through this community-driven redesign, we conducted lab usability testing. Despite encountering challenges with eye-tracking, we gained valuable insights from first-time users thanks to supportive methods like retrospective verbal protocols and screen recording. Although several lab test participants ignored the information in the info bar, the theorizing part of the retrospective verbal protocol revealed that the changes made to the start-up mechanism were accepted generally very positively. Similarly, within the existing user community, where ideas on improving software startup and enhancing the first-time user experience historically varied, a large number of users expressed positivity regarding intended GUI changes in questionnaires. This indicates that the new mechanism holds the potential for significantly improved user-friendliness compared to the original approach.
A key takeaway is that GUI redesign efforts often involve finding a compromise between the preferences of existing and first-time users, while also considering the insights from the user/developer community about the practicality of implementation. Furthermore, the dynamics of the open-source community, with different users being active at different times, causes some asynchrony in the communication which also needs to be taken into account. Looking ahead, future studies could target more diverse groups such as users in academia and industry and users from communities of similar projects. Finally, exploring remote moderated testing for users spread across different geographic locations could offer further benefits in research.
Community buy-in is essential for large changes in open-source software [53]. GRASS startup mechanism operated on the same principle for more than 20 years [54] making any significant changes in this area impossible without engaging the community in the important design decisions. Thanks to the community-driven redesign process, we successfully replaced the existing start-up mechanism and developed major improvements benefiting both first-time and advanced users, promising a better GRASS GIS adoption in higher education and research. These features are available in GRASS GIS version 8 and will continue to be refined by the community.

Author Contributions

Conceptualization, Linda Karlovska, Anna Petrasova; methodology, Linda Karlovska, Anna Petrasova, Vaclav Petras and Martin Landa; software: Linda Karlovska, Anna Petrasova, Vaclav Petras and Martin Landa; validation, Linda Karlovska; formal analysis, Linda Karlovska; investigation, Linda Karlovska; resources, Linda Karlovska, Anna Petrasova; data curation, Linda Karlovska; writing—original draft preparation, Linda Karlovska, Anna Petrasova; writing—review and editing, Anna Petrasova, Vaclav Petras, Martin Landa; visualization, Linda Karlovska; supervision, Martin Landa; project administration, Linda Karlovska, Martin Landa; funding acquisition: Linda Karlovska. All authors have read and agreed to the published version of the manuscript.

Funding

This work was supported by two Google Summer of Code projects (2020 and 2021) and by GRASS GIS Project Mini Grants (2022, 2023). Furthermore, it was funded by the Grant Agency of the Czech Technical University in Prague, grant No. SGS23/050/OHK1/1T/11.

Data Availability Statement

The study did not report any publicly archived datasets.

Conflicts of Interest

The authors declare no conflict of interest.

Appendix A. Questionnaires

Table A1. The list of questions and their types from Questionnaire 1 (OQ = open-ended question, SC = Single Choice, EI = example image included as a part of the question).
QuestionType
1Do you like the idea of a first-run wizard?SC with OQ + EI
2Do you like the idea of first-time mode info bars?SC with OQ + EI
3Do you have other ideas that would lead you to more straightforward navigation in the software?OQ
4What software do you think does a good job in providing a good first-time user experience?OQ
5Let’s imagine you are a first-time user. What would help you significantly in your initial orientation software? Please, rank those features according to their importance: (1) Description of main tabs (2) Description of what database, location, mapset means (3) Breaf advice on how to startRanking
Table A2. The list of questions and their types from Questionnaire 2 (OQ = open-ended question, SC = Single Choice).
QuestionType
1What do you think about the following statement? The partial removal of the startup screen and improvement of the Data Catalog simplifies the initial introduction to the software and further work.Slider
2How do you think GRASS should start when the last
mapset is not in a usable state (was deleted or is in use)?
SC with OQ
3Please, rank how useful these features in Data Catalog would be (or already are) for you: (1) Mapset access info (2) Deleting multiple mapsets of locations (3) Adding multiple databases (4) Creating, deleting, renaming mapset or location (5) New management icons (6) Removing, deleting GRASS databaseRanking
4Which features would you like to add?OQ
5Because we have limited screen space, we need to think about where we can add new features. Where would you add them?SC
6What do you think about the following statement? I would start GRASS using the file association of the workspace file (.gxw) frequently.Slider
Table A3. The list of questions and their types from Questionnaire 3 (OQ = open-ended question, SC = Single Choice, PS = prototype screenshot included as a part of the question).
QuestionType
1Take a close look at Figure 1 and answer the following questions. What will be your next step in this situation?SC + PS
2Is something confusing to you? If so, what specifically?OQ
3Take a close look at Figure 2. What will be your next step in this situation?SC + PS
4Is something confusing to you? If so, what specifically?OQ
5Take a close look at Figure 3. What will be your next step in this situation?SC + PS
6Is something confusing to you? If so, what specifically?OQ
7What do you think about the following statement? The advice in Info Bars given in each situation was straightforward and led me very well to the right answers.Slider
8Any ideas you want to share? (e.g., the change of wording in Info Bars, adding more information, or, conversely, the removal of some information)OQ
9What is your general experience with GIS?SC
10How often do you use GRASS GIS? 0 = Never used, 50 = Sometimes, 100 = Every daySlider
Table A4. The content analysis example: analysis of open responses from question 2 in Q1.
RespondentResponseAssignment
7Either in demo location or with a popup message saying the last used mapset is not available, hence opening in first location/mapset in the grassdata.Info Message
50Warning should be given.Warning message
42It should prompt the error and afterwards, with a times, default to the default mapset or the clean oneError message
13I suggest to bypass the startup screen (as it is gone anyway), show an error and let the user either exit or offer to start in Demolocation.Error message, Bypass the start-up window
37Bypass the startup window and start in world lat long location with basemapsBypass the start-up window
43If it is easy to change the location or mapset once already within the new Data Catalog, I would suggest to bypass the startup screen and start in Demolocation. Then, if the user wants, he can create a new location or change to another location. If this is not easy (for newcomers), then I would suggest a modernized version of the start screen.Bypass the start-up window
31I like it the way it is.Original start-up window
52Shows an empty data catalog with a dialog in front: Last used map is not accessible. Please select one of the following options: - create nwe one at… - select other existing one. (could possible be combined with previous one) - quitNew simple start-up window
14Guide the user to create a permanent area - basically, guide the user as if s/he was a new user and needed to know and create the essentials that GRASS needs to start functioning.Some kind of guide
27What if the user deletes the demolocation? Is it created ’on the fly’? Also, the startup screen has some interesting information to the new user (what is a location/mapset). So maybe a wizard that creates the demolocation and explains that is a database/location/mapset would be interesting. That wizard could also have an option for advanced users to skip the intro and schoose the correct location/mapset.Some kind of guide

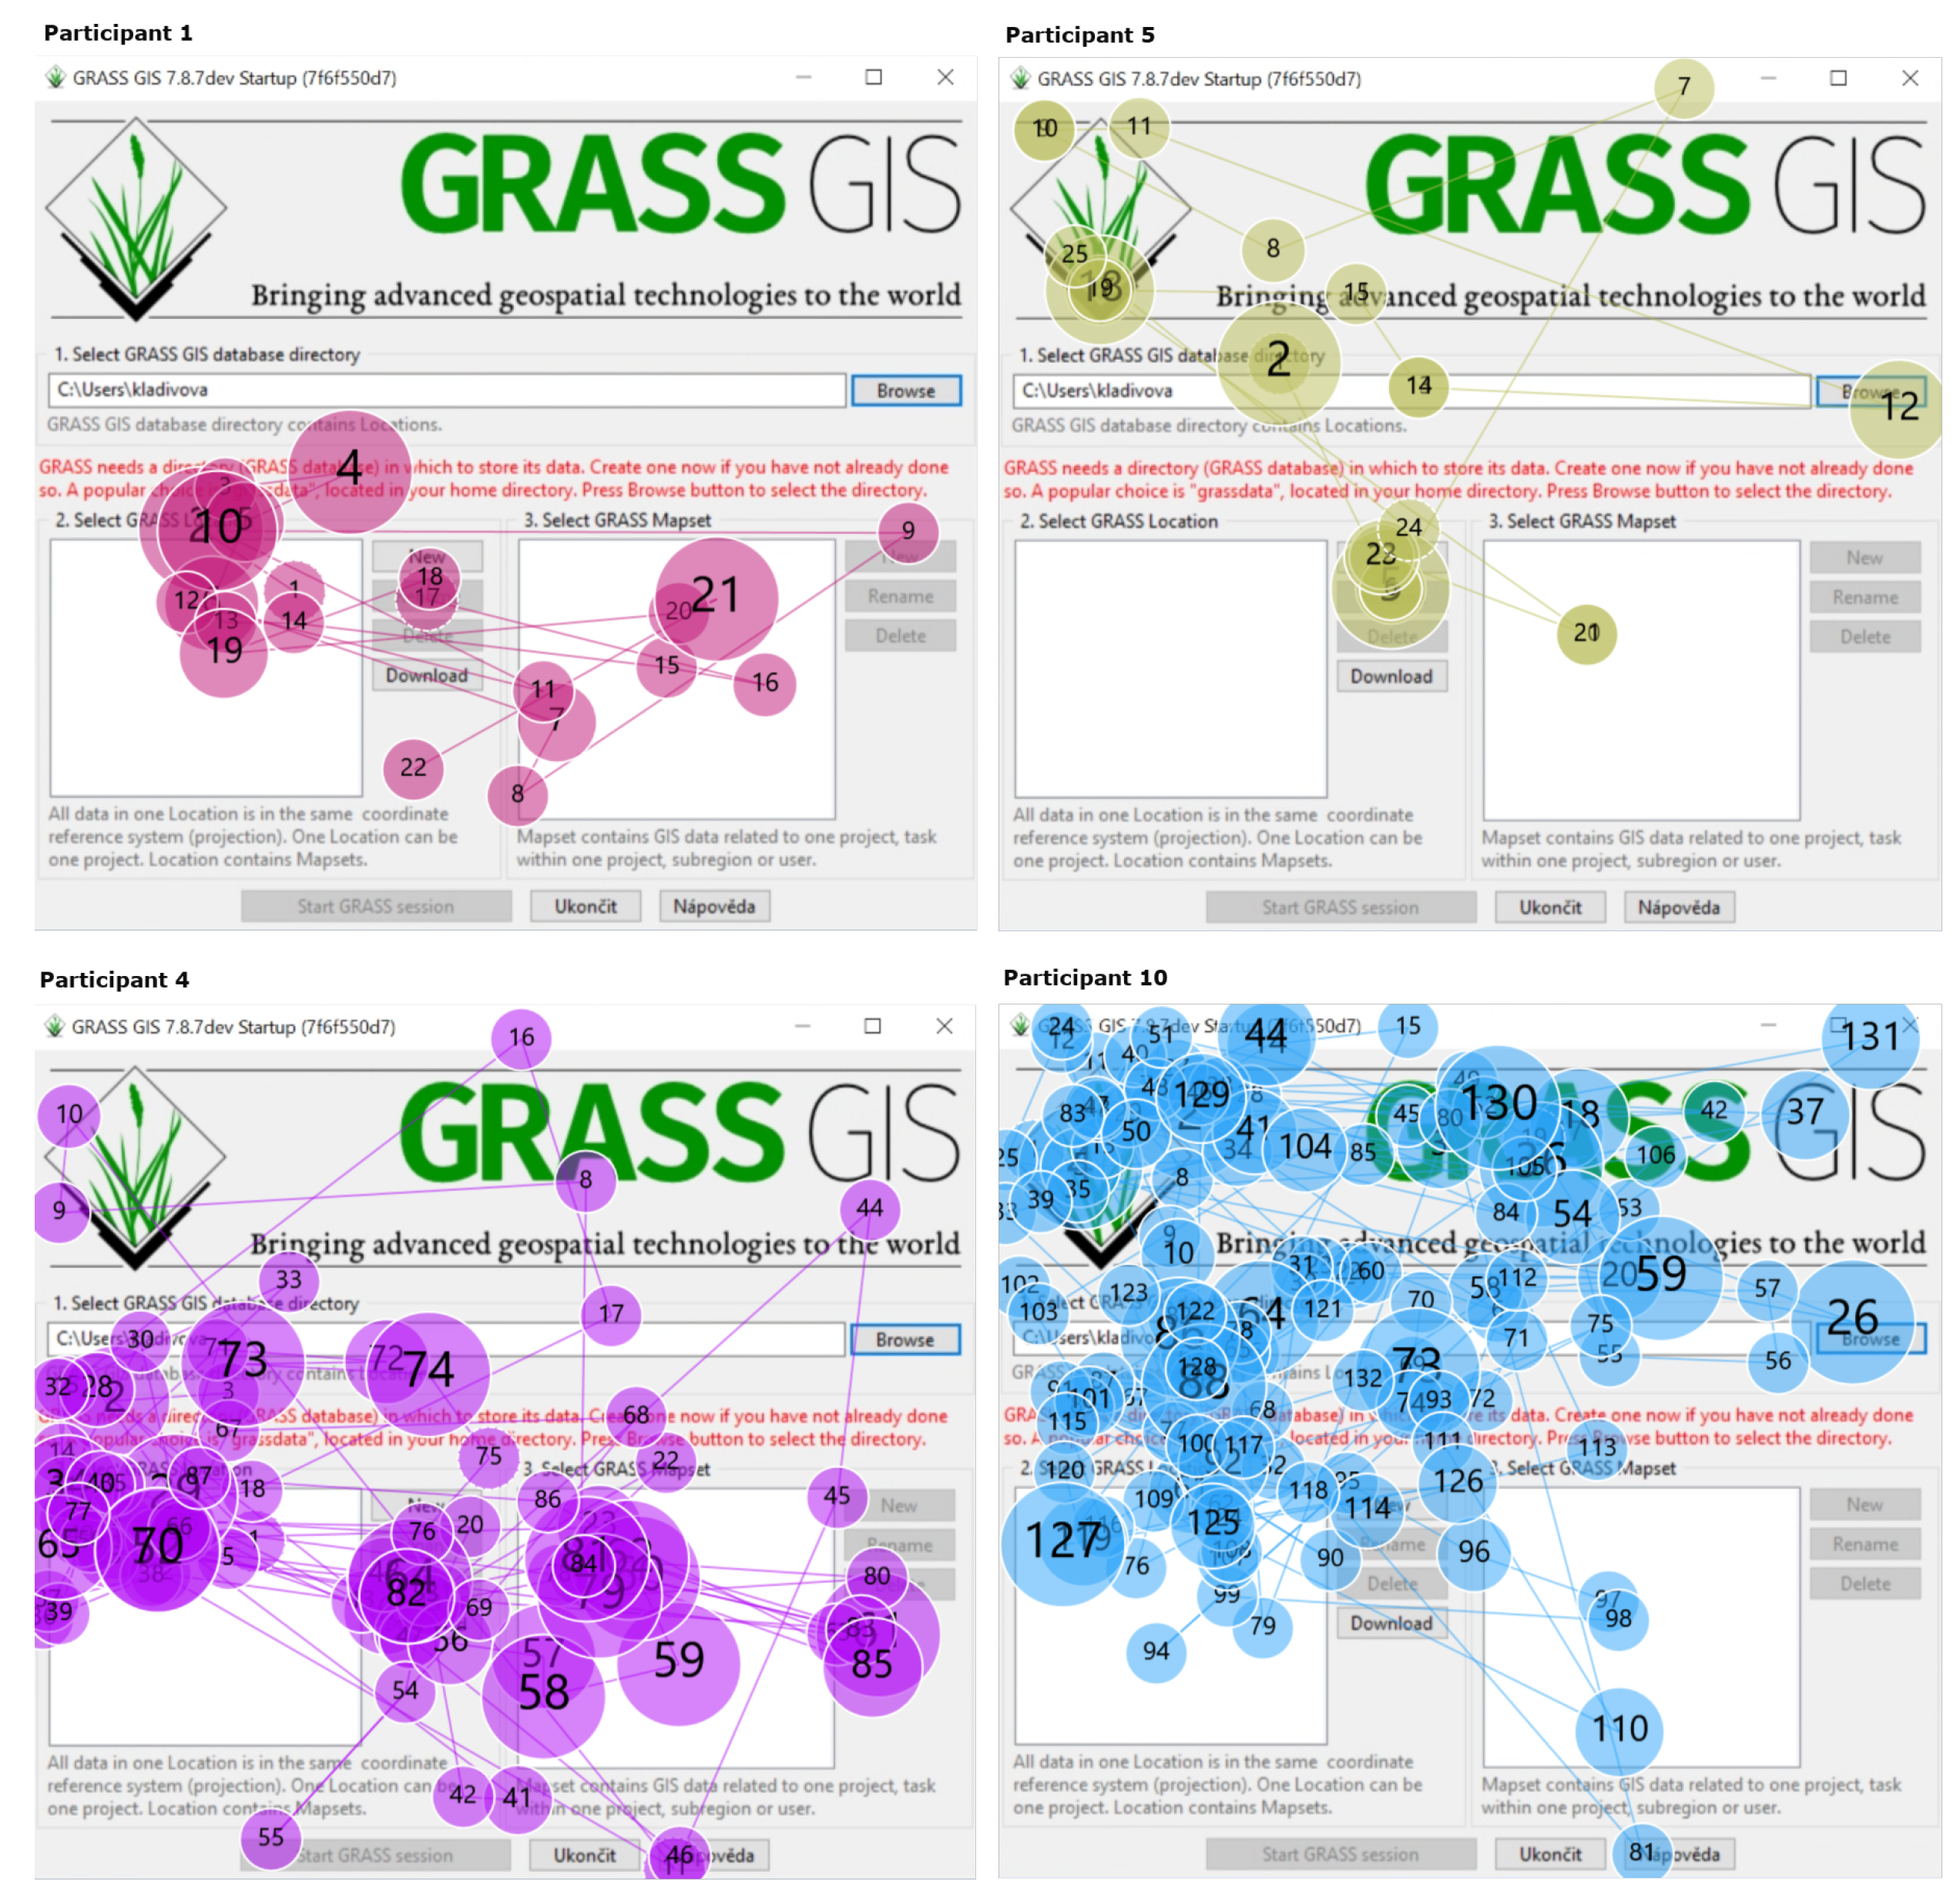
Appendix B. Visualizations from Eye-Tracking

Figure A1. Gaze plot selection for the startup screen. Circle size reflects fixation duration. Upper figures exhibit quick problem understanding while lower figures indicate confusion.
Ijgi 12 00376 g0a1
Figure A2. Heat map of the situation after startup combining partial heat maps from all participants (multi-window GUI).
Ijgi 12 00376 g0a2
Figure A3. Heat map of the situation after startup combining partial heat maps from all participants (single-window GUI).
Ijgi 12 00376 g0a3

References

  1. Nichols, D.M.; Twidale, M.B. The Usability of Open Source Software: Analysis and Prospects; The ICFAI University Press: Hyderabad, India, 2006. [Google Scholar]
  2. Andreasen, M.S.; Nielsen, H.V.; Schrøder, S.O.; Stage, J. Usability in open source software development: Opinions and practice. Inf. Technol. Control 2006, 35, 11776. [Google Scholar] [CrossRef]
  3. Wang, W.; Cheng, J.; Guo, J.L. How do open source software contributors perceive and address usability? Valued factors, practices, and challenges. IEEE Softw. 2020, 39, 76–83. [Google Scholar] [CrossRef]
  4. Cayola, L.; Macías, J.A. Systematic guidance on usability methods in user-centered software development. Inf. Softw. Technol. 2018, 97, 163–175. [Google Scholar] [CrossRef]
  5. Gould, M.D. GIS design: A hermeneutic view. Inf. Softw. Technol. 1994, 60, 1105–1116. [Google Scholar]
  6. Unrau, R.; Kray, C. Usability evaluation for geographic information systems: A systematic literature review. Int. J. Geogr. Inf. Sci. 2018, 33, 1–21. [Google Scholar] [CrossRef]
  7. Andrienko, G.; Andrienko, N.; Fischer, R.; Mues, V.; Schuck, A. Reactions to geovisualization: An experience from a European project. Int. J. Geogr. Inf. Sci. 2006, 20, 1149–1171. [Google Scholar] [CrossRef]
  8. Komarkova, J.; Jakoubek, K.; Hub, M. Usability Evaluation of Web-Based GIS: Case Study. In Proceedings of the 11th International Conference on Information Integration and Web-Based Applications & Services, New York, NY, USA, 20–23 June 2009; pp. 557–561. [Google Scholar] [CrossRef]
  9. Kammerhofer, D.; Scholz, J. An Approach to Decompose and Evaluate a Complex GIS-Application Design to a Simple, Lightweight, User-Centered App-Based Design Using User Experience Evaluation. ISPRS Int. J. Geo-Inf. 2020, 9, 505. [Google Scholar] [CrossRef]
  10. Ahmed, Z.; Zeeshan, S.; Dandekar, T. Developing sustainable software solutions for bioinformatics by the “Butterfly” paradigm. F1000Research 2014, 3. [Google Scholar] [CrossRef]
  11. Queiroz, F.; Silva, R.; Miller, J.; Brockhauser, S.; Fangohr, H. Track 1 Paper: Good Usability Practices in Scientific Software Development. Figshare 2017, 53, 1814. [Google Scholar] [CrossRef]
  12. Feng, L.; Wei, W. An Empirical Study on User Experience Evaluation and Identification of Critical UX Issues. Sustainability 2019, 11, 2432. [Google Scholar] [CrossRef]
  13. Nakić, J.; Kosović, I.N.; Franić, A. User-Centered Design as a Method for Engaging Users in the Development of Geovisualization: A Use Case of Temperature Visualization. Appl. Sci. 2022, 12, 8754. [Google Scholar] [CrossRef]
  14. Hannay, J.E.; MacLeod, C.; Singer, J.; Langtangen, H.P.; Pfahl, D.; Wilson, G. How do scientists develop and use scientific software? In Proceedings of the 2009 ICSE Workshop on Software Engineering for Computational Science and Engineering, Basel, Switzerland, 18–21 April 2009; pp. 1–8. [Google Scholar] [CrossRef]
  15. Neteler, M.; Bowman, M.H.; Landa, M.; Metz, M. GRASS GIS: A multi-purpose open source GIS. Environ. Model. Softw. 2012, 31, 124–130. [Google Scholar] [CrossRef]
  16. Ye, Y.; Sauer, F.; Ma, K.L.; Aditya, K.; Chen, J. A User-Centered Design Study in Scientific Visualization Targeting Domain Experts. IEEE Trans. Vis. Comput. Graph. 2020, 29, 525. [Google Scholar] [CrossRef] [PubMed]
  17. Barnett, L.; Harvey, C.; Gatzidis, C. First Time User Experiences in Mobile Games: An Evaluation of Usability. Entertain. Comput. 2018, 27, 4. [Google Scholar] [CrossRef]
  18. Zhou, J.; Zhang, J.; Xie, B.; Liu, N.; Jiang, M.; Wang, H.; Gan, Q. First-Time User Experience with Smart Phone New Gesture Control Features. In Proceedings of the Interacción, Puerto de la Cruz, Spain, 14–18 May 2014. [Google Scholar]
  19. Setiawan, A.; Primadewi, A. First time user experience of academic information system: An evaluation of usability. IOP Conf. Ser. Mater. Sci. Eng. 2020, 821, 012044. [Google Scholar] [CrossRef]
  20. Aragon, C.R.; Poon, S.S.; Aldering, G.S.; Thomas, R.C.; Quimby, R. Using visual analytics to maintain situation awareness in astrophysics. In Proceedings of the 2008 IEEE Symposium on Visual Analytics Science and Technology, Columbus, OH, USA, 19–24 October 2008; pp. 27–34. [Google Scholar] [CrossRef]
  21. Thomer, A.K.; Twidale, M.B.; Guo, J.; Yoder, M.J. Co-Designing Scientific Software: Hackathons for Participatory Interface Design. In Proceedings of the 2016 CHI Conference Extended Abstracts on Human Factors in Computing Systems, New York, NY, USA, 19–23 April 2016; pp. 3219–3226. [Google Scholar] [CrossRef]
  22. Luna, D.; Rizzato Lede, D.; Otero, C.; Risk, M.; Quirós, F. User-Centered Design Improves the Usability of Drug-Drug Interaction Alerts: Experimental Comparison of Interfaces. J. Biomed. Inform. 2017, 66, 9. [Google Scholar] [CrossRef]
  23. Letondal, C.; Mackay, W.E. Participatory Programming and the Scope of Mutual Responsibility: Balancing Scientific, Design and Software Commitment. In Proceedings of the Eighth Conference on Participatory Design: Artful Integration: Interweaving Media, Materials and Practices, New York, NY, USA, 2–8 December 2004; Volume 1, pp. 31–41. [Google Scholar] [CrossRef]
  24. Roth, R.; Ross, K.; MacEachren, A. User-Centered Design for Interactive Maps: A Case Study in Crime Analysis. Int. J. Geo-Inf. 2015, 4, 262–301. [Google Scholar] [CrossRef]
  25. Amal, B.; Baz, O.; Mammass, D. An Interactive Adaptive Learning System Based on Agile Learner-Centered Design. EAI Endorsed Trans. Smart Cities 2018, 2, 154106. [Google Scholar] [CrossRef]
  26. Fitzgerald, K.; Browne, L.M.; Butler, R. Using the Agile software development lifecycle to develop a standalone application for generating colour magnitude diagrams. Astron. Comput. 2019, 28, 100283. [Google Scholar] [CrossRef]
  27. Sein, M.K.; Henfridsson, O.; Purao, S.; Rossi, M.; Lindgren, R. Action design research. MIS Q. 2011, 2, 37–56. [Google Scholar] [CrossRef]
  28. Staron, M. Action Research as Research Methodology in Software Engineering. In Action Research in Software Engineering; Springer International Publishing: Berlin/Heidelberg, Germany, 2020; pp. 15–36. [Google Scholar] [CrossRef]
  29. Hellman, J.; Cheng, J.; Guo, J.L. Facilitating Asynchronous Participatory Design of Open Source Software: Bringing End Users into the Loop. In Proceedings of the CHI EA ’21 Extended Abstracts of the 2021 CHI Conference on Human Factors in Computing Systems, New York, NY, USA, 13–16 May 2021. [Google Scholar] [CrossRef]
  30. Rhinesmith, C.; Ritzo, C.; Bullen, G.; Werle, J.; Gamble, A. Participatory development of an open source broadband measurement platform for public libraries. In Information in Contemporary Society; Springer International Publishing: Berlin/Heidelberg, Germany, 2019; pp. 274–279. [Google Scholar]
  31. Haskel, L. Participatory Design and Free and Open Source Software in the Not for Profit Sector: The Hublink Project; Bournemouth University: Poole, UK, 2016. [Google Scholar]
  32. Bødker, M.; Nielsen, L.; Ørngreen, R. Enabling User Centered Design Processes in Open Source Communities. In Proceedings of the Usability and Internationalization, HCI and Culture, New York, NY, USA, 4–8 July 2007; Volume 4559, pp. 10–18. [Google Scholar] [CrossRef]
  33. Dabbish, L.; Stuart, C.; Tsay, J.; Herbsleb, J. Social Coding in GitHub: Transparency and Collaboration in an Open Software Repository. In Proceedings of the ACM 2012 Conference on Computer Supported Cooperative Work, New York, NY, USA, 22–27 February 2012; pp. 1277–1286. [Google Scholar] [CrossRef]
  34. Team, G.D. GRASS GIS—Free and Open Source Geographic Information System (GIS). Available online: https://github.com/OSGeo/grass (accessed on 3 January 2023).
  35. Team, G.D. GRASS GIS Community Gitter. Available online: https://app.gitter.im/#/room/#grassgis_community:gitter.im (accessed on 3 January 2023).
  36. Team, G.D. Change the GRASS GIS Start up to More Beginner Friendly. 2017. Available online: https://trac.osgeo.org/grass/ticket/3474 (accessed on 6 January 2023).
  37. Salinas, E.; Cueva, R.; Paz, F. A Systematic Review of User-Centered Design Techniques. In Proceedings of the Interacción, Bilbao, Spain, 3–6 July 2020. [Google Scholar]
  38. Roose, M.; Nylén, T.; Tolvanen, H.; Vesakoski, O. User-Centred Design of Multidisciplinary Spatial Data Platforms for Human-History Research. ISPRS Int. J. Geo-Inf. 2021, 10, 467. [Google Scholar] [CrossRef]
  39. Pesek, M.; Isaković, A.; Strle, G.; Marolt, M. Improving the Usability of Online Usability Surveys with an Interactive Stripe Scale; Human Computer Interaction in Information Society—IS: Ljubljana, Slovenia, 2016; pp. 21–24. [Google Scholar]
  40. Hu, K.; Gui, Z.; Cheng, X.; Wu, H.; McClure, S. The Concept and Technologies of Quality of Geographic Information Service: Improving User Experience of GIServices in a Distributed Computing Environment. Int. J. Geo-Inf. 2019, 8, 118. [Google Scholar] [CrossRef]
  41. Sonderegger, A.; Sauer, J. The influence of design aesthetics in usability testing: Effects on user performance and perceived usability. Appl. Ergon. 2009, 41, 403–410. [Google Scholar] [CrossRef]
  42. Sharafi, Z.; Sharif, B.; Guéhéneuc, Y.G.; Begel, A.; Bednarik, R.; Crosby, M.E. A practical guide on conducting eye tracking studies in software engineering. Empir. Softw. Eng. 2020, 7, 340–347. [Google Scholar] [CrossRef]
  43. Liu, P.; Jiang, Z.; Li, T.; Wang, G.; Wang, R.; Xu, Z. User experience and usability when the automated driving system fails: Findings from a field experiment. Accid. Anal. Prev. 2021, 161, 106383. [Google Scholar] [CrossRef]
  44. Cho, H.; Powell, D.; Pichon, A.; Kuhns, L.; Garofalo, R.; Schnall, R. Eye-tracking Retrospective Think-aloud as a Novel Approach for a Usability Evaluation. Int. J. Med. Inform. 2019, 129, 10. [Google Scholar] [CrossRef]
  45. Bojko, A. Eye Tracking the User Experience: A Practical Guide to Research; Rosenfeld Media: New York, NY, USA, 2013; pp. 86–151. [Google Scholar]
  46. Team, G.D. Rename Location to Project. 2023. Available online: https://github.com/OSGeo/grass/pull/2993 (accessed on 6 June 2023).
  47. The GIMP Development Team. GIMP. Available online: https://www.gimp.org (accessed on 1 January 2020).
  48. Alves, G.B.; Brandão, M.A.; Santana, D.M.; da Silva, A.P.C.; Moro, M.M. The Strength of Social Coding Collaboration on GitHub. In Proceedings of the Simpósio Brasileiro de Banco de Dados, Salvador, Brazil, 4–7 October 2016. [Google Scholar]
  49. Constantino, K.; Souza, M.; Zhou, S.; Figueiredo, E.; Kästner, C. Perceptions of open-source software developers on collaborations: An interview and survey study. J. Softw. Evol. Process. 2021, 1, e2393. [Google Scholar] [CrossRef]
  50. Virzi, R.A. Refining the Test Phase of Usability Evaluation: How Many Subjects Is Enough? Hum. Factors 1992, 34, 457–468. [Google Scholar] [CrossRef]
  51. Nielsen, J. Why You Only Need to Test with 5 Users. 2000. Available online: https://www.nngroup.com/articles/why-you-only-need-to-test-with-5-users/ (accessed on 3 August 2023).
  52. Vukovic, V.; Raković, L. Open Source Approach in Software Development—Advantages and Disadvantages. Int. Sci. J. Manag. Inf. Syst. 2008, 3, 100909. [Google Scholar]
  53. Kaur, R.; Kaur Chahal, K.; Saini, M. Understanding community participation and engagement in open source software Projects: A systematic mapping study. J. King Saud Univ.–Comput. Inf. Sci. 2022, 34, 4607–4625. [Google Scholar] [CrossRef]
  54. Landa, M. GUI development for GRASS GIS. Geoinf. FCE CTU 2007, 2, 43–52. [Google Scholar] [CrossRef]
Figure 1. Example of a GRASS hierarchical data structure: one directory with two locations (S-JTSK and WGS84 CRS) containing a total of three mapsets with nine vector layers and five raster layers.
Ijgi 12 00376 g001
Figure 2. Widgets providing functions for the data hierarchy management in GRASS GIS: (a) historically used independent start-up window, (b) improved Data Catalog which is part of the main software window.
Ijgi 12 00376 g002
Figure 3. Methodology of community-driven redesigning process and GUI evaluation.
Ijgi 12 00376 g003
Figure 4. Application of the methodology to GRASS GUI redesigning process (not including informal feedback solicitation and evaluation).
Ijgi 12 00376 g004
Figure 5. Proposal of first-time user mode: Diagram illustrating the logical flow, with hints displayed in orange color and integrated buttons.
Ijgi 12 00376 g005
Figure 6. The prototype scene presented in Q3: the first-time user hint devoted to the GRASS startup and data structure info.
Ijgi 12 00376 g006
Figure 7. The full implementation of the first-time user mode: the first hint devoted to the GRASS data hierarchy topic.
Ijgi 12 00376 g007
Figure 8. The infobar presented to a user after launching GRASS GIS into the temporary location. The hint explains the unusual start-up situation and suggests the next steps.
Ijgi 12 00376 g008
Figure 9. Single-window GUI mockup. The background from wxPython single-window demo project is partly overlayed by screenshots from GRASS GUI. All components were put together in GIMP software 2.10.20 [47].
Ijgi 12 00376 g009
Figure 10. Performance-based measures of GRASS lab usability testing: Task error rate (a) and task completion time (b).
Ijgi 12 00376 g010
Table 1. The overview of questionnaires carried out during the redesigning process.
Questionnaire MarkingQ1Q2Q3
Time span23–29 October 202023–29 October 202026–30 November 2020
Number of questions5610
Number of respondents465225
Respondent groupN/AN/A10 beginners, 15 advanced
Disclaimer/Publisher’s Note: The statements, opinions and data contained in all publications are solely those of the individual author(s) and contributor(s) and not of MDPI and/or the editor(s). MDPI and/or the editor(s) disclaim responsibility for any injury to people or property resulting from any ideas, methods, instructions or products referred to in the content.

