Article

Analysis of a Municipal Solid Waste Disposal Site: Use of Geographic Information Technology Tools for Decision Making

by
Juan Antonio Araiza-Aguilar
1,*,
María Neftalí Rojas-Valencia
2,
Hugo Alejandro Nájera-Aguilar
1,
Rubén Fernando Gutiérrez-Hernández
3 and
Carlos Manuel García-Lara
1
1
School of Environmental Engineering, University of Science and Arts of Chiapas, North Beltway 1150, Lajas Maciel, Tuxtla Gutiérrez 29000, Mexico
2
Institute of Engineering, National Autonomous University of Mexico, External Circuit, University City, Mexico City 04510, Mexico
3
Chemical and Biochemical Engineering Department, National Technology of Mexico—Technological Institute of Tapachula, Tapachula 30700, Mexico
*
Author to whom correspondence should be addressed.
ISPRS Int. J. Geo-Inf. 2023, 12(7), 280; https://doi.org/10.3390/ijgi12070280
Submission received: 27 May 2023 / Revised: 4 July 2023 / Accepted: 9 July 2023 / Published: 14 July 2023
(This article belongs to the Topic Urban Sensing Technologies)

Abstract

:
In this study, the operation of a final disposal site for municipal solid waste in the state of Chiapas, in Mexico, was evaluated. Several spatial analyses and Geographic Information Technology (GIT) tools were used. It was found that the site’s current operation and location are deficient, partially complying with regulations. The gaseous dispersion is not far-reaching (from 100 to 8725 µg/m3 for landfill gas, and from 0.01 to 0.35 µg/m3 for H2S) but requires attention to avoid olfactory unpleasantness. Liquid emissions (conservative pollutants) move in the east direction of the final disposal site, which can damage the environmental infrastructure (water supply wells) in the long term. The highest and lowest concentrations were found in years 1 (12,270 mg/m3) and 20 (1080 mg/m3), respectively. Thermal emissions around the dumping site are important due to the formation of microclimatic zones. Temperature differences were found during the analysis period, ranging from 8.37 °C in summer to 2.49 °C in winter, which are due to waste decomposition processes and anthropogenic activities. Finally, the change in land use around the dumping site increased at a rate of 5.82% per year, mainly due to the growth of homes, communication routes, and shopping centers.

Graphical Abstract

1. Introduction

The effective management of municipal solid waste (MSW) is an important challenge in today’s society. Factors such as population growth, consumption habits, and migration have a significant impact on the amount of waste produced in the world [1,2]. In developed countries, MSW management policies and hierarchies are aimed at preventing and minimizing, while in developing countries they are reversed, which means that the disposal of waste through sanitary landfills is still at a fundamental stage [3,4]. According to Espinosa et al. [5], Hereher et al. [6], and Owusu et al. [7], final disposal using sanitary landfills is very popular in many countries, especially in Latin America and the Caribbean, mainly due to the low construction and operating costs compared to other waste disposal technologies.
Sanitary landfills that are properly operated must have comprehensive control systems, which include leachate collection facilities, landfill-gas venting systems, surface and groundwater monitoring stations, specialized equipment, and machinery, etc. [8,9]. However, many times, the location, construction, and operational procedures are deficient, which causes this final disposal technology to become an open dump, which severely affects the quality of the environment and the health of the human being.
Several studies have reported significant damage in the surroundings or within a final disposal site (FDS). In Gouveia and Prado [10], Jiang et al. [11], and Palmiotto et al. [12], the affectations of the human being are addressed, which range from olfactory discomfort to various types of cancer. In Vongdala et al. [13], Przydatek [14], and Kumar et al. [15], affectations are analyzed for other components of the environment, for example, the soil, water, air, vegetation, and fauna. All these affectations are called risk that is associated with the management of MSW [16]. In addition, they normally occur due to liquid and gaseous emissions (leaching and landfill gas), which are generated in the decomposition processes of organic matter and by the ingress of rainwater [17].
Various international regulations specify that the FDS must be constantly monitored from their start-up to their closure or abandonment [18,19]. However, the municipal authorities in charge of operating these infrastructures do not have the economic resources to carry it out, especially in small municipalities or towns in developing countries. Furthermore, continuous monitoring schemes require suitable equipment and laboratory tests that consume time and effort [9]. For this reason, researchers have chosen to use other viable methods to monitor, evaluate, collect, and generate information on waste dump sites, for example, through the use of Geographic Information Technologies (GITs).
GITs were first developed in the 1960s. They are commonly integrated by Geographic Information Systems, remote sensing techniques, and satellite positioning systems [20]. Today, GITs are used in the different stages of MSW management. Karimi et al. [21], Lacoboaea and Petrescu [22], and Mahmood et al. [23] use them to monitor the temperature and health status of the vegetation around a dump site. Amal et al. [24], Fennonato et al. [25], and Kinobe et al. [26] use them to model efficient waste collection routes. Finally, Khorsandi et al. [27], Damasceno et al. [28], Ağacsapan and Cabuk [29], and Araiza et al. [30] use these technologies both for the location of treatment infrastructure or final disposal, and to model the dispersion of pollutants emitted and the effects produced.
The aim of this study was to evaluate the operation of an MSW FDS in Chiapas, Mexico, using various spatial analysis techniques and GIT tools. The results of this manuscript can serve decision making in environmental matters, and also as a basis for developing future work in the study area. Public databases are used, as well as specific fieldwork to collect information. Initially, the site conditions, its construction, and operational characteristics are analyzed. Subsequently, analyses are carried out to determine the spatial scope of the emission of leachate, landfill gas, and temperatures, as well as changes in land use in the surroundings of the FDS. Finally, compliance with Mexican regulations and the international literature is reviewed.

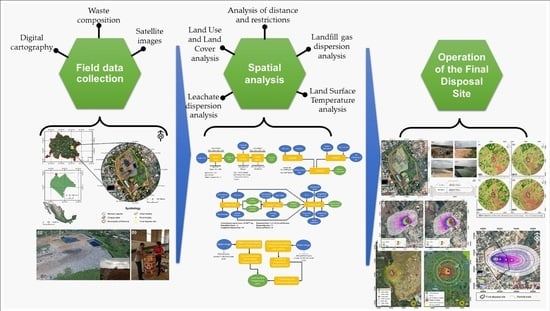
2. Materials and Methods

2.1. Study Area

The FDS analyzed is located in the state of Chiapas, southeast of Mexico, particularly in the municipality of Reforma. Its location coordinates are 93°10′7.07′′ W and 17°51′48.49′′ N, 5 km west of the municipal seat (Figure 1). The territorial extension of the study area has grown notably, influenced not only by the high rates of waste deposited, but also by the operation of the authorities in charge. Currently, the municipal government proposes to restructure the environmental policy, particularly solid waste, for which the evaluation of the location and operation of the current FDS is urgently required.

2.2. Field Data Collection

In order to evaluate the construction conditions of the FDS, as well as compliance with environmental regulations, the Mexican standard NOM-083-SEMARMAT-2003 [19] was used. This information was complemented by field visits to the dumping site and the consequent review of the existing infrastructure (Figure 2a). In this investigation, work was also carried out to obtain the waste composition (Figure 2b), the volumetric weights, and the waste entry rates, particularly the procedures outlined in NMX-AA-015-1985 [31], NMX-AA-019-1985 [32], NMX-AA-022-1985 [33], and Araiza et al. [34].

2.3. Spatial Analysis and Use of GIT

In order to evaluate the possible affectations beyond the limits of the FDS, different spatial analysis techniques with the support of GIT tools were applied, particularly distance measurements and Land Use and Land Cover Change (LULC), as well as analysis of the dispersion of leachates, landfill gas, and land surface temperature (LST).
Distance measures and other restrictions refer to the distance between the FDS and the elements that may be affected, such as population settlements, streams and bodies of water, airports, and protected natural areas, among others. All these distances and restrictions must be respected because they are established in international environmental regulations (see OJF, [19]). In this paper, the aforementioned distances were considered, as well as distances to other elements necessary for proper operation, for example, distance to roads or buyers of plastics and metals. In order to determine these distances, buffer geoprocesses were used in the GIS environment, as well as several references that have compiled this information (Table 1), specifically, the works of Araiza et al. [35], Al-Ruzouq et al. [36], and Abd-El Monsef and Smith [37].
The LULC measures are related to the degree of occupation of the land surface by some type of vegetation, but also by allocations derived from human activity [38]. In this investigation, LULC is used to determine the changes inside and outside the FDS. High spatial resolution Google Earth images from the years 2005, 2013, 2015, and 2021 were used, which had been previously georeferenced. These dates are the most representative of the behavior of the dump site. The year 2005 represents the opening year and 2013 and 2015 are transition years for the operation of the FDS, while 2021 is the year with the most recent data on operation. An Object-Based Image Analysis (OBIA) was applied, since these analyses offer greater benefits than the classic pixel-based classification methods, mainly due to the richness of the image in terms of colors, shapes, texture, and characteristics of the surroundings of the evaluated landscape [39,40]. The OBIA method began with the segmentation of images through Segment Mean Shift, and later the classification of the image using the ArcGIS Training Sample Manager with four classes (water, urban/anthropized, tree coverage, and shrub and herbaceus coverage), as well as Interactive Supervised Classification, which speeds up the maximum likelihood classification process. Finally, to estimate the rates of change between the different years and classes, the cross-tabulation matrices proposed by Pontius et al. [41], as well as the metrics of FAO [42], were used. The workflow is shown in Figure 3.
Landfill gas dispersion measurements were made to determine the spatial scope and possible concentrations of gaseous emissions in the surroundings of the FDS. In particular, the production rates of landfill gas and H2S were modeled, since they are two of the main gases generated in landfills. The dispersion analysis was carried out in two seasons (dry and rainy) through the AERMOD modeling package, particularly using its three modules (AERMET, AERMAP, and AERMOD). Meteorological data such as direction, wind speed, air temperature, atmospheric pressure, relative humidity, and cloud cover were processed by AERMET. The topographic and receiver data of the emissions were processed with AERMAP. The results of the previous processes, together with the information on the emission rates, were analyzed in AERMOD. The input data were obtained from different sources. The meteorological information (2018–2021) was provided by CONAGUA [43], especially the data from the automatic meteorological station closest to the study area. The topographic information was obtained from a digital elevation model provided by INEGI [44]. The gas emission rates generated in the FDS were determined by means of the Mexican biogas model version 2.0, specifically through the methodology proposed by Castillo et al., [45] and Araiza and Rojas [46]. The workflow is shown in Figure 4.
The measurement of leachate dispersion is another important parameter to measure the proper functioning of an FDS, especially when it operates as an open dump or controlled site, which generally do not have the infrastructure to control such emissions. In this research, the ArcGis 10.X Groundwater Toolset is used to determine the movement and direction of groundwater flow, as well as the spatial and temporal variations in the movement of the plume of a conservative contaminant (Ion Chloride Cl). The tool used allows simplified advection–dispersion modeling of the groundwater components present in the study area [47]. Guleria et al. [48] suggest using these simplified pollutant transport modeling methods, because they require less data and use data that are readily available. The workflow initially consisted of determining groundwater seepage velocity from groundwater head, porosity, transmissivity, and aquifer thickness data using Darcy flow function. Subsequently, particle tracking is determined using groundwater flow data. Finally, the concentration distribution in the subsoil was calculated using the porous puff function. The starting data were obtained from open databases, the specialized literature, and empirical determinations. The characteristics of the aquifer of the study area and the lithological data were obtained from CONAGUA [49] and SGM [50]. The groundwater head was generated from the piezometric network data from CONAGUA [51], and also by using a deterministic interpolation method. Other simulation-specific data are shown in Figure 5.
The LST measurement is the last parameter obtained through GIT tools. LST is widely used in environmental studies because it provides useful information about the physical properties of the surface and climate, either on a regional or global scale [52,53]. The determination of LST in this paper is significant, because FDS are responsible for the formation of microclimatic zones around them, which result in many local environmental implications [54]. The determination of LST was made from the thermal bands of the Landsat-7 TM (band 6) and LANDSAT-8 OLI (Band 10) satellites, both for the month of May (summer season) and December (winter season). The analysis was carried out for the years 2005, 2013, 2015, and 2021, since those years are representative of the behavior of the dump site. The LST derivation procedures were carried out as established in the papers by Das et al. [55] and Morsy and Aboelkhair [56]. The workflow is shown in Figure 6.

3. Results and Discussion

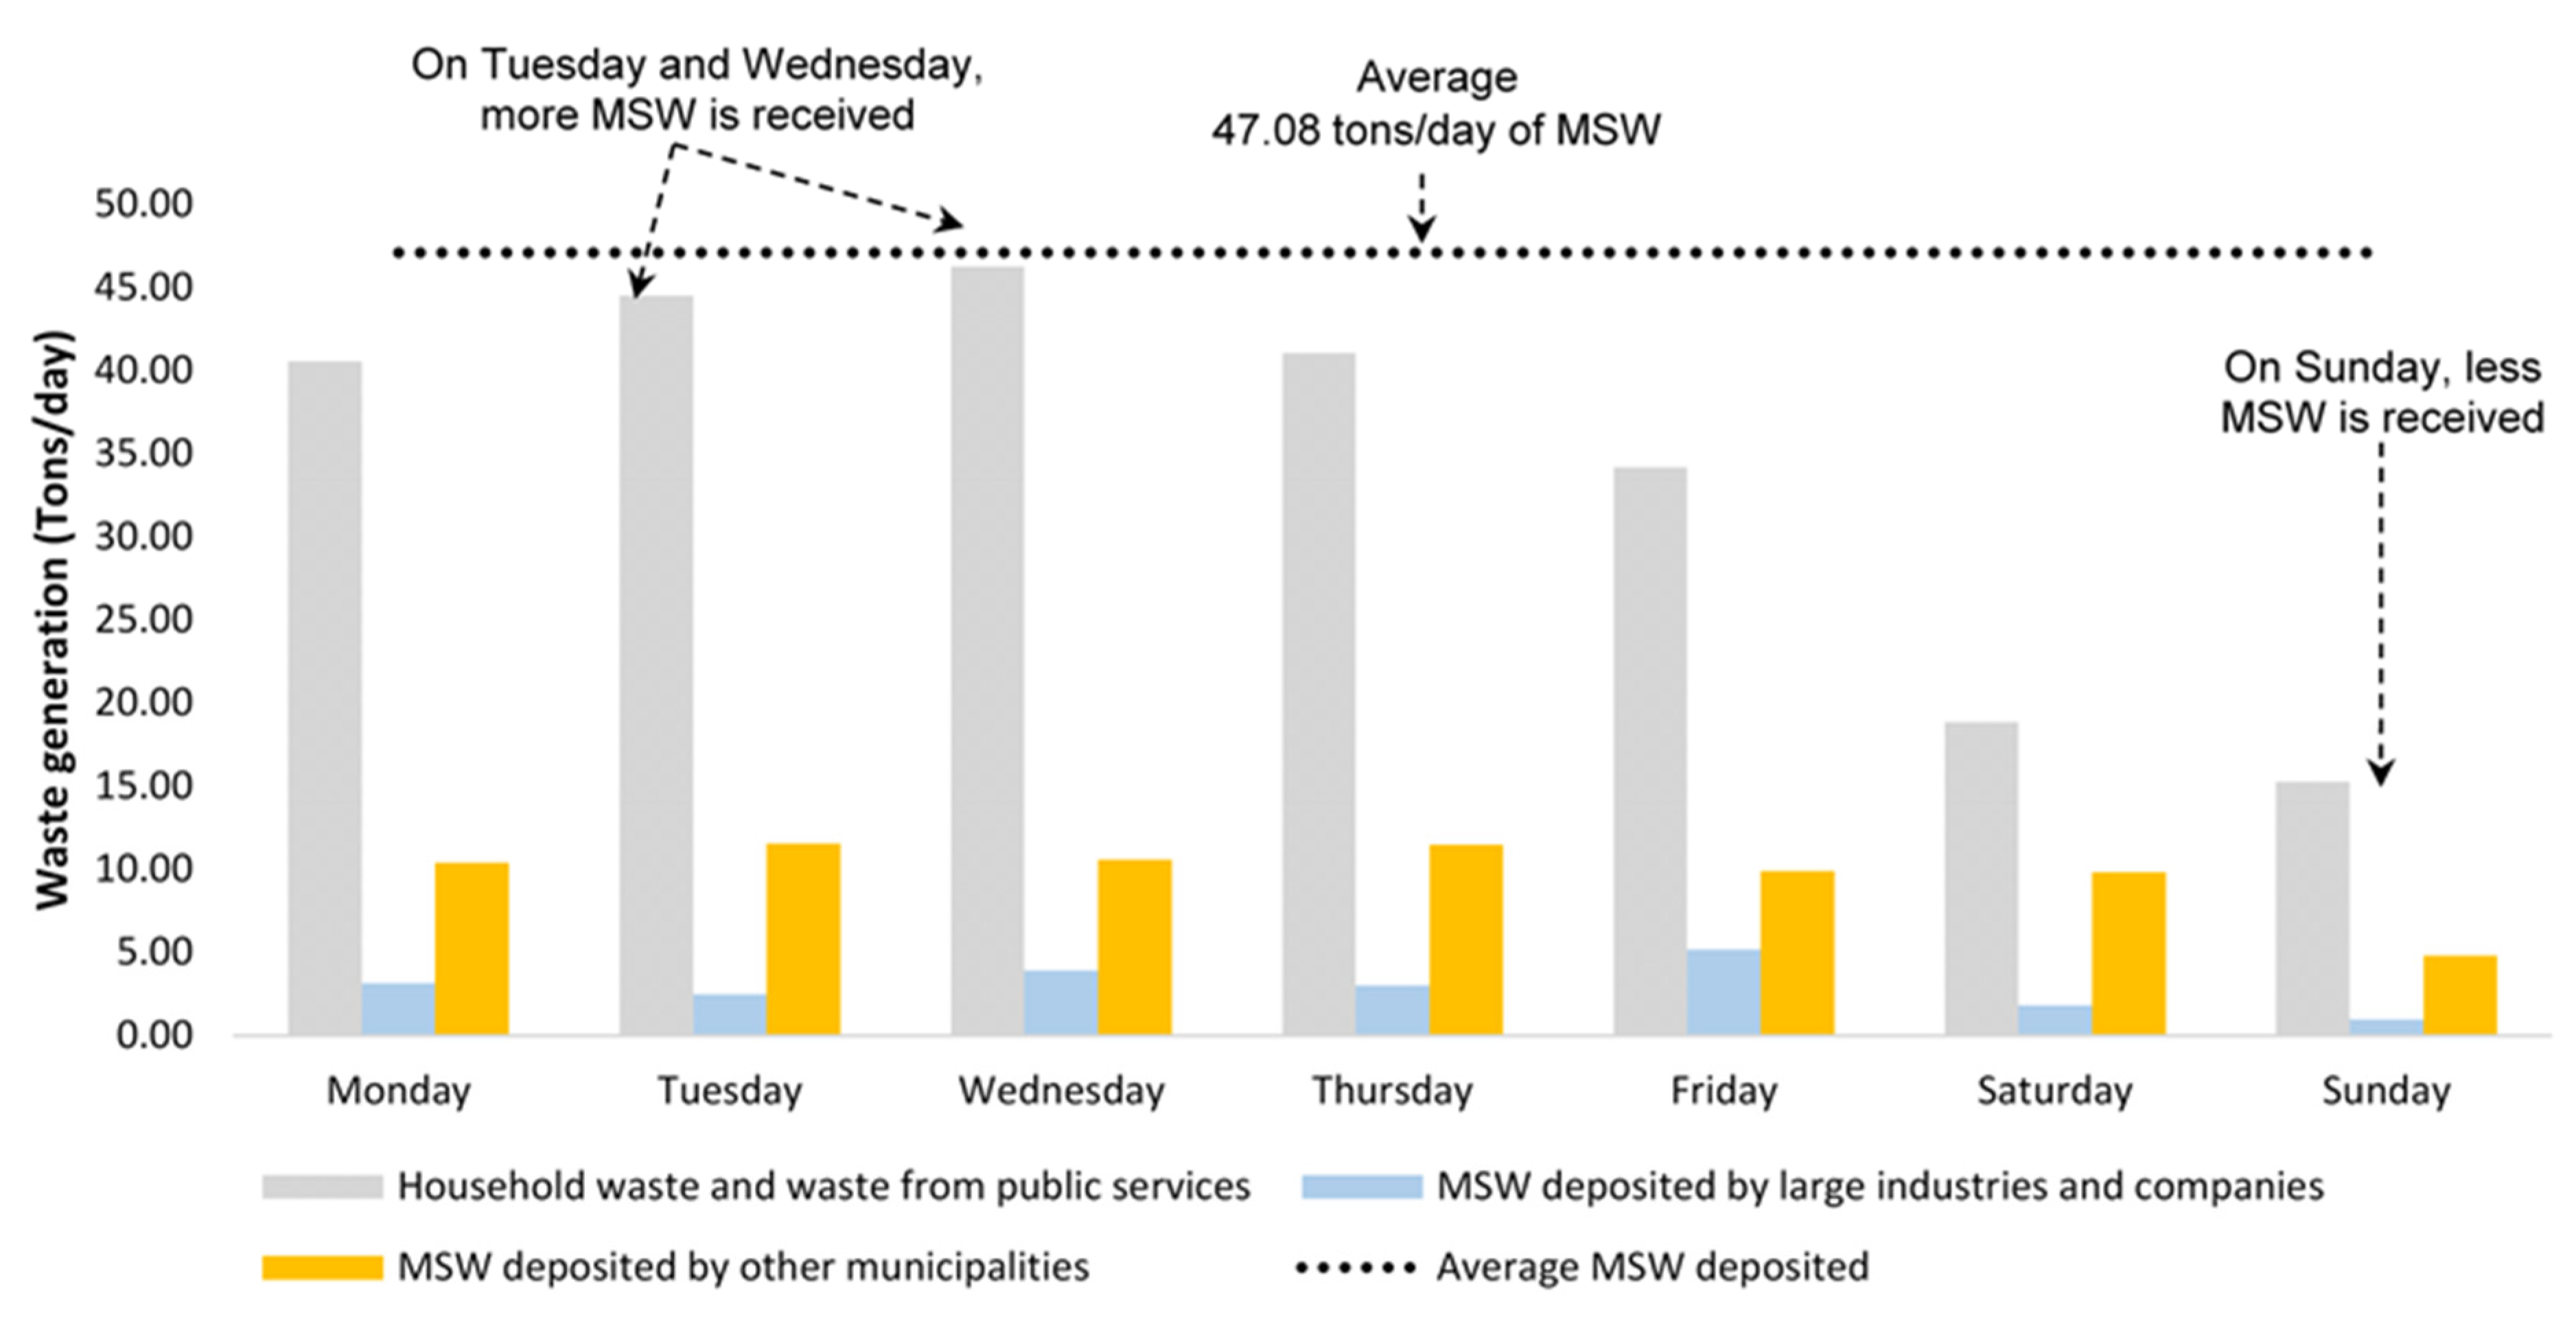
3.1. Operation of the FDS

The FDS of Reforma, Chiapas, has operated since 2005 as an open dump site (Figure 7a), in breach of what is indicated in the Mexican norm NOM-083-SEMARMAT-2003 [19]. Between 2005 and 2019, MSW was deposited directly onto the ground, in an approximate area of 2.00 Ha, without guaranteeing the daily coverage of the waste (Figure 7b), as well as the collection, conduction, or extraction of leachate and landfill gas. In some periods of time, these wastes were also burned, causing scenarios of air pollution and bad odors. Today, the waste still present is accommodated in a smaller area and is covered with soil material (Figure 7c); however, leachate production and migration are still notorious. Since 2019, the operation of the FDS is like a controlled site, because new cells have been installed (Figure 7d), which have leachate control systems (artificial barrier with geomembranes) that guarantee extraction and storage for subsequent evaporation (Figure 7e). The discharge cell has a capacity of 25,000 m3 (Figure 7f) and good management, so it can have a useful life of approximately 2 years. Additionally, other basic control structures have been added, such as the perimeter fencing and the incorporation of machinery for excavation and covering waste.
This dumping site receives waste not only from the 50 towns in the Reforma municipality, but also from other nearby municipalities such as Juárez and Pichucalco. On average, 47.08 t/day of MSW arrive, of which 73.02% (34.38 t/day) comes from Reforma, particularly from household sources and public services. An amount of 6.21% (2.93 t/day) also comes from Reforma, but from its commercial sources. Finally, the rest comes from various sources of waste production in the municipalities of Juárez and Pichucalco (20.77%, equivalent to 9.78 t/day). Other data such as MSW income per day can be seen in Figure 8.
On the other hand, the composition of the deposited waste was mostly organic (34.27%). There is also the presence of other materials such as metals (1.76%), plastics (16.27%), cardboard (11.53%), and glass (3.46%), but unfortunately only a small percentage of these by-products (<5%) are separated, stored, treated, or sold (Figure 9). These actions decrease the useful life of the current dump cells. Regarding the volumetric weights of disposed waste, these vary from 0.217 t/m3 for recently arrived waste to 0.60 t/m3 for compacted waste.
It is important to mention that other structures still need to be incorporated for a correct operation of the FDS, such as storm drains, road improvement, construction of cells for emergencies, natural barriers, etc. Their non-incorporation can cause physical instability in the waste dumping processes and severe affectations in neighboring towns. For example, studies by Ouyang et al. [57], Laner et al. [58], and Han et al. [59] address risk scenarios due to lack of infrastructure in the FDS, such as landslides, floods, or very severe contamination processes of surface and groundwater, mainly due to the discharge of nutrient salts, organic matter, and heavy metals.

3.2. Analysis of Distances and Restrictions

The FDS of Reforma, Chiapas, was located without considering the Mexican environmental regulations, as well as technical criteria for location. In the regional context, the FDS is partially compliant because it is located at long distances from airports, areas of natural importance, and geological fault lines. For example, the closest airports are located more than 40 km to the northeast and southeast, on land belonging to other municipalities or states of the Mexican Republic. Areas of natural importance, such as marshes, mangroves, estuaries, swamps, wetlands, and others, are located northeast of the study area, more than 30 km in the contiguous state of Tabasco, Mexico. These great distances do not represent a risk to environmental elements (Figure 10a).
In the local context, the breaches are notorious, particularly the proximity to urban and rural settlements, since the distances are less than 500 m. This causes disgust among the nearby residents due to the generation of bad odors, dust, and infestations of rodents or insects. Additionally, due to the constant rains in the region, as well as groundwater tables close to the surface, the existence of ephemeral streams and bodies of water is common, which produce flood zones that affect the stability of the works carried out in the FDS (Figure 10b). The presence of these aspects can disturb the proper operation of the FDS, so it must be addressed through compensatory or mitigation measures, such as those indicated in previous paragraphs (natural barriers, construction of storm drains, and adaptation of roads).
Other technical restrictions in the local context are partially met. For example, the water extraction wells are located at more than 500 m, complying with Mexican regulations. The roads are accessible and close to the FDS, which allows a constant arrival of waste collection vehicles, but also causes dust and the deterioration of paved roads.
It is important to mention that many of the breaches in the local context are due to the lack of urban policies in the study area, which are reflected in the housing conditions. According to Jaramillo [60], it is common for the surroundings of the FDS to be areas where the economically poorest population lives, which increases the degree of deterioration of all sanitary conditions and also devalues the properties. This constitutes an obstacle to the urban development of cities and towns. Additionally, segregators and recyclers who are dedicated to the purchase and sale of materials obtained in the FDS also settle near the FDS, and they precariously build their homes and expand the deterioration of the neighborhood.

3.3. LULC Analysis

The population growth of the study area, directly or indirectly, has promoted the enlargement of the urban sprawl in the municipal seat of the study area, which has led to very important changes in the landscape and physical structure of the region. Only in the LULC analysis area, which includes 3 km around the FDS (equivalent to 452.21 Ha), urban/anthropic land use has increased at a rate of 5.82% per year, going from 43.47 Ha in 2005 to 107.52 Ha in 2021 (Figure 11a,d), but with significant increases from 2013 (Figure 11b,c). These rates are similar to those reported by Silva et al. [61] and Ramos et al. [62], for other cities larger than the studied area, such as Tuxtla Gutiérrez in Chiapas or Huimanguillo in Tabasco, both in Mexico, which have an industrial or commercial vocation. This information can be seen in Table 2.
The use of urban/anthropized land has practically gained coverage of three other land uses in the study area. Tree cover has decreased at a rate of −2.45% in the global period of 2005–2021, being stronger for the period 2015–2021 with a negative rate of −12.40%. For the periods 2005–2013 and 2013–2015, tree cover has presented small gains of 3.12% and 7.87%, respectively. On the other hand, the herbaceous and shrubby cover has also varied over the years, with rates lower than −5.40% per year. The water class has presented variable changes in the study area, which do not depend on anthropic activities such as waste disposal, but rather by rainfall and groundwater tables near the surface. The changes have been −2.57% per year for the global period 2015–2021.
The factors that have caused these notable changes in the study area are mainly due to the increase in the number of houses, roads, industrial zones, shopping centers, and schools, which are directly influenced by population growth and also by bad urbanization policies. According to statistics from INEGI [63] and INEGI [64], the number of inhabitants in the study area went from 40,711 in 2010 to 44,829 in 2020; likewise, the number of commercial and service establishments increased by 32.37%, going from 1364 in 2010 to 2017 in 2022. Some strategies to improve the current conditions in the study area should be based on monitoring the regulation of territorial and environmental regulations and health risk studies.

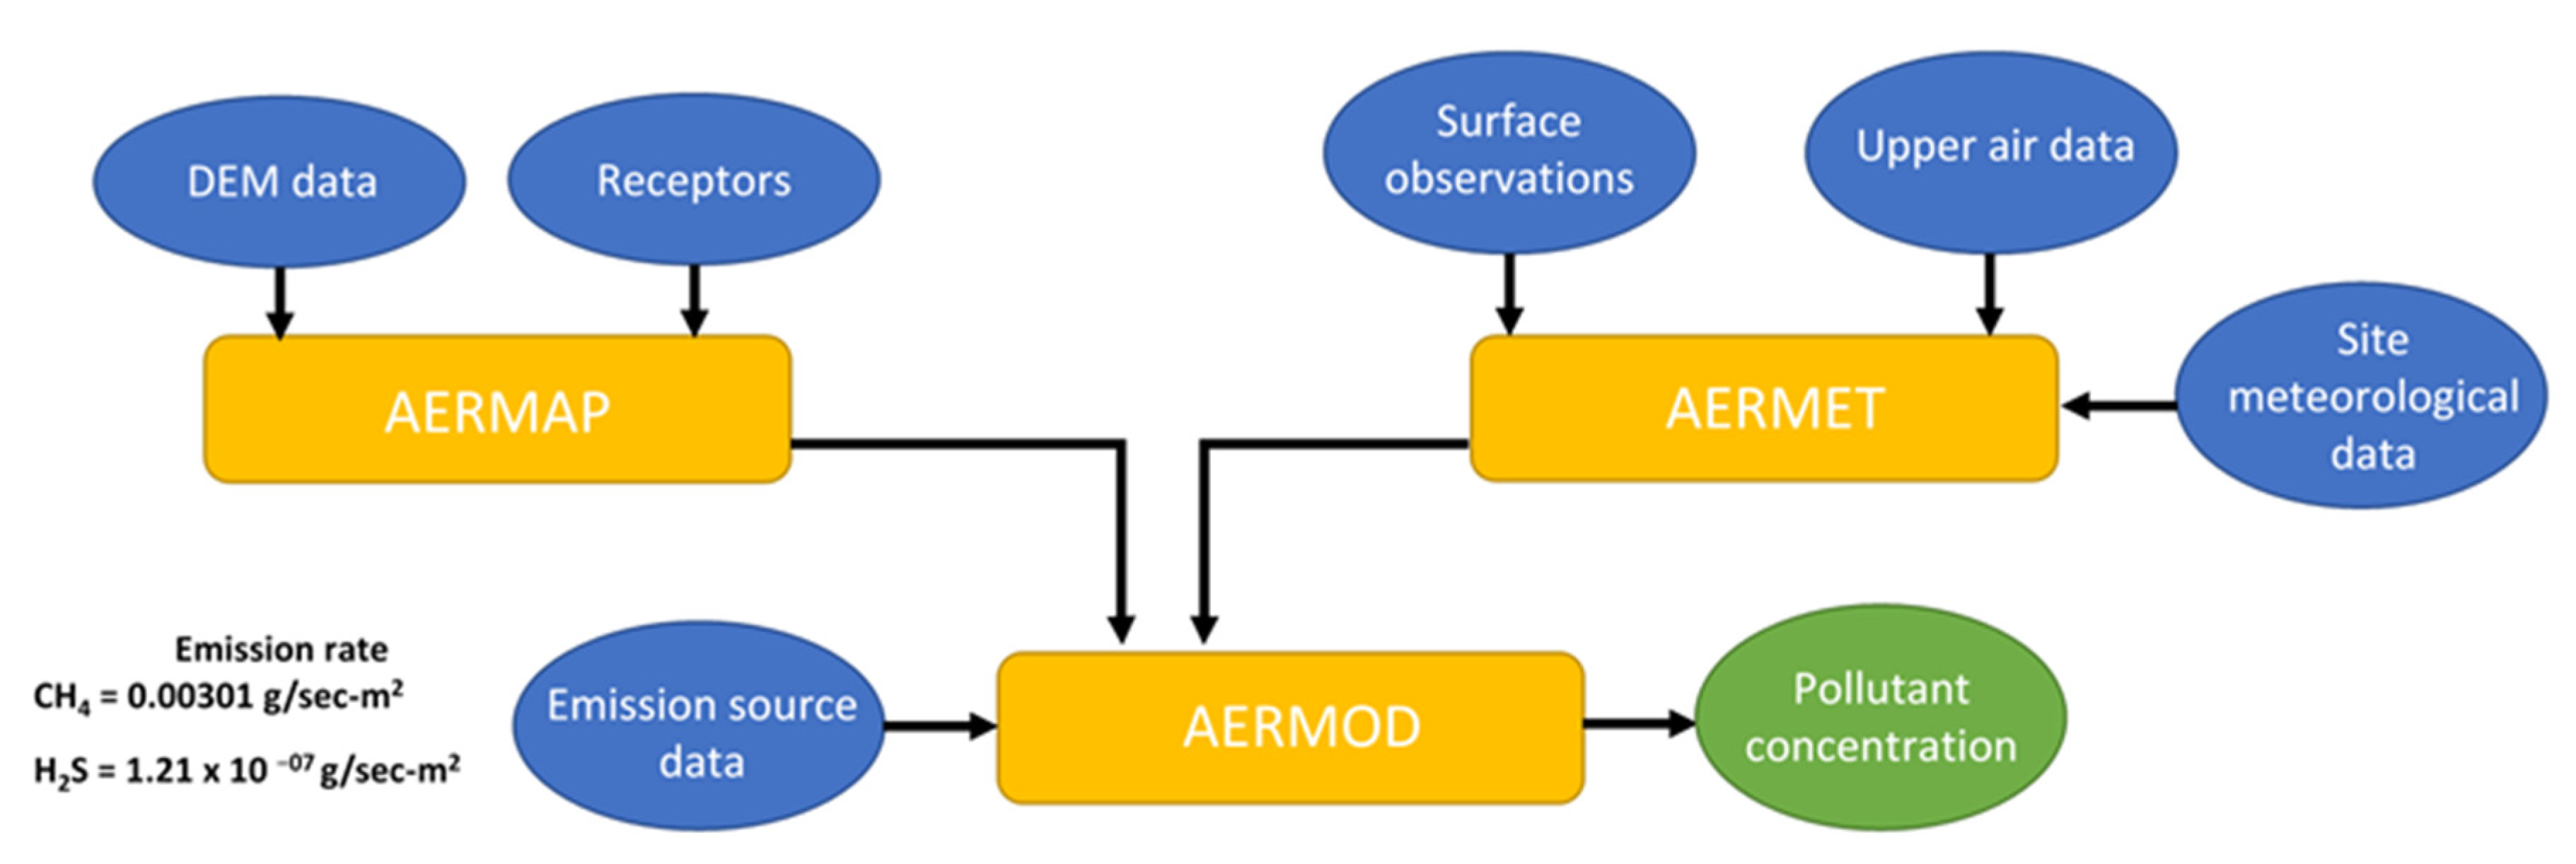
3.4. Landfill Gas Dispersion Analysis

In the local context, particularly in the vicinity of the FDS, waste degradation processes and the dispersion of polluting emissions are notorious. Regarding landfill gas and H2S, the modeling results for the 2018–2020 period indicate that the dispersion of gases from the FDS occurs in the southwest direction for both climatic seasons. The dispersal plumes can reach a range of at least 1000 m in the direction of the prevailing winds, where the concentrations that can be found range from 100 to 8725 µg/m3 (0.15 to 13.33 ppm) for landfill gas, and from 0.01 to 0.35 µg/m3 (7.19 × 10⁻⁶ to 2.52 × 10⁻⁴ ppm) for H2S (Figure 12a,b). These concentrations are low compared to those reported in other scientific works. For example, in the works of Castillo et al. [45] and Araiza and Rojas [46], where they also used similar mathematical dispersion models, the concentrations of landfill gas and H2S found are higher than 27,000 and 1.00 µg/m3, respectively. This difference in concentrations is due to multiple factors, such as the amount of waste deposited in the FDS, organic matter degradation processes, and weather conditions, as well as waste management within the disposal cells.
Despite the low concentrations found in this work, the effects of gaseous emissions can be local and global. According to Themelis and Ulloa, [65], the effects of landfill gas, particularly the major component (methane), are due to its global warming potential when it escapes into the atmosphere, which is 23 times greater than that of CO2. According to Daskalopoulos et al. [66], Köfalusi and Encarnación [67], and Tagaris et al. [68], other effects include fires and explosions within a poorly operated FDS, which occur when the major component of landfill gas (methane) is between 5% and 15% in volume, or as a result of the intentional burning of waste. Regarding H2S, it is important to highlight its low olfactory threshold, which is only 0.65 µg/m3 or less, making it detectable in places very close to the FDS, causing olfactory unpleasantness. These scenarios occurred in the study area, so it is essential to improve the operation of the FDS through good operation strategies, such as improving the frequency of waste coverage, using natural tree barriers, or even the use of burners to convert the major landfill gas (methane) emissions to CO2.

3.5. Leachates Dispersion Analysis
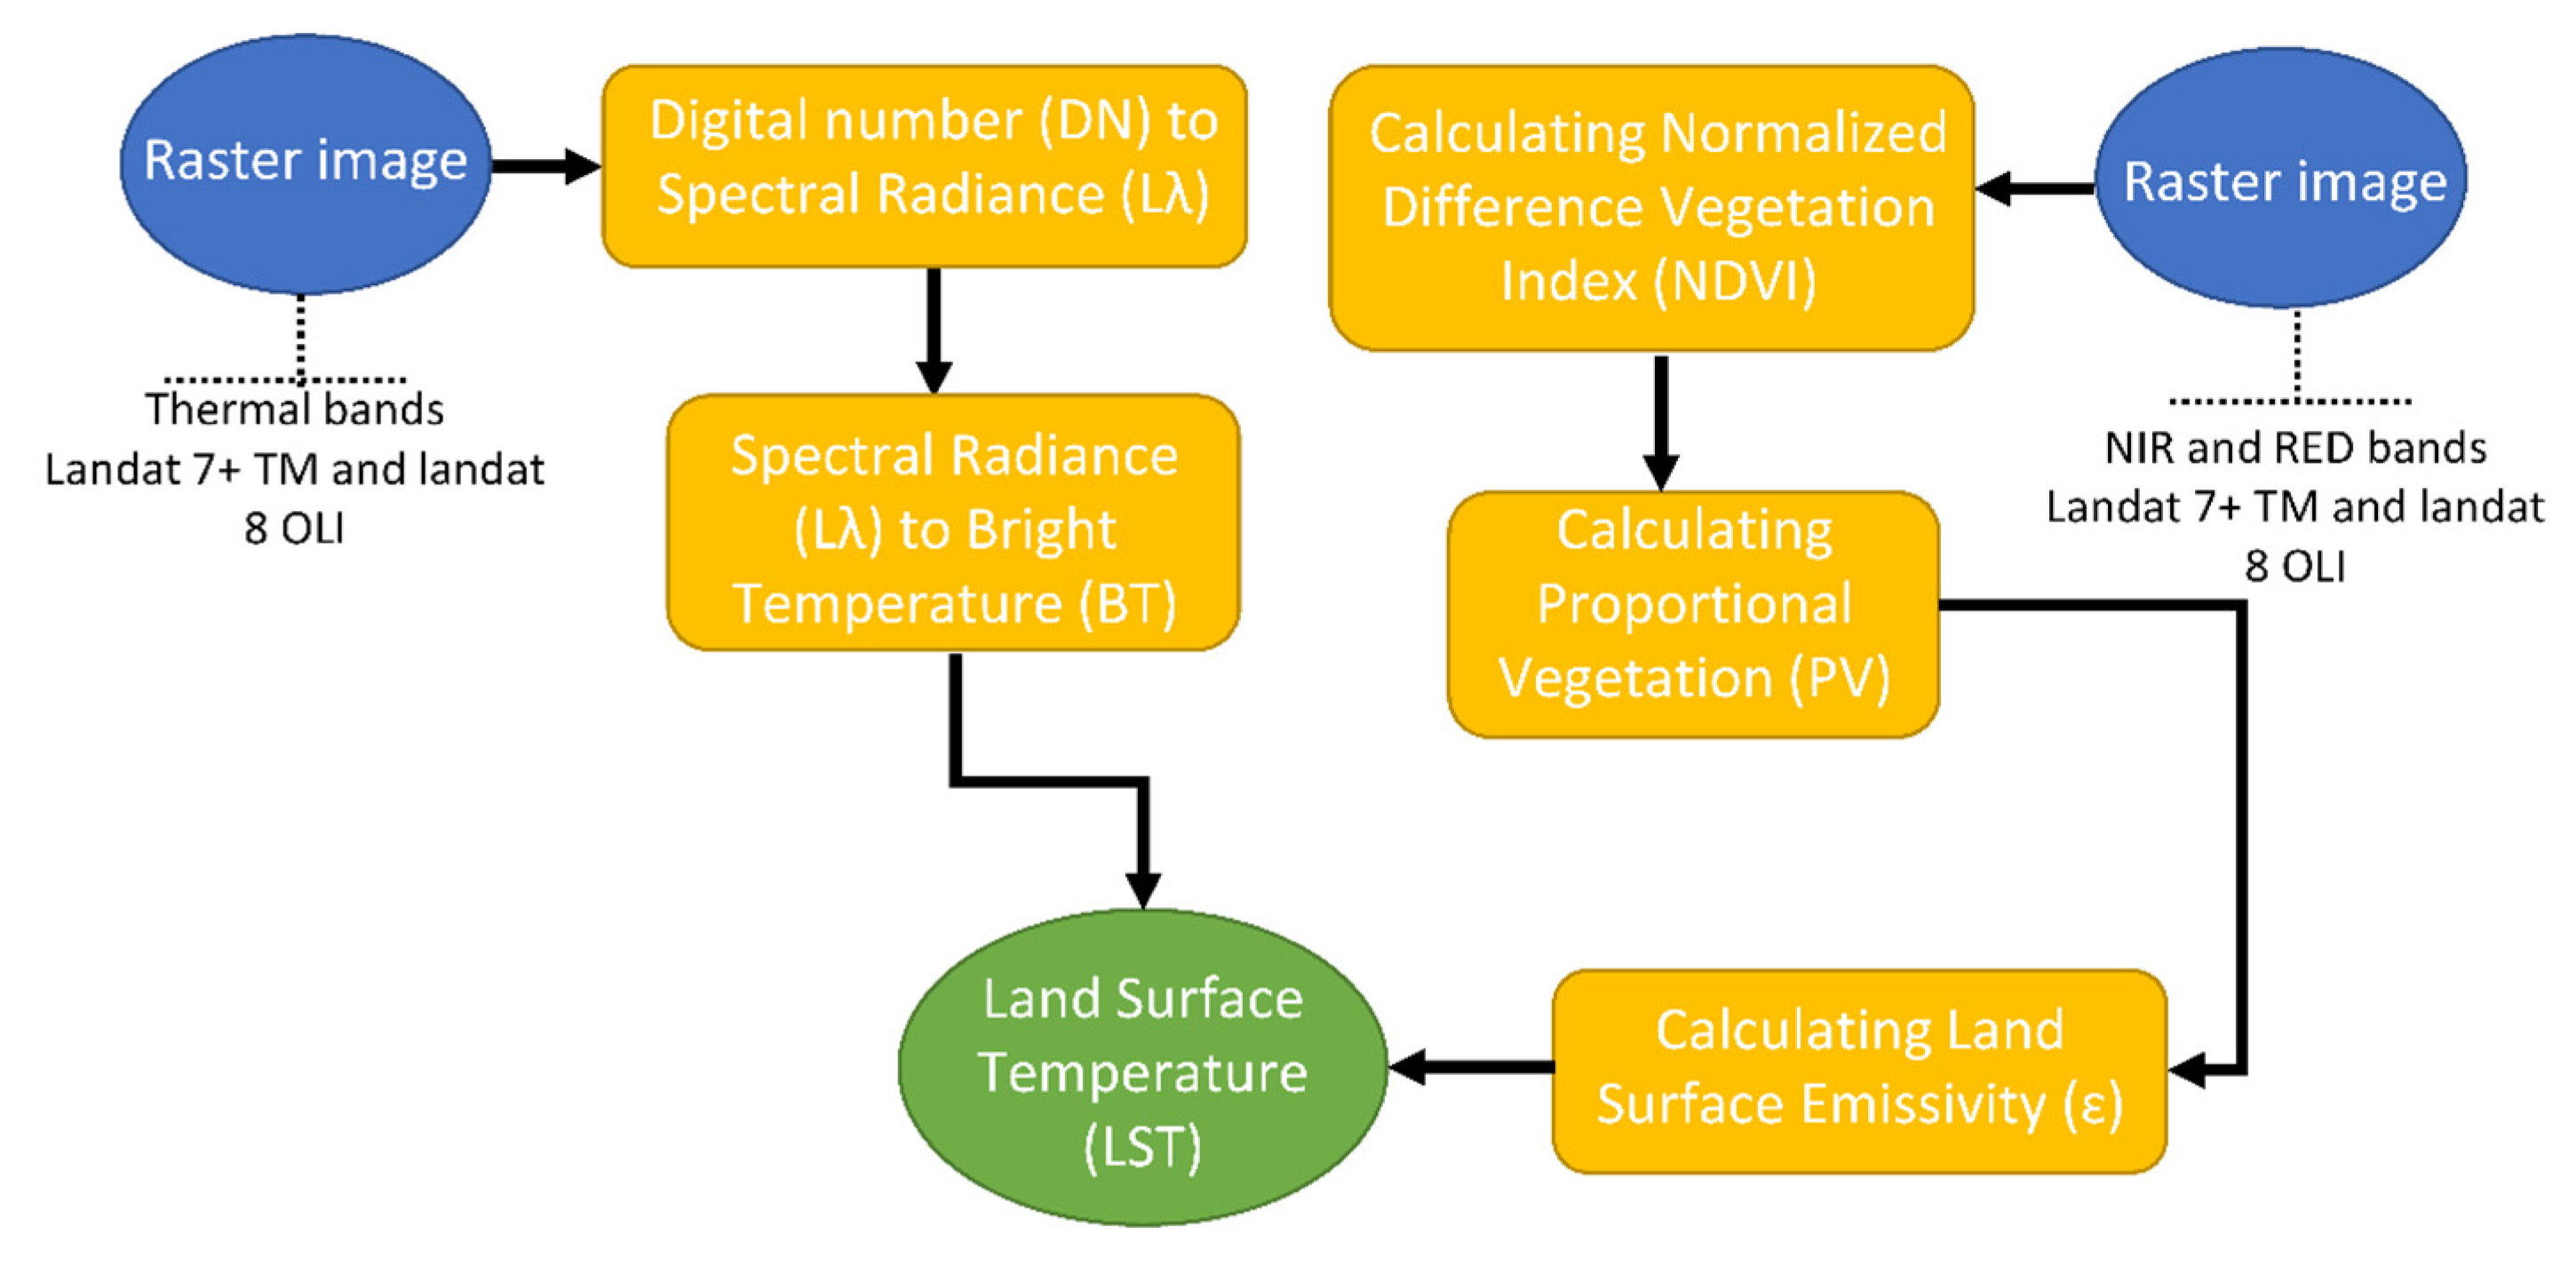
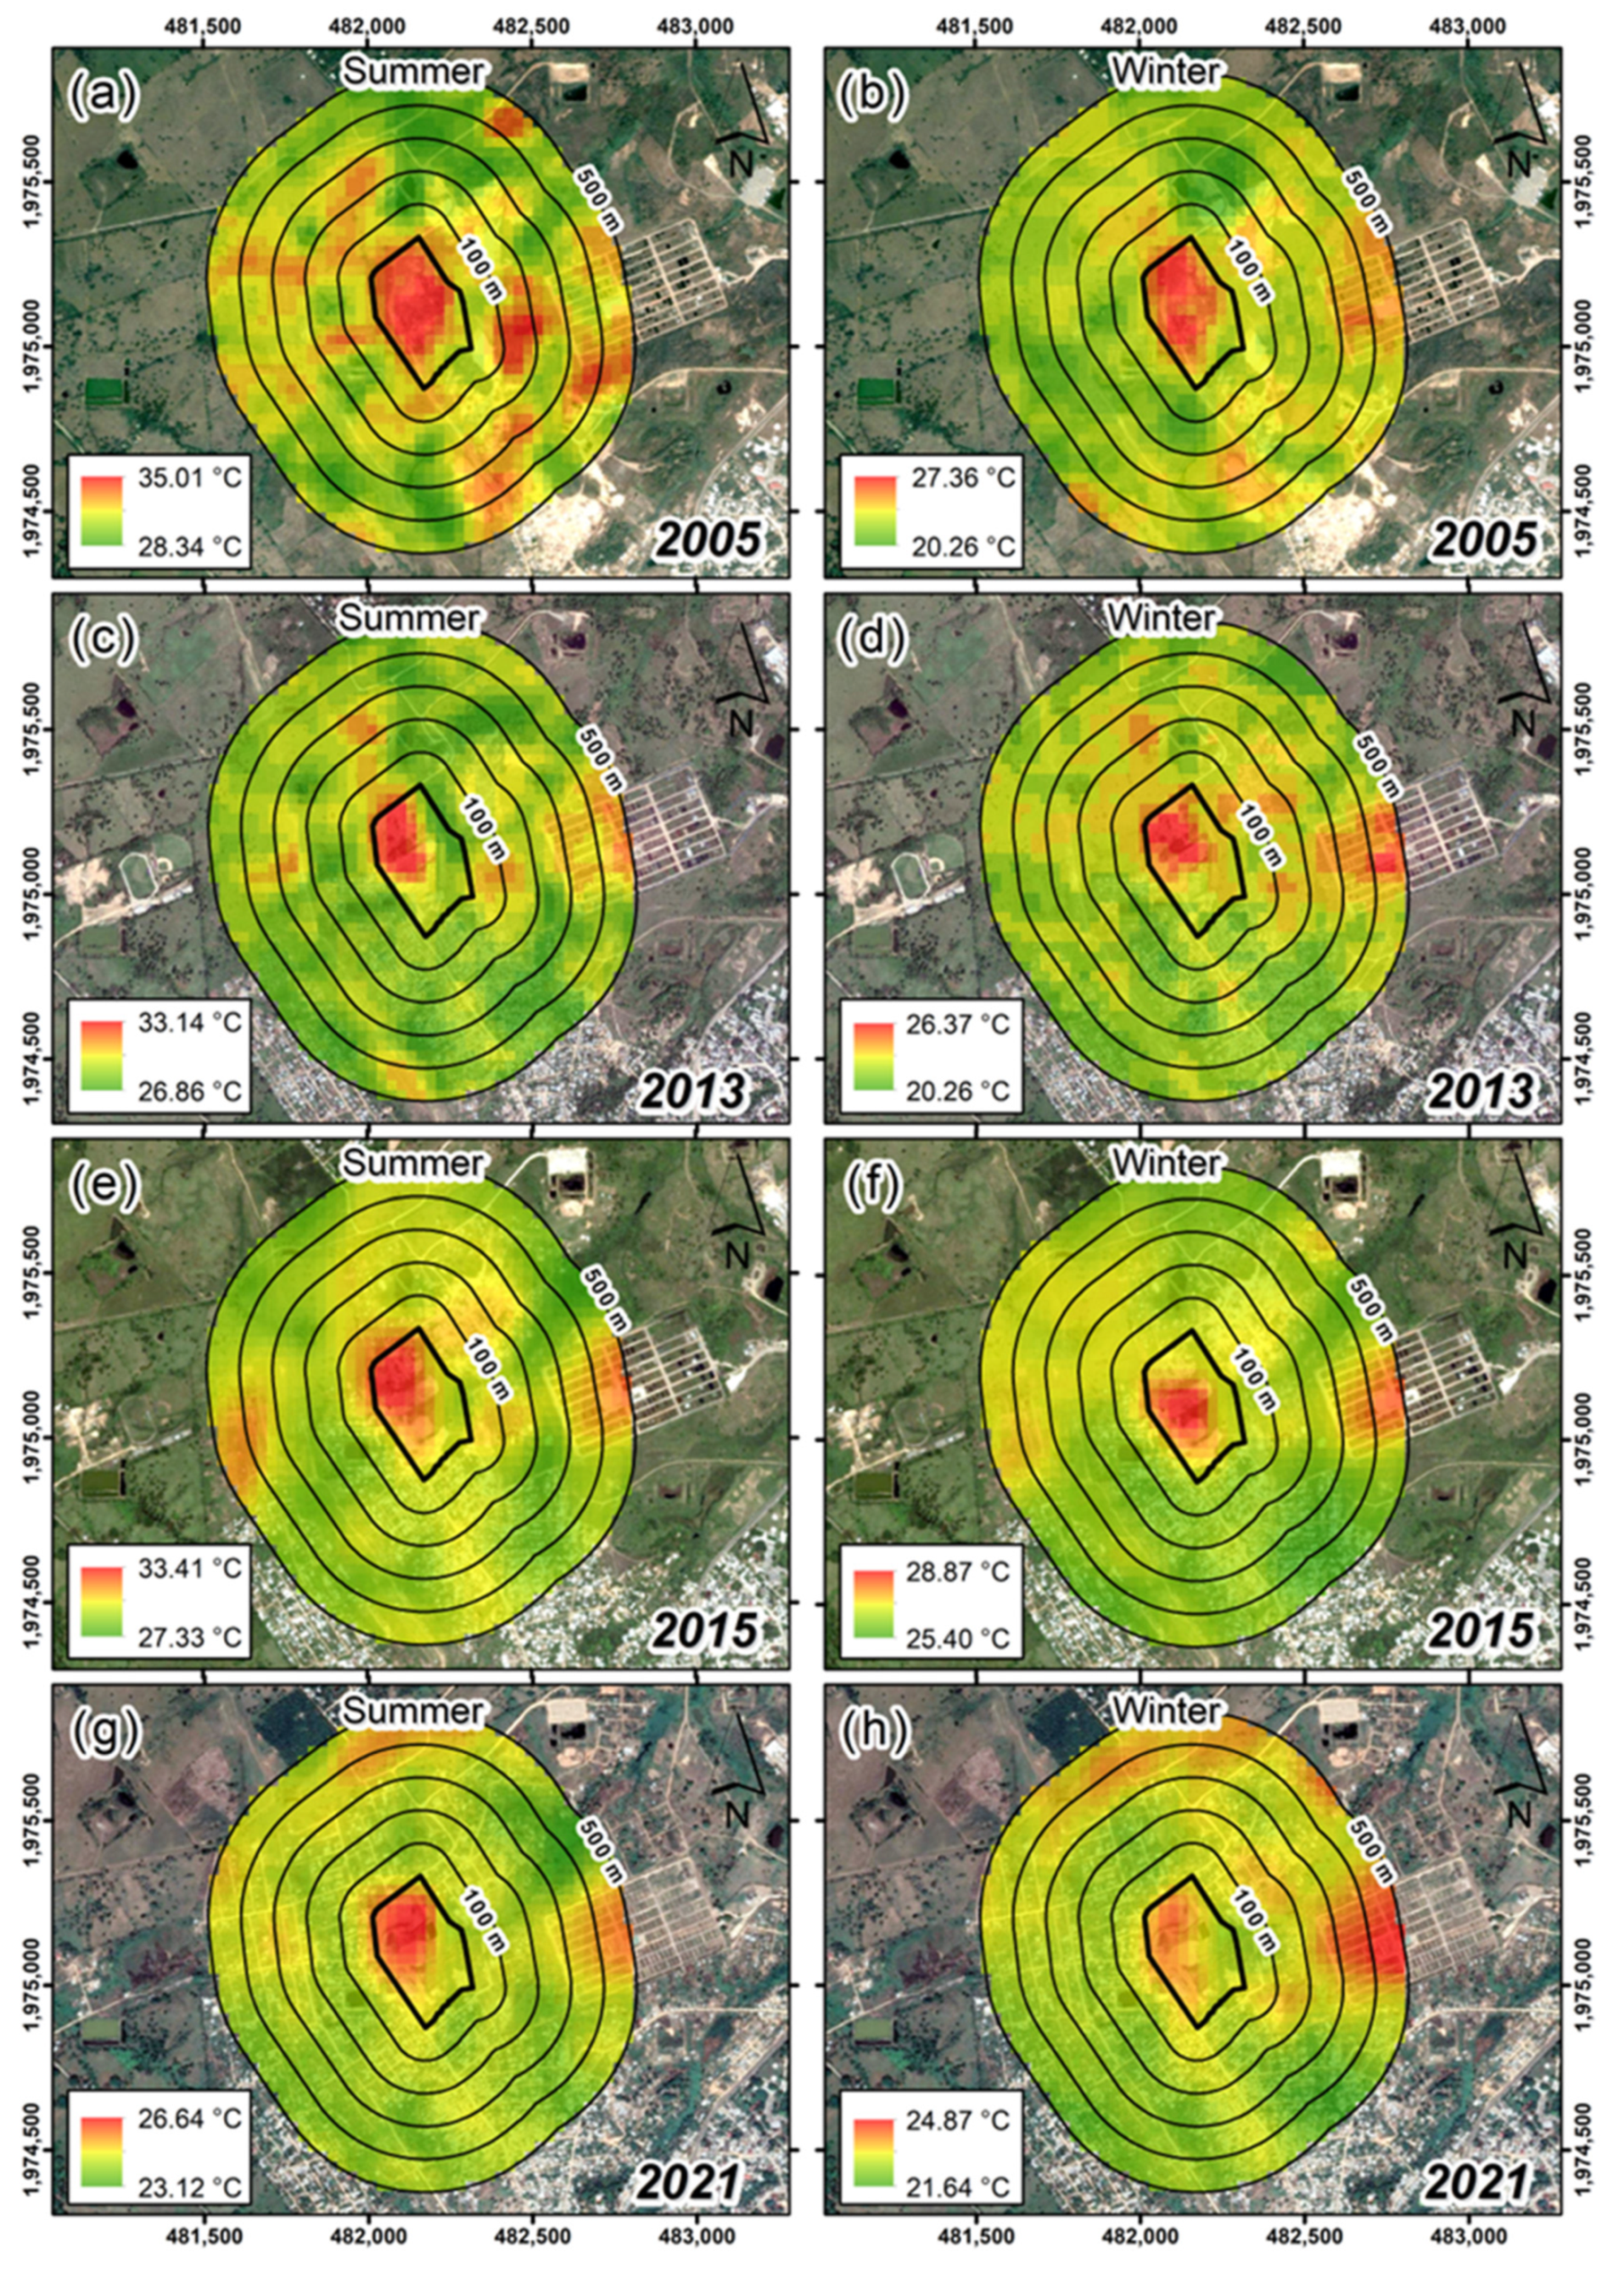
The FDS leachates are produced mainly by the humidity of the waste and by the ingress of water from constant rainfall in the study area. Unfortunately, due to the lack of waste coverage and leachate control structures in the first years of operation of the FDS, leachate continues to be discharged. According to the work carried out in the field, as well as other studies in the region (see [4,34]), the deposited MSW is composed mainly of organic matter (34.27%), which causes the high organic loads of the leachates produced. A small fraction of the dumped waste is also mixed with metals (1.76%) and hazardous (0.89%) and technological waste (1.03%), which also contribute to the toxicity of this liquid.
The hypothetical modeling carried out in this work used Chloride (Cl¯) as the pollutant emitted by the FDS, considering the emission as an instantaneous point source. This contaminant was selected because it produces feathers of great extension, while, in addition, being a non-reactive contaminant, dilution is the only attenuation mechanism [69]. Other contaminants, such as total dissolved solids (SDT), organic matter in the form of chemical oxygen demand (COD), or heavy metals, can be attenuated in the first layers of the soil, due to the physical–chemical processes and the biological activity in that area, which can disintegrate or retain many compounds [70].
Figure 13a shows the dispersion of leachate infiltrating into the soil. It is observed that the plume moves in the east direction, following the lines of groundwater flow in the region. Figure 13b shows the concentrations as a function of distance and modeling time. The highest concentration peak occurs in year 1 (12,270 mg/m3), having a range of 50 m. The lowest concentration peak occurs in year 20 (1080 mg/m3), with a hypothetical range of 450 m. Beyond these distances, the concentrations of the pollutant emitted will be lower.
Regardless of the concentrations presented in this work, it is important to consider the spatial scope that such emissions may have, since in the medium or long term they may affect the water reservoirs of the study area. These data are important for decision makers to analyze the feasibility of the FDS in future years.

3.6. LST Analysis

The determination of LST in this paper was important due to the formation of microclimatic zones 500 m around the FDS. In this work, significant temperature differences were found for the period 2005–2021, ranging from 8.37 °C for the summer season to 2.49 °C for the winter season. In Figure 14, the temperature variation between the closest and distant areas to the FDS can be clearly seen. The areas with higher temperatures always occurred within the FDS. According to Lacoboaea and Petrescu [22], this occurs due to the decomposition process of the organic matter present in the dumped waste (aerobic and anaerobic fermentation), which results in the generation of landfill gas.
Figure 14a,b show the highest temperatures found in the analyzed period (35.01 °C in summer and 27.36 °C in winter), which correspond to the most precarious operating phase of the FDS. Additionally, these high temperatures are also related to the drastic change in land use prior to the year 2005. Figure 14c–f show temperatures lower than those presented in 2005, which is due to partial compliance with Mexican regulations and the application of good operating practices, for example, the use of daily waste coverage and the restriction of burning the waste. This is also influenced by the presence of vegetation surrounding the FDS, since, according to Pokorny et al. [71], trees offer solutions for soil cooling and local climate regulation due to their ability to capture and redistribute the sun’s energy.
Finally, in Figure 14g,h, more recent information on the temperature behavior in the surroundings of the FDS is presented. There is a difference of 1.77 °C for the highest temperatures (26.64 °C in summer and 24.87 °C in winter). In addition, the radiation source of the highest temperatures no longer occurs within the FDS but is rather due to human settlements and their anthropic activities.
It is important to indicate that the temperature maps shown in this work will be useful for decision makers, since they can not only be used to mark the limit of the zone of thermal influence around the MSW dump sites but also to study its seasonal fluctuations that include land uses other than that of the FDS. In addition, these data can be incorporated into other studies, such as the selection of MSW management infrastructure.

3.7. Recommendations in Decision Making

This paper presents different spatial analysis techniques that allow visualization of the behavior of uncontrolled emissions from the FDS and regulatory non-compliance. The results presented can be used for decision making. For example, with respect to the location and current operation of the FDS, non-compliance with Mexican regulations is not possible, for which reason negotiations can be started for closure or relocation. Regarding leachate emissions, studies must be conducted promptly in water supply wells close to the FDS, to correlate emissions with environmental and human health effects. Regarding gaseous emissions, actions that can reduce environmental impacts include the placement of live barriers around the FDS, coverage of waste dumped more frequently, and placement of landfill gas burners. In terms of land use planning, it is essential for decision makers to manage studies to establish a new FDS, as well as to incorporate these priority issues in territorial risk management processes.
Finally, it is also important for decision makers in the government sector to approach the academic, social, and industry sectors to agree on municipal strategies, such as developing local regulations and designing and acquiring infrastructure for waste collection, among others.

4. Conclusions

In this study, the operation of an MSW FDS in Chiapas, Mexico, was evaluated using several spatial analysis techniques and GIT tools. Although in this work only the anthropogenic actions that occur in the study area are empirically modeled, the results provide useful information for decision making.
The analysis of distances and restrictions showed that the FDS partially followed Mexican regulations. In the regional context, the FDS complies because it is far-found environmental structures which may be affected, such as water extraction wells, rivers, or areas of natural importance. In the local context, the FDS does not comply because it is used incorrectly. In addition, several important works still need to be incorporated, such as storm drains, adaptation of roads, cells for emergencies, and natural barriers. In the event that these control structures are not incorporated in the medium term, scenarios of physical instability in the waste dumping processes, and severe affectations in surrounding populations, may arise.
The GIT tools and techniques used in this paper allowed visualizing the movement and spatial scope of the most important sub-products generated by MSW, such as leachate and landfill gas. Other changes that occur in the regional context, which are difficult to identify with the naked eye, such as LULC or LST, were also detected. Additionally, the use of these tools entailed advantages such as simple procedures, use of free or easily accessible data, and the possibility of replicating in other places.

Author Contributions

Conceptualization, Juan Antonio Araiza-Aguilar; methodology, Juan Antonio Araiza-Aguilar and Hugo Alejandro Nájera-Aguilar; investigation, Rubén Fernando Gutiérrez-Hernández; writing—original draft preparation, Carlos Manuel García-Lara; writing—review and editing, María Neftalí Rojas-Valencia. All authors have read and agreed to the published version of the manuscript.

Funding

This research received no external funding.

Institutional Review Board Statement

Not applicable.

Informed Consent Statement

Not applicable.

Data Availability Statement

Not applicable.

Acknowledgments

The support granted by the Institute of Science, Technology and Innovation of the State of Chiapas, for the preparation of this paper, is appreciated. We also thank the National Water Commission, as well as the professors from the University of Science and Arts of Chiapas, Juan Luis Escobar Hernández and Saul López Aguilar, for providing data to prepare the spatial analysis of this work.

Conflicts of Interest

The authors declare no conflict of interest.

References

  1. Abdel-Shafy, H.; Mansour, M. Solid waste issue: Sources, composition, disposal, recycling, and valorization. Egypt. J. Pet. 2018, 27, 1275–1290. [Google Scholar] [CrossRef]
  2. Silpa, K.; Yao, L.; Bhada-Tata, P.; Van Woerden, F. What a Waste 2.0: A Global Snapshot of Solid Waste Management to 2050; Urban Development; World Bank: Washington, DC, USA, 2018; p. 272. [Google Scholar]
  3. OJEU, Official Journal of the European Union. Directive 2008/98/EC of the European Parliament and of the Council of 19 November 2008 on Waste and Repealing Certain Directives, L 312, 3-30. Available online: https://eur-lex.europa.eu/legal-content/EN/TXT/?uri=celex%3A32008L0098 (accessed on 23 January 2023).
  4. Araiza, J.; Chávez, J.; Moreno, J.; Rojas, M. Municipal Solid Waste Management in a Municipality of Chiapas, Mexico. Soc. Sci. 2017, 6, 133–140. [Google Scholar] [CrossRef] [Green Version]
  5. Espinosa, M.; López, M.; Pellón, A.; Robert, M.; Díaz, S.; González, A.; Rodríguez, N.; Fernández, A. Analysis of the behavior of leachates generated in a municipal solid waste landfill in the city of Havana. Rev. Int. Contam. Ambie. 2010, 26, 313–325. [Google Scholar]
  6. Hereher, M.; Al-Awadhi, T.; Mansour, S. Assessment of the optimized sanitary landfill sites in Muscat, Oman. Egypt. J. Remote. Sens. Space Sci. 2019, 23, 355–362. [Google Scholar] [CrossRef]
  7. Owusu-Nimo, F.; Oduro-Kwarteng, S.; Essandoh, H.; Wayo, F.; Shamudeen, M. Characteristics and management of landfill solid waste in Kumasi, Ghana. Sci. Afr. 2019, 3, e00052. [Google Scholar] [CrossRef]
  8. Hoornweg, D.; Bhada-Tata, P. What a Waste: A Global Review of Solid Waste Management; Urban Development Series; World Bank: Washington, DC, USA, 2012; p. 98. [Google Scholar]
  9. Yan, W.; Mahendrarajah, P.; Shaker, A.; Faisal, K.; Luong, R.; Al-Ahmad, M. Analysis of multi-temporal landsat satellite images for monitoring land surface temperature of municipal solid waste disposal sites. Environ. Monit. Assess. 2014, 186, 8161–8173. [Google Scholar] [CrossRef]
  10. Gouveia, N.; Prado, R. Health risks in areas close to urban solid waste landfill sites. Rev. Saude Publ. 2010, 44, 859–866. [Google Scholar] [CrossRef] [Green Version]
  11. Jiang, J.; Wang, F.; Li, J. Ammonia and hydrogen sulphide odour emissions from different areas of a landfill in Hangzhou, China. Waste Manag. Res. 2020, 39, 360–367. [Google Scholar] [CrossRef]
  12. Palmiotto, M.; Fattore, E.; Paiano, V.; Celeste, G.; Colombo, A.; Davoli, E. Influence of a municipal solid waste landfill in the surrounding environment: Toxicological risk and odor nuisance effects. Environ. Int. 2014, 68, 16–24. [Google Scholar] [CrossRef]
  13. Vongdala, N.; Tran, H.; Teschke, R.; Khanh, T. Heavy Metal Accumulation in Water, Soil, and Plants of Municipal Solid Waste Landfill in Vientiane, Laos. Int. J. Environ. Res. Public Health 2019, 16, 22. [Google Scholar] [CrossRef] [Green Version]
  14. Przydatek, G. Multi-indicator analysis of the influence of old municipal landfill sites on the aquatic environment: Case study. Environ. Monit. Assess. 2019, 191, 773. [Google Scholar] [CrossRef] [PubMed] [Green Version]
  15. Kumar, S.; Dhar, H.; Nair, V.; Rena, J.; Arya, S.; Bhattacharya, K.; Vaidya, A.; Akolkar, A. Environmental quality monitoring and impact assessment of solid waste dumpsites in high altitude sub-tropical regions. J. Environ. Manag. 2019, 252, 109681. [Google Scholar] [CrossRef]
  16. Araiza, J.; Cram, S.; Ruiz, N.; Oropeza, O.; Fernández, M.; Rojas, M. What does ‘risk’ mean in municipal solid waste management? Investigaciones Geográficas 2021, 105, 1–20. [Google Scholar] [CrossRef]
  17. El-Fadel, M.; Findikakis, A.; Leckie, J. Environmental Impacts of Solid Waste Landfilling. J. Environ. Manag. 1997, 50, 1–25. [Google Scholar] [CrossRef]
  18. OJEU, Official Journal of the European Union. Directive 1999/31/EC of 26 April 1999 on the Landfill of Waste. Available online: https://eur-lex.europa.eu/legal-content/EN/TXT/?uri=celex%3A31999L0031 (accessed on 23 January 2023).
  19. Mexican Official Standard NOM-083-SEMARNAT-2003; Specifications for Environmental Protection Related to the Site Selection, Design, Construction, Monitoring, Closure and Complementary Works of a Final Disposal Site for Urban Solid Waste and of Special Management. OJF, Official Journal of the Federation: Federal District, Mexico, 2004.
  20. Zurita, L. Territorial Knowledge Management; RA-MA: Madrid, Spain, 2011; p. 204. [Google Scholar]
  21. Karimi, N.; Richter, A.; NG, K. Siting and ranking municipal landfill sites in regional scale using nighttime satellite imagery. J. Environ. Manag. 2020, 256, 109942. [Google Scholar] [CrossRef] [PubMed]
  22. Lacoboaea, C.; Petrescu, F. Landfill monitoring using remote sensing: A case study of Glina, Romania. Waste Manag. Res. 2013, 31, 1075–1080. [Google Scholar] [CrossRef]
  23. Mahmood, K.; Batool, A.; Faizi, F.; Chaudhry, M.; Ul-Haq, Z.; Rana, A.; Tariq, S. Bio-thermal effects of open dumps on surroundings detected by remote sensing—Influence of geographical conditions. Ecol. Indic. 2017, 82, 131–142. [Google Scholar] [CrossRef]
  24. Amal, L.; Son, L.; Chabchoub, H.; Lahini, H. Analysis of municipal solid waste collection using GIS and multi-criteria decision aid. Appl. Geomatics 2020, 12, 193–208. [Google Scholar] [CrossRef]
  25. Fennonato, N.; Preziosi, G.; Gorritty, M.; Guisbert, E.; Torretta, V. Assessment of municipal solid waste selective collection scenarios with geographic information systems in Bolivia. Waste Manag. 2020, 102, 919–931. [Google Scholar] [CrossRef]
  26. Kinobe, J.; Bosona, T.; Gebresenbet, G.; Niwagaba, C.; Vinnerås, B. Optimization of waste collection and disposal in Kampala city. Habitat Int. 2015, 49, 126–137. [Google Scholar] [CrossRef]
  27. Khorsandi, H.; Faramarzi, A.; Aghapour, A.; Jafari, S. Landfill site selection via integrating multi-criteria decision techniques with geographic information systems: A case study in Naqadeh, Iran. Environ. Monit. Assess. 2019, 191, 730. [Google Scholar] [CrossRef]
  28. Damasceno, I.; Ennes, R.; de Almeida, T.; Zandonadi, L.; Contreras, F. Allocation of sanitary landfill in consortium: Strategy for the Brazilian municipalities in the State of Amazonas. Environ. Monit. Assess. 2019, 191, 39. [Google Scholar] [CrossRef] [PubMed]
  29. Ağacsapan, B.; Cabuk, S. Determination of suitable waste transfer station areas for sustainable territories: Eskisehir case. Sustain. Cities Soc. 2020, 52, 101829. [Google Scholar] [CrossRef]
  30. Araiza, J.; Cram, S.; Ruiz, N.; Oropeza, O.; Fernández, M.; Rojas, M. GIS-based approach to zoning the risk associated with municipal solid waste management: Application to regional scale. Environ. Monit. Assess. 2021, 193, 69. [Google Scholar] [CrossRef]
  31. Mexican Standard NMX-AA-015-1985; Environmental Protection—Soil pollution—Municipal Solid Waste—Sampling—Quartering Method. General Directorate of Standards. Secretariat of Commerce and Industrial Development: Federal District, Mexico, 1985.
  32. Mexican Standard NMX-AA-019-1985; Environmental Protection—Soil pollution—Municipal Solid Waste—Volumetric Weight “In Situ”. General Directorate of Standards. Secretariat of Commerce and Industrial Development: Federal District, Mexico, 1985.
  33. Mexican Standard NMX-AA-022-1985; Environmental Protection—Soil Pollution—Municipal Solid Waste—Selection and Quantification of Subproducts. General Directorate of Standards. Secretariat of Commerce and Industrial Development: Federal District, Mexico, 1985.
  34. Araiza, J.; Chávez, J.; Moreno, J. Quantification of municipal solid waste generated in the municipal seat of Berriozabal, Chiapas. Int. J. Environ. Pollut. 2017, 33, 691–699. [Google Scholar] [CrossRef] [Green Version]
  35. Araiza, J.; Nájera, H.; Gutiérrez, R.; Rojas, M. Emplacement of solid waste management infrastructure for the Frailesca region, Chiapas, México, using GIS tools. Egypt. J. Remote. Sens. Space Sci. 2018, 21, 391–399. [Google Scholar] [CrossRef]
  36. Al-Ruzouq, R.; Shanableh, A.; Omar, M.; Al-Khayyat, G. Macro and micro geo-spatial environment consideration for landfill site selection in Sharjah, United Arab Emirates. Environ. Monit. Assess. 2018, 190, 147. [Google Scholar] [CrossRef]
  37. Abd-El Monsef, H.; Smith, S. Integrating remote sensing, geographic information system, and analytical hierarchy process for hazardous waste landfill site selection. Arab. J. Geosci. 2019, 12, 155. [Google Scholar] [CrossRef]
  38. CONABIO, National Commission for the Knowledge and Use of Biodiversity. Land Cover Monitoring. Available online: https://www.biodiversidad.gob.mx/monitoreo/cobertura-suelo (accessed on 23 January 2021).
  39. Hu, O.; Wu, W.; Xia, T.; Yu, Q.; Yang, P.; Li, Z.; Song, Q. Exploring the Use of Google Earth Imagery and Object-Based Methods in Land Use/Cover Mapping. Remote Sens. 2013, 5, 6026–6042. [Google Scholar] [CrossRef] [Green Version]
  40. Lisita, A.; Sano, E.; Durieux, L. Identifying potential areas of Cannabis sativa plantations using object-based image analysis of SPOT-5 satellite data. Int. J. Remote Sens. 2013, 34, 5409–5428. [Google Scholar] [CrossRef]
  41. Pontius, R.; Shusas, E.; McEachern, M. Detecting important categorical land changes while accounting for persistence, Agriculture. Agric. Ecosyst. Environ. 2004, 101, 251–268. [Google Scholar] [CrossRef]
  42. FAO, Food and Agriculture Organization. Forest Resources Assessment 1990, Survey of Tropical Forest Cover and Study of Change Processes; FAO: Rome, Italy, 1996; p. 130. [Google Scholar]
  43. CONAGUA, National Water Commission. Automatic Meteorological Stations. Available online: https://smn.conagua.gob.mx/es/observando-el-tiempo/estaciones-meteorologicas-automaticas-ema-s (accessed on 10 June 2019).
  44. INEGI, National Institute of Statistic and Geography. Mexican Elevations Continuum (CEM). Available online: https://www.inegi.org.mx/app/geo2/elevacionesmex/ (accessed on 12 June 2021).
  45. Castillo, M.; Gandini, M.; Laín, S. Simulation of transport and dispersion of atmospheric emissions from Navarro solid waste dump site, Cali (Colombia). Ingeniería y Universidad 2012, 16, 501–516. [Google Scholar] [CrossRef]
  46. Araiza, J.; Rojas, M. Spatial modelling of gaseous emissions from two municipal solid waste dump sites. Int. J. Environ. Stud. 2019, 76, 213–224. [Google Scholar] [CrossRef]
  47. ESRI, Environmental Systems Research Institute. An overview of the Groundwater Toolset. Available online: https://desktop.arcgis.com/en/arcmap/latest/tools/spatial-analyst-toolbox/an-overview-of-the-groundwater-tools.htm (accessed on 23 January 2021).
  48. Guleria, A.; Gupta, S.; Gupta, I.; Swami, D.; Shukla, D. Understanding the spatial and temporal dependence of the migration of conservative contaminant plume in urban groundwater environment in Panchkula region, Haryana, India. Groundw. Sustain. Dev. 2019, 8, 93–103. [Google Scholar] [CrossRef]
  49. CONAGUA, National Water Commission. Update of the Average Annual Availability of Water in the Reforma Aquifer (0702), State of Chiapas. General Technical Sub-Directorate-Groundwater Management. 2020. Available online: https://sigagis.conagua.gob.mx/gas1/Edos_Acuiferos_18/chiapas/DR_0702.pdf (accessed on 2 July 2023).
  50. SGM, Mexican Geological Service. GeoInfoMex—SGM Database. Available online: https://www.sgm.gob.mx/GeoInfoMexGobMx/# (accessed on 20 January 2022).
  51. CONAGUA National Water Commission. Networks of Piezometric Wells. Available online: https://sigagis.conagua.gob.mx/gas1/sections/RedesMonirtoreo_Piezometrico.html (accessed on 23 January 2021).
  52. Govind, N.; Ramesh, H. The impact of spatiotemporal patterns of land use land cover and land surface temperature on an urban cool island: A case study of Bengaluru. Environ. Monit. Assess. 2019, 191, 283. [Google Scholar] [CrossRef]
  53. Meng, X.; Cheng, J.; Zhao, S.; Liu, S.; Yao, Y. Estimating Land Surface Temperature from Landsat-8 Data using the NOAA JPSS Enterprise Algorithm. Remote Sens. 2019, 11, 155. [Google Scholar] [CrossRef] [Green Version]
  54. Mahmood, K.; Batool, S.; Chaudhry, M. Studying bio-thermal effects at and around MSW dumps using Satellite Remote Sensing and GIS. Waste Manag. 2016, 55, 118–128. [Google Scholar] [CrossRef] [PubMed]
  55. Das, N.; Mondal, P.; Sutradhar, S.; Ghosh, R. Assessment of variation of land use/land cover and its impact on land surface temperature of Asansol subdivisión, Egypt. Egypt. J. Remote Sens. Space Sci. 2021, 24, 131–149. [Google Scholar] [CrossRef]
  56. Morsy, M.; Aboelkhair, H. Assessment of agricultural expansion and its impact on land Surface temperature in El-Beheira Governorate, Egypt. Egypt. J. Remote Sens. Space Sci. 2021, 24, 721–733. [Google Scholar] [CrossRef]
  57. Ouyang, C.; Zhou, K.; Xu, Q.; Yin, J.; Peng, D.; Wang, D.; Li, W. Dynamic analysis and numerical modeling of the 2015 catastrophic landslide of the construction waste landfill at Guangming, Shenzhen, China. Landslides 2017, 14, 705–718. [Google Scholar] [CrossRef]
  58. Laner, D.; Fellner, J.; Brunner, P. Flooding of municipal solid waste landfills—An environmental hazard? Sci. Total Environ. 2009, 407, 3674–3680. [Google Scholar] [CrossRef] [PubMed]
  59. Han, Z.; Ma, H.; Shi, G.; He, L.; Wei, L.; Shi, Q. A review of groundwater contamination near municipal solid waste landfill sites in China. Sci. Total Environ. 2016, 569–570, 1255–1264. [Google Scholar] [CrossRef]
  60. Jaramillo, J. Guide for the Design, Construction and Operation of Manual Sanitary Landfills; Pan-American Center for Sanitary Engineering and Environmental Sciences: Lima, Peru, 2002; p. 287. [Google Scholar]
  61. Silva, M.; García, A.; Hernando, A. Urban growth in the Metropolitan Area of Tuxtla Gutiérrez (Chiapas, México). Quehacer Científico en Chiapas 2015, 10, 35–41. [Google Scholar]
  62. Ramos, R.; Palomeque, M.; Nuñez, J.; Sánchez, R. Spatial analysis and geomatics of land use changes in Huimanguillo, Tabasco (2000-2010-2030). Rev. Mex. Cienc. For. 2019, 10, 118–139. [Google Scholar] [CrossRef] [Green Version]
  63. INEGI, National Institute of Statistic and Geography. Censuses and Population and Housing Counts. Available online: https://inegi.org.mx/programas/ccpv (accessed on 10 June 2022).
  64. INEGI, National Institute of Statistic and Geography. National Statistical Directory of Economic Units—Massive Data Download. Available online: https://www.inegi.org.mx/app/descarga/ (accessed on 20 August 2022).
  65. Themelis, N.; Ulloa, P. Methane generation in landfills. Renew. Energy 2007, 32, 1243–1257. [Google Scholar] [CrossRef]
  66. Daskalopoulos, E.; Badr, O.; Probert, S. Economic and Environmental Evaluations of Waste Treatment and Disposal Technologies for Municipal Solid Waste. Appl. Energy 1997, 58, 209–255. [Google Scholar] [CrossRef]
  67. Köfalusi, G.; Encarnación, G. The products and impacts of the decomposition of urban solid waste in final disposal sites. Gaceta ecológica 2006, 79, 39–51. Available online: https://www.redalyc.org/articulo.oa?id=53907903 (accessed on 23 January 2022).
  68. Tagaris, E.; Sotiropoulou, R.; Pilinis, C.; Halvadakis, C. Atmospheric methane transport near landfill sites. Waste Manag. Res. 2003, 21, 62–73. [Google Scholar] [CrossRef] [PubMed]
  69. Christensen, T.; Kjelden, P.; Bjerg, P.; Jensen, D.; Christensen, J.; Baun, A.; Albrechtsen, H.; Heron, G. Biogeochemistry of landfill leachate plumes. Appl. Geochem. 2001, 16, 659–718. [Google Scholar] [CrossRef]
  70. González, R.; Rodríguez, R.; Coronado, V. Natural attenuation in the Yucatecan aquifer. Rev. Int. Contam. Ambient. 2007, 23, 5–15. Available online: https://www.redalyc.org/articulo.oa?id=37023101 (accessed on 23 January 2022).
  71. Pokorny, J.; Brom, J.; Cermák, J.; Hesslerová, P.; Huryna, H.; Nadezhdina, N.; Rejšková, A. Solar energy dissipation and temperature control by water and plants. Int. J. Water 2010, 5, 311–336. [Google Scholar] [CrossRef]
Figure 1. Study area: municipality of Reforma, state of Chiapas, Mexico.
Ijgi 12 00280 g001
Figure 2. Survey information in the field: (a) infrastructure and operation of the dumping site; (b) waste parameters and characteristics.
Ijgi 12 00280 g002
Figure 3. Workflow of LULC analysis.
Ijgi 12 00280 g003
Figure 4. Workflow of landfill gas dispersion analysis.
Ijgi 12 00280 g004
Figure 5. Workflow of leachate dispersion analysis.
Ijgi 12 00280 g005
Figure 6. Workflow of LST analysis.
Ijgi 12 00280 g006
Figure 7. Operation of the FDS of Reforma, Chiapas: (a) landfill infrastructure; (b) waste dump area without cover; (c) disposal cell with final coverage; (d) current landfill cell; (e) leachate lagoon; (f) useful volume for waste confinement.
Ijgi 12 00280 g007
Figure 8. MSW deposited in the FDS of Reforma, Chiapas.
Ijgi 12 00280 g008
Figure 9. Composition of MSW deposited in the FDS of Reforma, Chiapas.
Ijgi 12 00280 g009
Figure 10. Spatial analysis of distances and restrictions: (a) local scale; (b) regional scale.
Ijgi 12 00280 g010
Figure 11. LULC analysis in the area of influence of the FDS: (a) year 2005; (b) year 2013; (c) year 2015; (d) year 2021.
Ijgi 12 00280 g011
Figure 12. Dispersion of gaseous emissions in the FDS of the study area: (a) landfill gas; (b) H2S.
Ijgi 12 00280 g012
Figure 13. Modeling of liquid emissions in the FDS: (a) conservative pollutant dispersion; (b) behavior of concentration vs. distance.
Ijgi 12 00280 g013
Figure 14. LST modeling in the surroundings of the FDS for the period 2005–2021: (a,c,e,g) temperatures in summer season; (b,d,f,h) temperatures in winter season.
Ijgi 12 00280 g014
Table 1. Distances and restrictions of the FDS with respect to other infrastructures.
VariablesDistances/RestrictionSource
Airports13 kmOJF, [19]
Araiza et al. [35]
Al-Ruzouq et al. [36] Abd-El Monsef and Smith [37]
Protected natural areasStay out of them
Population settlements500 m
Surface water500 m
Water extraction wells500 m
Distance to roads500 m
Buyers nearby1000 m
Current land usesStay out of non-compatible land uses
Faults and fracturesStay out of them
Table 2. Increases and losses in land use for the period 2005–2021.
Coverage20052021IncrementsLossesPersistenceChange Rate (%)
Ha%Ha%
Water5.001.113.290.731.883.581.41−2.57
Urban/Anthropized43.479.61107.5223.7881.4517.4126.065.82
Tree coverage79.6817.6253.5711.8533.7759.8819.79−2.45
Shrub and herbaceous coverage324.0671.66287.8363.6566.29102.52221.54−0.74
Total452.21100.00452.21100.00183.40183.40268.81
Disclaimer/Publisher’s Note: The statements, opinions and data contained in all publications are solely those of the individual author(s) and contributor(s) and not of MDPI and/or the editor(s). MDPI and/or the editor(s) disclaim responsibility for any injury to people or property resulting from any ideas, methods, instructions or products referred to in the content.

