Review

Procedural Point Cloud Modelling in Scan-to-BIM and Scan-vs-BIM Applications: A Review

1
INESC TEC, 4200-465 Porto, Portugal
2
Faculty of Engineering, University of Porto, 4200-465 Porto, Portugal
3
Grupo Casais, 4700-565 Braga, Portugal
*
Author to whom correspondence should be addressed.
ISPRS Int. J. Geo-Inf. 2023, 12(7), 260; https://doi.org/10.3390/ijgi12070260
Submission received: 17 March 2023 / Revised: 25 June 2023 / Accepted: 29 June 2023 / Published: 30 June 2023
(This article belongs to the Topic Urban Sensing Technologies)

Abstract

:
Point cloud processing is an essential task in many applications in the AEC domain, such as automated progress assessment, quality control and 3D reconstruction. As much of the procedure used to process the point clouds is shared among these applications, we identify common processing steps and analyse relevant algorithms found in the literature published in the last 5 years. We start by describing current efforts on both progress and quality monitoring and their particular requirements. Then, in the context of those applications, we dive into the specific procedures related to processing point clouds acquired using laser scanners. An emphasis is given to the scan planning process, as it can greatly influence the data collection process and the quality of the data. The data collection phase is discussed, focusing on point cloud data acquired by laser scanning. Its operating mode is explained and the factors that influence its performance are detailed. Data preprocessing methodologies are presented, aiming to introduce techniques used in the literature to, among other aspects, increase the registration performance by identifying and removing redundant data. Geometry extraction techniques are described, concerning both interior and outdoor reconstruction, as well as currently used relationship representation structures. In the end, we identify certain gaps in the literature that may constitute interesting topics for future research. Based on this review, it is evident that a key limitation associated with both Scan-to-BIM and Scan-vs-BIM algorithms is handling missing data due to occlusion, which can be reduced by multi-platform sensor fusion and efficient scan planning. Another limitation is the lack of consideration for laser scanner performance characteristics when planning the scanning operation and the apparent disconnection between the planning and data collection stages. Furthermore, the lack of representative benchmark datasets is hindering proper comparison of Scan-to-BIM and Scan-vs-BIM techniques, as well as the integration of state-of-the-art deep-learning methods that can give a positive contribution in scene interpretation and modelling.

1. Introduction

Building information modelling (BIM) is being widely adopted by the Architecture, Engineering and Construction (AEC) industry to improve project execution performance in several ways such as by improving collaboration among stakeholders, by providing accurate visualization through a standardized format, through the generation of detailed and organized construction data, as well as by creating updated project progress information. Typically, an as-designed BIM is created in the design and pre-construction phases of a project to present a digital representation of the infrastructure. However, due to changes that can take place during the construction or building management phases, the as-designed BIM often diverges from the real construction model. Laser scanners can generate 3D point clouds that precisely capture the as-built surfaces of the buildings and can then be used to update the BIM models. In this domain, point cloud data are also used for a variety of purposes such as the construction progress monitoring and quality inspection of infrastructures.

1.1. Applications

1.1.1. Progress Monitoring

The progress monitoring executed on construction projects is an important operation to gain knowledge of any divergences between the as-designed and as-built states, allowing corrective measures to be taken in a timely manner. In fact, two main factors found to cause the excess of time and costs in construction projects are the inefficient and imprecise monitoring of progress [1]. The adoption of technologies developed in promising fields such as Computer Vision (CV) have contributed to the enhancement of automation in the progress monitoring process, solving the issues brought by the traditional manual methods [1]. The goal of increasing automation is to maximize accuracy and minimize human involvement in on-site monitoring. Furthermore, the analysis of as-built information obtained using state of the art technologies such as LIDAR, photogrammetry and BIM is able to generate accurate progress information that is not dependent on user experience.
These developments have focused mainly on exterior construction environments, with significantly fewer studies on interior construction. The challenges faced in each environment are distinct, as there are notable structural and contextual differences. The exterior construction environment mainly consists of exterior columns, beams and walls, while in the interior there are mainly electrical elements, plumbing, fire protection, finishes and plasterboard walls [2]. Such differences lead to distinct challenges in each environment, which make it necessary to develop specific approaches for each one.
The use of laser scanned models for progress monitoring purposes has attracted significant attention from the research community. Usually, an as-built model is created by merging multiple 3D point clouds obtained from a laser scanner and processing them. Similarly to what is shown in Figure 1, the acquired point cloud or as-built model is overlayed on the as-designed model of the structure built so far in order to be able to assess the current status of the construction project. Colour coding (green and red) is commonly used to visually identify the parts of the structure that are on schedule. Progress estimation can then be estimated by calculating the ratio between actual work performed and planned work. This measure can then be used to update the as-designed schedule. Maalek [3] presented a framework that labelled a point cloud by recognizing geometric primitives and establishing relationships between objects, comparing the extracted objects to the ones in the BIM according to the schedule. Zhang [4] introduced a progress measurement method that automates processes such as data acquisition, object identification, and periodic status comparison for monitoring progress in horizontal construction projects. Kim [5] studied how to improve progress estimation considering recent trends in construction projects. Meyer [6] presented a methodology that not only accounted for the uncertainty present in indoor as-built point clouds (using the Dempster–Shafer evidence theory), but also considered the uncertainty of the indoor model that served as a reference. They used voxelization to label the state of each voxel and performed change detection by comparing the states in distinct measurement epochs. Recently, some authors proposed using mobile laser scanner (MLS) technology and 4D BIM [7,8], which allow near real-time construction progress monitoring. Thorough literature reviews in this application area were performed by Alizadehsalehi [9] and Elqasaby [10].

1.1.2. Quality Assessment

Faults that happen during construction are expensive and preventable, both in the economic and human aspect. Active project quality control demands accurate and frequent assessment of the status of the construction, determination of crucial spatio-temporal and material-quality-related discrepancies and a pondered evaluation of whether these deviations constitute faults. In the construction industry, it is still usual to rely on human visual inspections, which are costly both in terms of time and human resources and are subject to error. Over recent years, the development of techniques that enable active quality control on construction sites has been driven by innovative sensing technologies and new project modelling tools. As seen for progress monitoring, processing point cloud data produced by remote sensing (e.g., laser scanning) allows the systematic evaluation of construction sites.
Determining the quality of a completed structure requires the analysis of the positioning errors of the structure relative to the construction tolerances [11]. In literature, this is known as scan-vs-BIM and is considered a challenging task due to (1) the site complexity and difficulty in gathering representative data, (2) the existence of registration errors due to sensors characteristics and (3) the existence of noise, drift and georeferencing errors associated with the actual data [11]. To tackle these challenges, some authors perform geospatial analysis after aligning as-built with as-designed data, and then calculate the distances between them [12,13]. Bassier et al. [11] applied an ICP-based algorithm and calculated the error vectors with considering drift and noise in the data, as well as clutter and georeferencing errors. The resulting error vectors are used to visualise each object’s position errors by superimposing a coloured point cloud (according to the error range) over the BIM model.

1.2. Integrating BIM and Point Clouds

BIM involves generating and handling digital representations of physical and operational features of a building or infrastructure. It comprehends the use of 3D models, general information and workflows to assist on the design, construction, and post-construction phases of a project. BIM adoption alone enables greater project efficiency, but this gain may be enhanced if integrated with other emerging technologies such as virtual reality for improved design understanding, laser scanning for acquiring as-built information or autonomous systems for automated monitoring. However, BIM integration remains challenging due to data transfer and interoperability issues. Hence, this section aims to address the main practical problems and solutions to effectively be able to integrate BIM with other technologies, in particular point clouds.

1.2.1. BIM File Formats

BIM interoperability depends on the use of a standardized file format that can be easily transferred between distinct applications. The most commonly adopted format at the moment is the Industry Foundation Classes (IFC) [14]. IFC is a standard format for data exchange that enables project data sharing across different types of BIM-related software. It is an open standard developed by an industry alliance named buildingSMART International. It defines a common language for sharing project data, in particular defining a schema and a data structure for representing building models in a software-neutral and vendor-neutral format. The IFC data format contains geometric data and other information such as the relationship between the model’s elements. Its adoption across different software applications in the BIM ecosystem then guarantees compatibility between the tools used in BIM-related processes.

1.2.2. Integration and Interoperability

By combining one another’s characteristics, point clouds and BIM can effectively function together in the same environment. While BIM models give a thorough digital representation of the construction project, point clouds offer accurate and detailed as-built information on existing structures. Still, the successful integration and interoperability of the two technologies is dependent on a set of prerequisites that are described next.

Loading BIM Models and Point Clouds on a Common Environment

The digital environment should have the capability to import and process both the BIM models and the point cloud data. While the BIM models are typically exchanged in the IFC format, point clouds are distributed in a variety of formats, with the biggest distinction being if these are text or binary-based. Text-based formats define each point in a different line, with its coordinates and attributes being separated by a given delimiter (e.g., comma), and each digit being represented as a character mapped according to a coded character set (e.g., ASCII, Unicode). Binary systems store the same information directly in binary code, requiring a predetermined file format specification. The main benefit of text files is the accessibility and readability provided by the standardized text abstraction used to represent the data, as they can easily be natively read. Nevertheless, when compared to binary files, the former are larger and take more time to read. Common point cloud ASCII file types are XYZ and ASC. As for the binary formats, these typically include PCD (point cloud library) and LAS. Several other regularly used file types, such as PLY and E57, are capable of both ASCII and binary formats.

Alignment

Point cloud and BIM alignment, also known as registration, is an essential step in Scan-vs-BIM applications. The BIM software should have a mechanism to perform automated point cloud registration, which involves matching common features (e.g., points, edges, planes, segmented objects, etc.) present in both the point cloud and BIM model. The goal is to align both structures in a common coordinate system.

Comparison

Change detection procedures typically used for progress monitoring or quality assessment involve comparing the as-built point cloud with the as-designed BIM model. After proper registration, the BIM software should overlay the point cloud onto the BIM model to allow the identification of these differences. This enables efficient project management during the life-cycle of the building. Furthermore, it should support different levels of detail for manipulating the point clouds due to the limited processing capacity available, which will have an impact on the level of accuracy of the comparison with the BIM model.

Conversion

Scan-to-BIM applications perform 2.5 or 3D reconstruction by processing the point cloud, extracting its main features and modelling the BIM elements. Hence, the BIM software should include procedures to manipulate the as-built point cloud, interpret it and extract geometric primitives from it. The converted BIM model, composed by all the detected elements, can then be used for design, analysis, and management purposes.

Visualization and Analysis

In addition to the BIM model and point cloud, the result of the conversion or comparison should be visually represented for analysis. Nevertheless, automated mechanisms (like the ones described in the next section) should be implemented to process and extract relevant information from the data.

Compatibility

Compatibility between BIM and point clouds is specially enhanced if both utilize open standards for data exchange. BIM software and point cloud processing tools should adhere to industry-standard formats like IFC and E57 to guarantee a interoperable coherent solution.
By fulfilling these prerequisites, BIM and point clouds can be effectively integrated, enabling accurate as-built representation, change detection, visualization, and analysis within the BIM environment. This interoperability facilitates efficient collaboration among stakeholders and improves decision-making throughout the building life-cycle.

1.3. Methodology

Several Scan-vs-BIM and Scan-to-BIM techniques have been proposed in recent years, as this has been active research topic in both AEC and CV domains. A search for related keywords in the Web of Science platform allows the retrieval of relevant information regarding the related scientific work carried out. Figure 2 summarizes the publication statistics, regarding the time frame from 2018 to 2023. These keywords included per-mutations of “scan-vs-BIM”, “scan-to-BIM”, “indoor reconstruction”, “outdoor reconstruction”, “construction progress monitoring”, “construction quality assessment”, “point cloud” and “laser scanner” without including “heritage” or “HBIM”. An upwards trend can be observed if the years affected by the pandemic are disregarded, demonstrating the growing importance attributed to Scan-to-BIM and Scan-vs-BIM methodologies in the AEC domain.
In this review, selected studies include articles from 29 journals and conferences, including 70 journal papers, 5 conference papers, and 1 lecture note. In the journal category, Remote Sensing has contributed the most to this field of study, with 14 articles, followed by Automation in Construction with 12 articles, ISPRS Journal of Photogrammetry and Remote Sensing with 9 articles, and ISPRS International Journal of Geo-Information with 5 articles. The complete list of journals is available in Table 1.

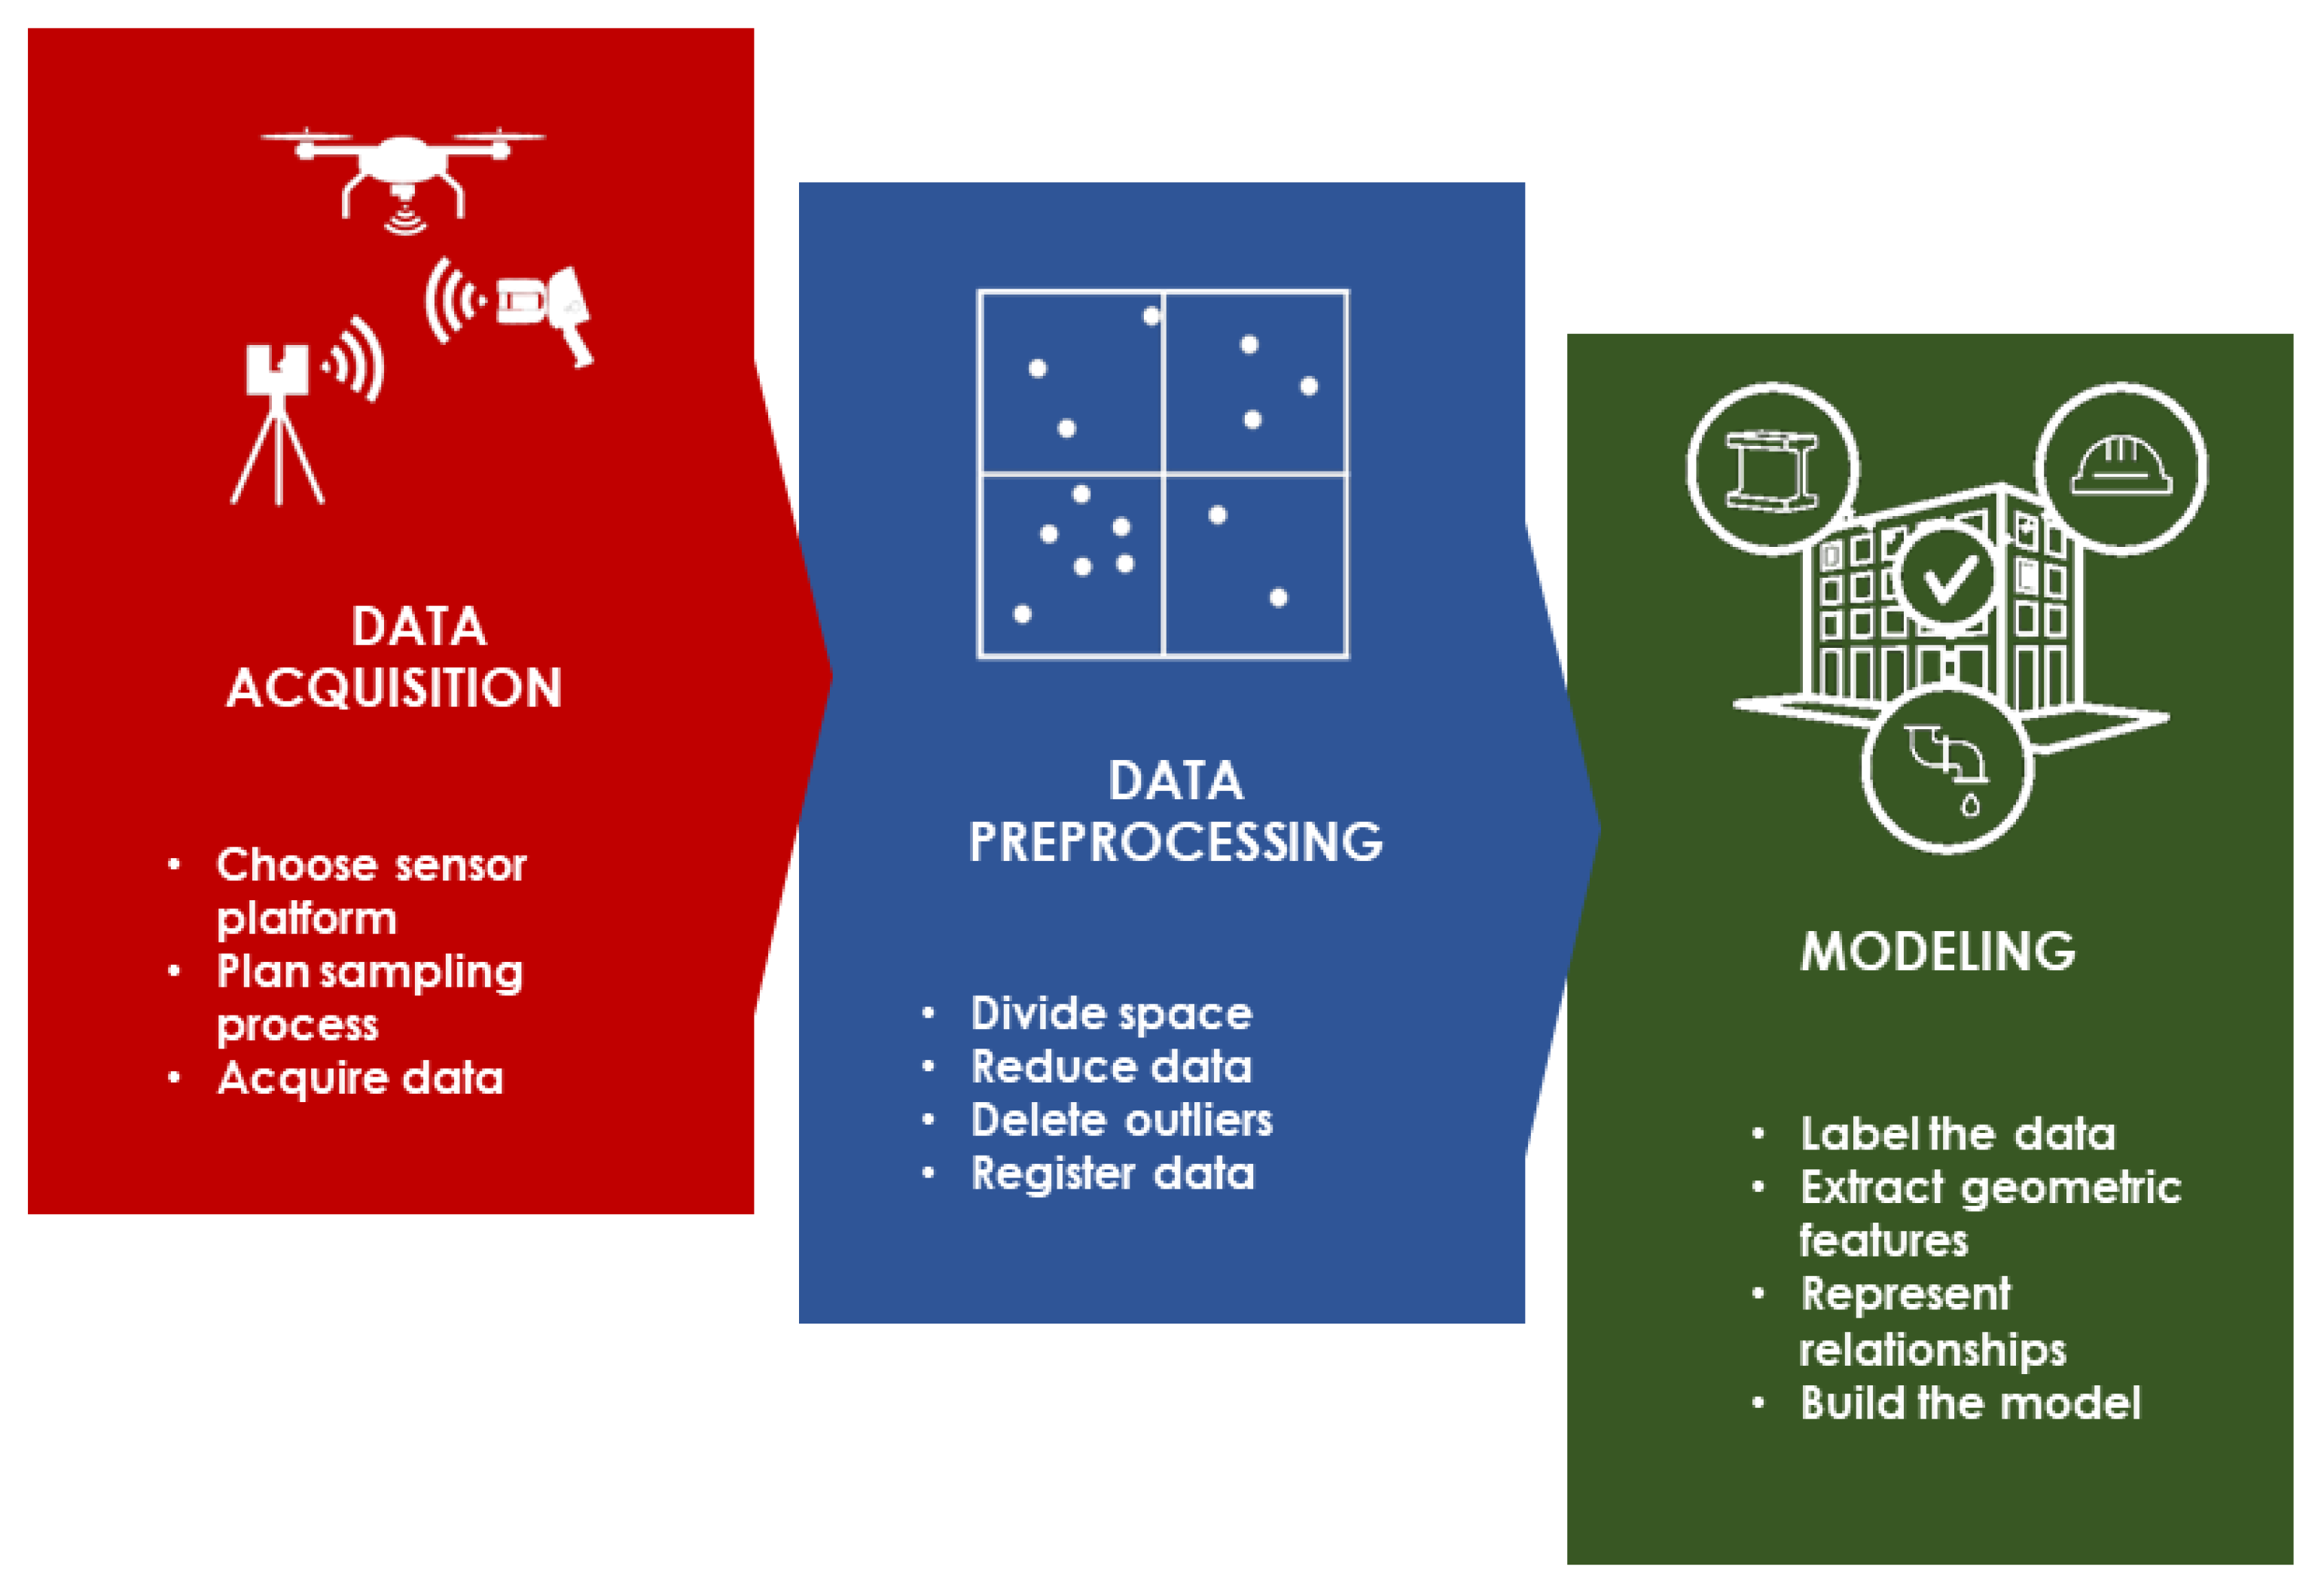
2. Procedural Review
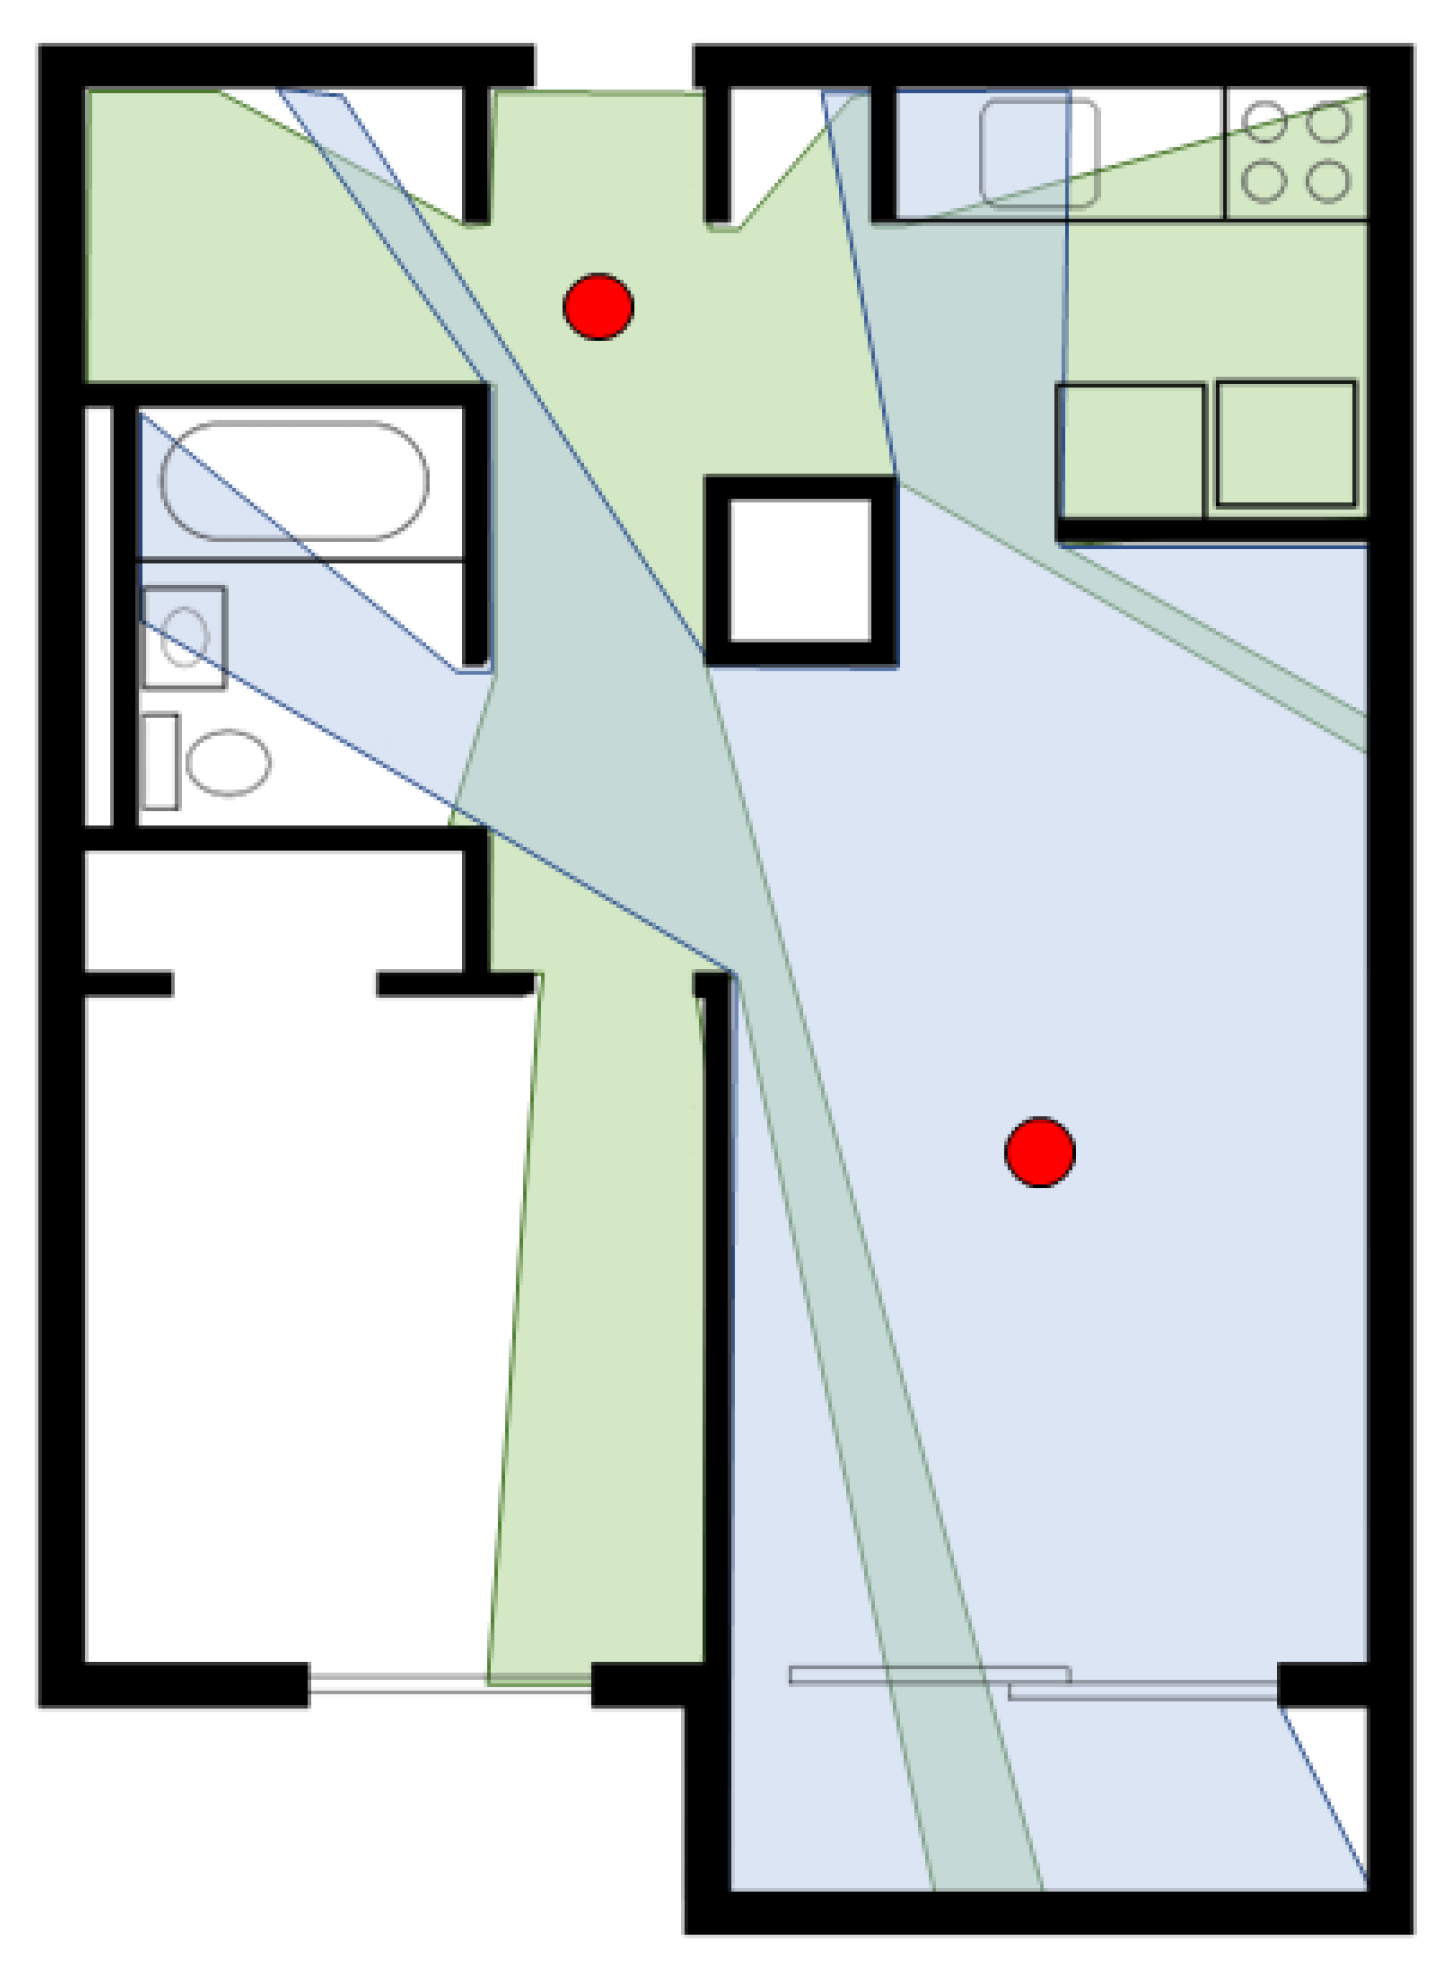
Generically speaking, creating an as-built BIM using laser scanners is typically executed with the following methodology illustrated in Figure 3: (1) data acquisition, which involves performing laser scans in specific locations to produce dense point clouds of the target building; (2) data preprocessing, where the previously acquired point clouds are filtered to remove irrelevant features and combined into a single point cloud in a common coordinate system; and (3) modelling the BIM by processing the point cloud to extract geometric features, transforming the point cloud into a semantically rich BIM. Although in Scan-vs-BIM applications the actual as-built BIM does not need to be created, they still share most of of this methodology. Given the complexity and importance of each of the mentioned phases, these will be described in more detail in the next sub-sections.

2.1. Scan Planning

A single laser scan will not be able to capture all the geometric features of a building because:
  • There are occlusions on a construction yard due to ongoing activities, machinery, workers, and construction materials;
  • Some buildings may have complex surfaces displaying curves and irregular shapes;
  • Completed components may hide other building components (e.g., ceiling pipes);
  • Certain building components may not be scheduled to be built at the time that the scan was performed;
  • Laser scanners have limitations such as range and accuracy and may not be capable of capturing all details, resulting in missing or erroneous data.
Issues like these are tackled by scan planning algorithms, which is an active research field in CV. According to the literature, this is known as the next-best-view (NBV) problem and it is focused on finding the minimum number of viewpoints (the position and orientation of the sensor) where the sensor can be placed with the objective of maximizing the sampling of all the surfaces of an object [15]. In the CV domain, several NBV planning methodologies have been presented to address this problem. These usually involve two main steps:
  • Representing and determining the visibility of a target structure’s surface from distinct viewpoints, similarly to what is demonstrated in Figure 4;
  • Selecting viewpoints which optimize sensor coverage with a minimum number of views.
In the AEC industry, these methodologies have been adopted, although to a limited extent. Traditionally, most users follow a manual approach where TLS locations are selected based on their personal experience and knowledge of the area. In practice, the existence of redundant scans reduces efficiency and wastes resources. Moreover, even if a large number of locations is selected, it is not certain that the a complete coverage of the target structure will be achieved. For this reason, the inclusion of these techniques is relevant in the field as some authors argue. Frias [16] proposed a 2D scan planning approach that used the BIM as an input. It starts by extracting the floor plans from the BIM model according to the planned construction status, defines the indoor navigable space accounting for a safety distance to building elements and then estimates the optimal number and position of the scans through a visibility analysis. Both the scan positions and the route that establishes the order of scan execution are optimized. Later, Frias [17] considered the joint use of TLS and MLS mapping systems, addressing specific MLS constraints such as maximum acquisition time and the closed-loop requirement. It starts by identifying key scan positions and then by generating a navigable graph to enable route computation considering the MLS constraints. Revuelta et al. [18] designed a technique for outdoor surveying based on genetic algorithms that also considers the limitations of the sensor and calculates the best viewpoints based on an input floor plan. Likewise, Dehbi [19] proposed an approach for determining viewpoints for the acquisition of 3D indoor models based on a building floor plan without requiring a BIM model. Qiu [20] optimized scan locations using a genetic algorithm considering user-defined data quality requirements, without having a model or floorplan. They initially perform a low resolution scan of the building to obtain a preliminary overview, and then use their algorithm to obtain optimized scan locations that satisfy the requirements and minimize scanning time. For more information, Aryan [15] presents a review on the subject.

2.2. Data Collection

Data collection must ensure that the target structure surfaces are sampled with the specified data quality, and within the allocated schedule. Data quality and efficiency are important to reduce problems later on, during the processing stage.

2.2.1. Point Cloud Data

A point cloud is a set of points where each one has its own set of x, y and z coordinates defining its position, and in some cases, additional attributes (intensity, RGB colour or timestamp), representing the features of the sampled 3D environment. Joining different point clouds and defining a common coordinate frame enables the geometry of the sampled environment to be captured. Figure 5 shows a publicly available point cloud with 3D and RGB information. LiDAR and photogrammetry are the two most common remote sensing techniques to generate point clouds. Although this study focus on processing point clouds obtained using laser scanners, some of the processing methodologies can also be applied to the latter.
Point cloud quality can be assessed by analysing its accuracy, precision, point density and resolution. While accuracy alludes to the proximity of the measured value to the true value, precision refers to the repeatability of the sensor readings on the same position. Point density is defined as the number of points per square meter, while resolution refers to the level of detail of the points in the cloud. Not all applications have the same quality requirements. Still, the quality of the point cloud can be affected by other elements such as the environmental conditions, type of sensors used, the geometry of the scan, etc.
Gathering massive amounts of point cloud data creates other issues due to the limited data storage and processing capabilities of existing systems. Processing quickly generates a large amount of intermediate data, and this is one of the issues tackled later on.

2.2.2. Sensors

Laser Scanners 

Laser scanners have been acknowledged by many as the best sensor to acquire 3D features with accuracy, speed and resolution. It produces accurate 3D representations of objects by using light detection and ranging (LIDAR). Light is emitted by a diode at a specific frequency. Then, a mirror rotates around the light source, pointing the laser beam horizontally and vertically. This rotating laser beam will reflect on the visible surfaces within range in the environment.
Typically, two types of laser scanners are used:
  • Phase-based scanners: they measure the change of phase of the emitted light to calculate distance;
  • Time-of-flight (TOF) scanners: they measure the time the light takes to travel from the scanner to the reflective surface and back, and since the speed of light is known, the distance can be easily determined.
Phase-based scanners are typically used in industry or interior modelling to produce detailed BIMs of existing buildings. The advantage of this technology is the scanning speed, since they can be up to 10 times faster than most TOF scanning systems. On the other hand, its major limitation is the shorter range. The main advantage of TOF scanners is their longer range, but they are slower and have less resolution compared to phase-based scanners. These scanners are usually used for topographic surveys.
In the AEC domain, laser scanners are one of the most used tools to capture 3D features of constructions. Significant work as been developed in the area of automatic 3D as-built reconstruction using 3D point clouds acquired by TLS (known as scan-to-BIM). Wu [22] presented a comprehensive survey categorizing the main applications of TLS in the AEC domain, including 3D model reconstruction, object recognition, deformation measurement, quality assessment and progress tracking.

Laser Scanner versus Photogrammetry 

Cameras are cheap, easy to use, and offer fast data acquisition. On the other hand, one of its main issues is the reduced accuracy of photogrammetry when compared to laser scanners. Due to the cost, cameras are widely adopted in the AEC domain for 3D reconstruction, documentation and project management. The main advantage of using cameras, as opposed to laser scanners, is that they can be used in a more flexible manner (small, cheap and easy to replace).
Photogrammetric methods, used to extract 3D geometric information from photographs, are sensitive to surfaces with low features or windows. This method requires each element to be visible from at least two different points of view (e.g., using a stereo camera). This often leads to missing or misaligned data in the final point cloud, blocking the detection of building elements. Ingman [23] compared the performance of low cost sensors, namely a RGB-D camera, a TLS and one panoramic camera, evaluating them against a higher end TLS. They found that while all systems produced relatively accurate results, the TLS displayed better performance in terms of geometric reconstruction and capturing finer details, with the panoramic camera being the worst and the RGB-D camera being somewhere in between in terms of cost and quality. Table 2 presents a brief comparison between both methodologies.

2.2.3. Laser Scanning Platforms

In the literature, studies usually involve one of three main laser scanner systems: (1) terrestrial laser scanning, (2) mobile laser scanning (MLS) or (3) airborne laser scanning (ALS). Laser scanners differ in terms of their resolution and spatial coverage. Table 3 presents a brief comparison based on their characteristics and target applications. Rashdi [24] presented a complete review comparing LIDAR systems based on distinct platforms.

Limitations 

As mentioned, laser scanners are commonly used sensors for generating point clouds. Nevertheless, they have certain limitations that influence their operation and suitability to the target scenario where they are supposed to acquire data:
  • They require line-of-sight to the target surface to be sampled, meaning they cannot collect information about occluded surfaces;
  • Limited maximum range, beyond which point density is reduced and the measurements are subject to greater error;
  • The vertical laser beam angle aperture is limited, so the area outside will not be sampled;
  • Data acquisition can be relatively slow considering a rotating laser scanner; higher velocity typically involves inferior angle resolution;
  • May be affected by noise due to light scattering on reflective surfaces, which cause reflections and distortions leading to decreased accuracy and the appearance of artefacts;
  • 3D laser scanners are quite expensive to acquire when compared to other imaging sensors.
Furthermore, since laser scanners need direct line-of-sight to the target surface to be sampled, it cannot sample buried or underground structures. For this reason, they are limited to sampling visible surfaces where the laser light can reflect on. However, other sensors can be used to sample buried or underground structures. Ground-penetrating radar (GPR) is a commonly used technology for this purpose. It sends electromagnetic waves through the ground and detects variations in subsurface materials and structures. The depth of penetration depends on the frequency of the GPR system and those materials. By analysing the reflected signals, GPR is able to report data about buried structures or geological features. Regarding the measurements, GPR typically displays less accuracy and resolution compared to laser scanners. As for underwater, sonar systems are widely adopted.
Considering their operating procedures and target environments, the laser scanner and the GPR are complementary sensors. While laser scanning provides detailed information about surfaces above ground, GPR can detect underground structures. By combining both techniques, a more comprehensive understanding of a partially buried structure can be achieved [25].

2.2.4. Dealing with Measurement Errors

Currently, TLS systems have an effective range from a few tens to a few hundred meters. Range errors are typically between sub-millimetre to several millimetres, while range noise is in the order of a few hundred micrometres and angle uncertainty is on the order of tens of arc-seconds. It is important to understand that these errors exist in order to account for them during the scan planning and point-cloud-processing steps. Furthermore, periodic performance evaluation is essential to guarantee the reliability of the acquired data and the suitability of data to high precision applications. Muralikrishnan [26] performed a complete review on laser scanner measurement error sources and also evaluated its performance, focusing on specifying these error sources. He identified instrument errors, laser–surface interaction errors, errors due to environmental conditions and errors due to an inefficient scanning strategy. Figure 6 presents a summary of the factors influencing a scanner measurement.
Recently, more attention has been dedicated in the literature to this topic in order to improve the performance on target applications. Aryan [15] evaluated data quality using diverse criteria such as completeness, accuracy, resolution, and registrability. Furthermore, they established a relationship between data quality and scanning error and the need for improved scan planning. Huang [27] proposed a methodology to calculate an effective scan range using mathematical reasoning, being able to reach a balance between scanning range and data size by estimating the appropriate angular resolution. Meyer [6] presented a methodology for change detection considering both the BIM uncertainty and the uncertainties of point clouds. The authors explicitly accounted for uncertainties using the Dempster–Shafer evidence theory.

2.3. Data Pre-Processing

Pre-processing a point cloud involves filtering and registration of its raw data points. As mentioned earlier, raw data points acquired by laser scanners contain noise, affecting the posterior processing of the points according to the target application. Furthermore, point clouds can become massive, and this can have a great impact on the capability of a machine to process it and extract relevant information. Also, by considering multiple scan locations, collected point clouds need to be aligned using an alignment method known as point cloud registration, which also allows the definition of a common coordinate reference system.
In this section, two important pre-processing steps are described, namely data reduction techniques to manage the size of the point cloud and then registration methodologies to join two different point clouds.

2.3.1. Data Reduction

Given that point clouds can contain millions of points, its size can range from a few hundred megabytes to a few gigabytes depending on its resolution. Hence, combining point clouds together during registration can result in a file size that is difficult to store and manipulate by modern systems. Then, there is a decision to be made: either combine the point clouds and use a more complete set or still combine them but extract the relevant geometric information from it. By removing redundant information, there is an obvious advantage in terms of processing time. Therefore, a method is required to evaluate and extract the geometric information contained in a point cloud data set.
Data reduction procedures can be grouped into two main categories, mesh-based simplification and point-based simplification. Polygon meshes are intermediate representations built from the point clouds, and although they are the industry standard for visualization, they are not the focus in this study. On the other hand, point-based simplification is achieved through point cloud density reduction, since point density determines the sampling level, and therefore the level of detail that a point cloud is able to hold from a target surface. Two main methods are commonly used for point cloud density reduction:
  • Voxelization: divides the point cloud into small cubes (known as voxels), each containing a subset of the points. Density reduction is achieved by keeping only one point per voxel. This point can be chosen according to different principles, such as the centroid of the voxel or the proximity to the centre of the voxel.
  • Minimum distance between points: removes points that are below a given minimum distance to each other. This value can be chosen based on the desired point density and level of detail. It can also be used with voxelization to further reduce density.
Voxelization is usually the faster method, as it involves a simple spatial partitioning operation. Nevertheless, it can lead to a loss of detail and accuracy, especially if the voxel size is too large [28]. On the other hand, the minimum distance method is able to better preserve the original shape of the surface (critical for heritage buildings), but it can be slower and more computationally intensive. Figure 7 illustrates this concept. The issue here is choosing the correct voxel size so distinctive structural features are retained on the simplified dataset.
Nevertheless, due to the importance of point cloud reduction, researchers have proposed other point-based simplification algorithms. Wu [29] presented a simplification approach, which starts by dividing the point cloud into subsets and extracting features from each subset. Next, first- and second-order graph filters are used to sample the point cloud in each subset. Although this method is able to reduce memory usage compared to more traditional approaches, computational complexity is too high. Table 4 categorizes data reduction methods used in recent literature.

2.3.2. Point Cloud Registration

While collecting point cloud data for a specific application, multiple scans are usually performed. Each scan will generate its own point cloud, and the points of each point cloud will be represented in the scanner’s local coordinate frame. Furthermore, the registration procedure is not only used to align point clouds obtained from adjacent scans, but also to adjust as-built point clouds to model-derived point clouds for model change detection purposes (essential for Scan-vs-BIM applications, as discussed in Section 1.1). The registration process deals with combining multiple point cloud datasets together with the objective of aligning themselves with each other and sharing a common global coordinate system.
Registration methodologies can be classified as being coarse or fine [41]. Coarse registration methods can use correspondences based on point, line and surface features to align the point clouds. Identification of suitable registration features is then critical for performing an accurate registration, since it is feature-based and does not directly register the point clouds. For example, corresponding points illustrating specific features on each point cloud can be manually chosen, and the coarse registration method will align the point clouds by minimizing the distances between the chosen points [8].
On the other hand, fine registration methods consider the entire point clouds [41]. The Iterative Closest Point algorithm (ICP) [42] and its variants [43] are the most used approaches in literature for performing fine registration. Here, the alignment of the point clouds is adjusted iteratively until the distances between points in one point cloud and their closest points in the other point cloud are minimized. No points need to be pre-selected for the performing the registration procedure using ICP, as it is automatic.
When registering point clouds, researchers and data analysts frequently employ coarse-to-fine registration strategies [8,12,44]. Cheng [41] presented a complete review on point cloud registration algorithms, including most used methods for both coarse and fine registration. Table 5 categorizes registration methods used in recent literature.

2.4. Geometry Extraction and Modeling

Creating high-quality, 3D building models from point clouds has been an active research topic on the computer graphics, remote sensing, and AEC communities in multiple aspects. BIM adoption is rising and it is being used for enhancing procedures for construction planning and facility management. Contrary to the simple geometric representation of a building, a BIM model defines semantically annotated, volumetric building elements such as walls and floors, and explicitly defines how these elements are interconnected.
As designing accurate models may be a time-consuming task, current research has focused on developing automated methodologies for creating BIM models from acquired point clouds. Existing methodologies can be classified into three categories:
  • Planar primitive detection: the structure is modelled by arranging planar polygons identified on the point cloud;
  • Volumetric primitive fitting: the structure is modelled using simple volumetric primitives, imposing some sort of architectural regularization;
  • Mesh-based reconstruction: a mesh is modelled from the point cloud providing limited semantic classification of the scene components.
To choose what type of methodology to apply will depend on the type of structure being sampled, in its features and specific architectural details. Table 6 categorizes feature extraction methods used in recent literature. Bassier [49] studied the impact of geometry representations on the classification of building components. They demonstrated through experiments improved feature discriminativeness and distinctness for the mesh-based features due to the reduced amounts of noise and holes compared to point clouds. Furthermore, the significant data reduction which is achieved during the meshing allows for more complex features to be computed from the segments while maintaining performance.
Next, an overview of the state of the art on outdoor and indoor modelling will be performed. Table 7 categorizes the target environments addressed in recent literature.

2.4.1. 3D Reconstruction of Outdoor Environments

Façade Modeling 

High resolution building geometry such as windows, doors and protrusions are extracted from point cloud data for performing façade reconstruction. This reconstruction is typically executed through bottom-up or top-down modelling procedures. Bottom-up methods use points and edges to identify features in the data. Typically, authors try to identify façade elements such as windows and doors in point cloud data. Zolanvari [51] used a slicing method to extract features from façades and roof. It starts by using the RANSAC algorithm to detect planes, then slices them horizontally or vertically, identifies holes as the gaps in those slices and extracts its boundaries. Fan [56] presented a façade layout graph model method, which segments façade components using RANSAC and extracts the outlines of windows and doors by detecting its edges and the direction of inliers.
One of the disadvantages of bottom-up modelling is its dependence on data quality. These approaches are relatively sensitive to erroneous or incomplete data because geometric primitives are extracted and modelled directly from point cloud data. So, an effort was made to make them more robust to such issues. Top-down reconstruction algorithms deal with uncertain or missing data by integrating knowledge about the appearance and arrangement of the structure and then using it to synthesize the areas where information is missing. Zeng [59] applied a deep neural network (DNN) and a set of rules to determine the 2D shape of the house (considering a set of predefined shapes), estimate its size, classify the roof type and estimated height and determine the area occupied by secondary structures (i.e., garage) so arbitrary polygons are fitted to it, optimizing the reconstruction process. Klimkowska [72] presented a complete review on façade reconstruction with an emphasis on building opening detection. The authors indicate the lack of benchmark datasets for different architectural styles as the main reason for the lack of development in this area.

Roof Modeling 

Polyhedral modelling is one of the most used bottom-up rooftop modelling techniques in literature [68]. These techniques uses primitive extraction and then group these primitives according to the determined roof topology. Namouchi [61] introduced a method for reconstructing piecewise horizontal roofs, separated by vertical discontinuities, by performing roof clustering using the Cut-pursuit algorithm on a point adjacency graph and then extracting the boundaries of those clusters using Delaunay Triangulation. Awrangjeb [73] proposed a technique that analyses the intersection lines between segmented roof primitives, detecting and inserting any missing planes. Albano [68] compared a cluster-based roof segmentation approach that uses fuzzy c-means clustering with a region growing segmentation approach combined with random sample consensus (RANSAC) method, with the latter displaying slightly better performance despite the greater processing time. Dey [53] proposed an outlier detection algorithm to optimize the roof plane extraction process. Hu [71] segmented the roof point clouds into individual planes by minimizing an energy function and determined the roof topology by analysing the planar primitive’s adjacency.
In recent research, many authors have performed building extraction and roof shape classification using deep learning techniques [48,69]. Although these techniques were able to detect buildings with success, in most cases here there was low planimetric accuracy and individual roof plane extraction was not considered [53].
Typically, roof modelling is performed using data acquired by ALS due to the quality and availability of the point cloud data. For this reason, and for the sake of completeness, it was decided to include the above research. TLS and MLS systems, considered in this study, are mostly used to scan the building’s façades as they are not able to capture the top of the building (considering their perspective from the street). Chen et al. [55] proposed a roof point extraction methodology, considering data that have been obtained with a TLS. They applied a region growing algorithm to a subset of points previously removed by a density filtering algorithm (during façade point extraction, as density of points in it should be higher than in other locations due to the viewing angles being less steep). To some extent, the lack of information about the top of the buildings is solved by using an ALS to scan the rooftops, acquiring data that can possibly be used to reconstruct the building structure without the façade features. Nevertheless, when insufficient information on the roof is available, assumptions are also typically made regarding its shape.

Building Volume Reconstruction 

Volume reconstruction can be interpreted as a process of polygon fitting. It is difficult to scan every part of a building, therefore certain assumptions need to be made to compose a solid polyhedron model. When reconstructing outdoor structures, two common assumptions made by designers are geometric regularity and occlusion-free data. In particular, the very restrictive Manhattan-world (MW) assumption [74] (also used for interior modelling) has been adopted to represent buildings as box-like structures. The main feature of MW-based buildings is the existence of three mutually orthogonal directions.
Less regular geometries can also be used for more generic volume reconstruction (at the expense of a higher number of planar primitives) by using binary space partitioning (BSP) or tetrahedral space partitionings. Space partitioning is used to extract the outer surface from the mesh containing the point set. Recently, Xia [70] studied primitive extraction methods and stated that they can achieve globally optimal results, even with low quality data. Wang [54] introduced a technique based on closed constraints to obtain a watertight building surface model. Its pipeline starts by generating candidate planes from an input point cloud, followed by the selection of candidate planes constituting a closed sequence, and finally by optimizing the complete surface model based on the energy function minimization. Zeng [59] used deep neural networks to apply shape grammar rules to reconstruct the 3D building’s geometric model. Song [75] executed curved building reconstruction by converting the building point cloud into contours, recognizing the basic geometric primitives that compose the model from those contours and then refining those models by deforming the individual primitives.
In other approaches, researchers build their work on the retrieval of coarse building geometries that seem tailored for retrieving urban morphologies rather than for façade retrofitting. For a complete review about this topic, check Wang [76].

2.4.2. 3D Reconstruction of Indoor Environments

Applying outdoor reconstruction methods to indoor scenes is not practical as indoor scenes impose different challenges than outdoor scenes. The outside of a building can often be described by a single or a few cuboids, and the amount of clutter hiding part of the geometry is rather low. In contrast, interior space often has a more complex geometry and a higher quantity of clutter. Two common simplifications indoor reconstruction techniques make to reduce the complexity of the problem are assuming that walls are vertical [52] and the Manhattan-World assumption [60]. Many existing techniques generate boundary representation (B-rep) models from point clouds by performing planar segmentation [65]. These techniques extract the geometry of building elements contained in individual spaces (e.g., rooms or corridors) such as walls, ceilings, floors and doors, ignoring adjacency relations among those spaces and multiple-space reconstruction.
Based on specific assumptions, semantic information can be added to the 3D models by interpreting the extracted geometry.
Wang [50] used a learning framework of the associative Markov networks (AMNs) to assign each 3D point a label from a class set (floor, walls, ceiling, other objects). They then use this labeling to perform indoor modeling. Previtali [32,33] proposed a methodology to detect openings on MW indoor scenes based on a voxel-based visibility analysis to distinguish occluded from empty regions in wall surfaces. Ray-tracing labelling was applied to generate an occupancy map. After voxelizing the scene, the occupancy of each voxel was assessed and then a ray-tracing algorithm was executed to evaluate if each empty voxel was empty or occluded. Chen [35] used deep learning to detect and classify building elements. They used a graph to represent the point cloud, where nodes are points and edges are connections between points located within a given maximum distance. The objects are segmented using a Multi-Layer Perceptron classifier, discarding edges that connect different objects. Then, the building components are classified using a deep neural network on each set of segmented points.
Several recent methods approach the full 3D reconstruction problem, lifting the restrictive Manhattan-World and 2.5D assumptions. Wang [50] presented a semantic line framework-based modelling building method using a MLS. It extracts line structures from a labelled point cloud to obtain a initial description of the building line framework, then optimizes it using a deep learning model. It detects slanted floor, ceilings and walls, as well as doors and windows. Shi [34] presented an approach that starts by extracting planar surfaces using RANSAC, using these primitives to identify walls (if vertical), ceiling and floor (based on average height). Then, a region growing algorithm is used to cluster the floor into different rooms. Ochmann [52] considered a model of volumetric, interconnected vertical walls (in addition to room segmentation) fitted to the observed point cloud. Tran [36] started by identifying planar surfaces, using them to decompose 3D space into a set of irregular 3D cells as they believe these should represent different building elements or spaces. Then, their shape-grammar-based reconstruction procedure used both the available geometric information and the knowledge about structural arrangement of the elements to build a model. Han [58] segments the structural elements from the point cloud (represented by planes and cylinders) and reconstructs these structures in sequence. First, the floorplan is generated by slicing the floor plane into 2D cells using the detected wall planes, and then selecting cell edges using Integer Linear Programming. Next, the wall structures are modelled by lifting each edge on the floorplan to a height determined by the ceiling planes by means of a global optimization, obtaining the final 3D model.
When scanning a large indoor environment with a TLS, a large number of scanning positions may be required in order to sample all the surfaces. Furthermore, when data need to be georeferenced, additional localization data need to be registered together with the point cloud to allow a successful registration afterwards. Overall, the complete manual sampling procedure will require more time and work to be accomplished. Recent studies focus on the combination of point clouds and trajectories from MLS systems to enable automatic 3D reconstruction of indoor environments. MLS is usually arranged as a handheld or backpack system and the data acquisition procedure only involves walking around the target environment. When indoors, these systems are usually Simultaneous Localisation and Mapping based-systems, without requiring access to a global navigation satellite system (GNSS) to have a position estimate. Wu [30] performed Poisson mesh reconstruction using a point cloud with normal information. To reduce memory usage, the mesh was divided using a building principal direction extracted from the MLS trajectory, and then it was simplified using plane segmentation. One of the issues identified was the changing of the mesh boundaries after simplification. Li [64] analysed synchronized point cloud data and the scanner’s trajectory in order to detect doors. They also performed both point cloud and trajectory segmentation based on those detections, although only 2D coordinates of those detections were considered. This method can be applied to real time scene mapping. Cui [47] considered a MW prior and performed multi-room segmentation by analysing the cell’s visibility (obtained from segmented plane discretization) along the trajectory and running a clustering algorithm on related points. Doors and windows were also detected, and a volumetric model of the walls was presented. Nikoohemat [40] presented a pipeline that enables detection of stairs, ramps, slanted ceilings and floors and volumetric walls. Furniture was included just to enable identification of occupied areas. They establish the connectivity of all scanned spaces aiming to build a navigation graph that supports path planning in emergency applications and also provide heuristics to check the consistency of the created as-built model. Yang [39] considered both TLS and MLS data in a pipeline that started by producing a 3D occupancy probability grid map to represent the certainty with which a voxel is occupied by obstacles. Then, rooms were segmented by filling free space with spheres, building a topological graph to map adjacency relations among neighbouring spheres and then segmented its subgraphs. The wavefront growth algorithm is used to obtain the final segmentation result.

2.4.3. Relationship Representation

Establishing relationships between elements is an essential task for as-built modelling. Geometric information represents the size and the location of building elements, while topological information describes their spatial connectivity.
Three classes of spatial relationships relevant to BIMs can be identified:
  • Aggregation relationships: one element is a part of another;
  • Topological relationships: one element is inside or outside another, or next to it;
  • Directional relationships: one element is above or below another.
Usually, these relationships are modelled using a tree, a graph structure or a matrix. A tree-based hierarchical representation can be used to model aggregation relationships, where its nodes represent geometric primitives and arcs establish the relationships between them. Graph-based representations use arcs to represent aggregation, topological and directional relationships, and for this reason are said to be a generalization of the hierarchical approach. Techniques that use semantic networks for object recognition use graphs to define the semantic network and the topological and directional relationships in the environment. Table 8 categorizes the relationship models adopted in recent literature.
Some authors use shape grammar rules [36,60] for the extraction of topological relations among building elements. Shape grammar modelling is a volumetric primitive fitting approach that fits cuboid shapes into spaces enclosed by cloud points. Topological relations including adjacency, connectivity, and containment, are established by iteratively merging the cuboids and applying the grammar rules.

3. Future Research Directions and Initiatives

In recent years, there has been some strong innovation in the AEC domain. There is a solid interest from this industry for increased digitalization through the adoption of more capable sensor technology, as well as for BIM integration. This study focused on detailing common processes addressed by Scan-to-BIM and Scan-vs-BIM applications. Furthermore, this literature review provides a brief state-of-the-art on the techniques related to each of those processes. This analysis enabled the identification of research topics with potential for further improvements in this domain, and these will be presented in this section.

3.1. Multi-Platform Sensor Fusion

In this study, a brief comparison was performed between sensors typically used in this domain, namely laser scanners and RGB cameras. Since each of those has limitations, it is straightforward to understand that by integrating different technologies these limitations can be mitigated. Nevertheless, few studies have been found that integrate distinct imaging technologies with typical localization systems (GNSS for outdoors and SLAM for indoors) to collect georeferenced data on construction sites. These technologies can be complementary to each other and used for different tasks within the construction site: e.g., cameras can be used to identify clutter and construction materials, and then a TLS or MLS can capture the geometry features of the building, while having precise localization information. Regarding point clouds alone, combining them when they are obtained from different sources (TLS, MLS, ALS, photogrammetry) increases the data heterogeneity in terms of perspective, resolution, range, density and accuracy, making this integration advantageous. Another important subject, which is actively explored in the robotics domain but not in AEC, is the explicit consideration of sensor uncertainty in the registration and geometry extraction algorithms. Existing sensor fusion approaches from the robotics domain, considering sensor uncertainty models, can be applied here to increase data consistency and overall application performance.

3.2. Enhanced Scan Planning

It is clear that the probability of achieving successful point cloud registration, more accurate and complete feature extraction and 3D reconstruction increases by using equipment with certain characteristics, advanced algorithms, and enough processing power to avoid compromises. However, one should not expect the same performance improvement if scanning locations are not carefully chosen. Although current research addressed this planning problem to some extent, there is no study that guides a user on how to collect proper data so that the performance of the mentioned processes is maximized. Furthermore, while the current research presented interesting solutions for the 2D scan planning problem, there is still a need for planning methodologies that consider both 3D BIM information and sensor measurement models (accounting for range, accuracy, resolution and sensor footprint for example) allowing the acquisition of more accurate data. Another subject that is typically addressed by the robotics community is online planning given modifications to the original assumptions that were considered when planning before being in the field. The AEC domain faces specific issues such as the existence of clutter, construction materials and workers in the construction site, as well as differences between as-designed and as-built models, which may be impossible to account for beforehand. Hence, there is a need for methods that are able to replan scanning positions and change the original plan in real time during the data acquisition stage.

3.3. Incorporating Machine Learning Techniques

In the CV domain, deep learning techniques have been widely used to learn about important features on images and enable real time detection and classification of objects, object segmentation, as well as pose and position estimation. Techniques developed in that domain can be applied to AEC applications in order to facilitate detection and tracking of clutter and structural elements (such as doors, windows, furniture), contributing also for reducing the impact of occlusions due to the presence of those elements. Nevertheless, key processes such as convolution operations are not adequate when paired with unorganized point clouds, although it is possible to take advantage of spatial subdivision procedures. Another difficulty in tackling this subject is the need for an extensive database of annotated training data, which is a laborious task, although the model training process could be skipped if a pre-trained model is used.

3.4. Integrated BIM Ecosystem

Recently, BIM has attracted a lot of attention, and there has been a push from local governments to implement BIM platforms at the national level. Hence, it is only natural to evaluate its integration with other state of the art technologies such as innovative sensor platforms, virtual reality and cloud computing, aiming to further automate procedures and create new interfaces that can be used to increase the project’s efficiency and productivity.

3.5. Benchmarking

Throughout this literature review, it was found that many authors use their own dataset or scenario for experimenting and validating the proposed procedures. This makes it difficult, if not impossible, to perform proper benchmarking against other state-of-the-art methodologies. Perhaps one of the reasons this happens is that the 3D reconstruction topic misses proper benchmarking datasets. An interesting 3D reconstruction benchmarking initiative that ended in 2021, named “ISPRS benchmark on indoor modelling”, enabled a direct comparison of different techniques for generating 3D indoor models from point cloud data by providing a public dataset and an evaluation framework. After the results were published in 2021 [77], the dataset became inaccessible. Still, the authors of this initiative concluded that the performance of each methodology varied across the datasets, demonstrating the importance of having distinct datasets to perform this assessment. Therefore, it is essential to create these benchmarking datasets, with different features and degrees of complexity.
The authors expect that the identification of these topics will inspire research groups around the world to study them and propose solutions that surpass the current state of the art.

4. Conclusions

Laser scanners are one of the most used sensing platforms in the AEC domain, generating large amounts of data usually in the form of unstructured point clouds. This makes the data processing procedure challenging, due to the existence of redundant data, noise, measurement errors, clutter, and so on. As technology advances, researchers have developed advanced algorithms for data reduction and point cloud registering, as well as automatic approaches for BIM reconstruction. This review paper has presented the latest point cloud processing and feature extraction algorithms related to Scan-to-BIM and Scan-vs-BIM procedures in detail.
Furthermore, current limitations and future research directions have been discussed to provide some insights on the topics within which there may be further innovations in this domain. One of the main challenges identified in literature is dealing with missing data due to occlusion in the scene. This can effectively be reduced by performing multi-platform sensor fusion and efficient scan planning. Imaging sensors such as RGB cameras may be used to acquire high resolution images from the scene, and allow identification, classification and segmentation of any objects causing occlusions. Efficient scan planning methodologies accounting for laser scanner characteristics and real-time performance are still lacking. The ability to adapt the scan locations while the sampling operation is being executed by analysing the quality of the data in real time is very valuable in terms of maximizing the efficiency of the process. Furthermore, the integration of localization systems, such as a GNSS while outdoors or a SLAM-based system when indoors, can greatly simplify the dynamic scan planning and data acquisition process discussed above. Current MLS systems can partially cover this gap, but they do not display the same level of performance as a TLS. Therefore, there is a need for planning methodologies that consider both 3D BIM information and sensor measurement models, enabling data acquisition with higher accuracy.
There as been an increasing interest in integrating deep learning methodologies into the point cloud processing and modelling pipeline. Although some studies addressed here have already used these techniques for different purposes, these have already been widely developed and applied by the CV community in other domains to enable real time detection and classification of objects, object segmentation, as well as pose and position estimation. In order to take advantage of this experience, annotated training datasets representing objects and structures common in the AEC domain are still required. Furthermore, benchmarking datasets for comparing the performance of different Scan-to-BIM and Scan-vs-BIM approaches are currently missing, and this may be one of the reasons researchers still use their own datasets in isolation.
In future studies, the authors will focus on developing new scan-planning algorithms using heterogeneous sensing platforms, which can be used to increase the overall efficiency of the posterior modelling task.

Author Contributions

Conceptualization, investigation, writing—original draft preparation, writing—review and editing, Nuno Abreu; Funding acquisition, writing—review & editing, Andry Pinto; Writing—review & editing, validation, Aníbal Matos and Miguel Pires. All authors have read and agreed to the published version of the manuscript.

Funding

This research was supported by European Structural and Investment Funds in the FEDER component, through the Operational Competitiveness and Internationalization Programme (COMPETE 2020) and Lisbon Regional Operational Programme (ROP Lisbon) [Project n.° 046123; Funding Reference: POCI-01-0247-FEDER-046123 and LISBOA-01-0247-FEDER-046123].

Data Availability Statement

Not applicable.

Conflicts of Interest

The authors declare no conflict of interest.

Abbreviations

The following abbreviations are used in this manuscript:
AECArchitecture, Engineering and Construction
ALSAerial Laser Scanner
BIMBuilding Information Modelling
BSPBinary Space Partitioning
CADComputer Aided Design
CVComputer Vision
GNSSGlobal Navigation Satellite System
ICPIterative Closest Point
INSInertial Navigation System
LIDARLight Detection and Ranging
MLSMobile Laser Scanner
MWManhattan World
NBVNext Best View
RANSACRandom Sample Consensus
TLSTerrestrial Laser Scanner
TOFTime of Flight

References

  1. Han, K.; Degol, J.; Golparvar-Fard, M. Geometry- and Appearance-Based Reasoning of Construction Progress Monitoring. J. Constr. Eng. Manag. 2018, 144, 04017110. [Google Scholar] [CrossRef] [Green Version]
  2. Ekanayake, B.; Wong, J.K.W.; Fini, A.A.F.; Smith, P. Computer vision-based interior construction progress monitoring: A literature review and future research directions. Autom. Constr. 2021, 127, 103705. [Google Scholar] [CrossRef]
  3. Maalek, R.; Lichti, D.D.; Ruwanpura, J.Y. Automatic Recognition of Common Structural Elements from Point Clouds for Automated Progress Monitoring and Dimensional Quality Control in Reinforced Concrete Construction. Remote Sens. 2019, 11, 1102. [Google Scholar] [CrossRef] [Green Version]
  4. Zhang, C.; Arditi, D. Advanced Progress Control of Infrastructure Construction Projects Using Terrestrial Laser Scanning Technology. Infrastructures 2020, 5, 83. [Google Scholar] [CrossRef]
  5. Kim, S.; Kim, S.; Lee, D.E. Sustainable Application of Hybrid Point Cloud and BIM Method for Tracking Construction Progress. Sustainability 2020, 12, 4106. [Google Scholar] [CrossRef]
  6. Meyer, T.; Brunn, A.; Stilla, U. Change detection for indoor construction progress monitoring based on BIM, point clouds and uncertainties. Autom. Constr. 2022, 141, 104442. [Google Scholar] [CrossRef]
  7. Pučko, Z.; Šuman, N.; Rebolj, D. Automated continuous construction progress monitoring using multiple workplace real time 3D scans. Adv. Eng. Inform. 2018, 38, 27–40. [Google Scholar] [CrossRef]
  8. Puri, N.; Turkan, Y. Bridge construction progress monitoring using lidar and 4D design models. Autom. Constr. 2020, 109, 102961. [Google Scholar] [CrossRef]
  9. Alizadehsalehi, S.; Yitmen, I. A Concept for Automated Construction Progress Monitoring: Technologies Adoption for Benchmarking Project Performance Control. Arab. J. Sci. Eng. 2019, 44, 4993–5008. [Google Scholar] [CrossRef]
  10. Elqasaby, A.R.; Alqahtani, F.K.; Alheyf, M. State of the Art of BIM Integration with Sensing Technologies in Construction Progress Monitoring. Sensors 2022, 22, 3497. [Google Scholar] [CrossRef]
  11. Bassier, M.; Vincke, S.; de Winter, H.; Vergauwen, M. Drift Invariant Metric Quality Control of Construction Sites Using BIM and Point Cloud Data. ISPRS Int. J. Geo-Inf. 2020, 9, 545. [Google Scholar] [CrossRef]
  12. Liu, J.; Zhang, Q.; Wu, J.; Zhao, Y. Dimensional accuracy and structural performance assessment of spatial structure components using 3D laser scanning. Autom. Constr. 2018, 96, 324–336. [Google Scholar] [CrossRef]
  13. Nguyen, C.H.P.; Choi, Y. Comparison of point cloud data and 3D CAD data for on-site dimensional inspection of industrial plant piping systems. Autom. Constr. 2018, 91, 44–52. [Google Scholar] [CrossRef]
  14. BuildingSMART International. Industry Foundation Classes (IFC)—An Introduction. Available online: https://technical.buildingsmart.org/standards/ifc/ (accessed on 3 January 2023).
  15. Aryan, A.; Bosché, F.; Tang, P. Planning for terrestrial laser scanning in construction: A review. Autom. Constr. 2021, 125, 103551. [Google Scholar] [CrossRef]
  16. Frías, E.; Díaz-Vilariño, L.; Balado, J.; Lorenzo, H. From BIM to Scan Planning and Optimization for Construction Control. Remote Sens. 2019, 11, 1963. [Google Scholar] [CrossRef] [Green Version]
  17. Frías, E.; Previtali, M.; Díaz-Vilariño, L.; Scaioni, M.; Lorenzo, H. Optimal scan planning for surveying large sites with static and mobile mapping systems. ISPRS J. Photogramm. Remote Sens. 2022, 192, 13–32. [Google Scholar] [CrossRef]
  18. Revuelta, E.C.; Chávez, M.J.; Vera, J.A.B.; Rodríguez, Y.F.; Sánchez, M.C. Optimization of laser scanner positioning networks for architectural surveys through the design of genetic algorithms. Measurement 2021, 174, 108898. [Google Scholar] [CrossRef]
  19. Dehbi, Y.; Leonhardt, J.; Oehrlein, J.; Haunert, J.H. Optimal scan planning with enforced network connectivity for the acquisition of three-dimensional indoor models. ISPRS J. Photogramm. Remote Sens. 2021, 180, 103–116. [Google Scholar] [CrossRef]
  20. Qiu, Q.; Wang, M.; Tang, X.; Wang, Q. Scan planning for existing buildings without BIM based on user-defined data quality requirements and genetic algorithm. Autom. Constr. 2021, 130, 103841. [Google Scholar] [CrossRef]
  21. DuraArk Online Repository. Available online: http://data.duraark.eu/ (accessed on 5 March 2023).
  22. Wu, C.; Yuan, Y.; Tang, Y.; Tian, B. Application of Terrestrial Laser Scanning (TLS) in the Architecture, Engineering and Construction (AEC) Industry. Sensors 2021, 22, 265. [Google Scholar] [CrossRef]
  23. Ingman, M.; Virtanen, J.P.; Vaaja, M.T.; Hyyppä, H. A Comparison of Low-Cost Sensor Systems in Automatic Cloud-Based Indoor 3D Modeling. Remote Sens. 2020, 12, 2624. [Google Scholar] [CrossRef]
  24. Rashdi, R.; Martínez-Sánchez, J.; Arias, P.; Qiu, Z. Scanning Technologies to Building Information Modelling: A Review. Infrastructures 2022, 7, 49. [Google Scholar] [CrossRef]
  25. Bertolini, L.; D’Amico, F.; Napolitano, A.; Ciampoli, L.B.; Gagliardi, V.; Manalo, J.R.D. A BIM-Based Approach for Pavement Monitoring Integrating Data from Non-Destructive Testing Methods (NDTs). Infrastructures 2023, 8, 81. [Google Scholar] [CrossRef]
  26. Muralikrishnan, B. Performance evaluation of terrestrial laser scanners—A review. Meas. Sci. Technol. 2021, 32, 072001. [Google Scholar] [CrossRef]
  27. Huang, H.; Zhang, C.; Asce, A.M.; Hammad, A. Effective Scanning Range Estimation for Using TLS in Construction Projects. J. Constr. Eng. Manag. 2021, 147, 04021106. [Google Scholar] [CrossRef]
  28. Xu, Y.; Tong, X.; Stilla, U. Voxel-based representation of 3D point clouds: Methods, applications, and its potential use in the construction industry. Autom. Constr. 2021, 126, 103675. [Google Scholar] [CrossRef]
  29. Wu, Z.; Zeng, Y.; Li, D.S.; Liu, J.; Feng, L. High-volume point cloud data simplification based on decomposed graph filtering. Autom. Constr. 2021, 129, 103815. [Google Scholar] [CrossRef]
  30. Wu, T.; Liu, J.; Li, M.; Chen, R.; Hyyppa, J. Automated large scale indoor reconstruction using vehicle survey data. In Proceedings of the 5th IEEE Conference on Ubiquitous Positioning, Indoor Navigation and Location-Based Services, UPINLBS 2018, Wuhan, China, 22–23 March 2018. [Google Scholar] [CrossRef]
  31. Nikoohemat, S.; Peter, M.; Elberink, S.O.; Vosselman, G. Semantic Interpretation of Mobile Laser Scanner Point Clouds in Indoor Scenes Using Trajectories. Remote Sens. 2018, 10, 1754. [Google Scholar] [CrossRef] [Green Version]
  32. Previtali, M.; Díaz-Vilariño, L.; Scaioni, M. Towards automatic reconstruction of indoor scenes from incomplete point clouds: Door and window detection and regularization. Int. Arch. Photogramm. Remote Sens. Spat. Inf. Sci. 2018, XLII-4, 507–514. [Google Scholar] [CrossRef] [Green Version]
  33. Previtali, M.; Díaz-Vilariño, L.; Scaioni, M. Indoor Building Reconstruction from Occluded Point Clouds Using Graph-Cut and Ray-Tracing. Appl. Sci. 2018, 8, 1529. [Google Scholar] [CrossRef] [Green Version]
  34. Shi, W.; Ahmed, W.; Li, N.; Fan, W.; Xiang, H.; Wang, M. Semantic Geometric Modelling of Unstructured Indoor Point Cloud. ISPRS Int. J. Geo-Inf. 2018, 8, 9. [Google Scholar] [CrossRef] [Green Version]
  35. Chen, J.; Kira, Z.; Cho, Y.K. Deep Learning Approach to Point Cloud Scene Understanding for Automated Scan to 3D Reconstruction. J. Comput. Civ. Eng. 2019, 33, 04019027. [Google Scholar] [CrossRef]
  36. Tran, H.; Khoshelham, K. Procedural Reconstruction of 3D Indoor Models from Lidar Data Using Reversible Jump Markov Chain Monte Carlo. Remote Sens. 2020, 12, 838. [Google Scholar] [CrossRef] [Green Version]
  37. Cheng, D.; Zhang, J.; Zhao, D.; Chen, J.; Citation, D.T.; Automatic, D.; Wang, M.; Yu, H.; Zhu, Y. Automatic Extraction of Indoor Structural Information from Point Clouds. Remote Sens. 2021, 13, 4930. [Google Scholar] [CrossRef]
  38. Sheik, N.A.; Deruyter, G.; Veelaert, P. Plane-Based Robust Registration of a Building Scan with Its BIM. Remote Sens. 2022, 14, 1979. [Google Scholar] [CrossRef]
  39. Yang, F.; Li, Y.; Che, M.; Wang, S.; Wang, Y.; Zhang, J.; Cao, X.; Zhang, C. The Polygonal 3D Layout Reconstruction of an Indoor Environment via Voxel-Based Room Segmentation and Space Partition. ISPRS Int. J. Geo-Inf. 2022, 11, 530. [Google Scholar] [CrossRef]
  40. Nikoohemat, S.; Diakité, A.A.; Zlatanova, S.; Vosselman, G. Indoor 3D reconstruction from point clouds for optimal routing in complex buildings to support disaster management. Autom. Constr. 2020, 113, 103109. [Google Scholar] [CrossRef]
  41. Cheng, L.; Chen, S.; Liu, X.; Xu, H.; Wu, Y.; Li, M.; Chen, Y. Registration of Laser Scanning Point Clouds: A Review. Sensors 2018, 18, 1641. [Google Scholar] [CrossRef] [Green Version]
  42. Besl, P.J.; McKay, N.D. Method for registration of 3-D shapes. Sens. Fusion IV Control Paradig. Data Struct. 1992, 1611, 586–606. [Google Scholar] [CrossRef] [Green Version]
  43. Rusinkiewicz, S.; Levoy, M. Efficient variants of the ICP algorithm. In Proceedings of the International Conference on 3-D Digital Imaging and Modeling, 3DIM, Quebec City, QC, Canada, 28 May–1 June 2001; pp. 145–152. [Google Scholar] [CrossRef] [Green Version]
  44. Huang, X.; Zhang, J.; Wu, Q.; Fan, L.; Yuan, C. A Coarse-to-Fine Algorithm for Matching and Registration in 3D Cross-Source Point Clouds. IEEE Trans. Circuits Syst. Video Technol. 2018, 28, 2965–2977. [Google Scholar] [CrossRef] [Green Version]
  45. Wen, X.; Xie, H.; Liu, H.; Yan, L. Accurate Reconstruction of the LoD3 Building Model by Integrating Multi-Source Point Clouds and Oblique Remote Sensing Imagery. ISPRS Int. J. Geo-Inf. 2019, 8, 135. [Google Scholar] [CrossRef] [Green Version]
  46. Bueno, M.; Bosché, F.; González-Jorge, H.; Martínez-Sánchez, J.; Arias, P. 4-Plane congruent sets for automatic registration of as-is 3D point clouds with 3D BIM models. Autom. Constr. 2018, 89, 120–134. [Google Scholar] [CrossRef]
  47. Cui, Y.; Li, Q.; Yang, B.; Xiao, W.; Chen, C.; Dong, Z.; Cui, Y.; Li, Q.; Yang, B.; Chen, C.; et al. Automatic 3-D Reconstruction of Indoor Environment With Mobile Laser Scanning Point Clouds Index Terms-Three-dimensional (3-D) reconstruction, indoor modeling, mobile laser scanning, point clouds. IEEE J. Sel. Top. Appl. Earth Obs. Remote Sens. 2019, 12, 3117. [Google Scholar] [CrossRef] [Green Version]
  48. Li, D.; Shen, X.; Yu, Y.; Guan, H.; Li, J.; Zhang, G.; Li, D. Building Extraction from Airborne Multi-Spectral LiDAR Point Clouds Based on Graph Geometric Moments Convolutional Neural Networks. Remote Sens. 2020, 12, 3186. [Google Scholar] [CrossRef]
  49. Bassier, M.; Vergauwen, M.; Poux, F. Point Cloud vs. Mesh Features for Building Interior Classification. Remote Sens. 2020, 12, 2224. [Google Scholar] [CrossRef]
  50. Wang, C.; Hou, S.; Wen, C.; Gong, Z.; Li, Q.; Sun, X.; Li, J. Semantic line framework-based indoor building modeling using backpacked laser scanning point cloud. ISPRS J. Photogramm. Remote Sens. 2018, 143, 150–166. [Google Scholar] [CrossRef]
  51. Zolanvari, S.M.; Laefer, D.F.; Natanzi, A.S. Three-dimensional building façade segmentation and opening area detection from point clouds. ISPRS J. Photogramm. Remote Sens. 2018, 143, 134–149. [Google Scholar] [CrossRef]
  52. Ochmann, S.; Vock, R.; Klein, R. Automatic reconstruction of fully volumetric 3D building models from oriented point clouds. ISPRS J. Photogramm. Remote Sens. 2019, 151, 251–262. [Google Scholar] [CrossRef] [Green Version]
  53. Dey, E.K.; Awrangjeb, M.; Stantic, B. Outlier detection and robust plane fitting for building roof extraction from LiDAR data. Int. J. Remote Sens. 2020, 41, 6325–6354. [Google Scholar] [CrossRef]
  54. Wang, S.; Cai, G.; Cheng, M.; Junior, J.M.; Huang, S.; Wang, Z.; Su, S.; Li, J. Robust 3D reconstruction of building surfaces from point clouds based on structural and closed constraints. ISPRS J. Photogramm. Remote Sens. 2020, 170, 29–44. [Google Scholar] [CrossRef]
  55. Chen, M.; Liu, X.; Zhang, X.; Wang, M.; Zhao, L.; Oude, S.; Khoshelham, K.; Wang, C. Building Extraction from Terrestrial Laser Scanning Data with Density of Projected Points on Polar Grid and Adaptive Threshold. Remote Sens. 2021, 13, 4392. [Google Scholar] [CrossRef]
  56. Fan, H.; Wang, Y.; Gong, J. Layout graph model for semantic façade reconstruction using laser point clouds. Geo-Spat. Inf. Sci. 2021, 24, 403–421. [Google Scholar] [CrossRef]
  57. Fang, H.; Lafarge, F.; Pan, C.; Huang, H. Floorplan generation from 3D point clouds: A space partitioning approach. ISPRS J. Photogramm. Remote Sens. 2021, 175, 44–55. [Google Scholar] [CrossRef]
  58. Han, J.; Rong, M.; Jiang, H.; Liu, H.; Shen, S. Vectorized indoor surface reconstruction from 3D point cloud with multistep 2D optimization. ISPRS J. Photogramm. Remote Sens. 2021, 177, 57–74. [Google Scholar] [CrossRef]
  59. Zeng, H.; Wu, J.; Furukawa, Y. Neural Procedural Reconstruction for Residential Buildings. In Computer Vision—ECCV 2018; Lecture Notes in Computer Science (Including Subseries Lecture Notes in Artificial Intelligence and Lecture Notes in Bioinformatics); Springer: Cham, Switzerland, 2018; Volume 11207, pp. 759–775. [Google Scholar] [CrossRef]
  60. Tran, H.; Khoshelham, K.; Kealy, A.; Díaz-Vilariño, L. Shape Grammar Approach to 3D Modeling of Indoor Environments Using Point Clouds. J. Comput. Civ. Eng. 2019, 33, 04018055. [Google Scholar] [CrossRef]
  61. Namouchi, S.; Vallet, B.; Farah, I.R.; Ismail, H. Piecewise Horizontal 3D Roof Reconstruction from Aerial Lidar; IEEE: Piscataway, NJ, USA, 2019; pp. 8992–8995. [Google Scholar]
  62. Abbas, R.; Westling, F.A.; Skinner, C.; Hanus-Smith, M.; Harris, A.; Kirchner, N. BuiltView: Integrating LiDAR and BIM for Real-Time Quality Control of Construction Projects; IAARC Publications: Waterloo, ON, Canada, 2020; Volume 2020, pp. 233–239. [Google Scholar]
  63. Bassier, M.; Vergauwen, M. Topology Reconstruction of BIM Wall Objects from Point Cloud Data. Remote Sens. 2020, 12, 1800. [Google Scholar] [CrossRef]
  64. Zheng, Y.; Peter, M.; Zhong, R.; Elberink, S.O.; Zhou, Q. Space Subdivision in Indoor Mobile Laser Scanning Point Clouds Based on Scanline Analysis. Sensors 2018, 18, 1838. [Google Scholar] [CrossRef] [Green Version]
  65. Kang, Z.; Yang, J.; Yang, Z.; Cheng, S. A Review of Techniques for 3D Reconstruction of Indoor Environments. ISPRS Int. J. Geo-Inf. 2020, 9, 330. [Google Scholar] [CrossRef]
  66. Pintore, G.; Mura, C.; Ganovelli, F.; Fuentes-Perez, L.; Pajarola, R.; Gobbetti, E. State-of-the-art in Automatic 3D Reconstruction of Structured Indoor Environments. Comput. Graph. Forum 2020, 39, 667–699. [Google Scholar] [CrossRef]
  67. Czerniawski, T.; Ma, J.W.; Leite, F. Automated building change detection with amodal completion of point clouds. Autom. Constr. 2021, 124, 103568. [Google Scholar] [CrossRef]
  68. Albano, R. Investigation on Roof Segmentation for 3D Building Reconstruction from Aerial LIDAR Point Clouds. Appl. Sci. 2019, 9, 4674. [Google Scholar] [CrossRef] [Green Version]
  69. Maltezos, E.; Doulamis, A.; Doulamis, N.; Ioannidis, C. Building Extraction From LiDAR Data Applying Deep Convolutional Neural Networks. IEEE Geosci. Remote Sens. Lett. 2019, 16, 155–159. [Google Scholar] [CrossRef]
  70. Xia, S.; Chen, D.; Wang, R.; Member, S.; Li, J.; Zhang, X.; Chen, D. Geometric Primitives in LiDAR Point Clouds: A Review. IEEE J. Sel. Top. Appl. Earth Obs. Remote Sens. 2020, 13, 685–707. [Google Scholar] [CrossRef]
  71. Hu, P.; Miao, Y.; Hou, M. Reconstruction of Complex Roof Semantic Structures from 3D Point Clouds Using Local Convexity and Consistency. Remote Sens. 2021, 13, 1946. [Google Scholar] [CrossRef]
  72. Klimkowska, A.; Cavazzi, S.; Leach, R.; Grebby, S. Detailed Three-Dimensional Building Façade Reconstruction: A Review on Applications, Data and Technologies. Remote Sens. 2022, 14, 2579. [Google Scholar] [CrossRef]
  73. Awrangjeb, M.; Gilani, S.A.N.; Siddiqui, F.U. An Effective Data-Driven Method for 3-D Building Roof Reconstruction and Robust Change Detection. Remote Sens. 2018, 10, 1512. [Google Scholar] [CrossRef] [Green Version]
  74. Coughlan, J.M.; Yuille, A.L. Manhattan World: Compass direction from a single image by Bayesian inference. In Proceedings of the IEEE International Conference on Computer Vision, Kerkyra, Greece, 20–27 September 1999; Volume 2, pp. 941–947. [Google Scholar] [CrossRef]
  75. Song, J.; Xia, S.; Wang, J.; Chen, D. Curved Buildings Reconstruction from Airborne LiDAR Data by Matching and Deforming Geometric Primitives. IEEE Trans. Geosci. Remote Sens. 2021, 59, 1660–1674. [Google Scholar] [CrossRef]
  76. Wang, R.; Peethambaran, J.; Chen, D. LiDAR Point Clouds to 3-D Urban Models: A Review. IEEE J. Sel. Top. Appl. Earth Obs. Remote Sens. 2018, 11, 606–627. [Google Scholar] [CrossRef]
  77. Khoshelham, K.; Tran, H.; Acharya, D.; Vilariño, L.D.; Kang, Z.; Dalyot, S. Results of the ISPRS benchmark on indoor modelling. ISPRS Open J. Photogramm. Remote Sens. 2021, 2, 100008. [Google Scholar] [CrossRef]
Figure 1. A registered point cloud is overlayed on the BIM using INESC TEC’s VR progress monitoring platform. The highlighted segment is classified as belonging to the floor.
Ijgi 12 00260 g001
Figure 2. Number of publications since 2018 related to the mentioned keywords, retrieved from the Web of Science platform.
Ijgi 12 00260 g002
Figure 3. Generic procedure for processing point cloud data in Scan-to-BIM and Scan-vs-BIM applications.
Ijgi 12 00260 g003
Figure 4. Example of visibility determination in a complex floor plan. The red dots are the selected scanner positions.
Ijgi 12 00260 g004
Figure 5. A point cloud representation of the public dataset CITA_Byg72 [21].
Ijgi 12 00260 g005
Figure 6. Factors influencing a TLS measurement.
Ijgi 12 00260 g006
Figure 7. Data reduction using an occupancy grid. The space is partitioned in cubes, and points inside are replaced with its centroid.
Ijgi 12 00260 g007
Table 1. List of journals where reviewed studies were published. Both CiteScore and SCImago Journal Rank (SJR) 2022 metrics were retrieved from the Scopus database.
JournalNo. of PapersCiteScoreSJR
Remote Sensing147.91.136
Automation in Construction1216.72.443
ISPRS Journal of Photogrammetry and Remote Sensing919.23.308
ISPRS International Journal of Geo-Information56.20.738
IEEE Journal of Selected Topics in Applied Earth Observations and Remote Sensing37.81.264
Sensors46.80.764
Infrastructures34.30.527
Journal of Construction Engineering and Management28.01.152
Advanced Engineering Informatics211.81.709
Applied Sciences24.50.492
Journal of Computing in Civil Engineering212.11.349
IEEE Transactions on Pattern Analysis and Machine Intelligence130.44.447
IEEE Transactions on Circuits and Systems for Video Technology111.21.491
IEEE Geoscience and Remote Sensing Letters16.41.284
IEEE Transactions on Geoscience and Remote Sensing110.92.404
Sustainability15.80.664
Geo-spatial Information Science17.50.971
International Journal of Remote Sensing17.00.732
Computer Graphics Forum15.30.950
Arabian Journal for Science and Engineering15.20.480
The International Archives of the Photogrammetry, Remote Sensing and Spatial Information Sciences11.80.274
Measurement19.01.106
Measurement Science and Technology13.90.478
Table 2. Comparison of photogrammetry and laser scanning platforms.
ParameterPhotogrammetryLaser Scanning
Instrument costCheapExpensive
AccuracyHigh (needs advanced processing algorithms)High
Acquisition timeShortLong
3D informationNeeds to me estimatedDirect measurement
Data volumeDepends on the resolution of the imagesDepends on point density
Sensitivity to environmental conditionsRequires sufficient lightingWorks during night or day
Table 3. Comparison of laser scanning systems on different platforms [24].
ParametersTLSMLSALS
Point densityDense (>100 pt/m2)Dense (>100 pt/m2)Up to 50 pt/m2
Scanning rangePoint shapeStripe shapeSurface shape
AccuracyHigh accuracy (mm level)High accuracy (cm level)High accuracy (<15 cm)
Scanning perspectiveSide viewSide viewTop view
SensorsLaser scannerGNSS, IMU, laser scannerGNSS, IMU, laser scanner
AdvantagesProvides the highest level of detailProvides faster data, reduces
acquisition time
Suitable for large area
DisadvantagesNot suitable for large infrastructureAbsolute accuracy is low because the satellite signals are blocked by buildingsExpensive for small project sites
ApplicationsSmall area 3D reconstructionHD mapping, urban monitoring,
road mapping
Terrain mapping, vegetation monitoring, power line detection, bathymetric applications in shallow water
Table 4. Data reduction procedures used in selected literature.
MethodReferences
Mesh-based simplification[30]
Point-based simplification—voxelization[6,11,13,31,32,33,34,35,36,37,38,39]
Point-based simplification—minimum distance[7,35,40]
Table 5. Registration algorithms used in selected literature.
MethodReferences
Coarse registration—point features[3,5,7,8,13,23,45]
Coarse registration—line features[37]
Coarse registration—surface features[37,38,46]
Coarse registration—PCA[12,47]
Fine registration—ICP[7,8,11,12,13,23,45,48]
Table 6. Feature extraction techniques adopted in the selected literature.
MethodReferences
Planar primitive detection[3,31,32,36,37,38,39,40,45,47,50,51,52,53,54,55,56,57,58]
Volumetric primitive fitting[59,60]
Mesh-based reconstruction[5,11,30,37,57,58,61,62,63]
Table 7. Environments addressed in selected literature.
MethodReferences
Indoor[2,6,11,16,19,23,31,32,33,34,35,36,37,39,40,47,49,50,52,55,57,58,60,62,63,64,65,66,67]
Outdoor[4,5,8,18,38,45,48,51,53,54,56,59,61,67,68,69,70,71]
Table 8. Relationship model.
ModelReferences
Tree[33,71,75]
Graph[31,35,36,39,40,52,54,56,58,61,63,71,73]
Matrix[45,63]
Disclaimer/Publisher’s Note: The statements, opinions and data contained in all publications are solely those of the individual author(s) and contributor(s) and not of MDPI and/or the editor(s). MDPI and/or the editor(s) disclaim responsibility for any injury to people or property resulting from any ideas, methods, instructions or products referred to in the content.

