

The Non-Linear Influence of Built Environment on the School Commuting Metro Ridership: The Case in Wuhan, China
Abstract
:1. Introduction
2. Literature Review
3. Research Design
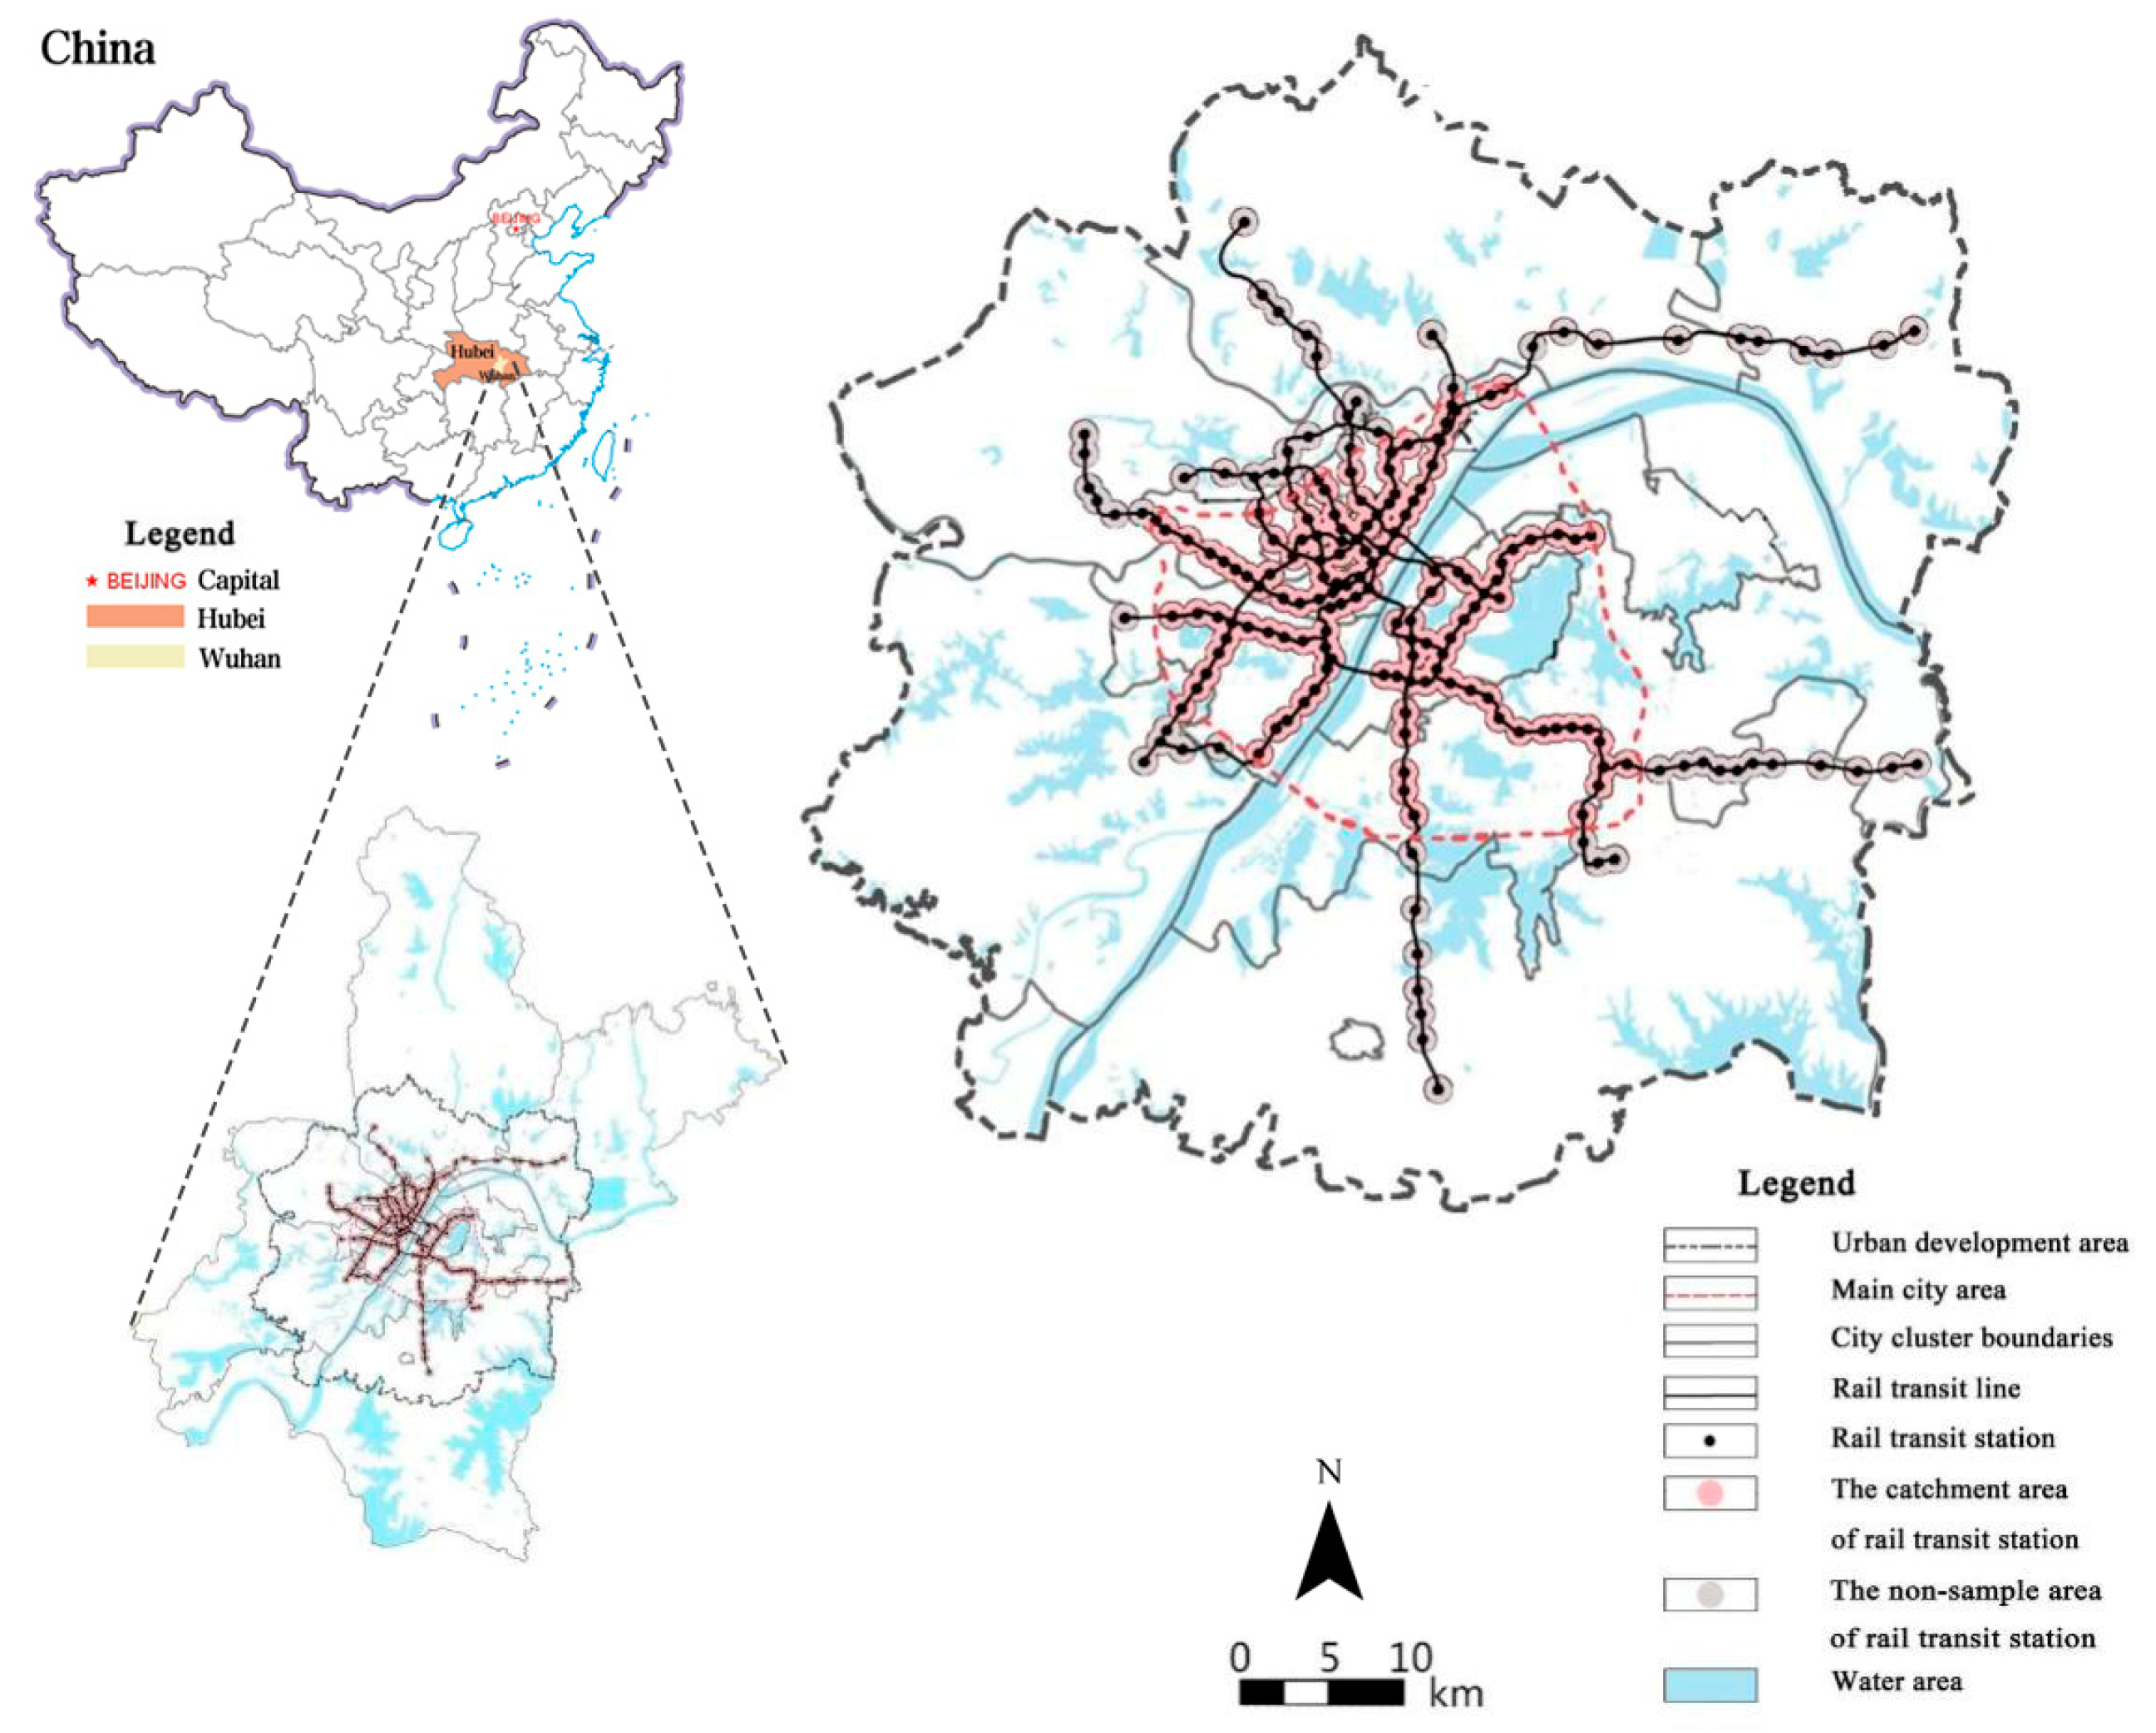
3.1. Study Area
3.2. Data and Variable Settings
3.3. Methods
4. Results
4.1. Relative Importance of Independent Variables
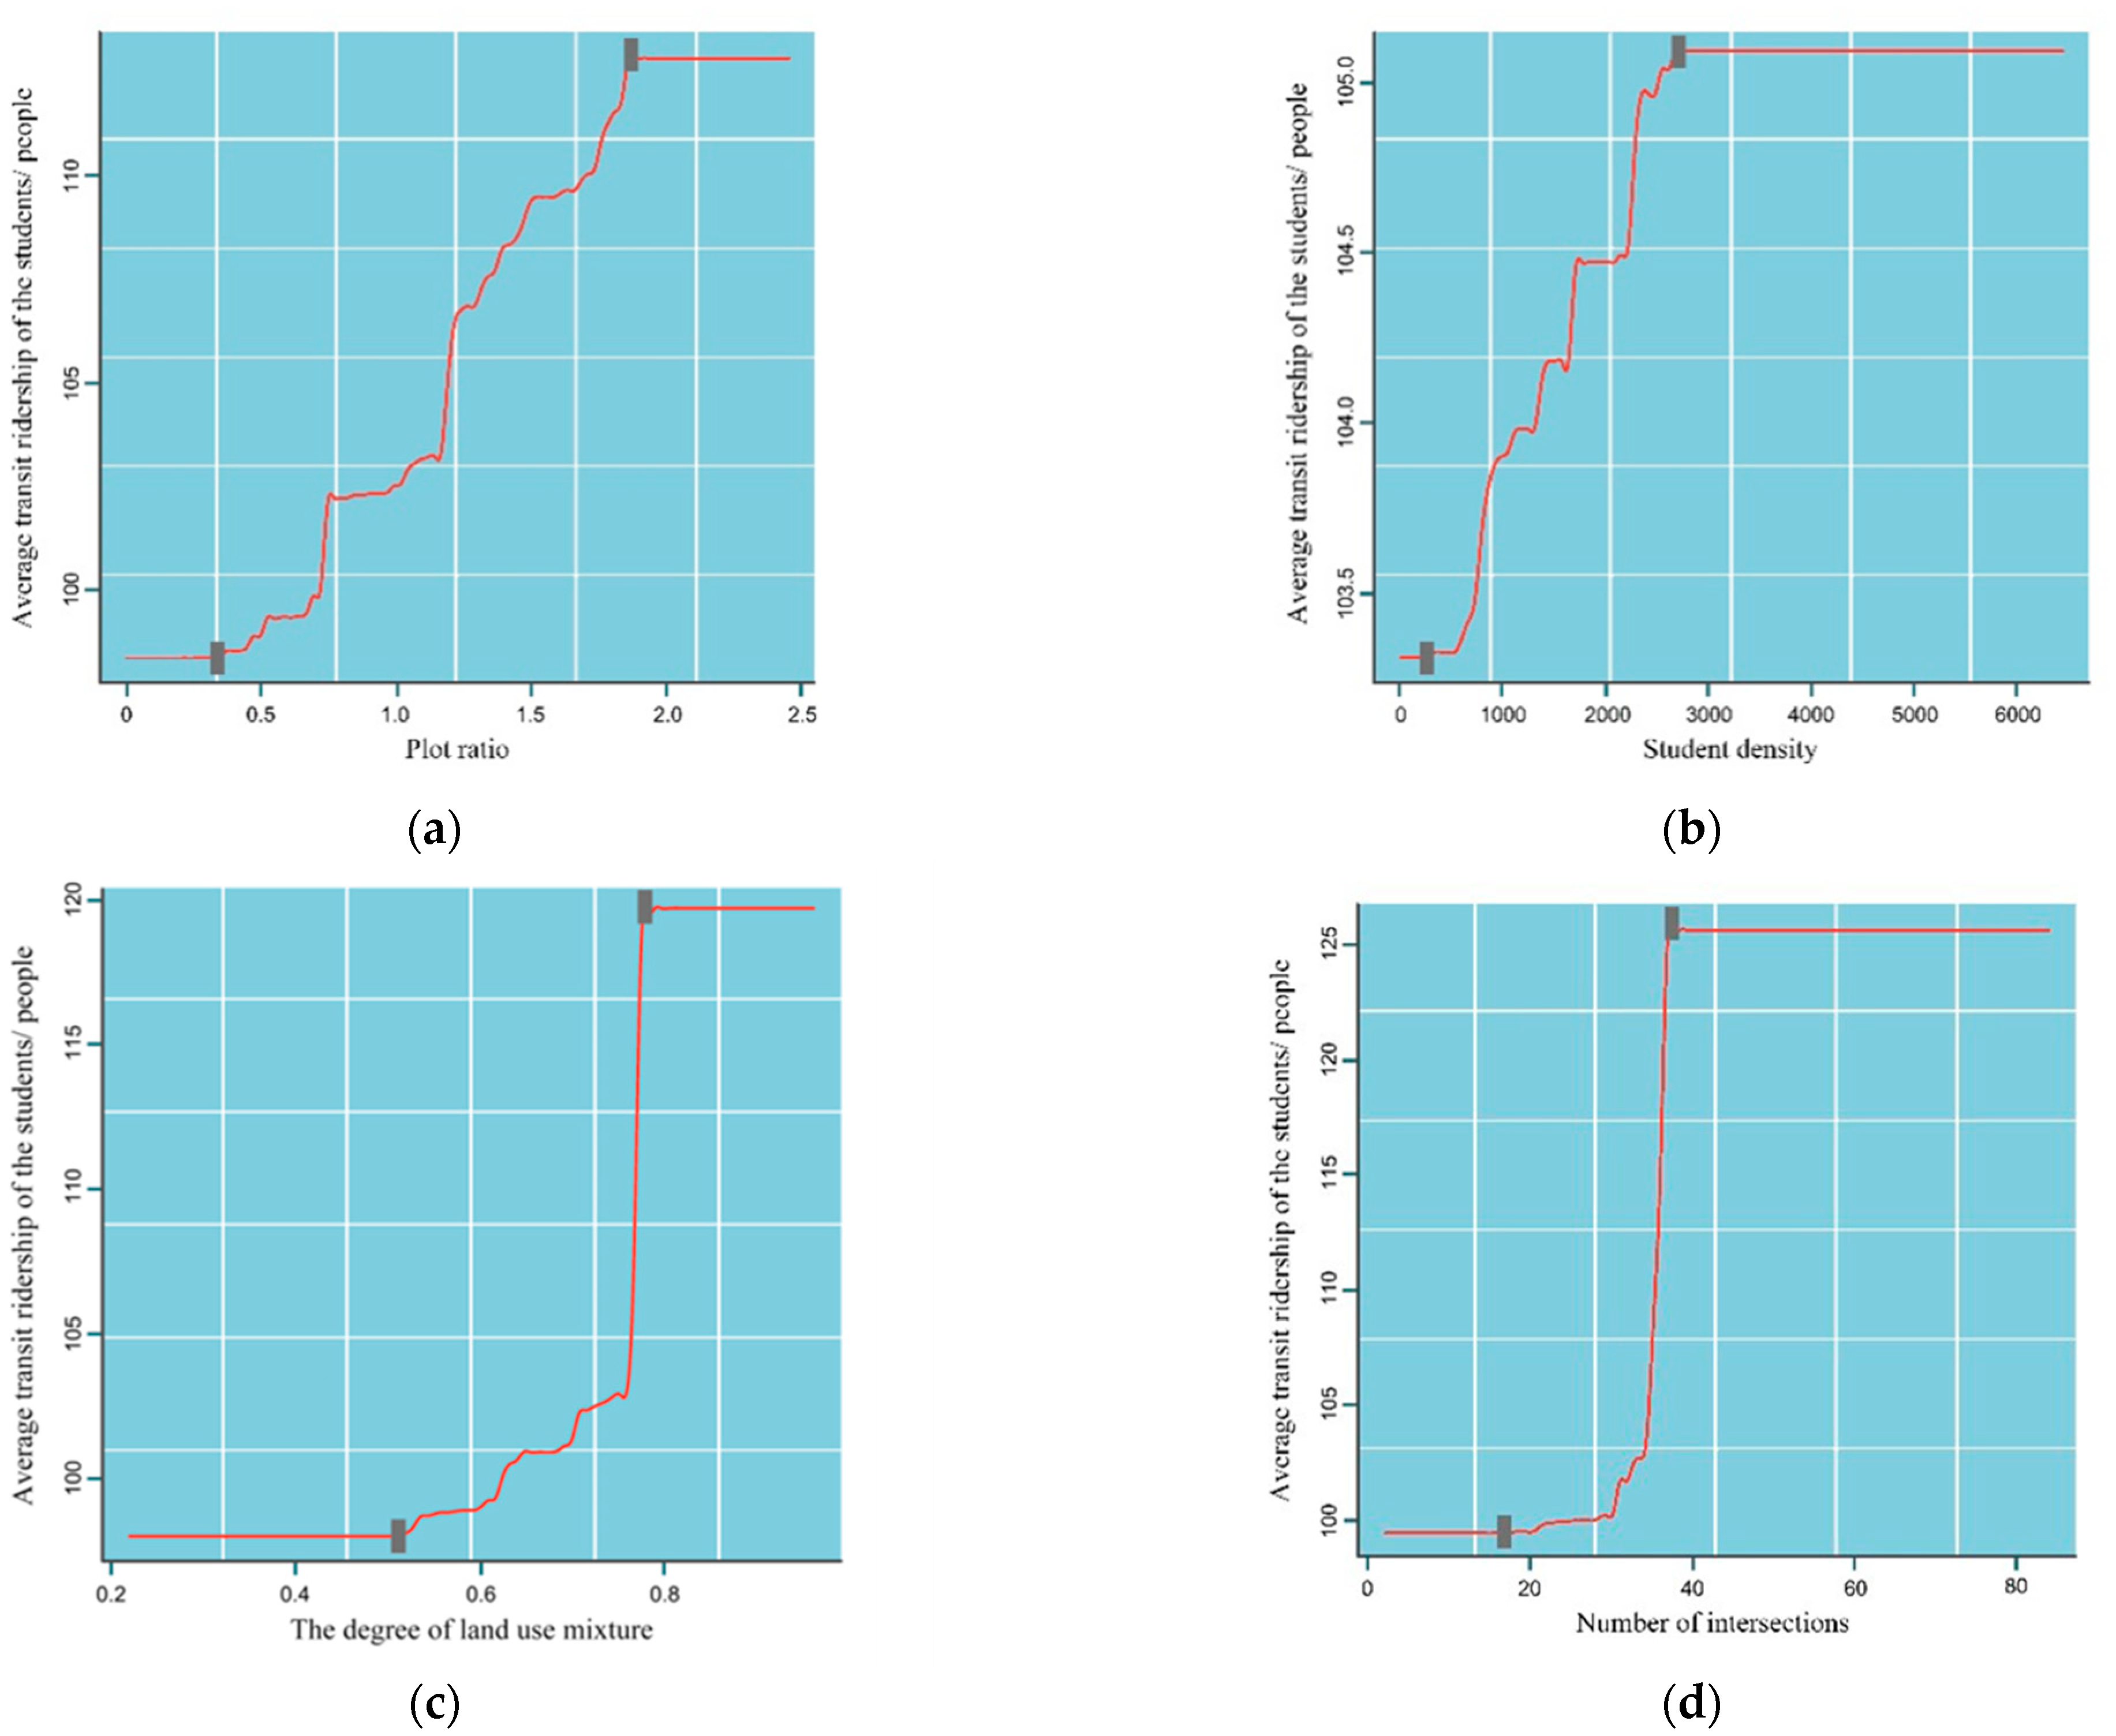
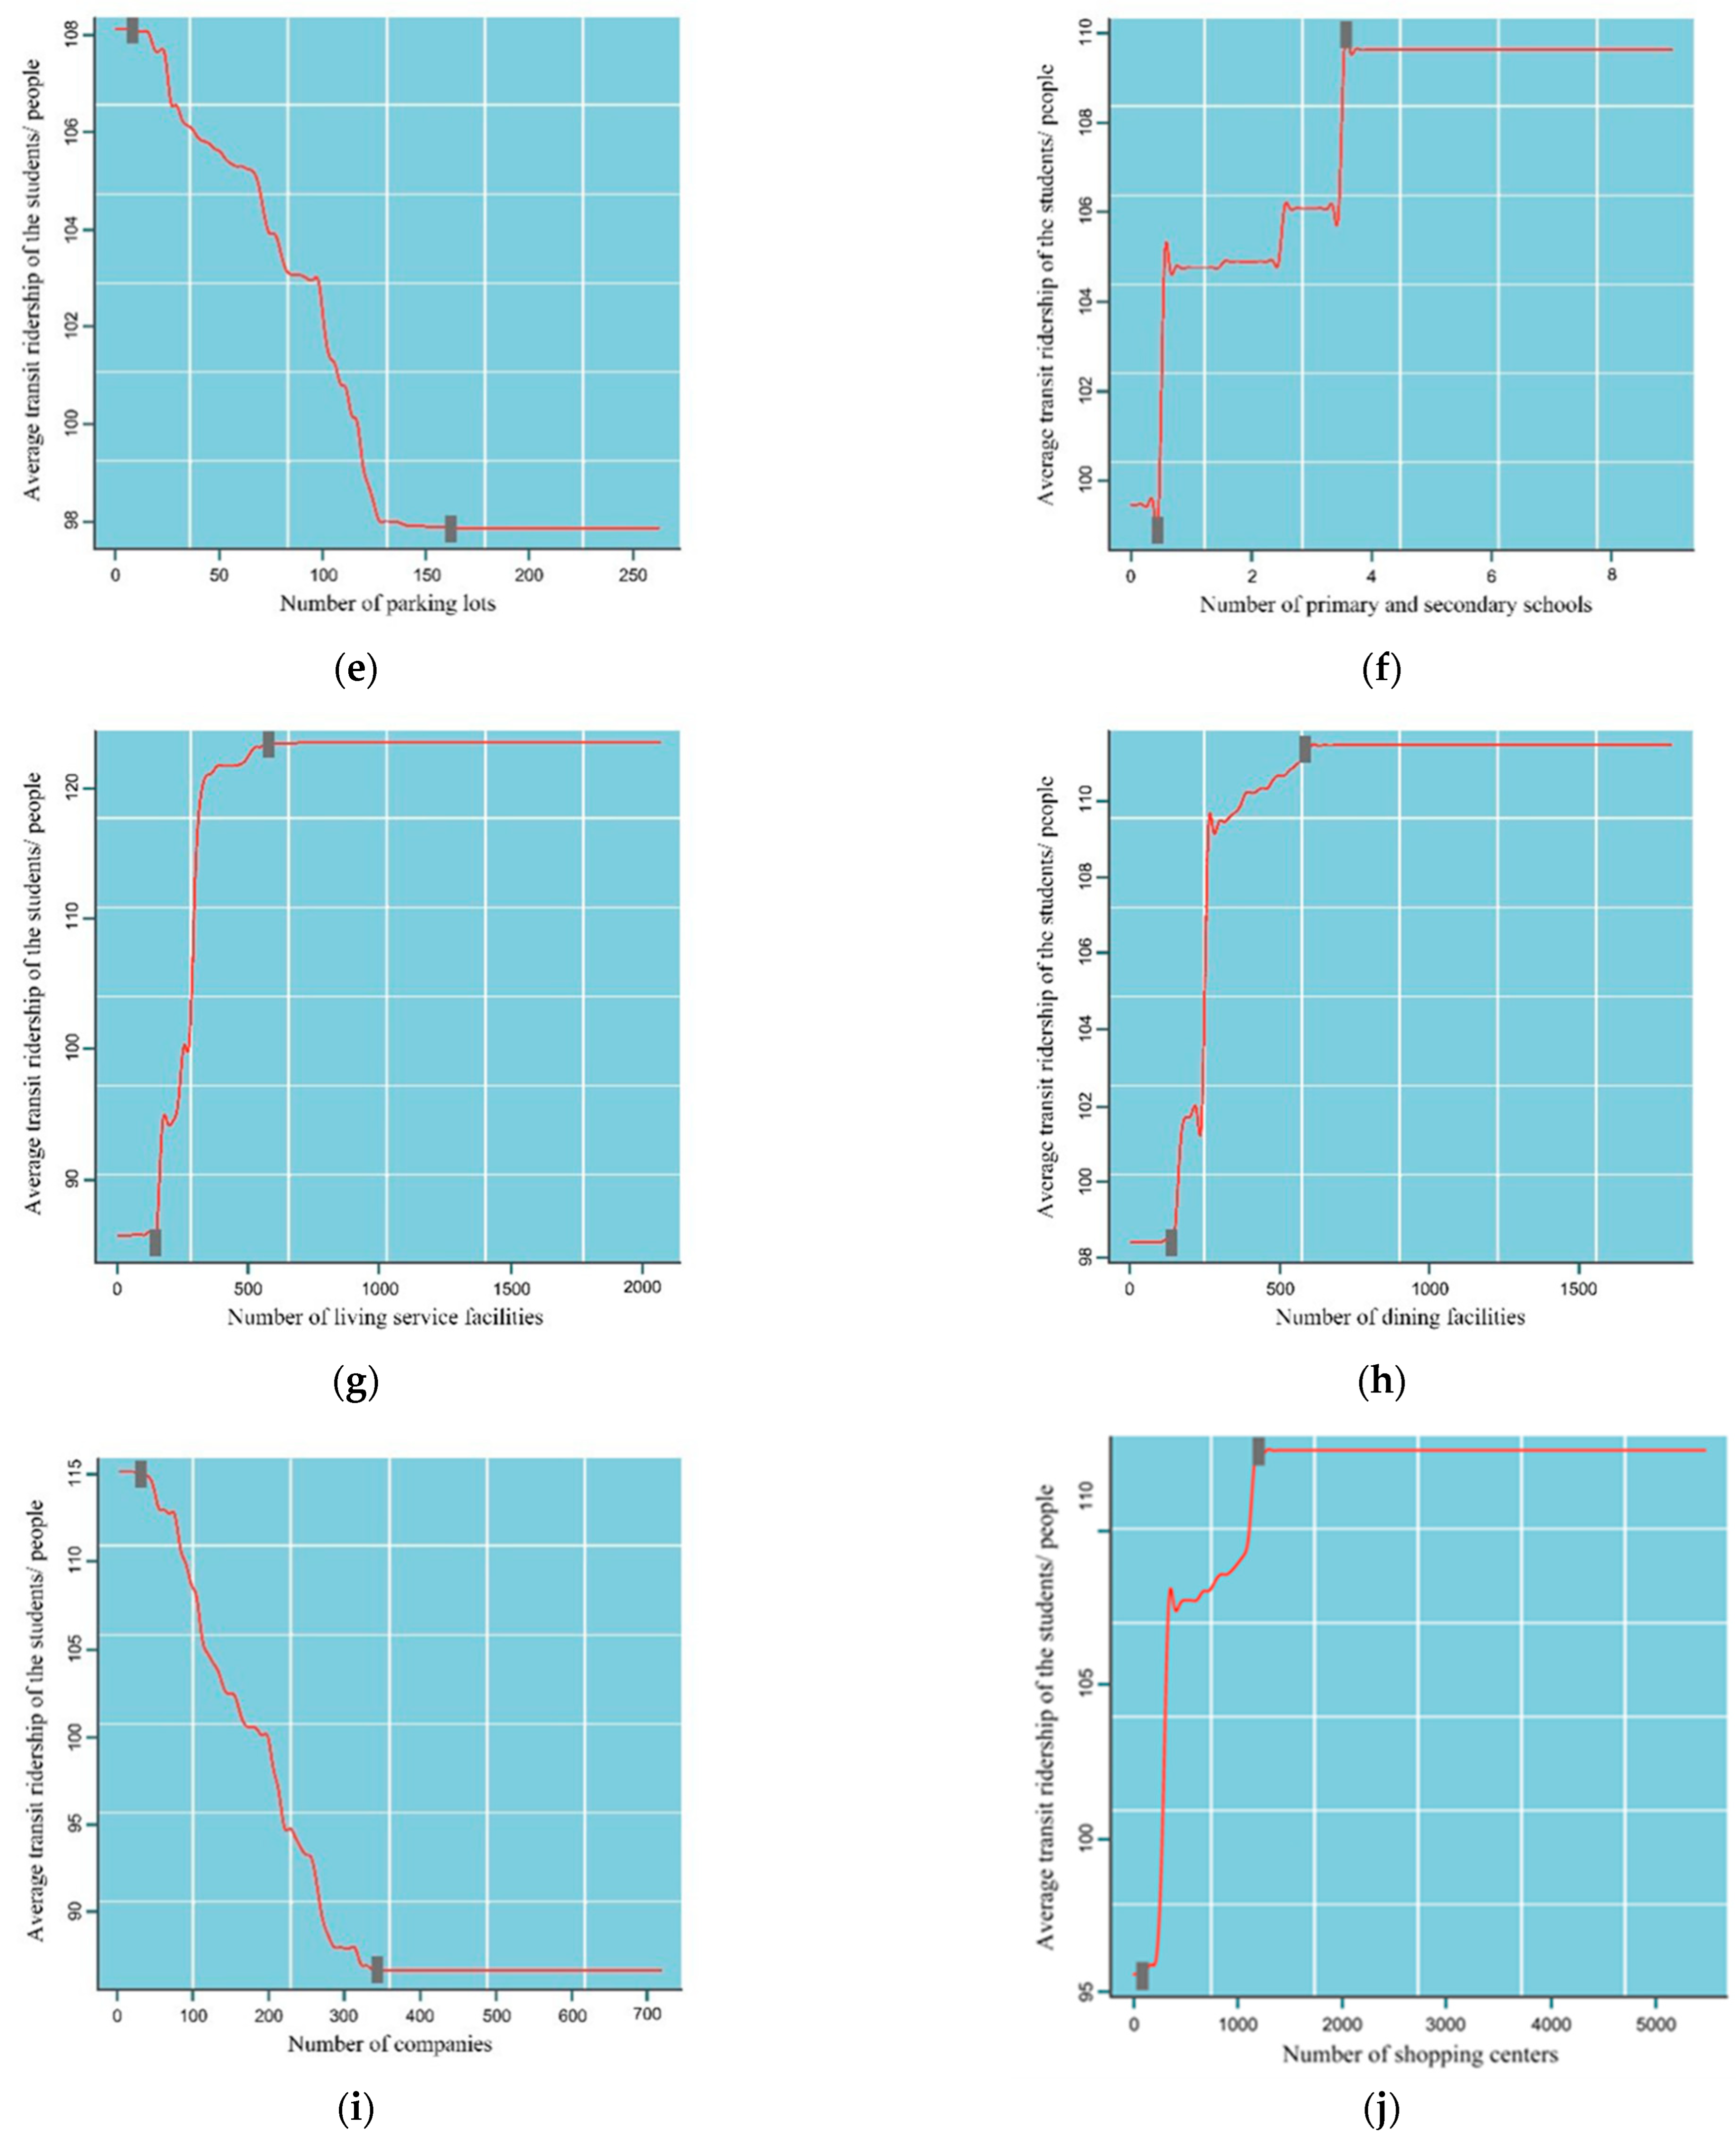
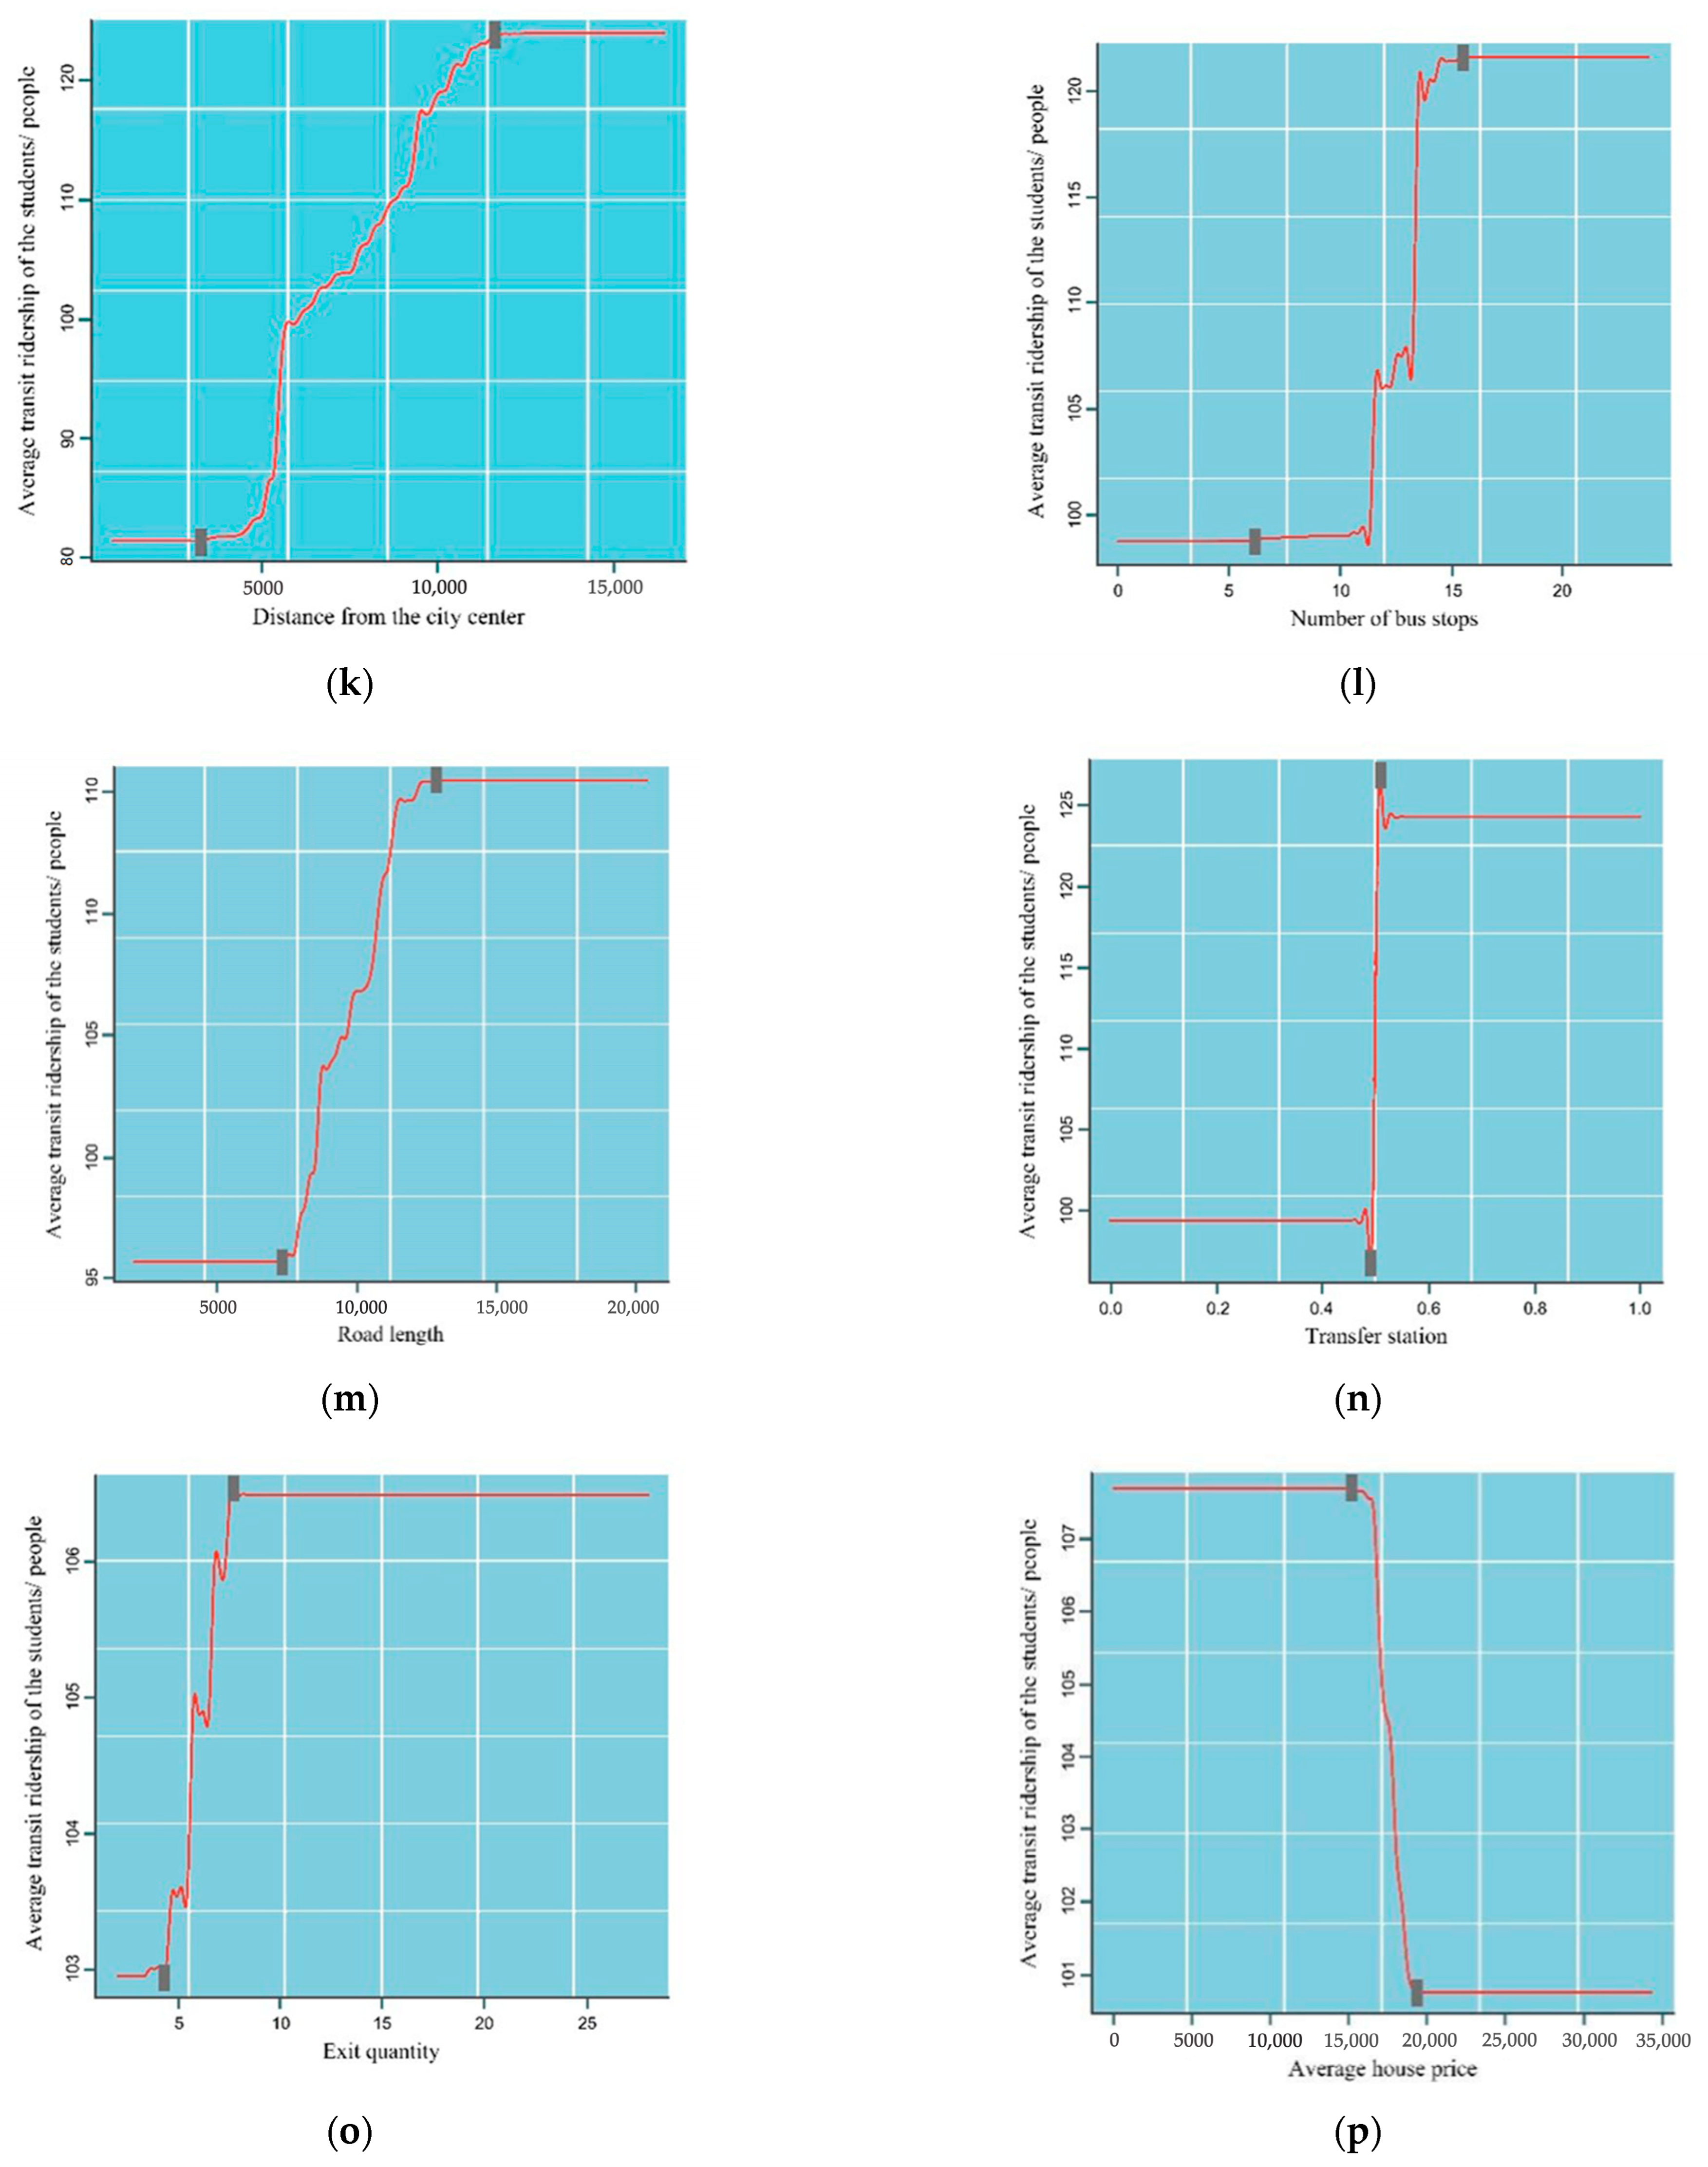
4.2. Non-Linear Association between Built Environment and School Commuting Metro Ridership
5. Discussion
6. Conclusions
Author Contributions
Funding
Institutional Review Board Statement
Informed Consent Statement
Data Availability Statement
Conflicts of Interest
References
- Martínez-Gómez, D.; Ruiz, J.R.; Gómez-Martínez, S.; Chillón, P.; Rey-López, J.P.; Díaz, L.E.; Castillo, R.; Veiga, O.L.; Marcos, A. Active Commuting to School and Cognitive Performance in Adolescents: The AVENA Study. Arch. Pediatr. Adolesc. Med. 2011, 165, 300–305. [Google Scholar] [CrossRef] [PubMed]
- Must, A.; Tybor, D.J. Physical Activity and Sedentary Behavior: A Review of Longitudinal Studies of Weight and Adiposity in Youth. Int. J. Obes. 2005, 29, S84–S96. [Google Scholar] [CrossRef]
- Chica-Olmo, J.; Rodríguez-López, C.; Chillón, P. Effect of Distance from Home to School and Spatial Dependence between Homes on Mode of Commuting to School. J. Transp. Geogr. 2018, 72, 1–12. [Google Scholar] [CrossRef]
- Mori, N.; Armada, F.; Willcox, D.C. Walking to School in Japan and Childhood Obesity Prevention: New Lessons from an Old Policy. Am. J. Public Health 2012, 102, 2068–2073. [Google Scholar] [CrossRef] [PubMed]
- Van Dyck, D.; De Bourdeaudhuij, I.; Cardon, G.; Deforche, B. Criterion Distances and Correlates of Active Transportation to School in Belgian Older Adolescents. Int. J. Behav. Nutr. Phys. Act. 2010, 7, 87. [Google Scholar] [CrossRef]
- Aranda-Balboa, M.J.; Chillón, P.; Saucedo-Araujo, R.G.; Molina-García, J.; Huertas-Delgado, F.J. Children and Parental Barriers to Active Commuting to School: A Comparison Study. Int. J. Environ. Res. Public Health 2021, 18, 2504. [Google Scholar] [CrossRef]
- Wilson, K.; Clark, A.F.; Gilliland, J.A. Understanding Child and Parent Perceptions of Barriers Influencing Children’s Active School Travel. BMC Public Health 2018, 18, 1053. [Google Scholar] [CrossRef]
- Ewing, R.; Cervero, R. Travel and the Built Environment. J. Am. Plan. Assoc. 2010, 76, 265–294. [Google Scholar] [CrossRef]
- Guo, J.Y.; Chen, C. The Built Environment and Travel Behavior: Making the Connection. Transportation 2007, 34, 529–533. [Google Scholar] [CrossRef]
- Chen, E.; Ye, Z.; Wang, C.; Zhang, W. Discovering the Spatio-Temporal Impacts of Built Environment on Metro Ridership Using Smart Card Data. Cities 2019, 95, 102359. [Google Scholar] [CrossRef]
- Huang, J.; Chen, S.; Xu, Q.; Chen, Y.; Hu, J. Relationship between Built Environment Characteristics of TOD and Subway Ridership: A Causal Inference and Regression Analysis of the Beijing Subway. J. Rail Transp. Plan. Manag. 2022, 24, 100341. [Google Scholar] [CrossRef]
- An, D.; Tong, X.; Liu, K.; Chan, E.H.W. Understanding the Impact of Built Environment on Metro Ridership Using Open Source in Shanghai. Cities 2019, 93, 177–187. [Google Scholar] [CrossRef]
- Li, S.; Lyu, D.; Huang, G.; Zhang, X.; Gao, F.; Chen, Y.; Liu, X. Spatially Varying Impacts of Built Environment Factors on Rail Transit Ridership at Station Level: A Case Study in Guangzhou, China. J. Transp. Geogr 2020, 82, 102631. [Google Scholar] [CrossRef]
- Choi, J.; Lee, Y.J.; Kim, T.; Sohn, K. An Analysis of Metro Ridership at the Station-to-Station Level in Seoul. Transportation 2012, 39, 705–722. [Google Scholar] [CrossRef]
- Yang, H.; Ruan, Z.; Li, W.; Zhu, H.; Zhao, J.; Peng, J. The Impact of Built Environment Factors on Elderly People’s Mobility Characteristics by Metro System Considering Spatial Heterogeneity. ISPRS Int. J. Geoinf. 2022, 11, 315. [Google Scholar] [CrossRef]
- Shao, Q.; Zhang, W.; Cao, X.; Yang, J.; Yin, J. Threshold and Moderating Effects of Land Use on Metro Ridership in Shenzhen: Implications for TOD Planning. J. Transp. Geogr. 2020, 89, 102878. [Google Scholar] [CrossRef]
- Ding, C.; Cao, X.; Liu, C. How Does the Station-Area Built Environment Influence Metrorail Ridership? Using Gradient Boosting Decision Trees to Identify Non-Linear Thresholds. J. Transp. Geogr. 2019, 77, 70–78. [Google Scholar] [CrossRef]
- Gan, Z.; Yang, M.; Feng, T.; Timmermans, H. Understanding Urban Mobility Patterns from a Spatiotemporal Perspective: Daily Ridership Profiles of Metro Stations. Transportation 2020, 47, 315–336. [Google Scholar] [CrossRef]
- Gan, Z.; Yang, M.; Feng, T.; Timmermans, H.J.P. Examining the Relationship between Built Environment and Metro Ridership at Station-to-Station Level. Transp. Res. D Transp. Environ. 2020, 82, 102332. [Google Scholar] [CrossRef]
- Cardozo, O.D.; García-Palomares, J.C.; Gutiérrez, J. Application of Geographically Weighted Regression to the Direct Forecasting of Transit Ridership at Station-Level. Appl. Geogr. 2012, 34, 548–558. [Google Scholar] [CrossRef]
- Peng, J.; Qi, J.; Cui, C.; Yan, J.; Dai, Q.; Yang, H.; Peng, J.; Qi, J.; Cui, C.; Yan, J.; et al. Research on the Impact of the Built Environment on the Characteristics of Metropolis Rail Transit School Commuting-Take Wuhan as an Example. Int. J. Environ. Res. Public Health Artic. Public Health 2021, 18, 9885. [Google Scholar] [CrossRef]
- Aston, L.; Currie, G.; Kamruzzaman, M.; Delbosc, A.; Teller, D. Study Design Impacts on Built Environment and Transit Use Research. J. Transp. Geogr. 2020, 82, 102625. [Google Scholar] [CrossRef]
- Mackett, R.L. Children’s Travel Behaviour and Its Health Implications. Transp. Policy 2013, 26, 66–72. [Google Scholar] [CrossRef]
- Timperio, A.; Ball, K.; Salmon, J.; Roberts, R.; Giles-Corti, B.; Simmons, D.; Baur, L.A.; Crawford, D. Personal, Family, Social, and Environmental Correlates of Active Commuting to School. Am. J. Prev. Med. 2006, 30, 45–51. [Google Scholar] [CrossRef]
- Mitra, R.; Buliung, R.N. Built Environment Correlates of Active School Transportation: Neighborhood and the Modifiable Areal Unit Problem. J. Transp. Geogr. 2012, 20, 51–61. [Google Scholar] [CrossRef]
- Du, Q.; Zhou, Y.; Huang, Y.; Wang, Y.; Bai, L. Spatiotemporal Exploration of the Non-Linear Impacts of Accessibility on Metro Ridership. J. Transp. Geogr. 2022, 102, 103380. [Google Scholar] [CrossRef]
- Panter, J.R.; Jones, A.P.; van Sluijs, E.M.F.; Griffin, S.J. Neighborhood, Route, and School Environments and Children’s Active Commuting. Am. J. Prev. Med. 2010, 38, 268–278. [Google Scholar] [CrossRef]
- Zhao, J.; Deng, W.; Song, Y.; Zhu, Y. Analysis of Metro Ridership at Station Level and Station-to-Station Level in Nanjing: An Approach Based on Direct Demand Models. Transportation 2014, 41, 133–155. [Google Scholar] [CrossRef]
- Su, S.; Zhao, C.; Zhou, H.; Li, B.; Kang, M. Unraveling the Relative Contribution of TOD Structural Factors to Metro Ridership: A Novel Localized Modeling Approach with Implications on Spatial Planning. J. Transp. Geogr. 2022, 100, 103308. [Google Scholar] [CrossRef]
- Liu, Y.; Wang, S.; Xie, B. Evaluating the Effects of Public Transport Fare Policy Change Together with Built and Non-Built Environment Features on Ridership: The Case in South East Queensland, Australia. Transp. Policy 2019, 76, 78–89. [Google Scholar] [CrossRef]
- Tu, W.; Cao, R.; Yue, Y.; Zhou, B.; Li, Q.; Li, Q. Spatial Variations in Urban Public Ridership Derived from GPS Trajectories and Smart Card Data. J. Transp. Geogr. 2018, 69, 45–57. [Google Scholar] [CrossRef]
- Zhao, P. The Impact of the Built Environment on Individual Workers’ Commuting Behavior in Beijing. Int. J. Sustain. Transp. 2013, 7, 389–415. [Google Scholar] [CrossRef]
- Liu, B.; Xu, Y.; Guo, S.; Yu, M.; Lin, Z.; Yang, H. Examining the Nonlinear Impacts of Origin-Destination Built Environment on Metro Ridership at Station-to-Station Level. ISPRS Int. J. Geoinf. 2023, 12, 59. [Google Scholar] [CrossRef]
- Xiao, L.; Lo, S.; Liu, J.; Zhou, J.; Li, Q. Nonlinear and Synergistic Effects of TOD on Urban Vibrancy: Applying Local Explanations for Gradient Boosting Decision Tree. Sustain. Cities. Soc. 2021, 72, 103063. [Google Scholar] [CrossRef]
- Saha, D.; Alluri, P.; Gan, A. Prioritizing Highway Safety Manual’s Crash Prediction Variables Using Boosted Regression Trees. Accid. Anal. Prev. 2015, 79, 133–144. [Google Scholar] [CrossRef] [PubMed]
- Friedman, J.H. Greedy Function Approximation: A Gradient Boosting Machine. Ann. Statist. 2001, 29, 1189–1232. [Google Scholar] [CrossRef]
- Ding, C.; Cao, X.; Næss, P. Applying Gradient Boosting Decision Trees to Examine Non-Linear Effects of the Built Environment on Driving Distance in Oslo. Transp. Res. Part A Policy Pract. 2018, 110, 107–117. [Google Scholar] [CrossRef]
- Zhang, Y.; Haghani, A. A Gradient Boosting Method to Improve Travel Time Prediction. Transp. Res. Part C Emerg. Technol. 2015, 58, 308–324. [Google Scholar] [CrossRef]
- Corral-Abós, A.; Aibar, A.; Estrada-Tenorio, S.; Julián, J.A.; Ibor, E.; Zaragoza, J. Implications of School Type for Active Commuting to School in Primary Education Students. Travel Behav. Soc. 2021, 24, 143–151. [Google Scholar] [CrossRef]
- Ding, D.; Sallis, J.F.; Kerr, J.; Lee, S.; Rosenberg, D.E. Neighborhood Environment and Physical Activity among Youth: A Review. Am. J. Prev. Med. 2011, 41, 442–455. [Google Scholar] [CrossRef]
- Wang, X.; Liu, Y.; Zhu, C.; Yao, Y.; Helbich, M. Associations between the Streetscape Built Environment and Walking to School among Primary Schoolchildren in Beijing, China. J. Transp. Geogr. 2022, 99, 103303. [Google Scholar] [CrossRef]
- Ikeda, E.; Mavoa, S.; Cavadino, A.; Carroll, P.; Hinckson, E.; Witten, K.; Smith, M. Keeping Kids Safe for Active Travel to School: A Mixed Method Examination of School Policies and Practices and Children’s School Travel Behaviour. Travel Behav. Soc. 2020, 21, 57–68. [Google Scholar] [CrossRef]
- Giles-Corti, B.; Wood, G.; Pikora, T.; Learnihan, V.; Bulsara, M.; van Niel, K.; Timperio, A.; McCormack, G.; Villanueva, K. School Site and the Potential to Walk to School: The Impact of Street Connectivity and Traffic Exposure in School Neighborhoods. Health Place 2011, 17, 545–550. [Google Scholar] [CrossRef] [PubMed]
- Mitra, R.; Buliung, R.N. The Influence of Neighborhood Environment and Household Travel Interactions on School Travel Behavior: An Exploration Using Geographically-Weighted Models. J. Transp. Geogr. 2014, 36, 69–78. [Google Scholar] [CrossRef]
- Sohn, K.; Shim, H. Factors Generating Boardings at Metro Stations in the Seoul Metropolitan Area. Cities 2010, 27, 358–368. [Google Scholar] [CrossRef]
- Jun, M.J.; Choi, K.; Jeong, J.E.; Kwon, K.H.; Kim, H.J. Land Use Characteristics of Subway Catchment Areas and Their Influence on Subway Ridership in Seoul. J. Transp. Geogr. 2015, 48, 30–40. [Google Scholar] [CrossRef]
- Zhao, J.; Deng, W.; Song, Y.; Zhu, Y. What Influences Metro Station Ridership in China? Insights from Nanjing. Cities 2013, 35, 114–124. [Google Scholar] [CrossRef]


| Variables | Calculation and Interpretation | Mean | SD |
|---|---|---|---|
| Dependent variable | |||
| School commuting metro ridership | Average number of boarding per station calculated from Wuhan Metro card data | 103.523 | 114.328 |
| Independent variable | |||
| Density | |||
| Floor area ratio | Floor area ratio within the catchment area, ratio of total floor area to site area | 1.067 | 0.580 |
| Student density | Student density within the catchment area (persons/km²) | 1445.835 | 1068.308 |
| Diversity | |||
| The degree of land-use mixture | where is the number of land-use types in the area around station . is the proportion of the area of and the type of land use in the catchment area. | 0.643 | 0.153 |
| Design | |||
| Number of intersections | Number of road junctions within the catchment area | 24.781 | 14.599 |
| Number of parking lots | Number of car parks within the catchment area | 78.828 | 63.500 |
| Destination | |||
| Number of primary and secondary schools | Number of primary and secondary schools within the catchment area | 1.820 | 1.856 |
| Living service facilities | Number of living service facilities within the catchment area | 389.484 | 350.595 |
| Dining facilities | Number of dining facilities within the catchment area | 323.414 | 297.502 |
| Companies | Number of companies within the catchment area | 168.484 | 158.348 |
| Shopping centers | Number of shopping centers within the catchment area | 737.070 | 893.208 |
| Distance | |||
| Distance from the city center | Straight line distance of the station from the city center (m) | 8005.988 | 3617.339 |
| Number of bus stops | Number of bus stops within the station area | 9.547 | 4.786 |
| Road length | Total length of roads within the catchment area (m) | 9818.032 | 3091.995 |
| Characteristics of rail transit stations | |||
| Transfer station | Dummy variables, where 1 means the station is a transfer station, and 0 means the station is not a transfer station | 0.156 | 0.363 |
| Exit quantity | Number of entrances and exits within the station area | 5.188 | 3.391 |
| Social attributes | |||
| House prices | Average house price within the catchment area (CNY/m2) | 17,245.90 | 5552.74 |
| Variables | Rank | Relative Importance (%) |
|---|---|---|
| Density | ||
| Floor area ratio | 10 | 4.87 |
| Student density | 16 | 0.47 |
| Diversity | ||
| The degree of land-use mixture | 3 | 9.93 |
| Design | ||
| Number of intersections | 2 | 11.79 |
| Number of parking lots | 12 | 2.64 |
| Destination | ||
| Number of primary and secondary schools | 13 | 2.55 |
| Living service facilities | 1 | 15.57 |
| Dining facilities | 7 | 5.44 |
| Companies | 9 | 4.97 |
| Shopping center | 8 | 5.09 |
| Distance | ||
| Distance from the city center | 4 | 9.66 |
| Number of bus stops | 6 | 9.25 |
| Road length | 11 | 4.76 |
| Characteristics of subway stations | ||
| Whether it is a transfer station | 5 | 9.61 |
| Exit quantity | 15 | 1.59 |
| Social economy attributes | ||
| House prices | 14 | 1.79 |
Disclaimer/Publisher’s Note: The statements, opinions and data contained in all publications are solely those of the individual author(s) and contributor(s) and not of MDPI and/or the editor(s). MDPI and/or the editor(s) disclaim responsibility for any injury to people or property resulting from any ideas, methods, instructions or products referred to in the content. |
© 2023 by the authors. Licensee MDPI, Basel, Switzerland. This article is an open access article distributed under the terms and conditions of the Creative Commons Attribution (CC BY) license (https://creativecommons.org/licenses/by/4.0/).
Share and Cite
Yan, J.; Wan, Q.; Feng, J.; Wang, J.; Hu, Y.; Yan, X. The Non-Linear Influence of Built Environment on the School Commuting Metro Ridership: The Case in Wuhan, China. ISPRS Int. J. Geo-Inf. 2023, 12, 193. https://doi.org/10.3390/ijgi12050193
Yan J, Wan Q, Feng J, Wang J, Hu Y, Yan X. The Non-Linear Influence of Built Environment on the School Commuting Metro Ridership: The Case in Wuhan, China. ISPRS International Journal of Geo-Information. 2023; 12(5):193. https://doi.org/10.3390/ijgi12050193
Chicago/Turabian StyleYan, Jinming, Qiuyu Wan, Jingyi Feng, Jianjun Wang, Yiwen Hu, and Xuexin Yan. 2023. "The Non-Linear Influence of Built Environment on the School Commuting Metro Ridership: The Case in Wuhan, China" ISPRS International Journal of Geo-Information 12, no. 5: 193. https://doi.org/10.3390/ijgi12050193