1. Introduction
Pedestrians’ route choice is critical for several purposes, as pedestrian flow influences stores’ viability in inner city areas and the planning and design of public spaces and facilities [
1,
2,
3]. A road map is a common tool to help pedestrians with route planning in unfamiliar environments [
4,
5]. Researchers have found that pedestrians without individual preferences and requirements make similar route choices because people have similar cognitive habits when using maps [
6,
7,
8,
9], which can result in unbalanced pedestrian flow. Hence, some studies have focused on consciously changing map representations to influence map users’ route choices. Some researchers have indicated that decision-making influence should be an important map function to broaden map applications and commercial promotion [
10,
11,
12].
There are two common approaches to changing map representations to influence map users’ route choice. The first is to add extra symbols or change symbol visualization while retaining the route’s geometric shapes (e.g., changing the color of road symbols to represent traffic information, including travel time, traffic accidents, and congestion) [
13,
14,
15]. The second approach is to change routes’ geometric shapes, such as recommending a longer route by simplifying its shape [
16] because people prefer routes with simpler shapes [
14,
17,
18]. Compared with the first approach, route shape simplification may be more effective because a simple route shape is easy to perceive, understand, memorize, and follow, and can reduce cognitive burden in the decision-making process [
7,
19,
20,
21]. Such simplification has been widely adopted in cartography generalization and map representations to improve map clarity, recognition efficiency [
22,
23,
24], and schematic maps [
25,
26].
Related research has verified that shape simplification can influence map users’ route choice when a recommended route and another route have a slight distance difference [
16]. However, according to cognition psychology, when using a road map pedestrians’ route choice is also influenced by other geometric characteristics, including the relative distance of different routes [
27,
28,
29], the difference in initial orientation (i.e., the difference in orientation from the starting point to the first turn and the orientation from the starting point to the destination point) [
8,
17,
30,
31], the number of intersections [
32,
33,
34], and direction changes [
9]. There is a lack of research on whether route shape simplification influences people’s route choice with a consideration of various geometric characteristics. This is critical for practical application because it is not possible that all routes from a starting point to a destination have a similar relative distance, initial orientation, number of intersections, and direction changes. Accordingly, this study aims to evaluate the influence of route shape simplification (with a consideration of various geometric characteristics) on pedestrians’ route choice. Additionally, it is necessary to choose an appropriate method of route shape simplification to improve users’ route recognition, which is not considered in prior research.
Compared with extant research, this study conducts a more comprehensive evaluation of shape simplification’s influence on pedestrians’ route choice. It explores whether route shape simplification can effectively enhance pedestrians’ choice preferences under different conditions, including various geometric characteristics. Furthermore, the relations between the different conditions of the other geometric characteristics and the influence of shape simplification on route choice behavior are revealed via a correlation analysis. Additionally, some suggestions to avoid the negative impacts of other geometric characteristics on the influence of shape simplification are provided.
2. Related Works on Influencing Factors for Pedestrian Route Choice
Many studies have examined the influencing factors of pedestrians’ route choice behavior. Three main factors have a significant influence on pedestrians’ route choice behavior: individual differences, temporary disturbances, and road network-related geometric factors [
35]. Individual differences are highly dependent on personal requirements, the purpose of the trip, pedestrians’ spatial skills, and pedestrians’ familiarity with the environment [
36]. Temporary disturbances only impact on-route decisions according to specific situations and environmental factors, for example, sudden traffic accidents, congestion, accessibility, and walkability [
15]. Road network-related geometric factors include the route’s geometric shape, relative distance, initial orientation, the number of intersections, and direction changes [
9,
37,
38,
39].
Further, several studies have indicated that pedestrian route choice is most significantly affected by the geometric characteristics of road networks. The relative distance of different routes on maps has a considerable influence on route choice behavior because pedestrians prefer shorter routes [
28,
29]. The influence of the number of intersections on a given route’s distance perception may be explained by clutter effects. When a route has several intersections, pedestrians believe that the route is longer, compared with routes with fewer intersections [
32,
40]. Moreover, a route with few direction changes has good visual continuity, which makes it easier for pedestrians to understand, memorize, and follow [
41,
42]. As pedestrians are used to keeping track of the target’s orientation throughout their trip in order to reduce their cognitive effort, they may prefer routes with smaller differences between the orientation from their starting point to the first turn and the orientation from their starting point to their destination [
8].
Routes with simpler shapes may be the most frequently chosen when pedestrians use maps [
39]. Pedestrians prefer routes with simpler shapes because they have shorter perceived lengths [
14,
17,
18]. A route is generally perceived as consisting of different parts due to psychological compression. For instance, a route with a complex shape (e.g., more sharp turns) may be perceived as consisting of more parts, which makes psychological compression more difficult as it has a longer perceived length [
43,
44]. Prior empirical studies have attempted to influence pedestrians’ choices regarding specific routes using different experimental designs; they found that the simplification of routes’ geometric shape has a significant influence under similar conditions of other geometric characteristics [
16].
3. Methods of the Survey
3.1. Experimental Methods
This study aims to determine whether route shape simplification can influence people’s route choice, considering various geometric characteristics including relative distance, initial orientation, number of intersections, and direction changes. To this end, route choice experiments and a correlation analysis are conducted. First, the maps of some roads suitable for walking were selected as baseline maps. Subsequently, a route choice experiment using these baseline maps according to the given starting and destination points was conducted. The selection of the starting and destination points followed three criteria. (1) There is more than one possible route from the starting point to the destination point. Three pairs of starting and destination points on each baseline map were selected. (2) From the starting point to the destination point in pairs 1, 2, and 3, there should be possible routes with large differences in initial orientation, number of intersections, and relative distance, respectively. (3) The starting and destination points of the three pairs have different orientations and pass through the map regions to the extent possible.
In this study, for each baseline map, the route chosen by most participants is referred to as the baseline route. Other choice routes are regarded as candidates of recommended routes. If a candidate of a recommended route has the same segments as its corresponding baseline route, it was not selected as a route to be recommended because its shape simplification must result in a change to the baseline route. Then, the shapes of the recommended routes were simplified to generate the modified maps, while a route choice experiment using the modified maps was conducted.
According to the route choice results, a Chi-square test was conducted to evaluate whether the influences of shape simplification for the route choice results are significant. Correlation analyses were used to evaluate whether there are associations between the influence of route shape simplification on pedestrians’ route choice behavior and other geometric characteristics. Although different geometric characteristics are considered in the selection of pairs of starting and destination points according to criterion (2), there may be large differences for more than one geometric characteristic among option routes. Hence, all route choice results were included in the correlation analysis. The four geometric characteristics included in the correlation analysis are defined as follows:
Difference in initial orientation is the deviation between the orientation from the starting point to the first turn and the orientation from the starting point to the destination point. The absolute value of deviation is used in this study;
Difference in the number of intersections is calculated by subtracting the number of intersections in a baseline route from that in its corresponding recommended route;
Relative distance is the ratio of the length of a recommended route to that of its corresponding baseline route on the baseline map;
Direction changes are determined by angular step depth (i.e., the sum of the normalized values of the direction change on all nodes of a route, while the range of the normalized value of a node is set from 0 to 2 for a 0° to 180° direction change [
45]).
3.2. Selection of the Shape Simplification Method
There are two approaches to simplify a recommended route: (1) simplification based on the whole route while displacing the nodes and (2) simplification based on a segment of the route while retaining the nodes’ positions. For the simplification of route shape, this study preserved the overall similarity of a route’s original and simplified shapes, which was important for map usability vis à vis deformed map representations [
46]. Hence, segment-based simplification was adopted in this study to avoid shape distortions due to the displacement of the nodes, thus maintaining similarity between the modified maps and their corresponding baseline maps. The Douglas–Peucker algorithm [
47] is commonly used for line shape simplification and can better preserve the shape features of lines [
48]. The implementation of this algorithm consists of four steps:
Connect the start and end vertices with a straight line;
Calculate the perpendicular distances from the vertices on the road line to the straight line;
If the maximum perpendicular distance is equal to or more than a given threshold, divide the road line into two sub-lines; otherwise, straighten the road line;
Continue the subdivision process for sub-lines until no perpendicular distance is larger than the threshold.
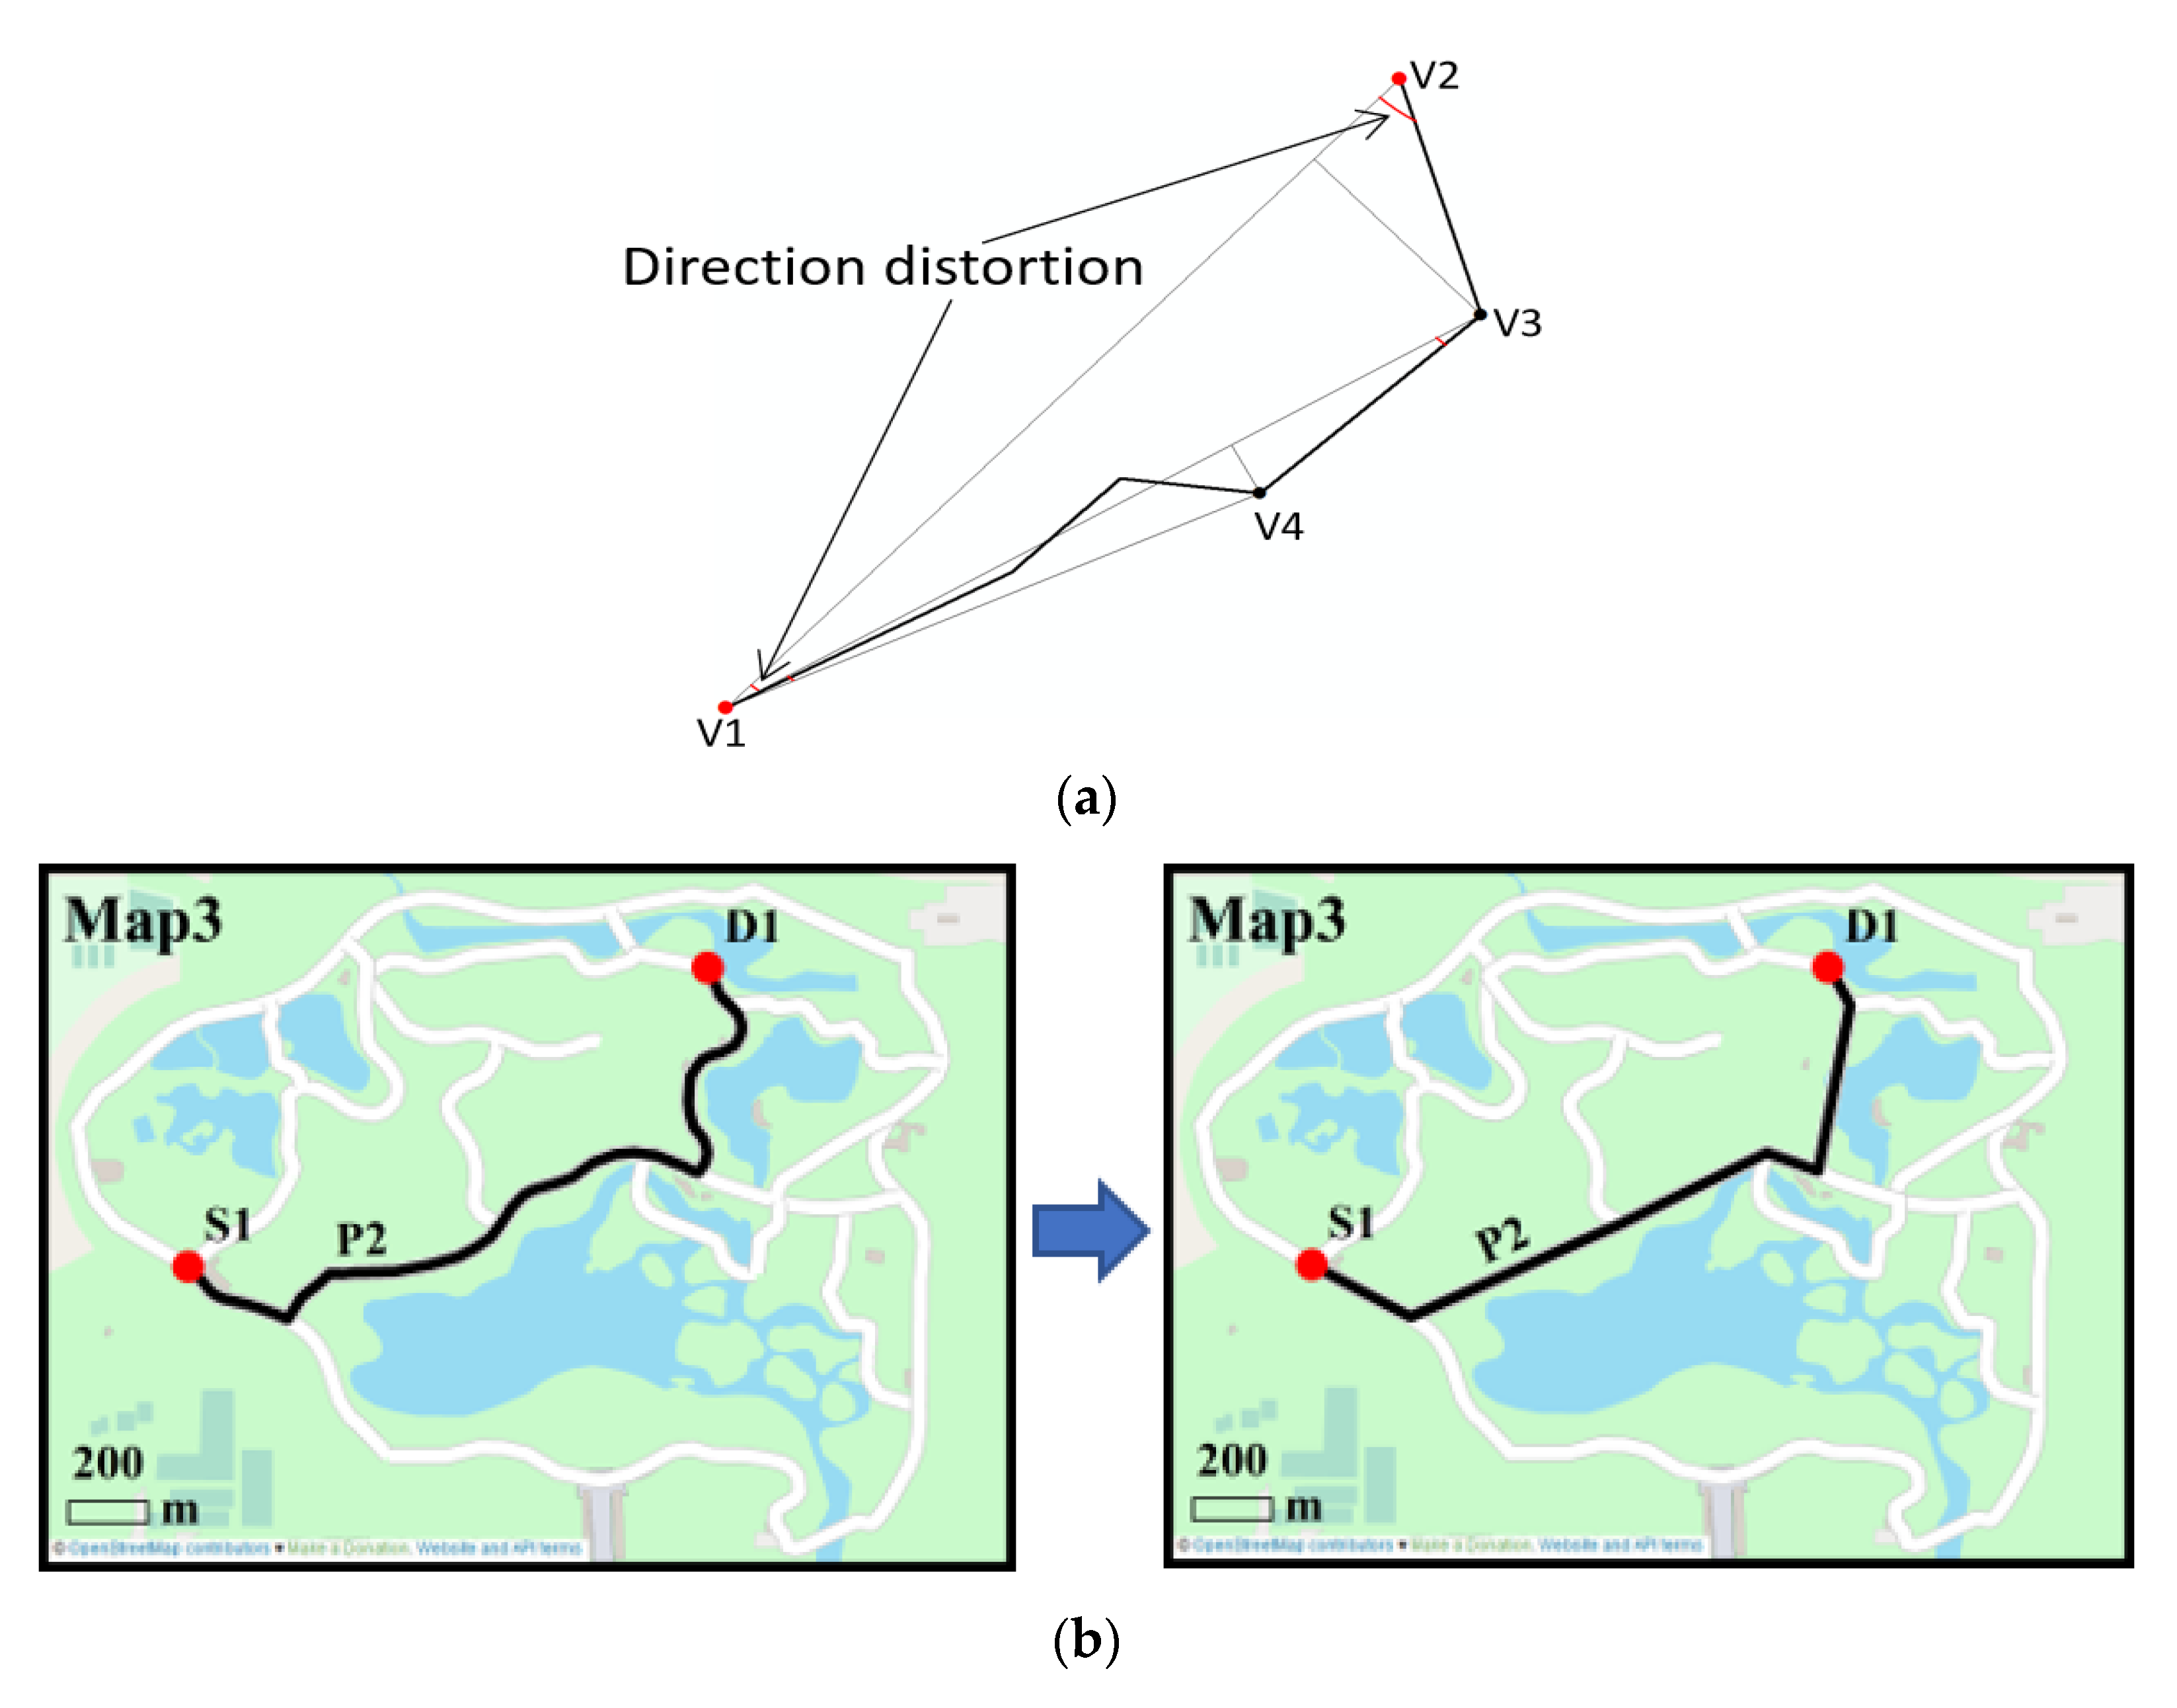
However, it is not easy to provide a reasonable threshold for the perpendicular distance used in the Douglas–Peucker algorithm. Li and Dong’s method [
49] follows the implementation process of the Douglas–Peucker algorithm and adopts direction distortion (see
Figure 1a) instead of perpendicular distance as the criterion to split a road line; hence, it was used in this study. Furthermore, a 45° turning angle is generally regarded as a road turn [
50] and thus can be used as the threshold of direction distortion for the simplification of a segment. In this study, we manually simplified the recommended routes following the implementation process of the Douglas–Peucker algorithm and Li and Dong’s method. The route distance and angle of direction distortion were measured using coordinated geometry editing tools in ArcMap.
Figure 1b shows one example of a route’s shape simplification.
3.3. Experimental Data
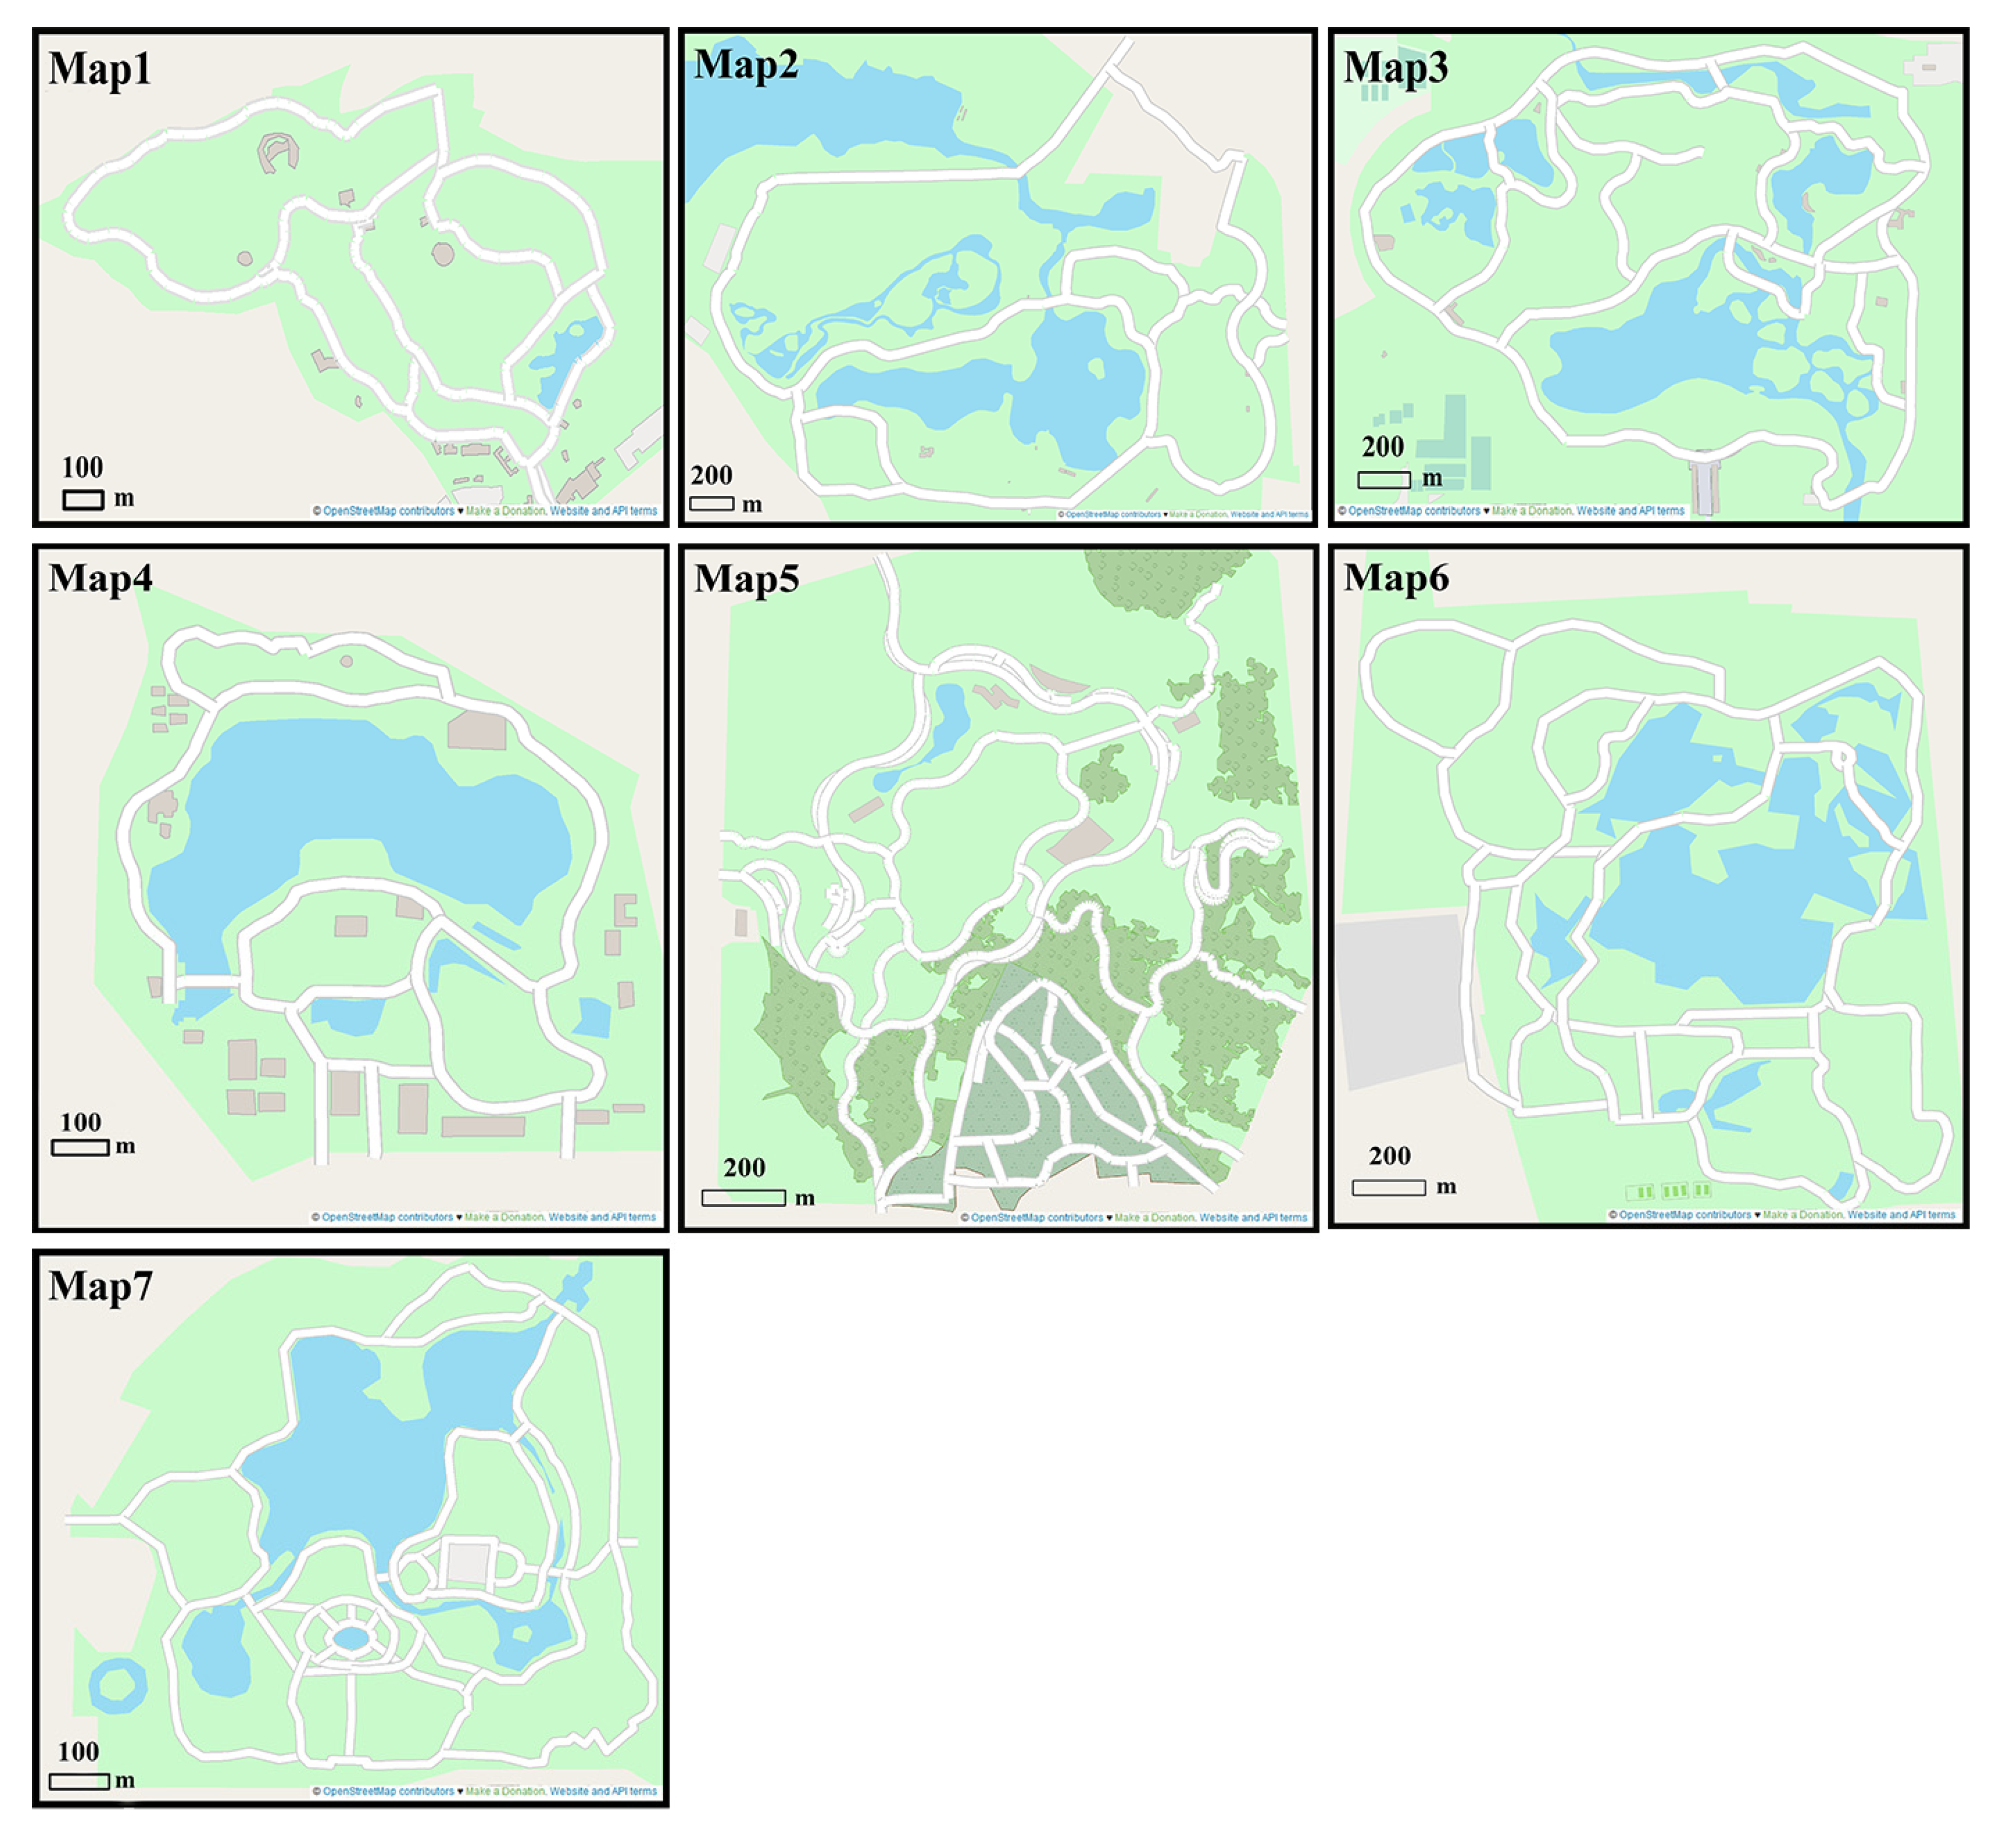
This study investigates the associations of route shape simplification with pedestrians’ route choice, considering various geometric characteristics of routes. Seven road maps (shown in
Figure 2) showing regions near parks and public areas in Chengdu City, China, and with sizes of approximately 2.5 km × 3 km, which are appropriate for walking, were selected as baseline maps. Further, maps containing dense and sparse road networks likely contain similar and distinctive geometric characteristics. This facilitates the evaluation of the influence of route shape simplification on route choice behavior under different geometric characteristics. All maps used in the experiment were sourced from OpenStreetMap (
https://www.openstreetmap.org, accessed on 22 May 2022) and were vectorized using ArcMap software 10.8.
3.4. Procedure and Subjects
According to the criteria for selecting the starting and destination points in
Section 3.1, three pairs of different starting (S
n) and destination (D
n) points on each baseline map were selected, thereby generating a total of 21 baseline maps. A route choice experiment using the 21 baseline maps was conducted. Based on the route choice results for the baseline maps and the selection criteria for the recommended routes in
Section 3.1, some routes were considered as routes to be recommended. The shapes of the recommended routes were simplified using the simplification methods discussed in
Section 3.2 to generate modified maps. A route choice experiment using the modified maps was then conducted. According to the route choice results for the baseline maps and the modified maps, a Chi-square test and partial correlation analysis were conducted using the Statistical Product and Service Solutions software (version 26); this was to study the associations of the influence of route shape simplification on pedestrians’ route choice with multiple geometric characteristics, including relative distance, initial orientation, number of intersections, and direction changes.
In total, 120 participants (65 men and 55 women) from different academic backgrounds (cartography, environmental science, accounting, and architecture) and of ages (20–50 years old) participated in the experiments. The participants were divided equally into two groups. The first group participated in the route choice experiment using the baseline maps, whereas the second group participated in the route choice experiment using the modified maps with simplified recommended routes. In the experiments, a booklet of the maps in a random order was delivered to each participant. In the booklet, the printed map had the same width as an A4 sheet and the length–width ratio of the map was maintained. An example of the experiment map in the A4 format has been added to the
Figure S1. The participants were asked to choose a route suitable for walking from a specified starting point to the destination point and mark their chosen route on the maps. All experiments were conducted during the daytime in a laboratory (which was brightly lit), and silence was maintained throughout the experiment.
4. Results
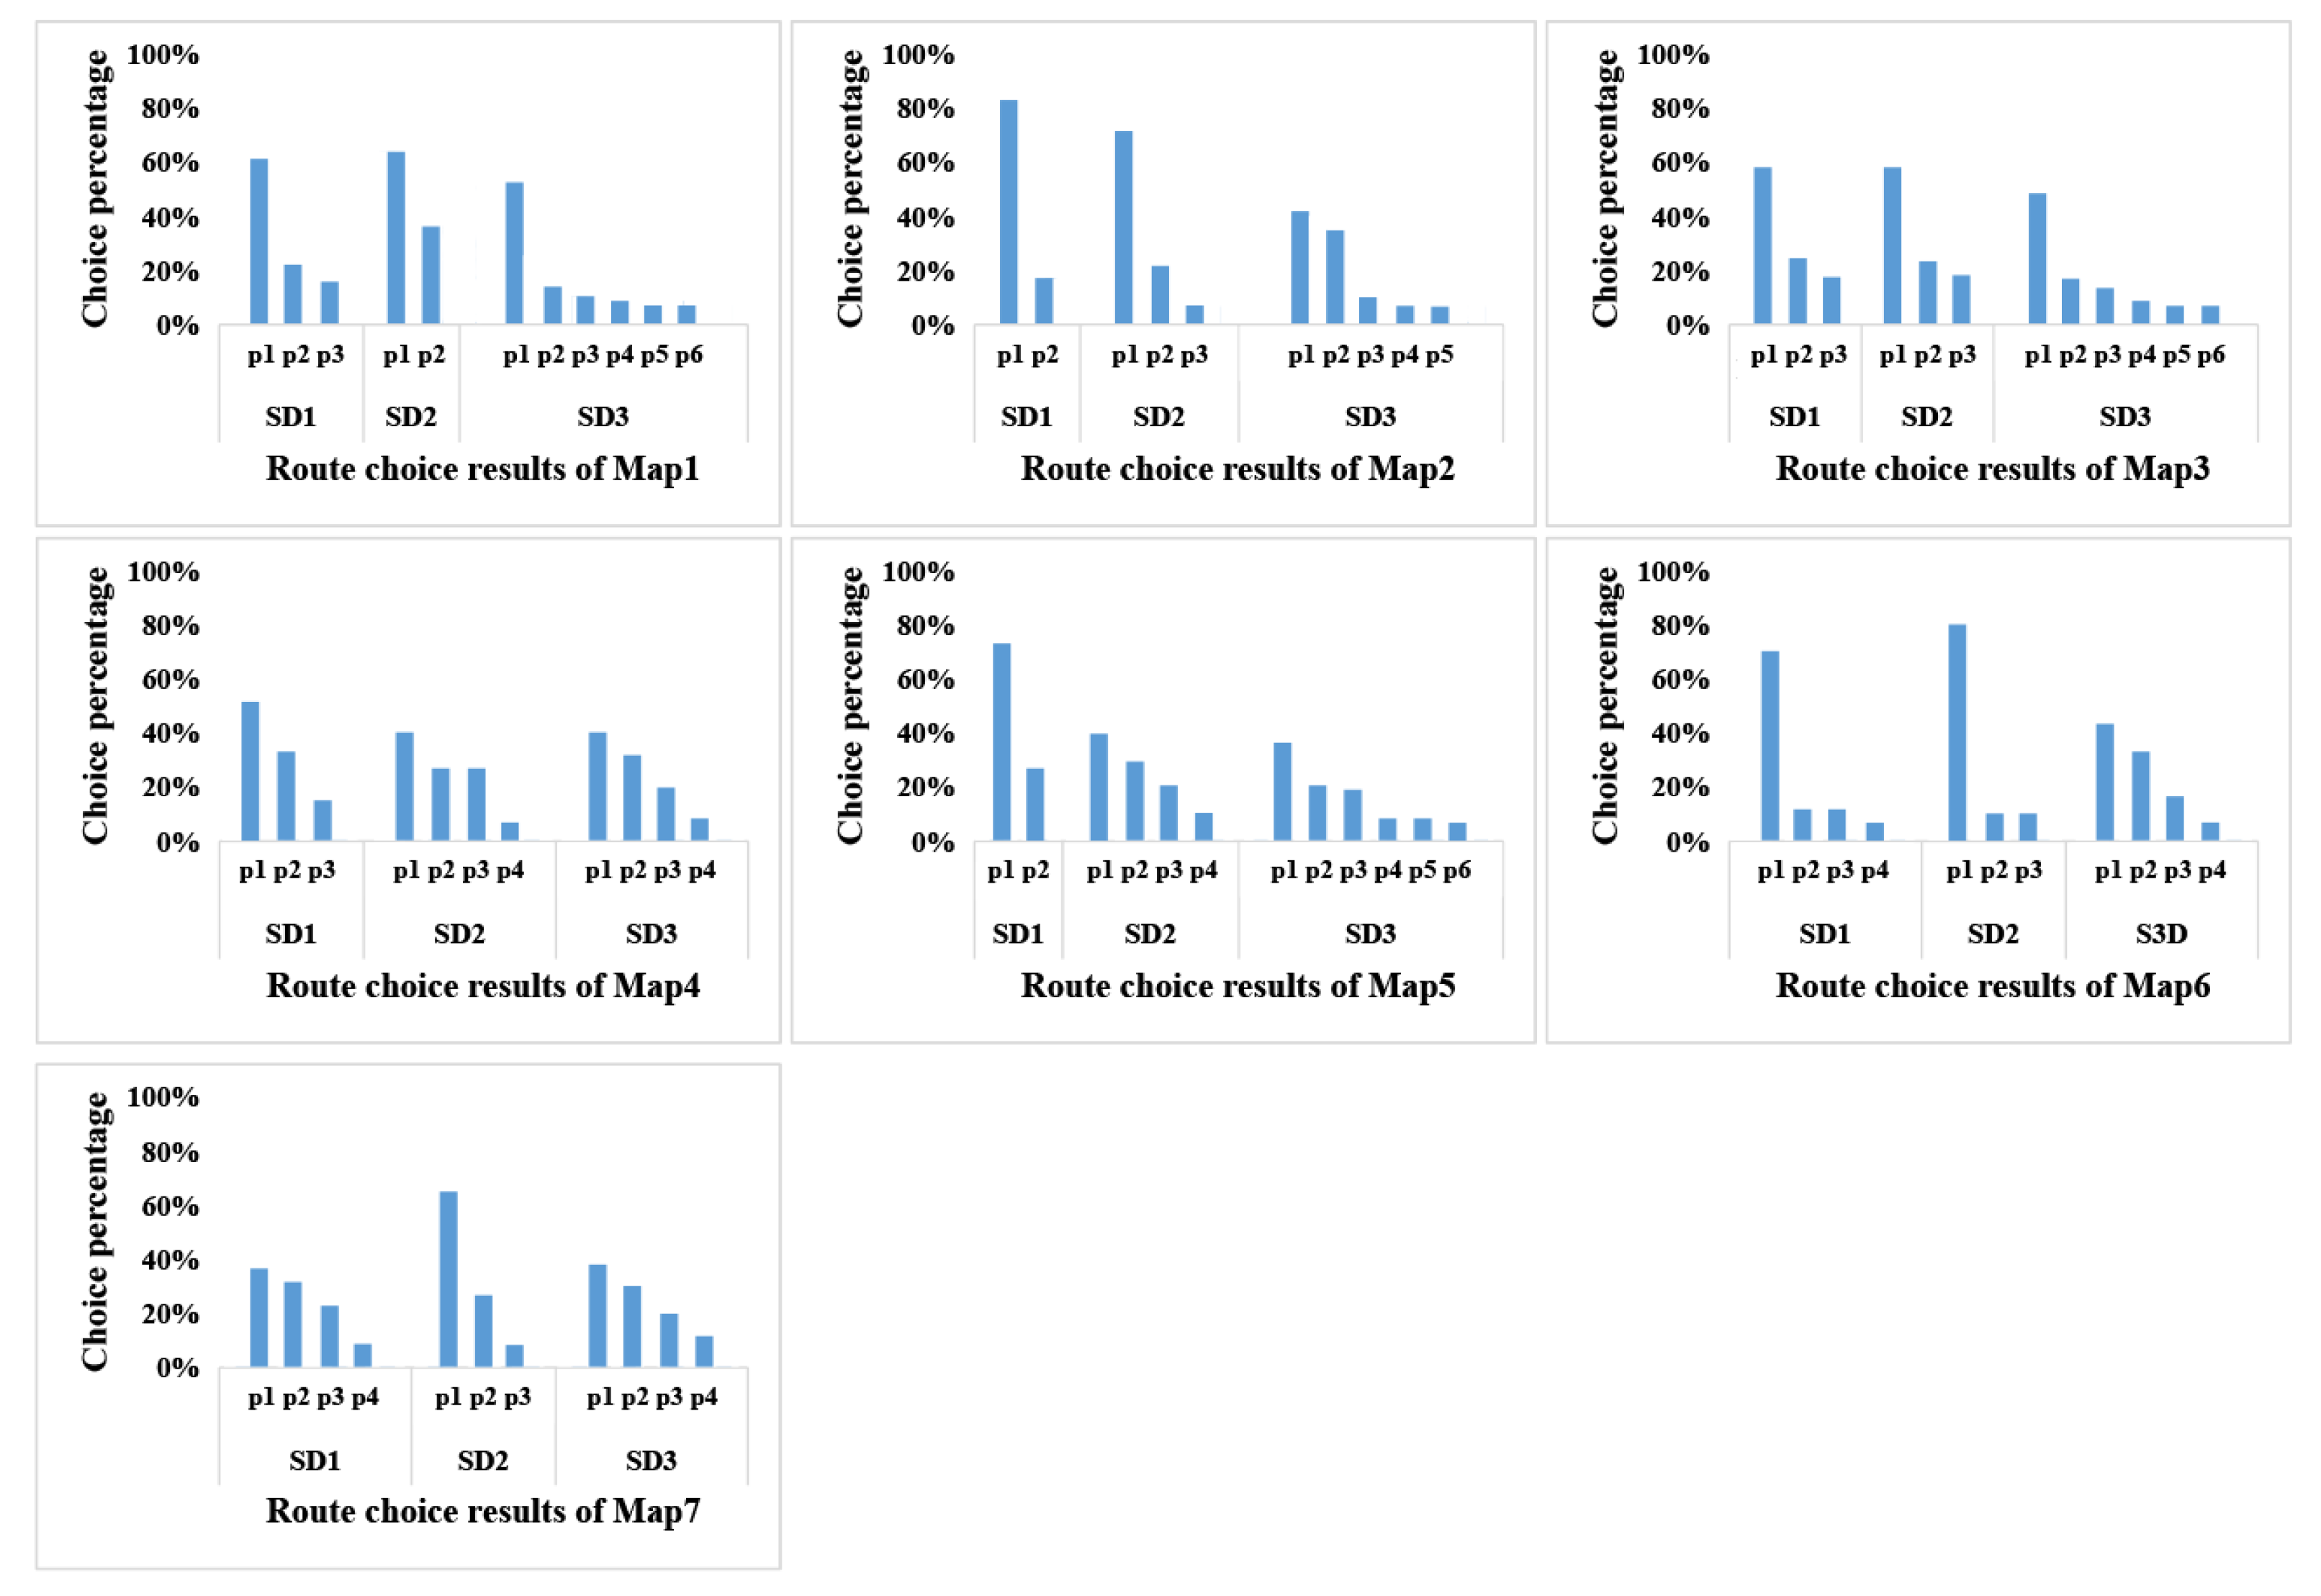
4.1. Route Choice Using Baseline Maps
In the route choice experiments using the baseline road maps, three pairs of starting and destination points were selected and there were several routes with different geometric characteristics between both points. The baseline maps with starting (Sn) and destination (Dn) points are shown in the
Figure S2. The route choice results for the baseline maps are shown in
Figure 3, and all routes chosen by the participants on the seven baseline maps and their geometric information are shown in the
Figure S3 and Table S1. In
Figure 3, the routes P1 with the highest choice percentages are selected as the baseline routes, while the other routes are candidates for recommended routes.
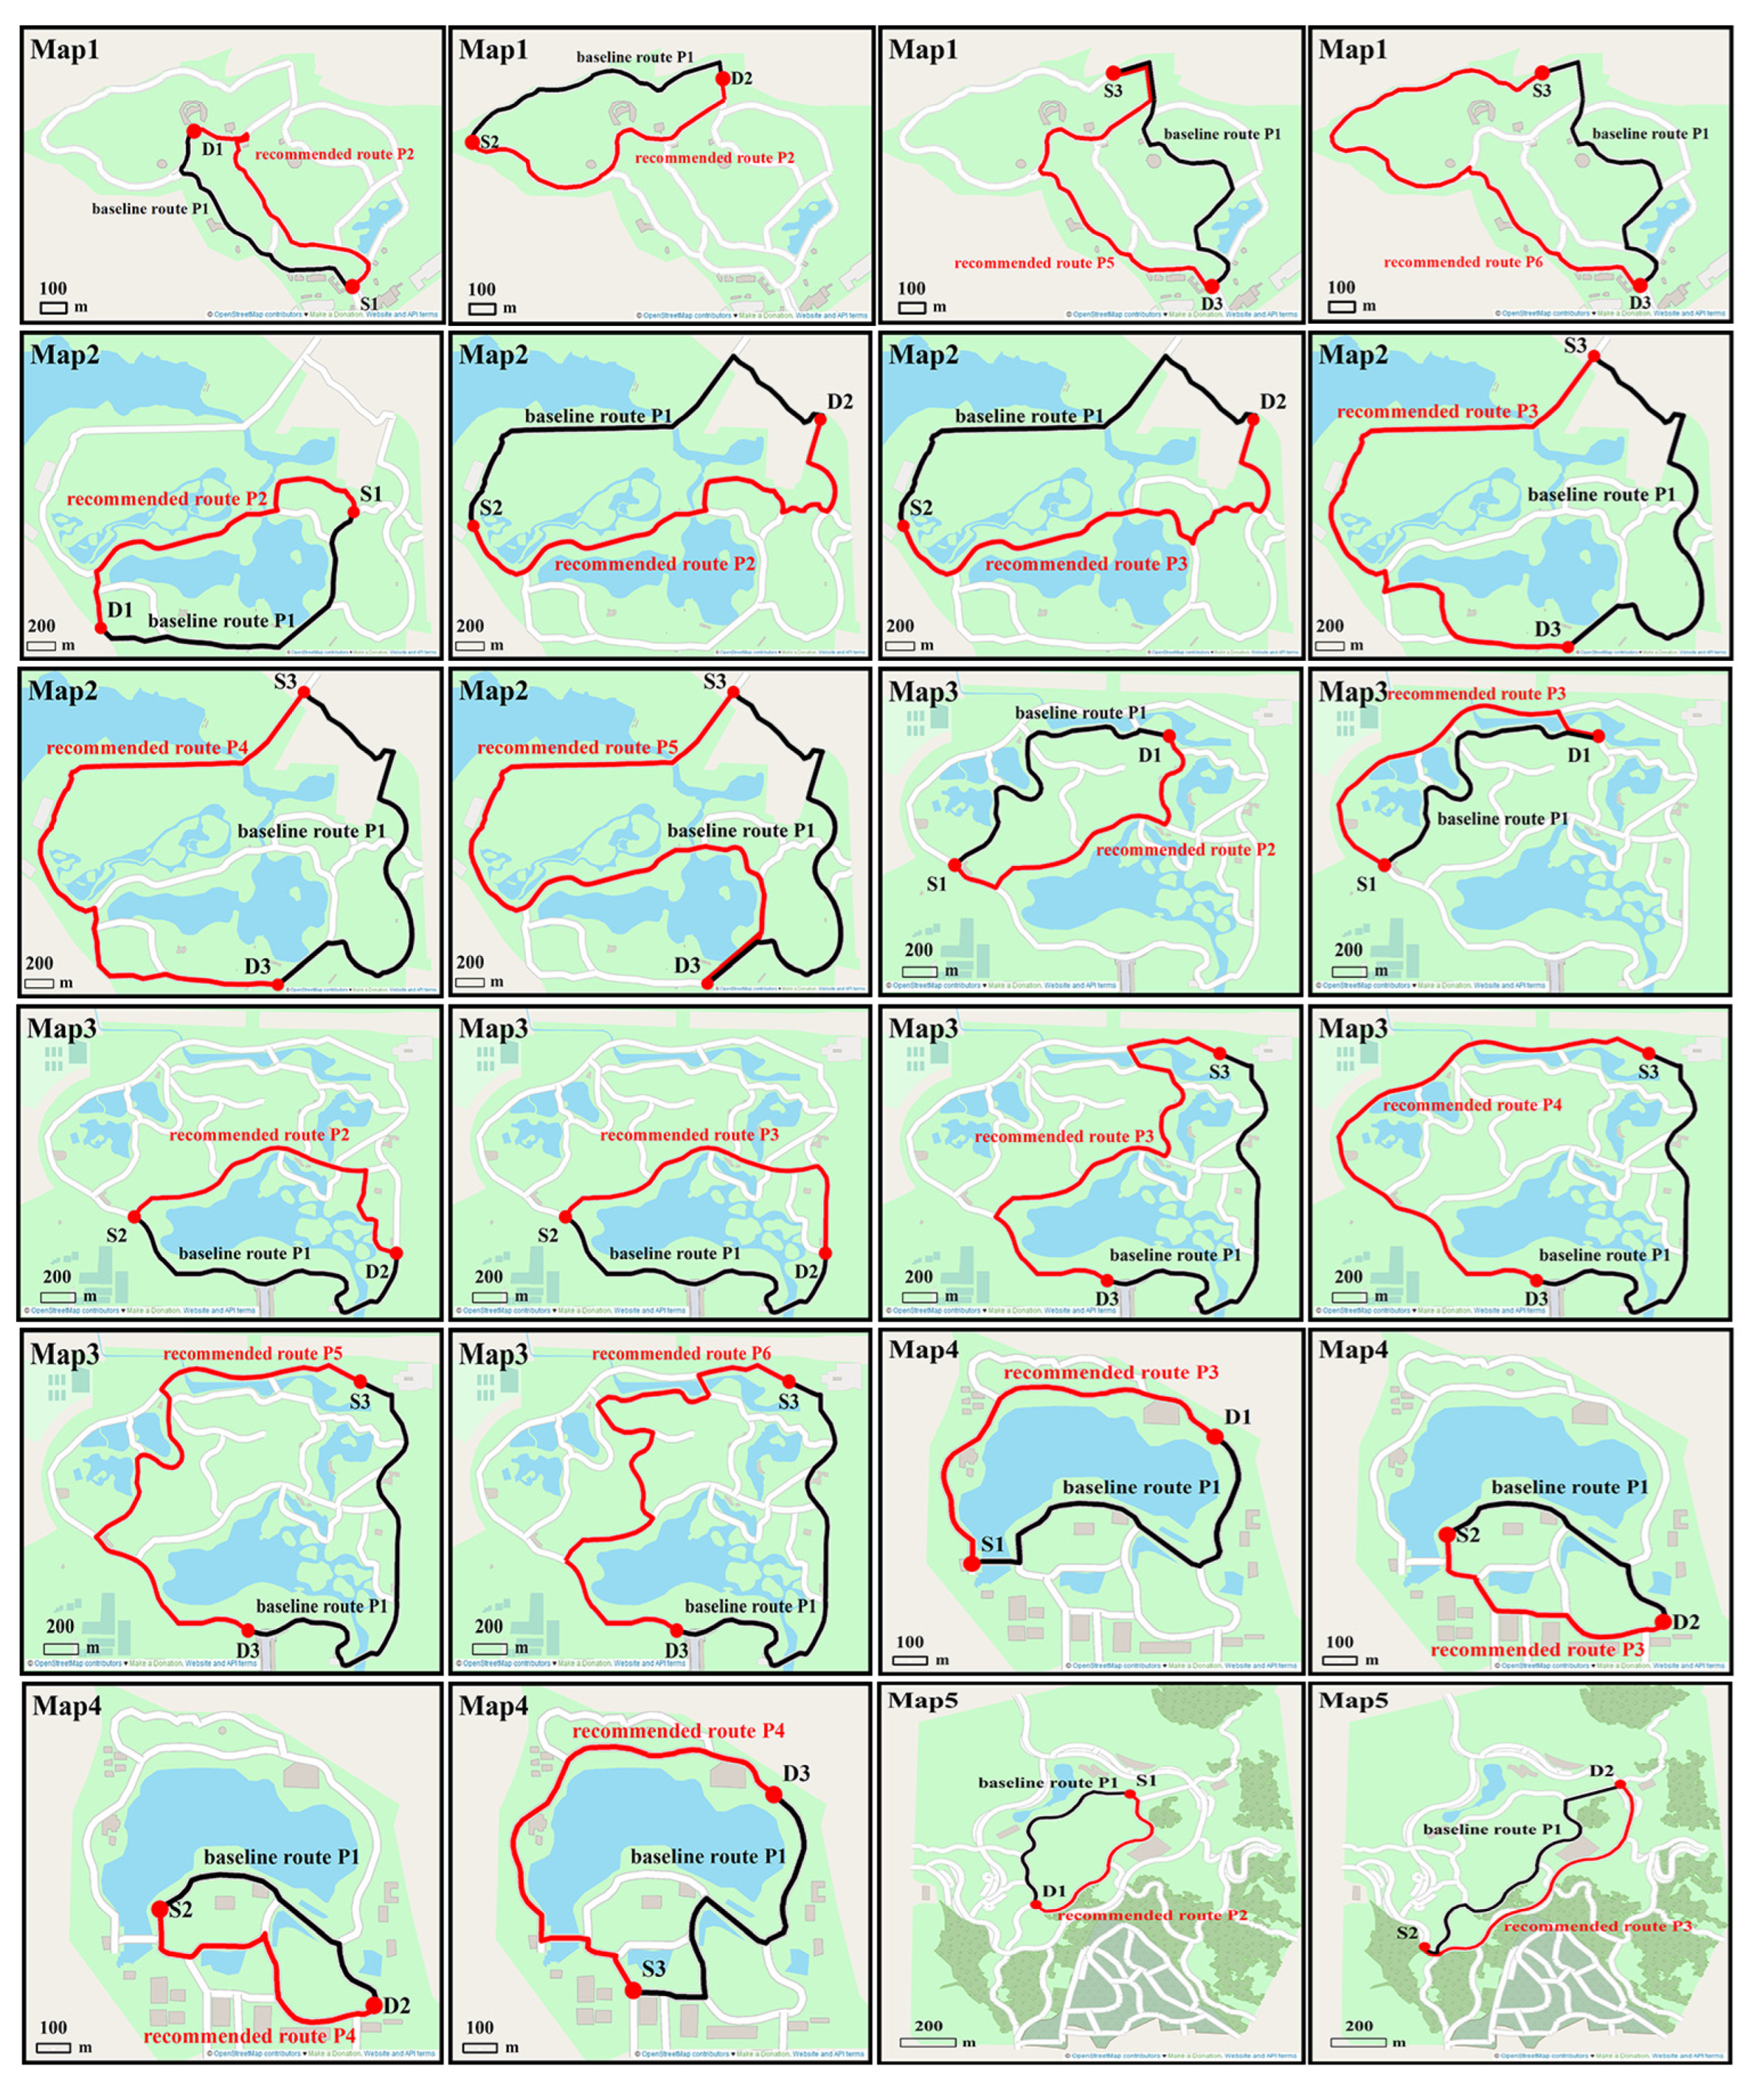
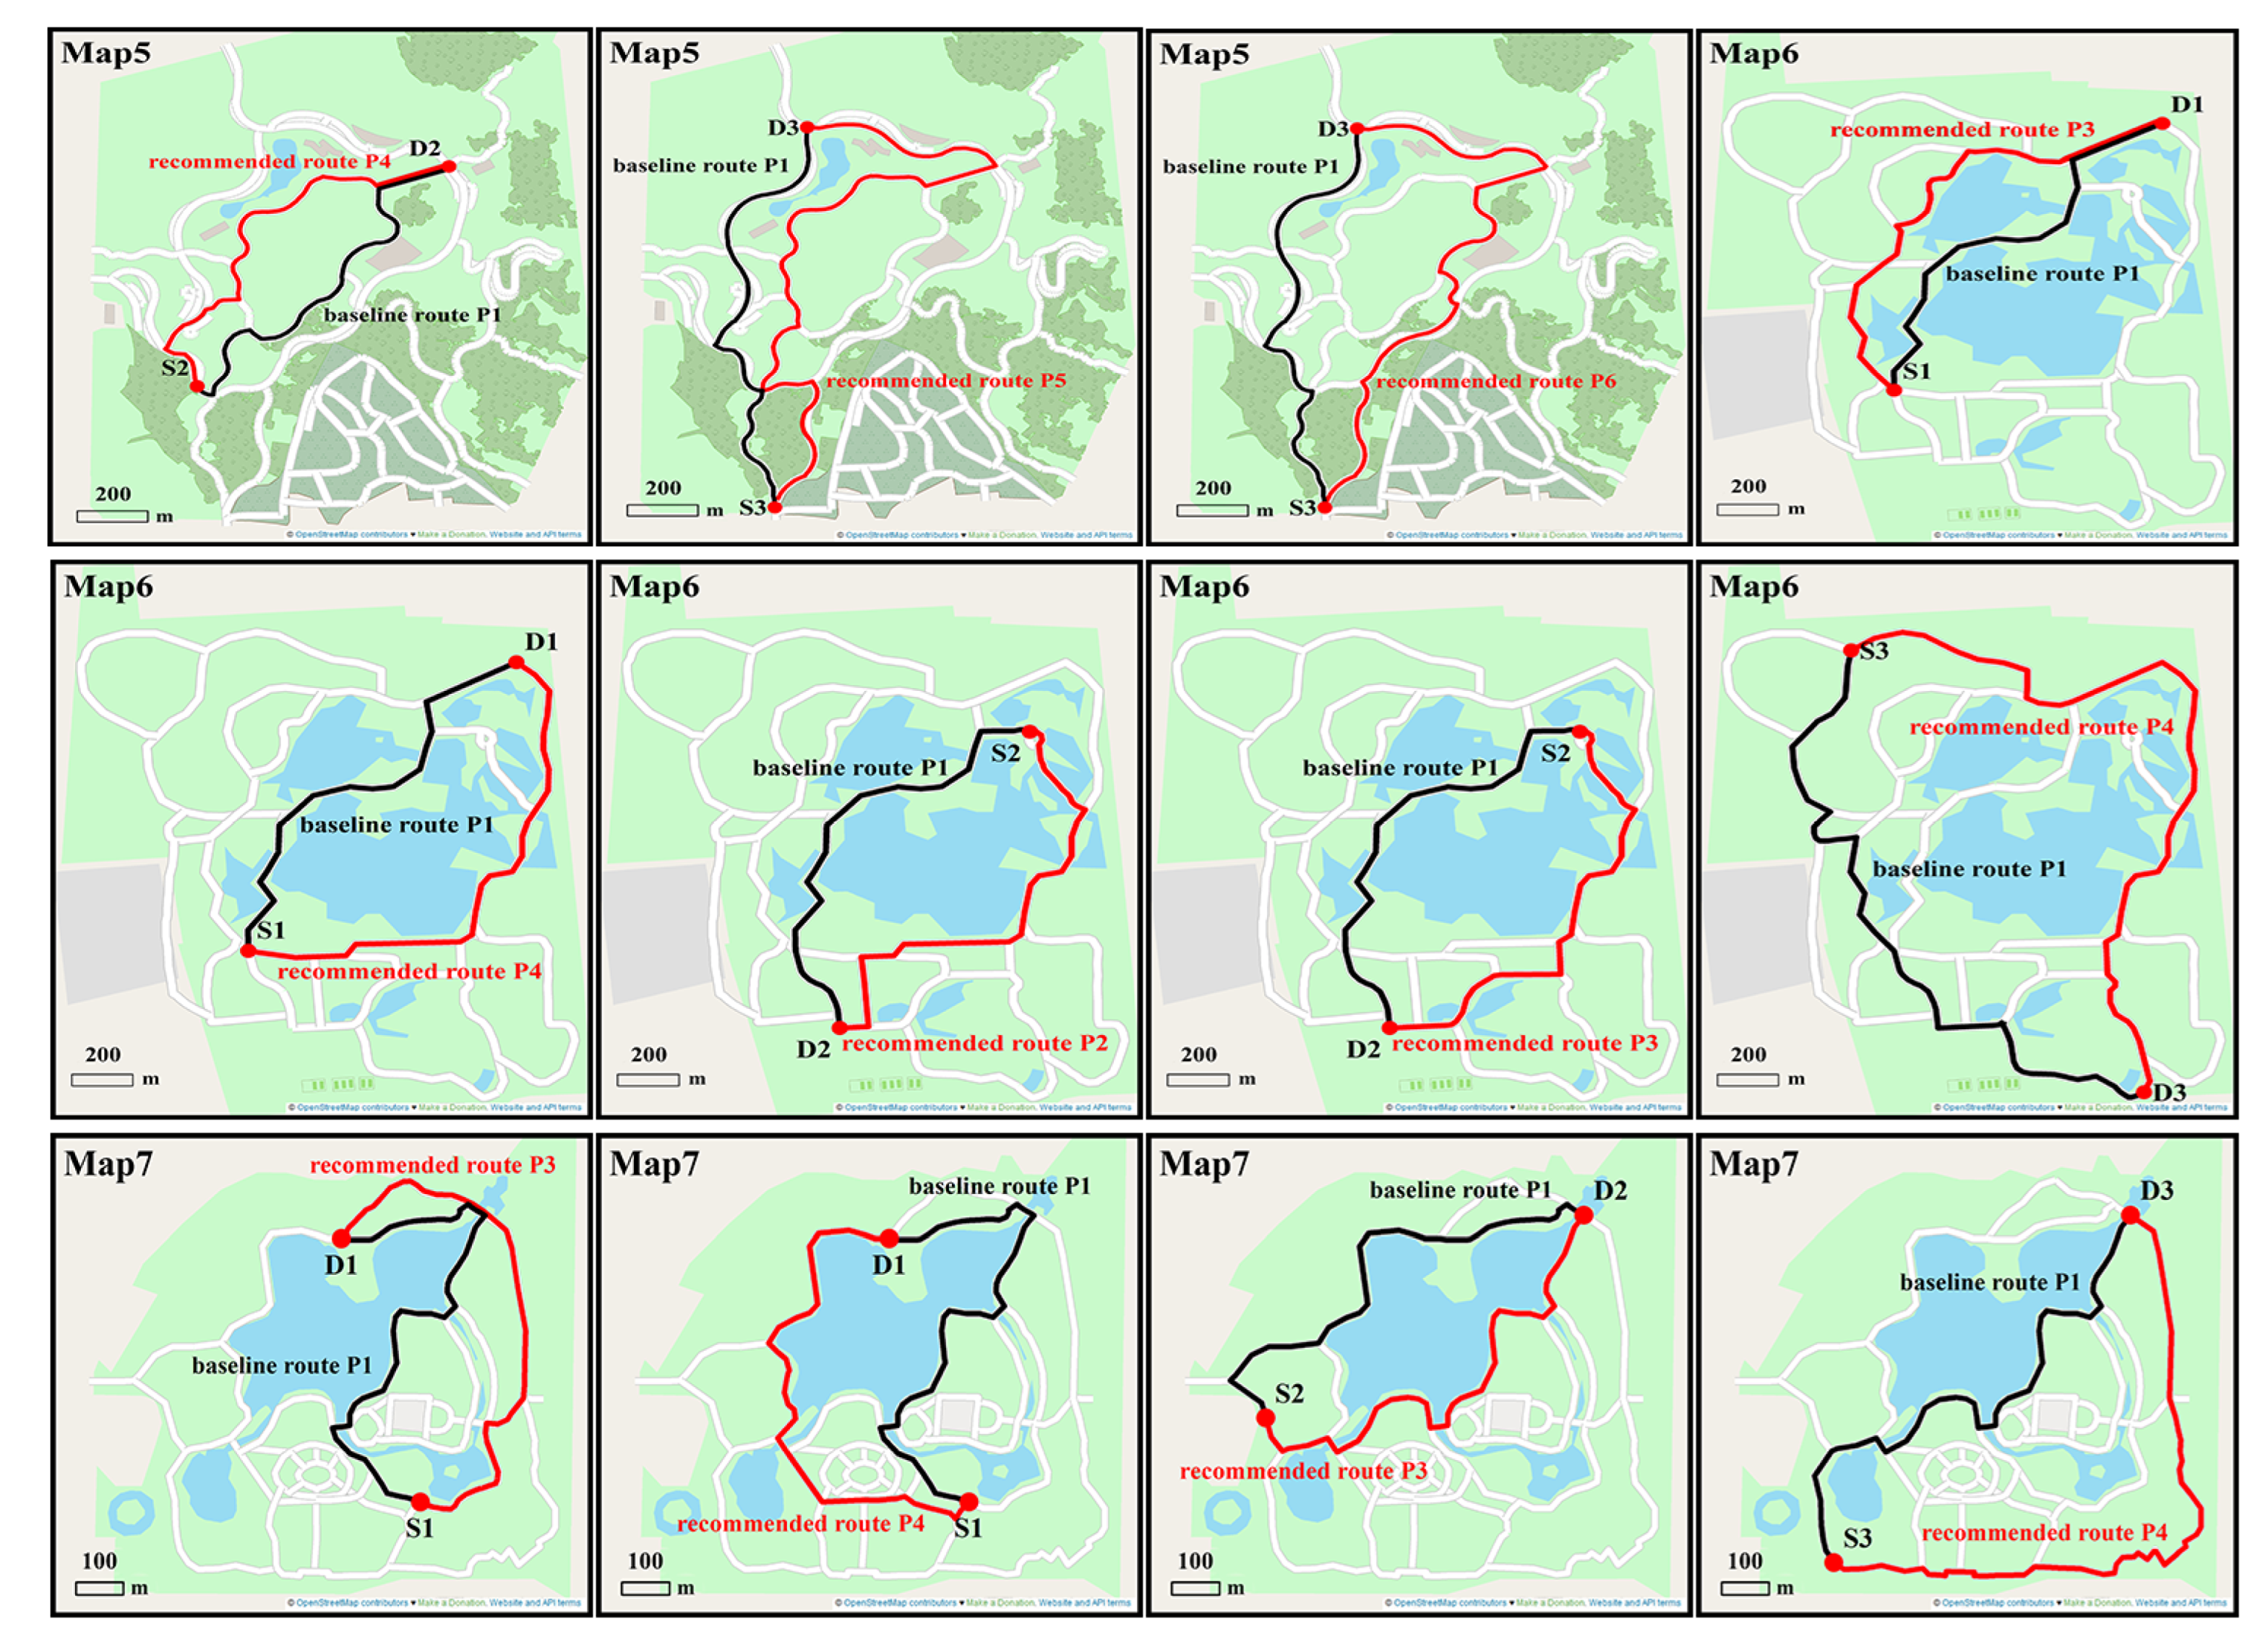
Base on the route choice results for the baseline maps and the selection criteria for the recommended routes mentioned in
Section 3.1, 36 routes were selected as the recommended routes, from a pool of 57 less-chosen routes. In
Figure 4, 36 recommended routes and their corresponding baseline routes were depicted by red lines and black lines, and the starting (Sn) and destination (Dn) points were depicted by red solid circles.
4.2. Route Choice Using Modified Maps
This section outlines the route choice experiments using the modified road maps with simplified recommended routes. These recommended routes (see
Figure 4) were simplified using Li and Dong’s [
49] method, with a threshold of 45° direction distortion, as mentioned in
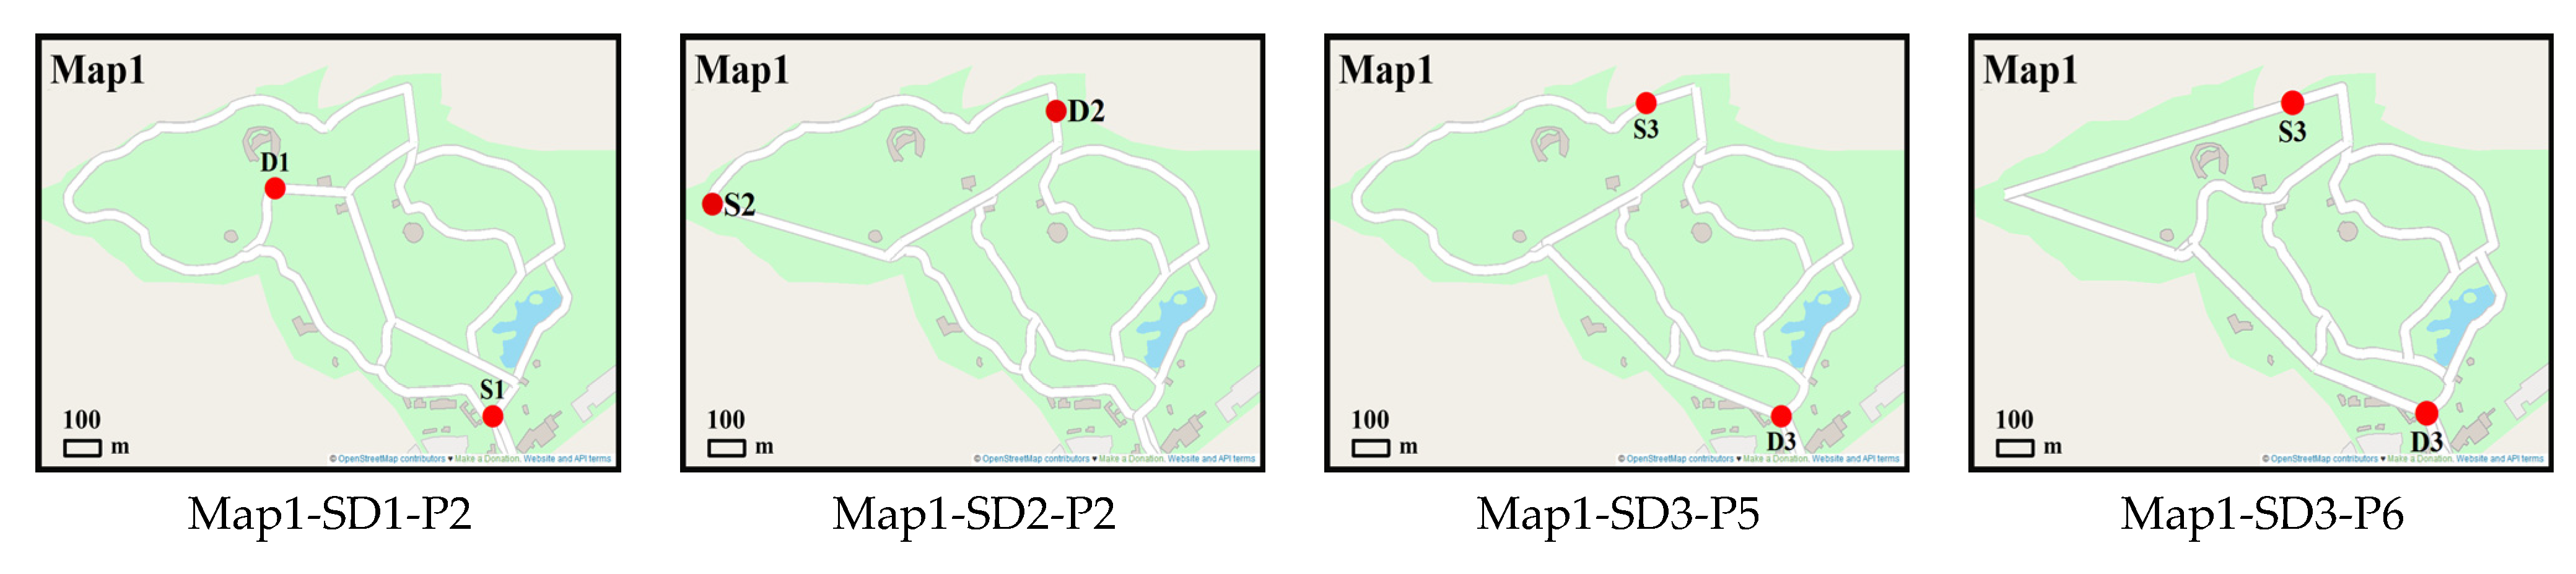
Section 3.2. Subsequently, 36 modified maps illustrating these recommended routes after shape simplification were generated.
Figure 5 shows four examples of the modified maps; the remaining modified maps are shown in the
Figure S4.
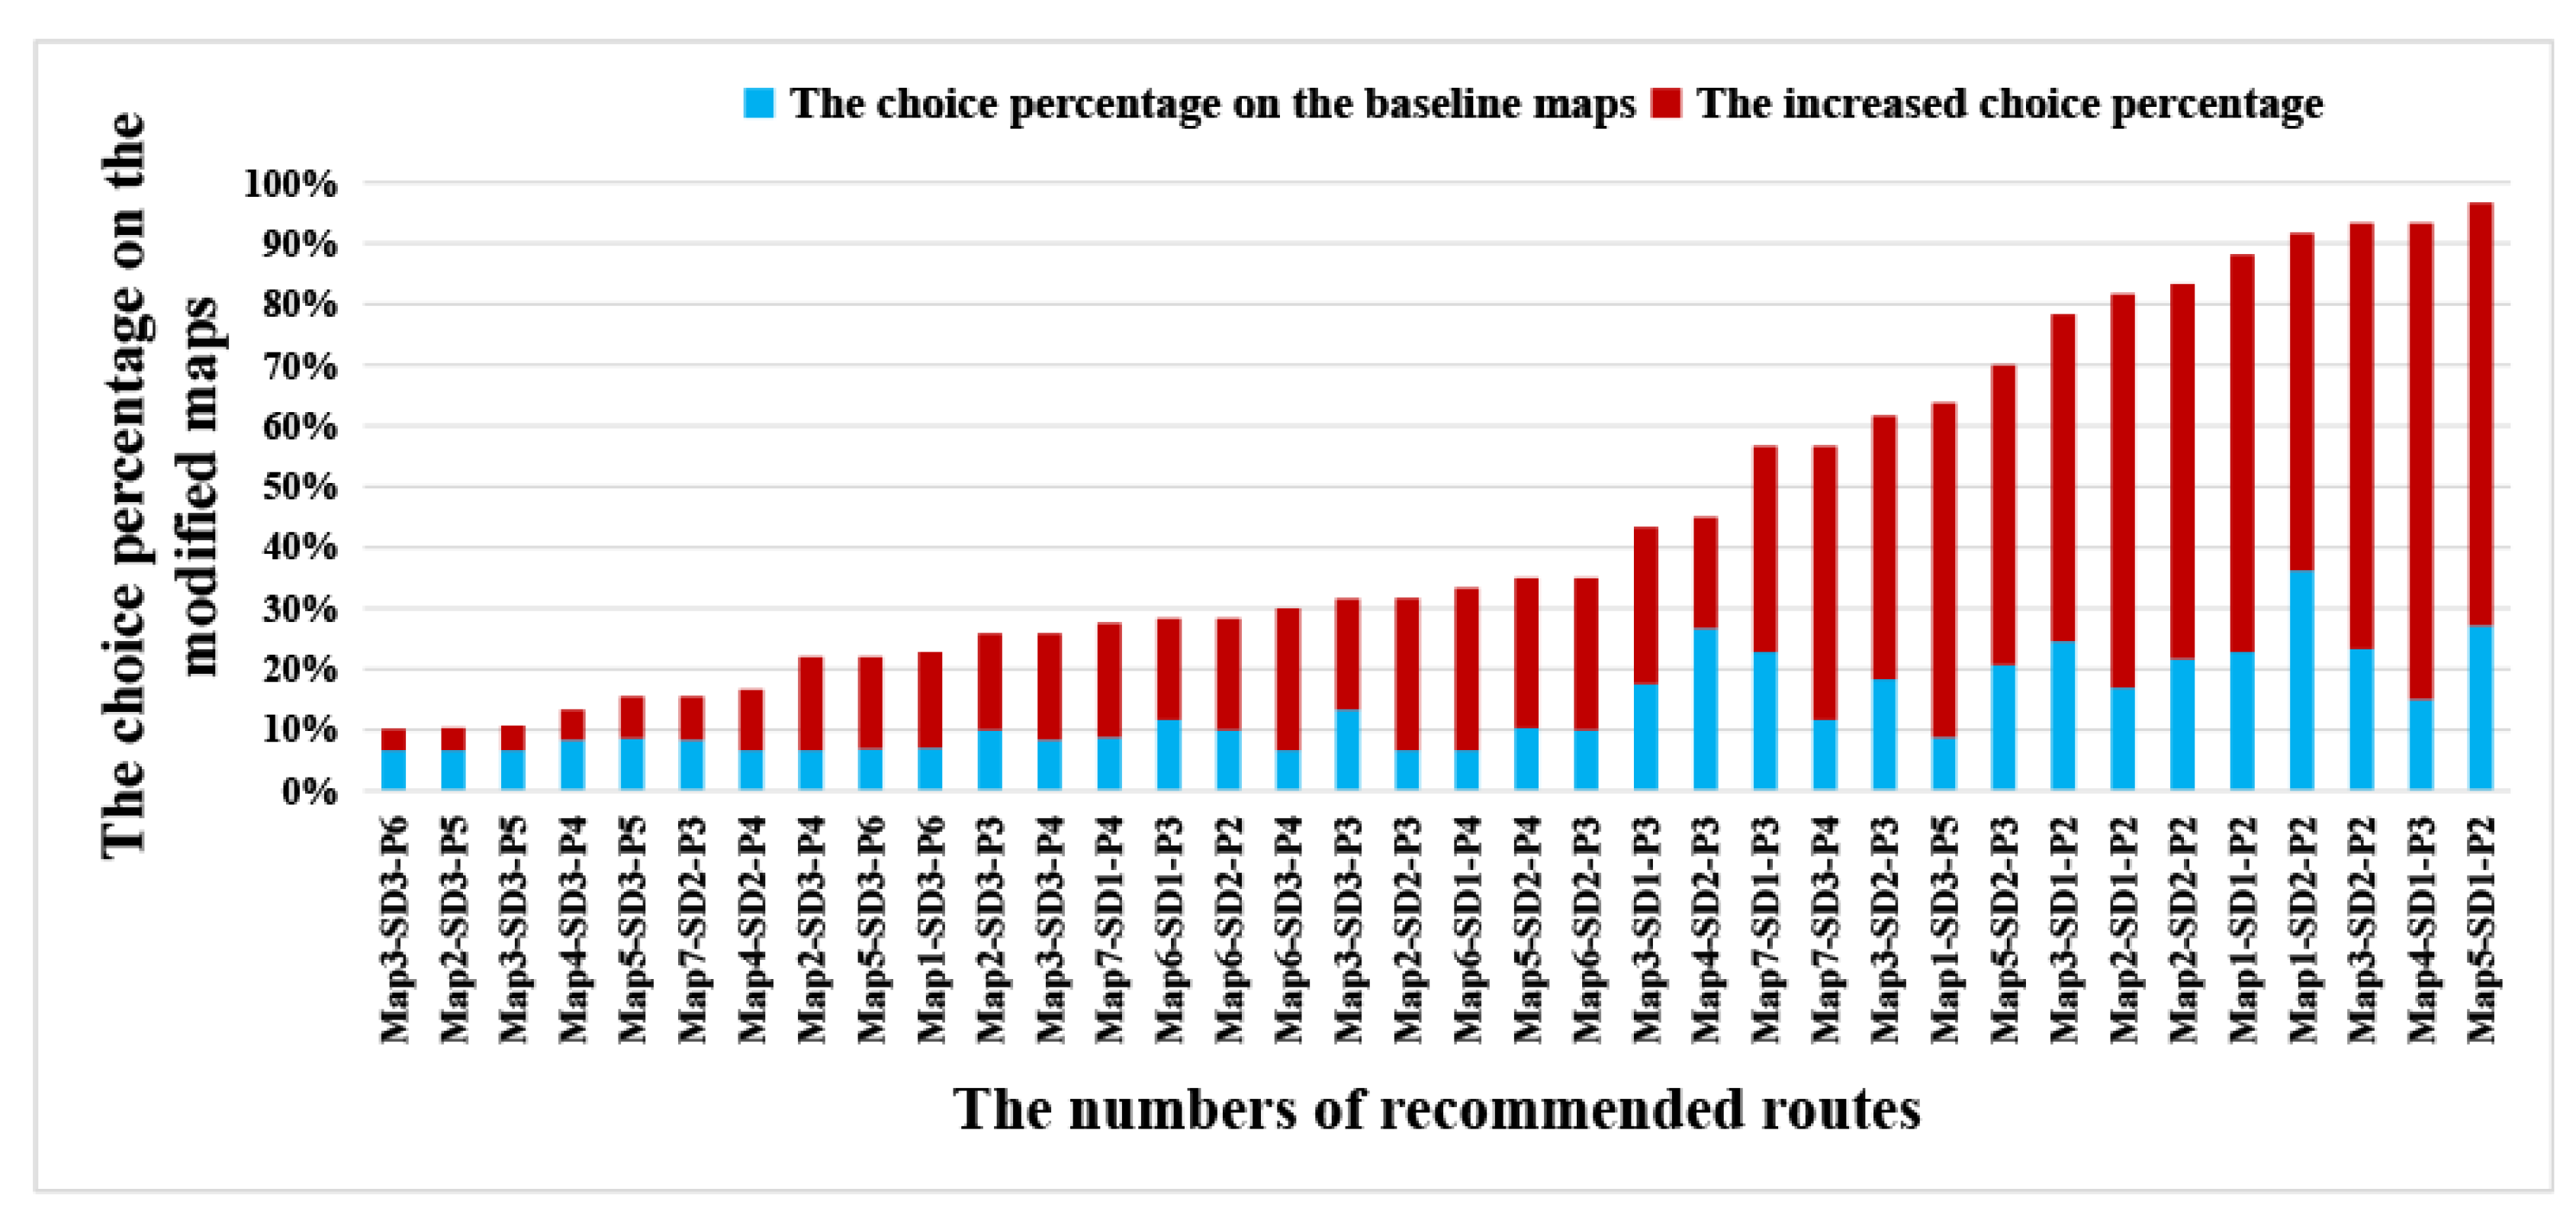
The results of the recommended route choices on the modified maps are shown in
Figure 6. In
Figure 6, the column height represents the choice percentage of the recommended routes on the modified map while the blue segment of each column represents the choice percentage of the recommended routes on the baseline map. The choice percentages of the recommended routes range from 10% to 97% (see
Figure 6), and the mean value is 44% (
variance = 0.08). Among them, 15 recommended routes on the modified maps have the highest choice percentages, compared with the non-recommended routes. The mean value of the choice percentage increase of 36 recommended routes is 31% (
variance = 0.05), and the choice percentage increase of 23 recommended routes is lower than 31% (see
Figure 6).
5. Significance Analysis
To further evaluate whether the influence effects were significant for the 36 modified maps, a Chi-square test was conducted and the results are shown in
Table 1. In a Chi-square test, a larger χ
2 value indicates stronger influence effects due to specific factors [
51,
52]. In this study, a larger χ
2 value represents higher influence degrees of route shape simplification in terms of changing the results of the route choice between the baseline and modified maps.
p value is the significance statistic value of the Chi-Square test, and the significance level α was 0.05 in this study. According to the results, there are significant differences for 29 modified maps (
p < 0.05) and no significant differences for seven modified maps (
p > 0.05), which are highlighted using bold font.
The route choices and results of the Chi-square test showed that shape simplification can significantly increase the choice percentage of most of the recommended routes, while having a weak influence on other recommended routes. As mentioned in
Section 1, in addition to route shape, other characteristics including initial orientation, number of intersections, relative distance, and direction changes may influence pedestrians’ route choice. As shown in
Table 2, the seven recommended routes with no significant increase in the choice percentage have larger differences in one or more geometric characteristics compared with their corresponding baseline routes. Hence, it is necessary to analyze the associations of these characteristics on the influence of route shape simplification on route choice behavior.
6. Correlation Analysis between the Influence Effects of Route Shape Simplification and Other Geometric Characteristics
This section aims to confirm whether there are correlations between the influence effects of route shape simplification and routes’ geometric characteristics. Partial correlation analysis is widely used to study the relationship between two variables while excluding the influences of other variables; accordingly, it was used in this study [
53,
54]. Pearson’s correlation coefficient was used in this study, as it has been widely used to measure the strength of the linear correlation between two variables in a correlation analysis [
55]. In general, the degree of correlation is divided into three levels: low (when the absolute value of a correlation coefficient is <0.3), moderate (when the absolute value of a correlation coefficient is 0.3–0.5), and high (when the absolute value of a correlation coefficient is >0.5) [
56].
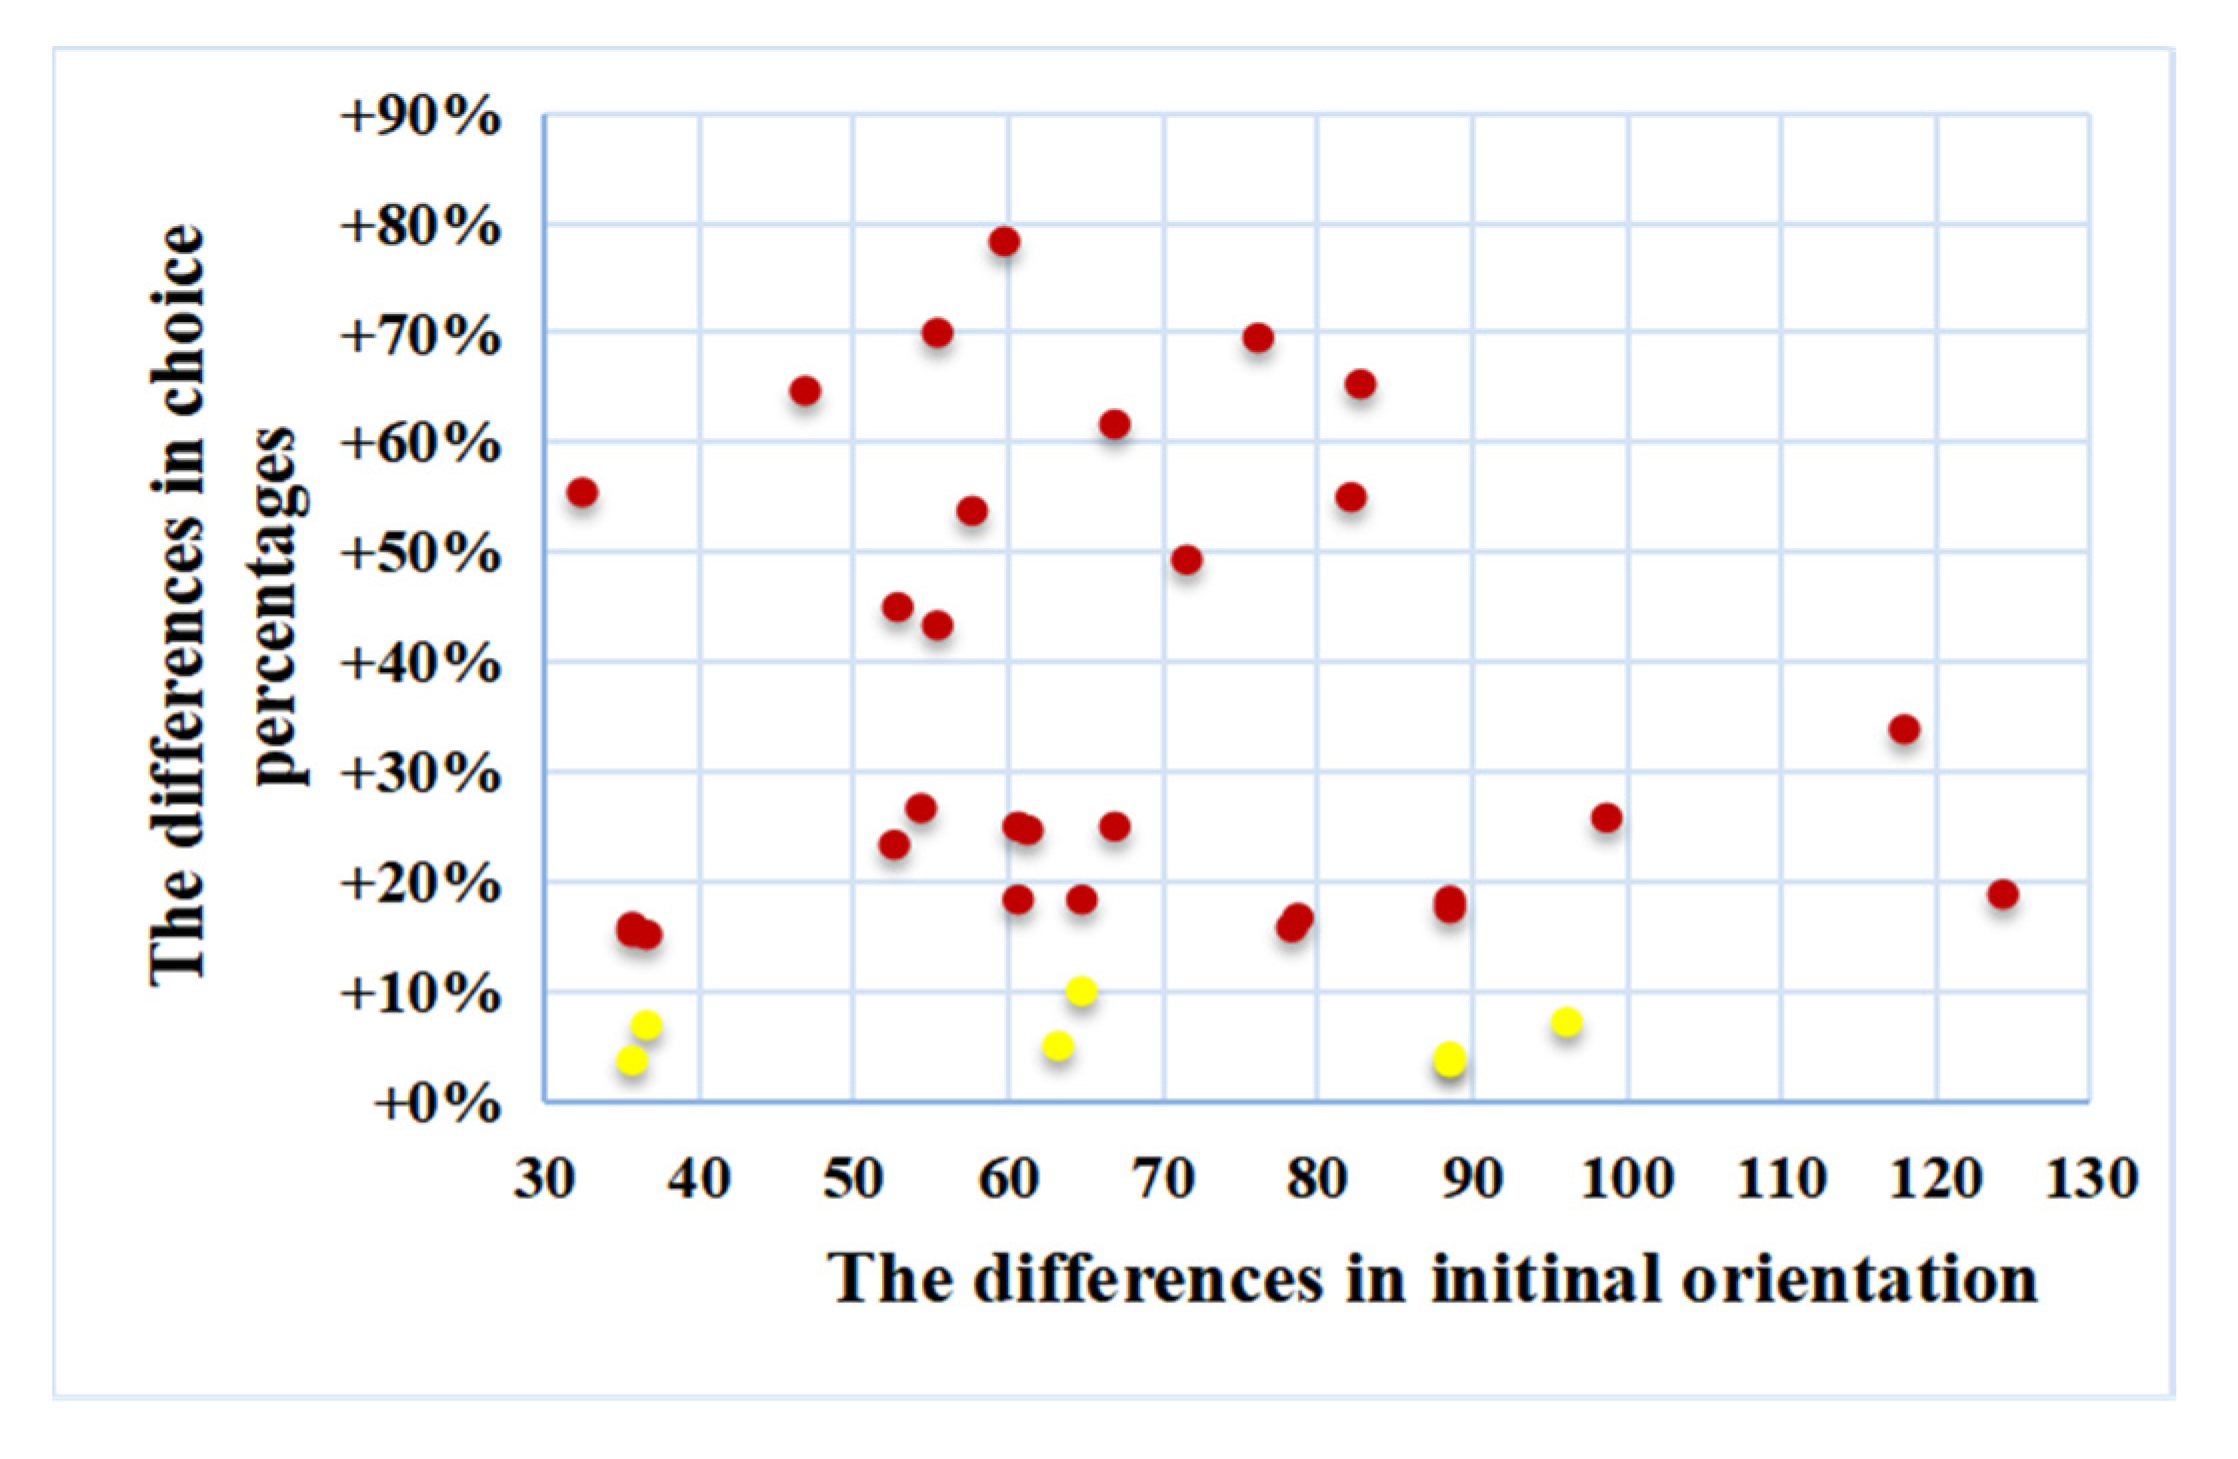
6.1. Correlation Analysis of Initial Orientation
In
Figure 7, the horizontal axis is the difference in initial orientation and the vertical axis is the difference in the choice percentages of the recommended routes. Meanwhile, the red and yellow points represent the recommended routes with and without significant increased choice percentages, respectively. For the results of the partial correlation analysis (Pearson’s correlation coefficient
r = −0.30, sample size
n = 36,
p = 0.09
> 0.05),
p value is the significance statistic value of the correlation coefficient [
55] and the significance level α was 0.05 in this study. The results show that there is no significant correlation between the difference in initial orientation and the differences in choice percentages, because the
p value is more than 0.05.
As the correlations in the scatter plots are not strongly linear, further analysis was conducted using Spearman’s rank correlation coefficient, which can be used to measure the strength of the correlation between two variables when the correlations seem non-linear [
57,
58]. According to the results (Spearman’s rank correlation coefficient
r = −0.06,
n = 36,
p = 0.74
> 0.05), it could be found that there is also no significant correlation because the
p value is more than 0.05. As both results of correlation analysis show there is no significant correlation, this suggests that the difference in initial orientation has a weak influence on route choice, following route shape simplification.
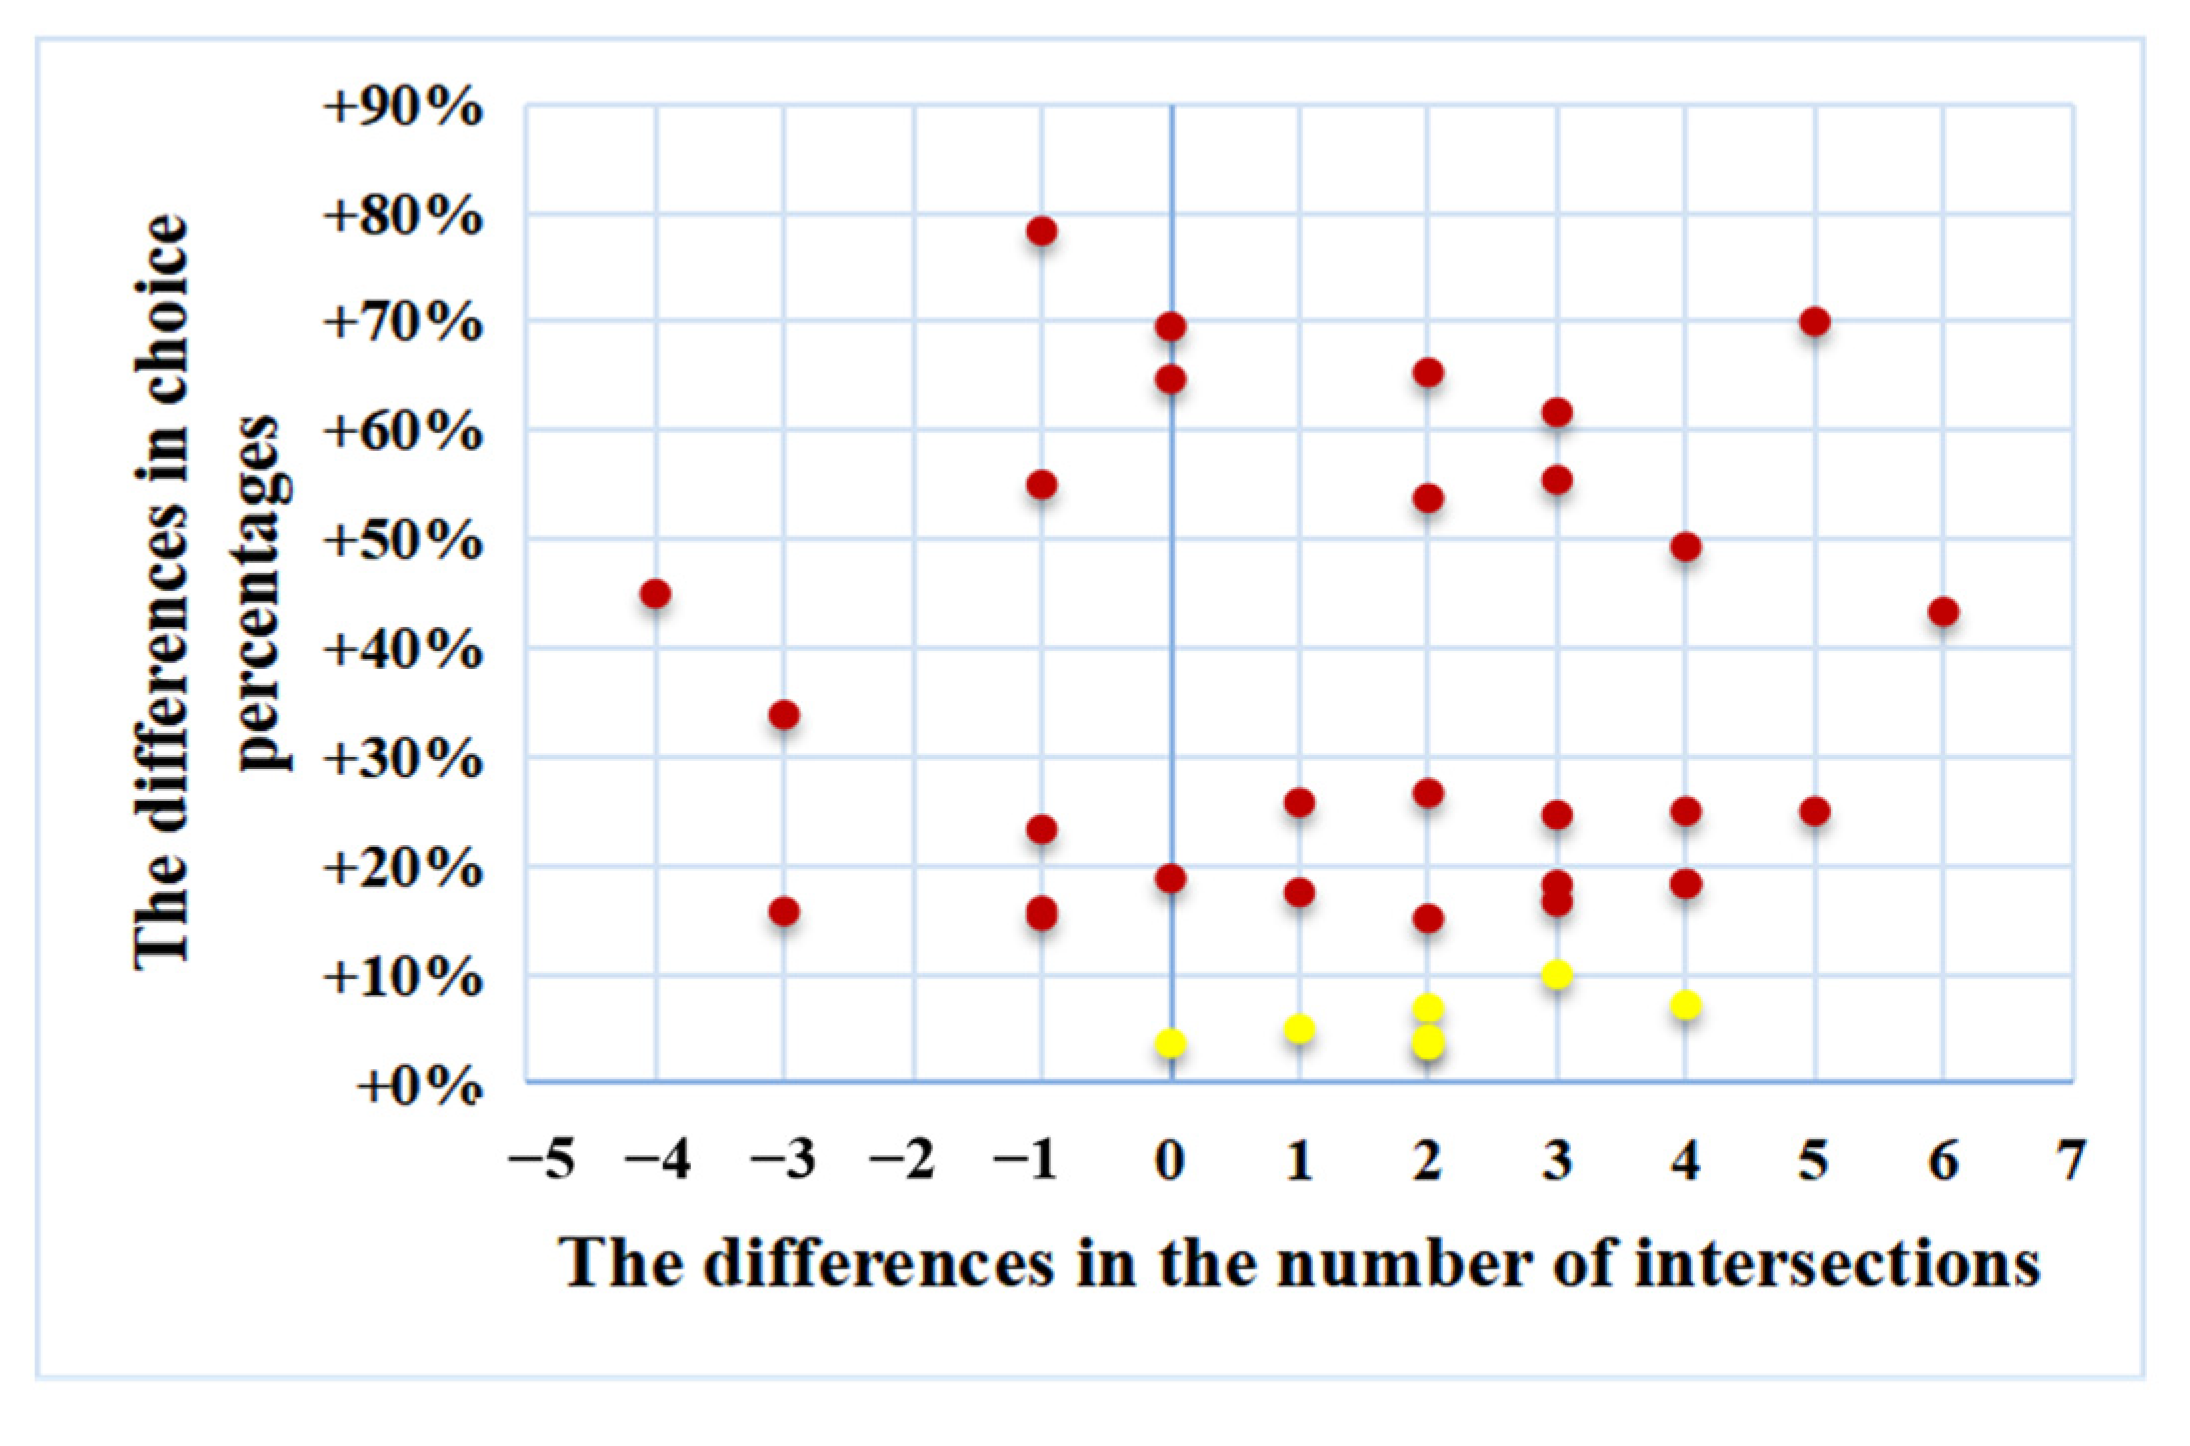
6.2. Correlation Analysis of The Number of Intersections
In
Figure 8, the horizontal axis is the difference in the number of intersections and the vertical axis represents the differences in the choice percentages of the recommended routes. Meanwhile, the red and yellow points represent the recommended routes with and without significant increased choice percentages, respectively. The results of the partial correlation analysis (Pearson’s correlation coefficient
r = −0.22,
n = 36,
p = 0.23
> 0.05; Spearman’s rank correlation coefficient
r = −0.02,
n = 36,
p = 0.90
> 0.05) showed that there is no significant correlation between the number of intersections and the differences in choice percentages, as the two
p values are more than 0.05. As both results of the correlation analysis show there is no significant correlation, this suggests that the difference in the number of intersections has a weak influence on route choice, following route shape simplification.
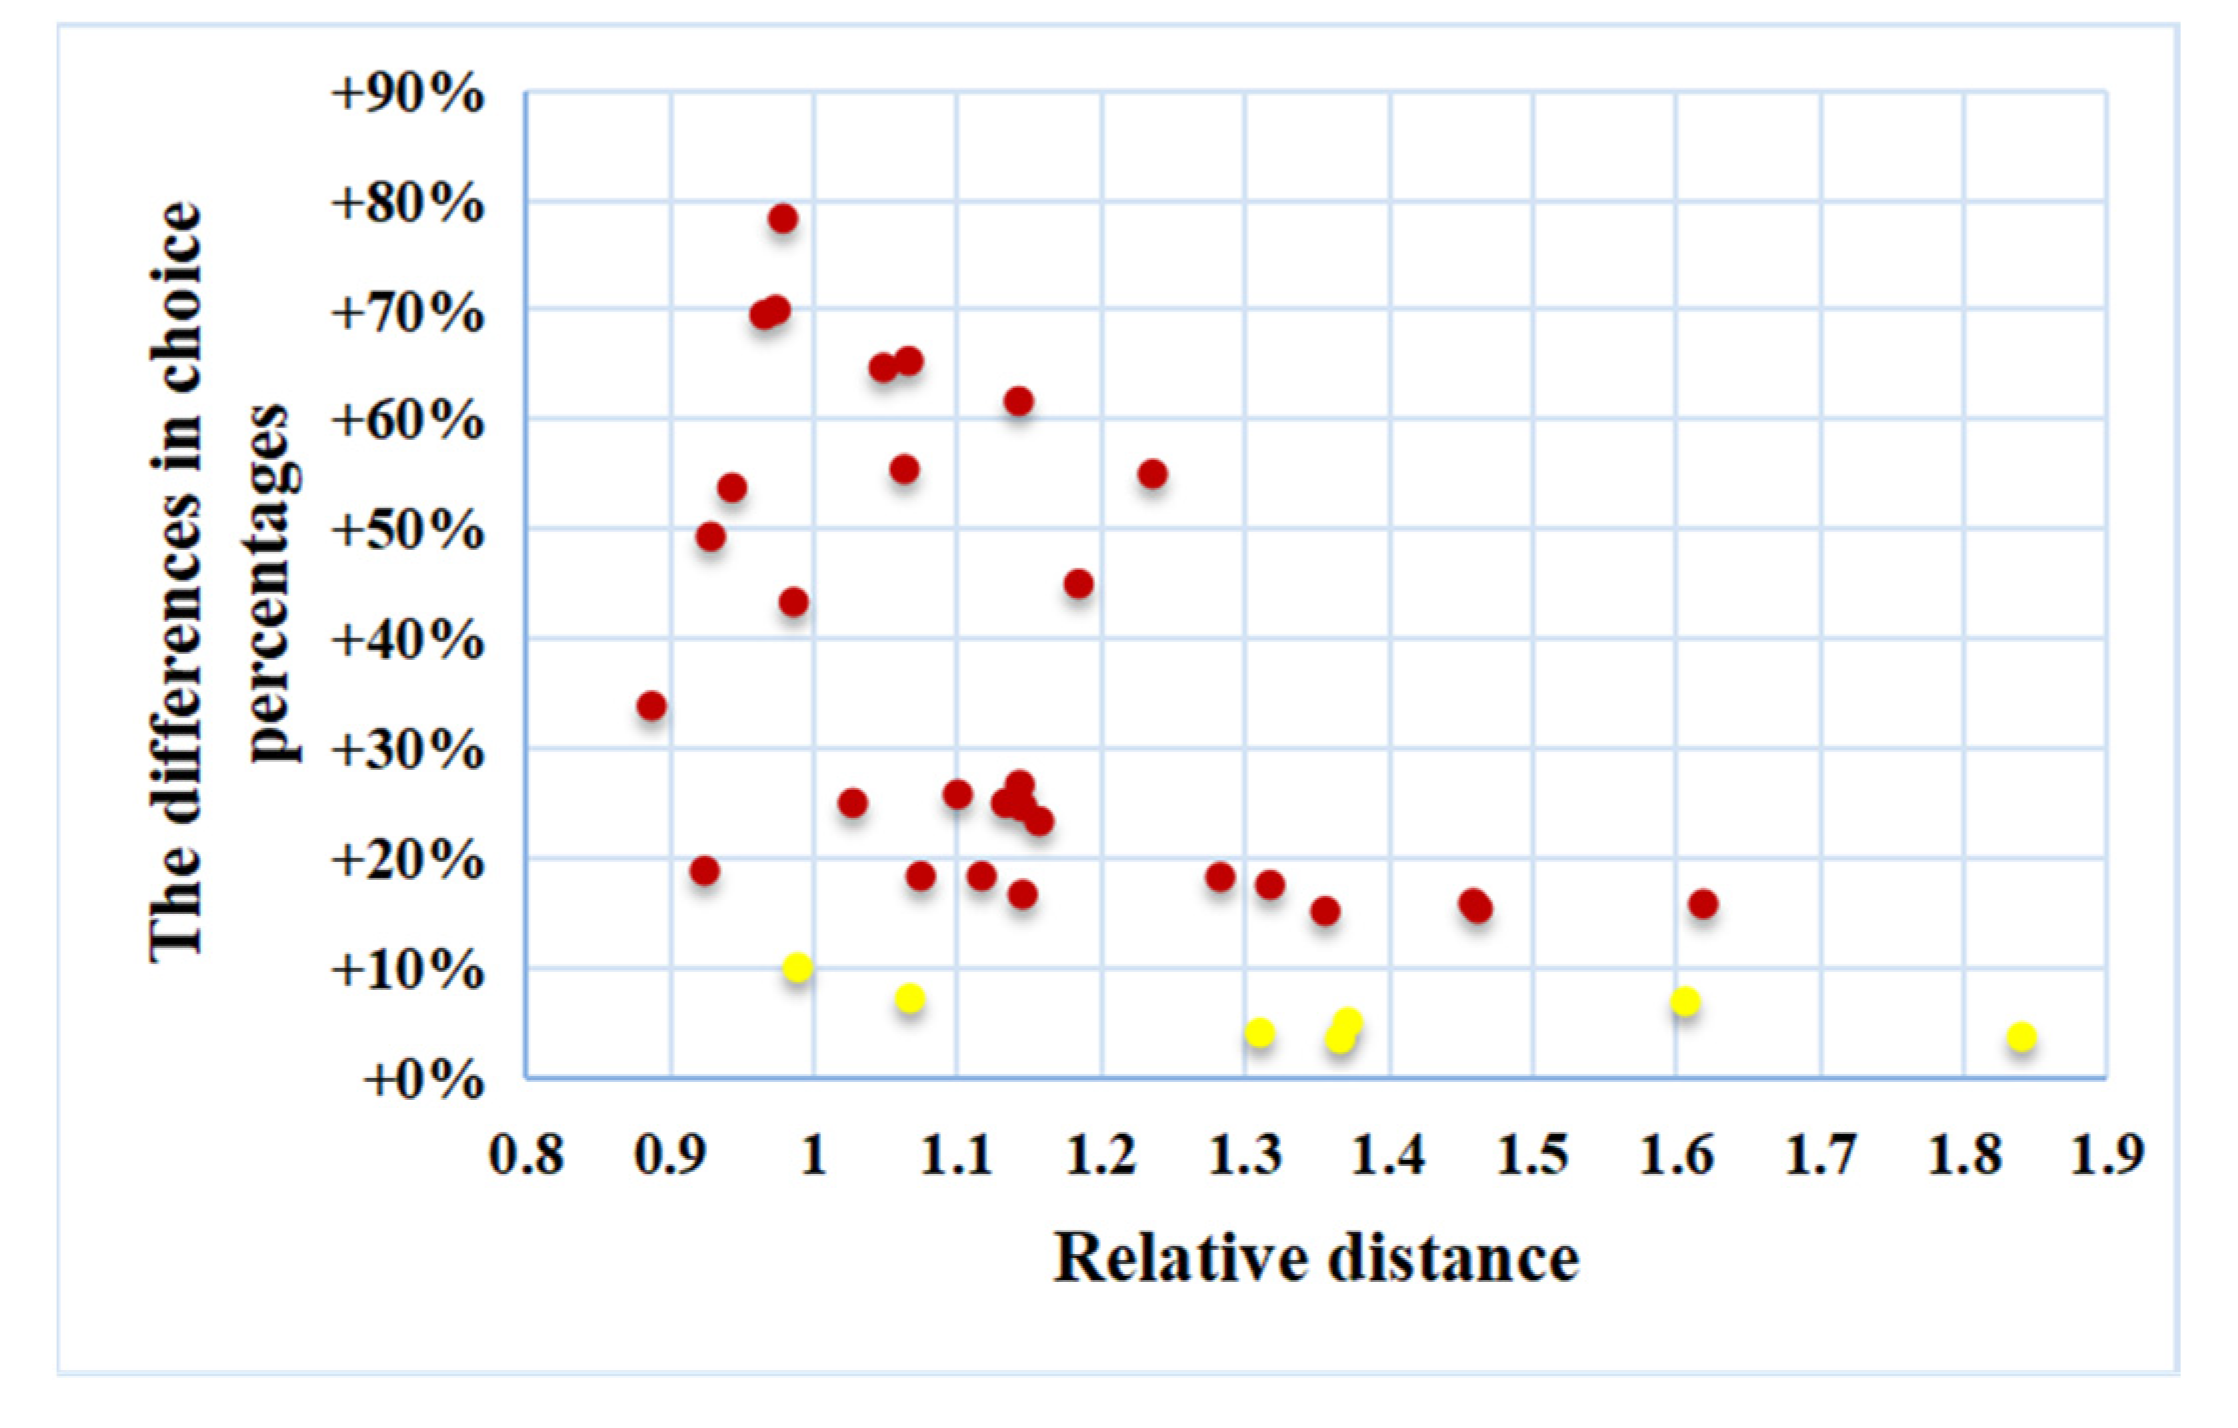
6.3. Correlation Analysis of Relative Distance
In
Figure 9, the horizontal axis is the relative distance and the vertical axis represents the differences in the choice percentages of the recommended routes. Meanwhile, the red and yellow points represent the recommended routes with and without significant increased choice percentages, respectively. As people prefer the shortest route to their destination [
28,
29], most baseline routes have the shortest lengths among all route choices. Hence, most relative distances are >1, as shown in
Figure 9. The results of the partial correlation analysis (Pearson’s correlation coefficient
r = −0.52,
n = 36,
p = 0.00 < 0.05; Spearman’s rank correlation coefficient
r = −0.48,
n = 36,
p = 0.00
< 0.05) showed that there is a significant and highly negative correlation between the relative distance and the differences in choice percentages, as the two
p values are less than 0.05 and the two correlation coefficients |r| are close to 0.5. This suggests that the relative distance significantly influences route choice, following route shape simplification.
According to the results of the Chi-square test in
Section 5, there are 29 recommended routes with significant differences in choice percentages and seven recommended routes with no significant differences. Among these seven routes, there are five routes with a relative distance > 1.3. As shown in
Figure 9, the increase in choice percentages is less significant when the values of relative distance are >1.3. Fuest [
16] compared two route options on a map and indicated that shape simplification of a longer route can influence route choice when the length of the shorter route is about 80–90% of the longer route. Hence, about 1.3 times the relative distance may be a probable threshold for applying route shape simplification to influence pedestrians’ route choice.
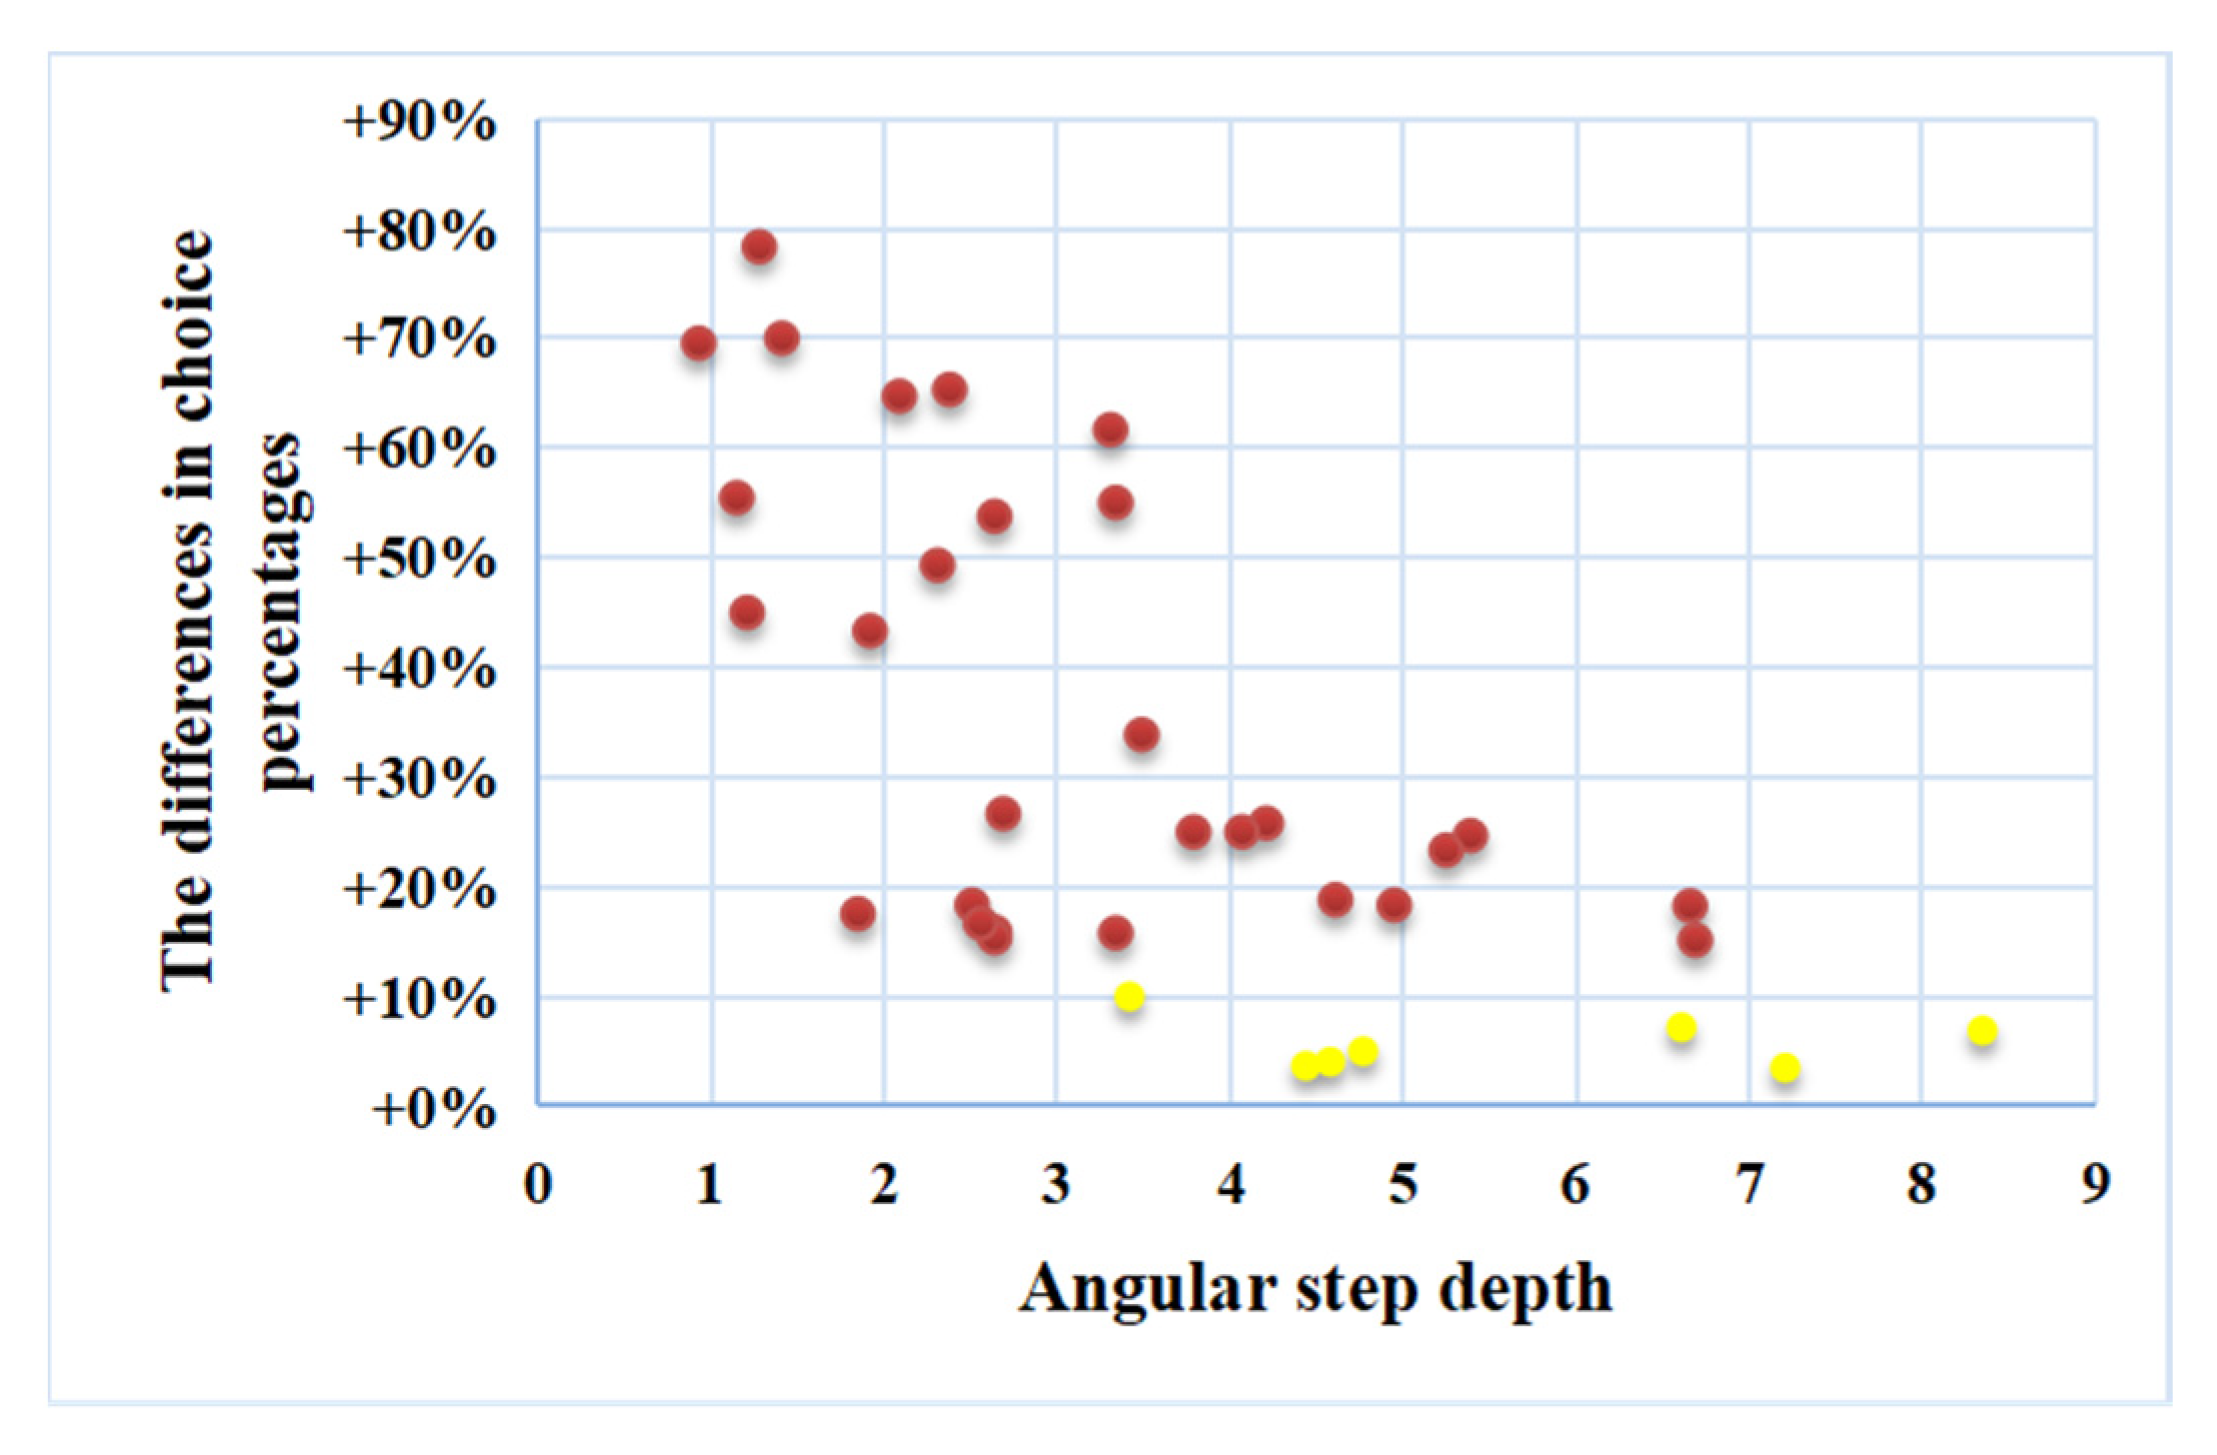
6.4. Correlation Analysis of Direction Changes
To quantitatively assess the direction changes of a recommended route, the angular step depth of a recommended route was used in this study and calculated using Depthmap software. In
Figure 10, the horizontal axis indicates the angular step depth and the vertical axis denotes the difference in the choice percentages of the recommended routes. Meanwhile, the red and yellow points represent the recommended routes with and without significant increased choice percentages, respectively. The results of the partial correlation analysis (Pearson’s correlation coefficient
r = −0.45,
n = 36,
p = 0.01 < 0.05; Spearman’s rank correlation coefficient
r = −0.49,
n = 36,
p = 0.00
< 0.05) showed that there is a significantly and moderately negative correlation between the angular step depth and the differences in choice percentages, as the two
p values are less than 0.05 and the two correlation coefficients |r| are 0.3–0.5. This suggests that direction changes influence route choice, following route shape simplification.
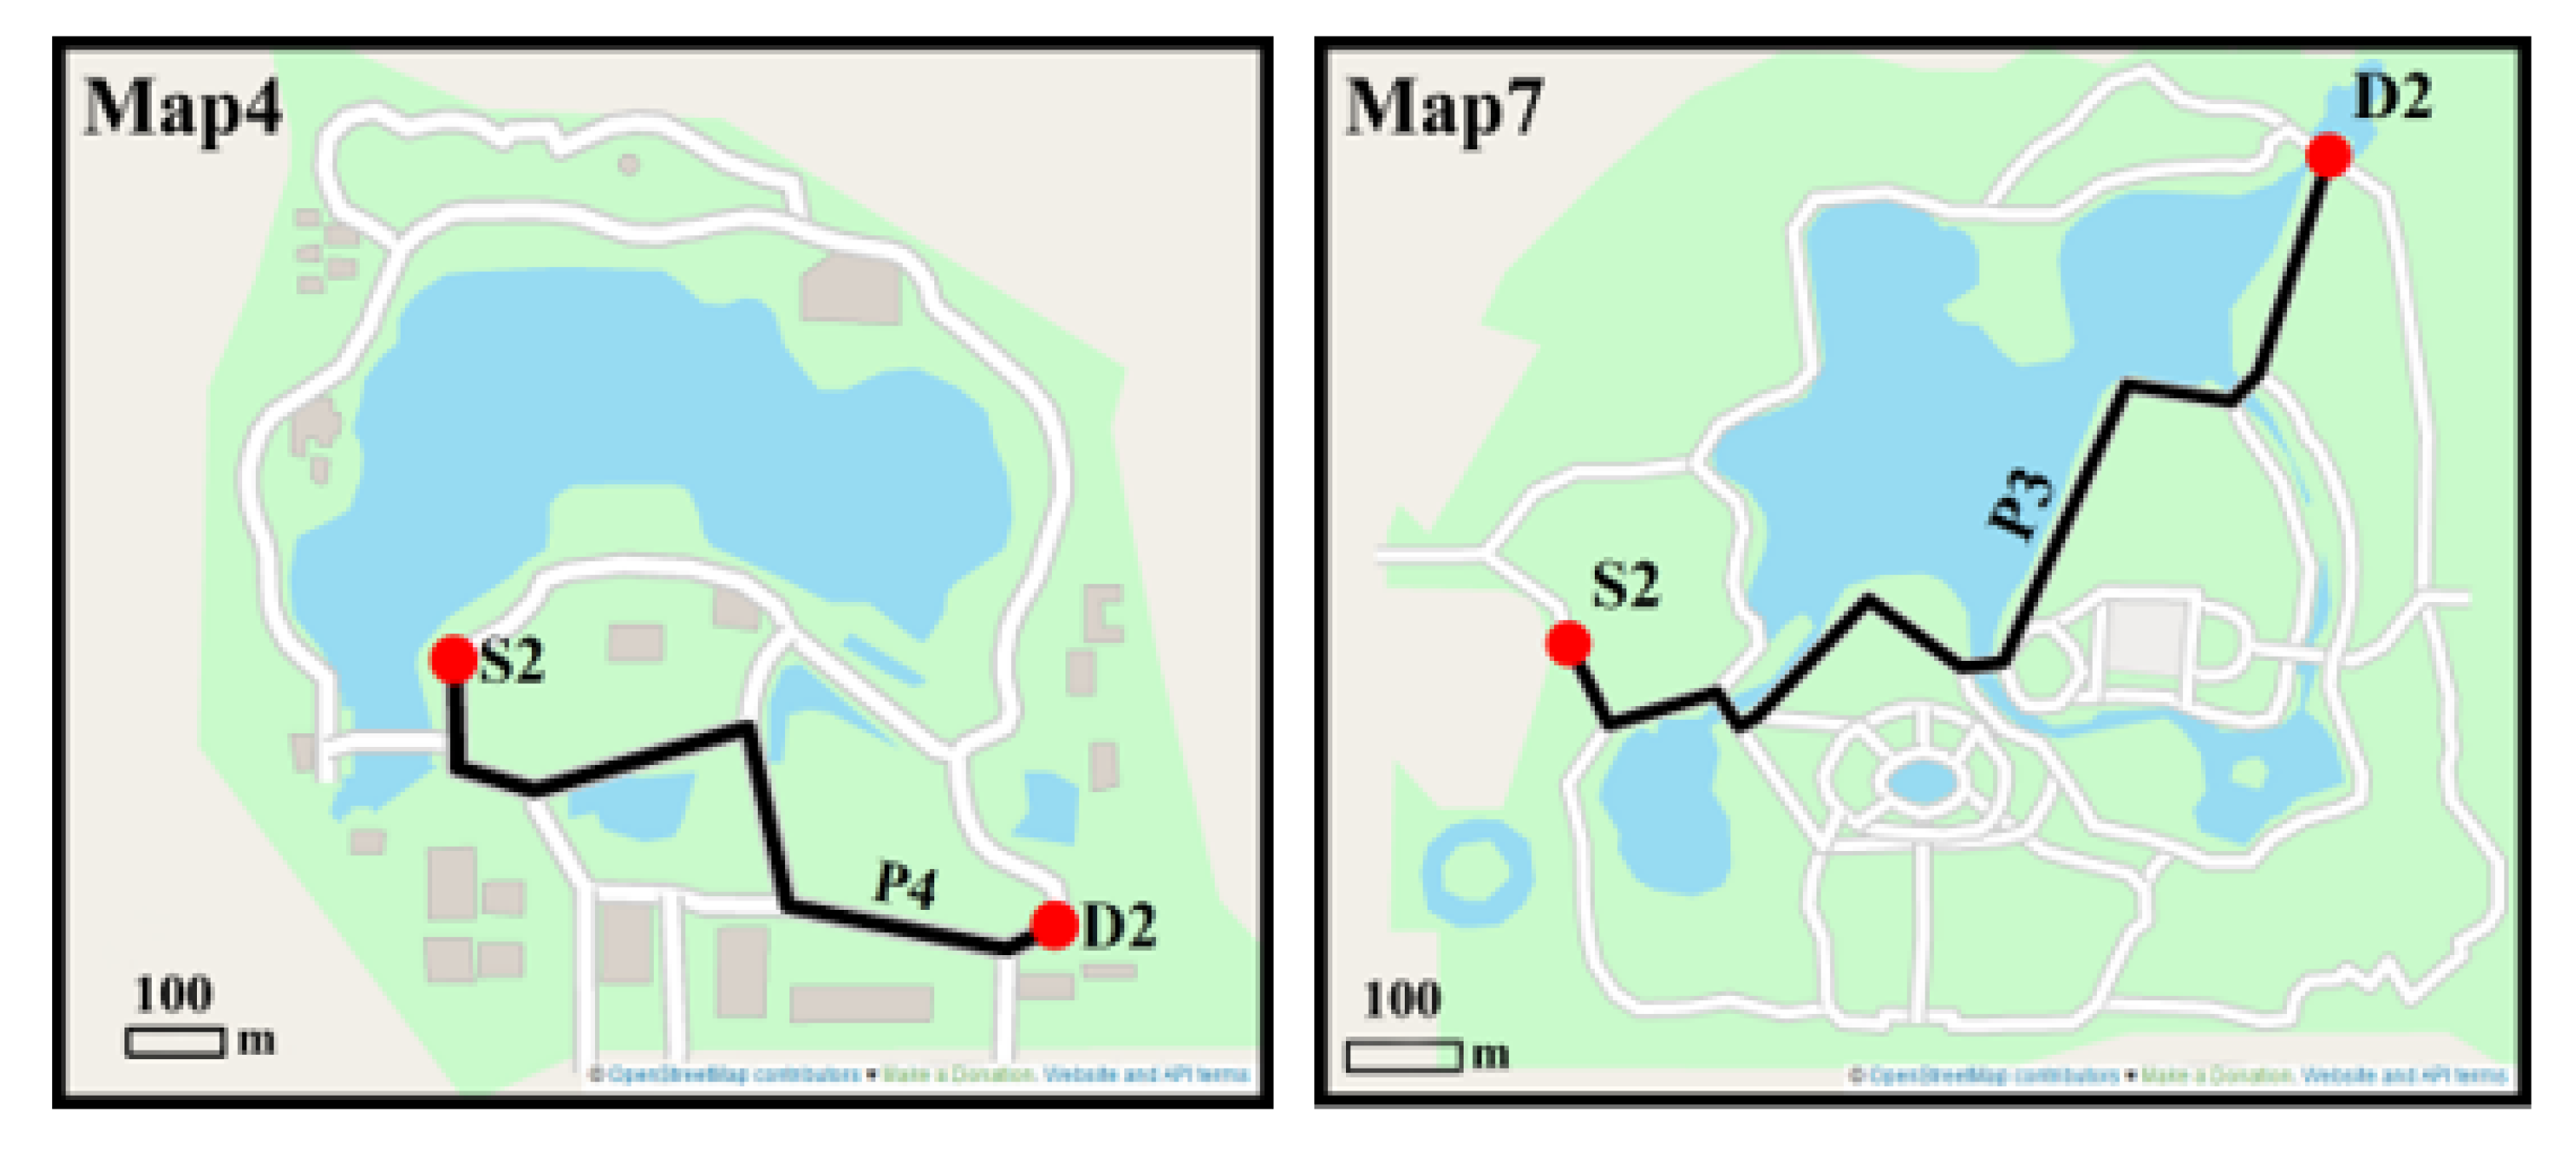
According to the results of the Chi-square test in
Section 5, there are 29 recommended routes with significant differences in choice percentages and seven recommended routes with no significant differences. Among these seven routes, excluding five routes with a higher relative distance, there are two routes with larger direction changes, as shown in
Figure 11 (angular step depth of Map4-SD2-P4 = 3.42, angular step depth of Map7-SD2-P3 = 6.61). Hence, when applying shape simplification to influence map users’ route choice regarding a recommended route, in the case of recommended routes with larger direction changes, enhancing simplified routes’ visual continuity (e.g., making a turn smoother) may increase the effects of the aforementioned influence.
7. Discussion and Conclusions
This study conducted a systematically experimental investigation to evaluate the influencing effects of route shape simplification on pedestrians’ route choice, considering various geometric characteristics (relative distance, initial orientation, number of intersections, and direction changes). Seven road network regions suitable for walking were used as experiment data, and two experiments were conducted: First, we selected three pairs of starting and destination points on baseline maps and conducted a route choice experiment for each pair. Second, based on the route choice results using the baseline maps, we selected and simplified 36 recommended routes and conducted a route choice experiment using the modified maps.
According to the experimental results, the following conclusions were drawn. First, according to participants’ route choice and the results of the Chi-square test, shape simplification significantly increased the choice percentages of most of the recommended routes. Second, according to the results of the correlation analysis, larger relative distance and direction changes significantly reduced the shape simplification’s influence on route choice; meanwhile, initial orientation and the number of intersections had weak effects. Third, the shape simplification’s influence on route choice was significantly reduced when the relative distance was >1.3, which could be considered a threshold for the selection of recommended routes. Additionally, larger direction changes may result in worse visual continuity on a route, thereby reducing shape simplification’s influence on route choice. Hence, smoothing the shape of the route surrounding the nodes could increase shape simplification’s influence.
This study contributes to the literature on map-based route choice and cognition by studying the associations of route shape simplification with pedestrians’ route choice. It considers multiple geometric characteristics, including relative distance, initial orientation, number of intersections, and direction changes. Further, this study shows that shape simplification has different degrees of influence on route choice behavior under different conditions of geometric characteristics; this may better support the practice of influencing route choice behaviors via shape simplification.
This study has some limitations that can be addressed in future studies. First, it only considers routes’ geometric characteristics, while personal factors (e.g., spatial skills and personal experience), environmental factors (e.g., accessibility and walkability), and visual variables (e.g., using different colors to represent road features and maps’ background) may also influence pedestrians’ route choice [
7]. Thus, such factors will be considered in a future study. Second, the present study’s experiments were conducted in a laboratory environment using paper maps. Thus, future studies should investigate route choices in outdoor settings using digital maps displayed on portable devices. Additionally, in a future study, we aim to develop a selection model based on the present research to support the automatic selection of recommended routes.
Author Contributions
Conceptualization, methodology, and writing—original draft preparation, Peng Ti; methodology, investigation, and writing—original draft preparation, Ruyu Dai; data curation, Fangyi Wan; formal analysis, Tao Xiong; investigation, Hao Wu; editing and project administration, Zhilin Li. All authors have read and agreed to the published version of the manuscript.
Funding
This research was funded by the National Natural Science Foundation of China (41871365; 41930104).
Data Availability Statement
Conflicts of Interest
The authors declare no conflict of interest.
References
- Timmermans, H.J.P. Pedestrian Behavior: Models, Data Collection and Applications; Emerald Group Publishing Ltd.: Bingley, UK, 2009. [Google Scholar]
- Grant, T. Walking, Walkability, and Health Disparities: Condensed Review Summary and Update; Canadian Scholars: Toronto, ON, Canada, 2017. [Google Scholar]
- Sevtsuk, A.; Basu, R.; Li, X.; Kalvo, R. A big data approach to understanding pedestrian route choice preferences: Evidence from San Francisco. Travel Behav. Soc. 2021, 25, 41–51. [Google Scholar] [CrossRef]
- Raghubir, P.; Krishna, A. As the crow flies: Bias in consumers’ map-based distance judgments. J. Consum. Res. 1996, 23, 26–39. [Google Scholar] [CrossRef]
- Medynska-Gulij, B. The effect of cartographic content on tourist map users. Cartography 2003, 32, 49–54. [Google Scholar] [CrossRef]
- Christenfeld, N. Choices from identical options. Psychol. Sci. 1995, 6, 50–55. [Google Scholar] [CrossRef]
- Bailenson, J.N.; Shum, M.S.; Uttal, D.H. The initial segment strategy: A heuristic for route selection. Mem. Cognit. 2000, 28, 306–318. [Google Scholar] [CrossRef]
- Hochmair, H.H.; Karlsson, V. Investigation of Preference between the Least-Angle Strategy and the Initial Segment Strategy for Route Selection in Unknown Environments. In Proceedings of the International Conference Spatial Cognition, Ellicottville, NY, USA, 14–18 September 2005; pp. 79–97. [Google Scholar] [CrossRef]
- Shatu, F.; Yigitcanlar, T.; Bunker, J. Shortest path distance vs. least directional change: Empirical testing of space syntax and geographic theories concerning pedestrian route choice behaviour. J. Transp. Geogr. 2019, 74, 37–52. [Google Scholar] [CrossRef]
- Freitag, U. Map Functions. In Proceedings of the ICA-Working Group to Define the Main Theoretical Issues on Cartography for the 16th ICA Conference-Cologne, Cologne, Germany, 3–9 May 1993. [Google Scholar]
- McCall, R.; Koenig, V.; Martin, R.; Engel, T. Changing Mobility Behaviour through Recommendations. In Proceedings of the ACM Recsys CrowdRec Workshop 2015, Vienna, Austria, 19 September 2015. [Google Scholar]
- Stempel, P.; Becker, A. Visualizations out of context: Addressing pitfalls of real-time realistic hazard visualizations. ISPRS Int. J. Geo-Inf. 2019, 8, 318. [Google Scholar] [CrossRef]
- Pontikakis, E.; Twaroch, F. Schematic Maps as an Alternative to Point Coverages When Topographic Maps are not Available. In Proceedings of the 10th International Conference on Information Visualization (IV’06), London, UK, 5–6 July 2006; pp. 297–303. [Google Scholar] [CrossRef]
- Hochmair, H.H. The influence of map design on route choice from public transportation maps in urban areas. Cartogr. J. 2009, 46, 242–256. [Google Scholar] [CrossRef]
- Papinski, D.; Scott, D.M.; Doherty, S.T. Exploring the route choice decision-making process: A comparison of planned and observed routes obtained using person-based GPS. Transp. Res. F 2009, 12, 347–358. [Google Scholar] [CrossRef]
- Fuest, S.; Grüner, S.; Vollrath, M.; Sester, M. Evaluating the effectiveness of different cartographic design variants for influencing route choice. Cartogr. Geogr. Inf. Sci. 2021, 48, 169–185. [Google Scholar] [CrossRef]
- Guo, Z. Mind the map! The impact of transit maps on path choice in public transit. Transp. Res. A 2011, 45, 625–639. [Google Scholar] [CrossRef]
- Chengyin, G.; Peng, T.; Hao, W.; Tian, L. Usability evaluation of road map schematic representation. Bull. Surv. Mapp. 2021, 5, 81–85. [Google Scholar] [CrossRef]
- Golledge, R.G. Path Selection and Route Preference in Human Navigation: A Progress Report. In Proceedings of the International Conference on Spatial Information Theory, Semmering, Austria, 21–23 September 1995; pp. 207–222. [Google Scholar] [CrossRef]
- Duckham, M.; Kulik, L. “Simplest” paths: Automated route selection for navigation. In Spatial Information Theory: Foundations of Geographic Information Science; Springer: Berlin, Germany, 2003; pp. 169–185. [Google Scholar] [CrossRef]
- Richter, K.F.; Duckham, M. Simplest Instructions: Finding Easy-to-describe Routes for Navigation. In Proceedings of the International Conference on Geographic Information Science, Park City, UT, USA, 23–26 September 2008; pp. 274–289. [Google Scholar] [CrossRef]
- Agrawala, M.; Stolte, C. Rendering Effective Route Maps: Improving Usability through Generalization. In Proceedings of the 28th Annual Conference on Computer Graphics and Interactive Techniques, Los Angeles, CA, USA, 12–17 August 2001; pp. 241–249. [Google Scholar] [CrossRef]
- Kopf, J.; Agrawala, M.; Bargeron, D.; Salesin, D.; Cohen, M. Automatic generation of destination maps. ACM Trans. Graph. 2010, 29, 1–12. [Google Scholar] [CrossRef]
- Ti, P.; Xiong, T.; Qiu, Y.; Wang, L.; Li, Z. Automatic generation of outline-based representations of landmark buildings with distinctive shapes. Int. J. Geogr. Inf. Sci. 2022, 1–21. [Google Scholar] [CrossRef]
- Ti, P.; Li, Z. Generation of schematic network maps with automated detection and enlargement of congested areas. Int. J. Geogr. Inf. Sci. 2014, 28, 521–540. [Google Scholar] [CrossRef]
- Lan, T.; Li, Z.; Ti, P. Integrating general principles into mixed-integer programming to optimize schematic network maps. Int. J. Geogr. Inf. Sci. 2019, 33, 2305–2333. [Google Scholar] [CrossRef]
- Bovy, P.H.; Stern, E. Wayfinding: Choice and search. In Route Choice: Wayfinding in Transport Networks; Springer Science & Business Media: Berlin, Germany, 1990; pp. 1–14. [Google Scholar] [CrossRef]
- Prato, C.G. Route choice modeling: Past, present and future research directions. J. Choice Model. 2009, 2, 65–100. [Google Scholar] [CrossRef]
- Gim, T.T.; Ko, J. Maximum likelihood and firth logistic regression of the pedestrian route choice. Int. Reg. Sci. Rev. 2017, 40, 616–637. [Google Scholar] [CrossRef]
- Hochmair, H.H.; Frank, A.U. Influence of estimation errors on wayfinding-decisions in unknown street networks-analyzing the least angle strategy. Spat. Cogn. Comput. 2002, 2, 283–313. [Google Scholar] [CrossRef]
- Dalton, R.C. The secret is to follow your nose: Route path selection and angularity. Environ. Behav. 2003, 35, 107–131. [Google Scholar] [CrossRef]
- Seneviante, P.N.; Morrall, J.F. Analysis of factors affecting the choice of route of pedestrians. Transp. Plan. Technol. 1986, 10, 147–159. [Google Scholar] [CrossRef]
- Richter, K.F.; Klippel, A. “You-are-here maps”: Wayfinding support as location based service. Beiträge Münsteraner GI-Tagen 2002, 13, 21–39. [Google Scholar]
- Manley, E.; Filomena, G.; Mavros, P. A spatial model of cognitive distance in cities. Int. J. Geogr. Inf. Sci. 2021, 35, 2316–2338. [Google Scholar] [CrossRef]
- Fuest, S.; Sester, M. A framework for automatically visualizing and recommending efficient routes. Proc. Int. Cartogr. Assoc. 2019, 2, 34. [Google Scholar] [CrossRef]
- Ramaekers, K.; Reumers, S.; Wets, G.; Cools, M. Modelling route choice decisions of car travellers using combined GPS and diary data. Netw. Spat. Econ. 2013, 13, 351–372. [Google Scholar] [CrossRef]
- Hillier, B.; Iida, S. Network and Psychological Effects in Urban Movement. In Proceedings of the International Conference on Spatial Information Theory, Ellicottville, NY, USA, 14–18 September 2005; pp. 475–490. [Google Scholar] [CrossRef]
- Jiang, B. Ranking spaces for predicting human movement in an urban environment. Int. J. Geogr. Inf. Sci. 2009, 23, 823–837. [Google Scholar] [CrossRef]
- Lerman, Y.; Rofè, Y.; Omer, I. Using space syntax to model pedestrian movement in urban transportation planning. Geogr. Anal. 2014, 46, 392–410. [Google Scholar] [CrossRef]
- Bailenson, J.N.; Shum, M.S.; Uttal, D.H. Road climbing: Principles governing asymmetric route choices on maps. J. Environ. Psychol. 1998, 18, 251–264. [Google Scholar] [CrossRef]
- Thompson, R.C.; Richardson, D.E. The ‘Good Continuity’ Principle of Perceptual Organization Applied to the Generalization of Road Networks. In Proceedings of the 19th International Cartographic Conference, Ottawa, ON, Canada, 21 August 2002; pp. 1215–1225. [Google Scholar]
- Peterson, D.J.; Berryhill, M.E. The Gestalt principle of similarity benefits visual working memory. Psychon. Bull. Rev. 2013, 20, 1282–1289. [Google Scholar] [CrossRef]
- Sadalla, E.K.; Magel, S.G. The perception of traversed distance. Environ. Behav. 1980, 12, 65–79. [Google Scholar] [CrossRef]
- Stone, J.P.; McBeath, M.K. Gender differences in distance estimates when exposed to multiple routes. Environ. Behav. 2010, 42, 469–478. [Google Scholar] [CrossRef]
- Turner, A. From axial to road-centre lines: A new representation for space syntax and a new model of route choice for transport network analysis. Environ. Plan. B Plan. Des. 2007, 34, 539–555. [Google Scholar] [CrossRef]
- Harrie, L.; Sarjakoski, L.T.; Lehto, L. A variable-scale map for small-display cartography. Int. Arch. Photogramm. Remote Sens. Spat. Inf. Sci. 2002, 34, 237–242. [Google Scholar]
- Douglas, D.H.; Peucker, T.K. Algorithms for the reduction of the number of points required to represent a digitized line or its caricature Cartographer. Cartographica 1973, 10, 112–122. [Google Scholar] [CrossRef]
- Li, C.; Wu, P.; Gu, T.; Liu, X. A Study on Curve Simplification Method Combining Douglas-Peucker with Li-Openshaw. Geo-spatial Knowledge and Intelligence. In Proceedings of the 4th International Conference on Geo-Informatics in Resource Management and Sustainable Ecosystem, Hong Kong, China, 18–20 November 2017. [Google Scholar] [CrossRef]
- Li, Z.; Dong, W. A stroke-based method for automated generation of schematic network maps. Int. J. Geogr. Inf. Sci. 2010, 24, 1631–1647. [Google Scholar] [CrossRef]
- Bhowmick, D.; Winter, S.; Stevenson, M. Comparing the Costs of Pedestrian Wayfinding Heuristics across Different Urban Network Morphologies; GeoComputation 2019: Queenstown, New Zealand, 2019. [Google Scholar]
- Franke, T.M.; Ho, T.; Christie, C.A. The chi-square test: Often used and more often misinterpreted. Am. J. Eval. 2012, 33, 448–458. [Google Scholar] [CrossRef]
- Rana, R.; Singhal, R. Chi-square test and its application in hypothesis testing. J. Pract. Cardiovasc. Sci. 2015, 1, 69–71. [Google Scholar] [CrossRef]
- Kim, S. ppcor: An R package for a fast calculation to semi-partial correlation coefficients. Commun. Stat. Appl. Methods 2015, 22, 665–674. [Google Scholar] [CrossRef]
- Härdle, W.K.; Simar, L. Applied Multivariate Statistical Analysis; Springer: Cham, Switzerland, 2019; pp. 121–122. [Google Scholar] [CrossRef]
- Akoglu, H. User’s guide to correlation coefficients. Turk. J. Emerg. Med. 2018, 18, 91–93. [Google Scholar] [CrossRef]
- Cohen, J. Statistical Power Analysis for the Behavioral Sciences, 2nd ed.; Lawrence Erlbaum Associates: Hillsdale, Australia, 1988; pp. 109–129. [Google Scholar] [CrossRef]
- Hauke, J.; Kossowski, T. Comparison of values of Pearson’s and Spearman’s correlation coefficients on the same sets of data. Quaest. Geogr. 2011, 30, 87–93. [Google Scholar] [CrossRef]
- Sedgwick, P. Spearman’s rank correlation coefficient. Br. Med. J. 2014, 349, g7528. [Google Scholar] [CrossRef] [PubMed]
| Disclaimer/Publisher’s Note: The statements, opinions and data contained in all publications are solely those of the individual author(s) and contributor(s) and not of MDPI and/or the editor(s). MDPI and/or the editor(s) disclaim responsibility for any injury to people or property resulting from any ideas, methods, instructions or products referred to in the content. |
© 2023 by the authors. Licensee MDPI, Basel, Switzerland. This article is an open access article distributed under the terms and conditions of the Creative Commons Attribution (CC BY) license (https://creativecommons.org/licenses/by/4.0/).


