1. Introduction
When we want to explore a new place we intend to visit, an interactive multi-scale map can certainly prove to be a useful tool. However, over 15 years since Google Maps first made them widely available, multi-scale interactive maps continue to suffer from a particular ailment: cartographic disorientation when zooming vertically across geographic scales or panning horizontally to new areas that were previously off-screen.
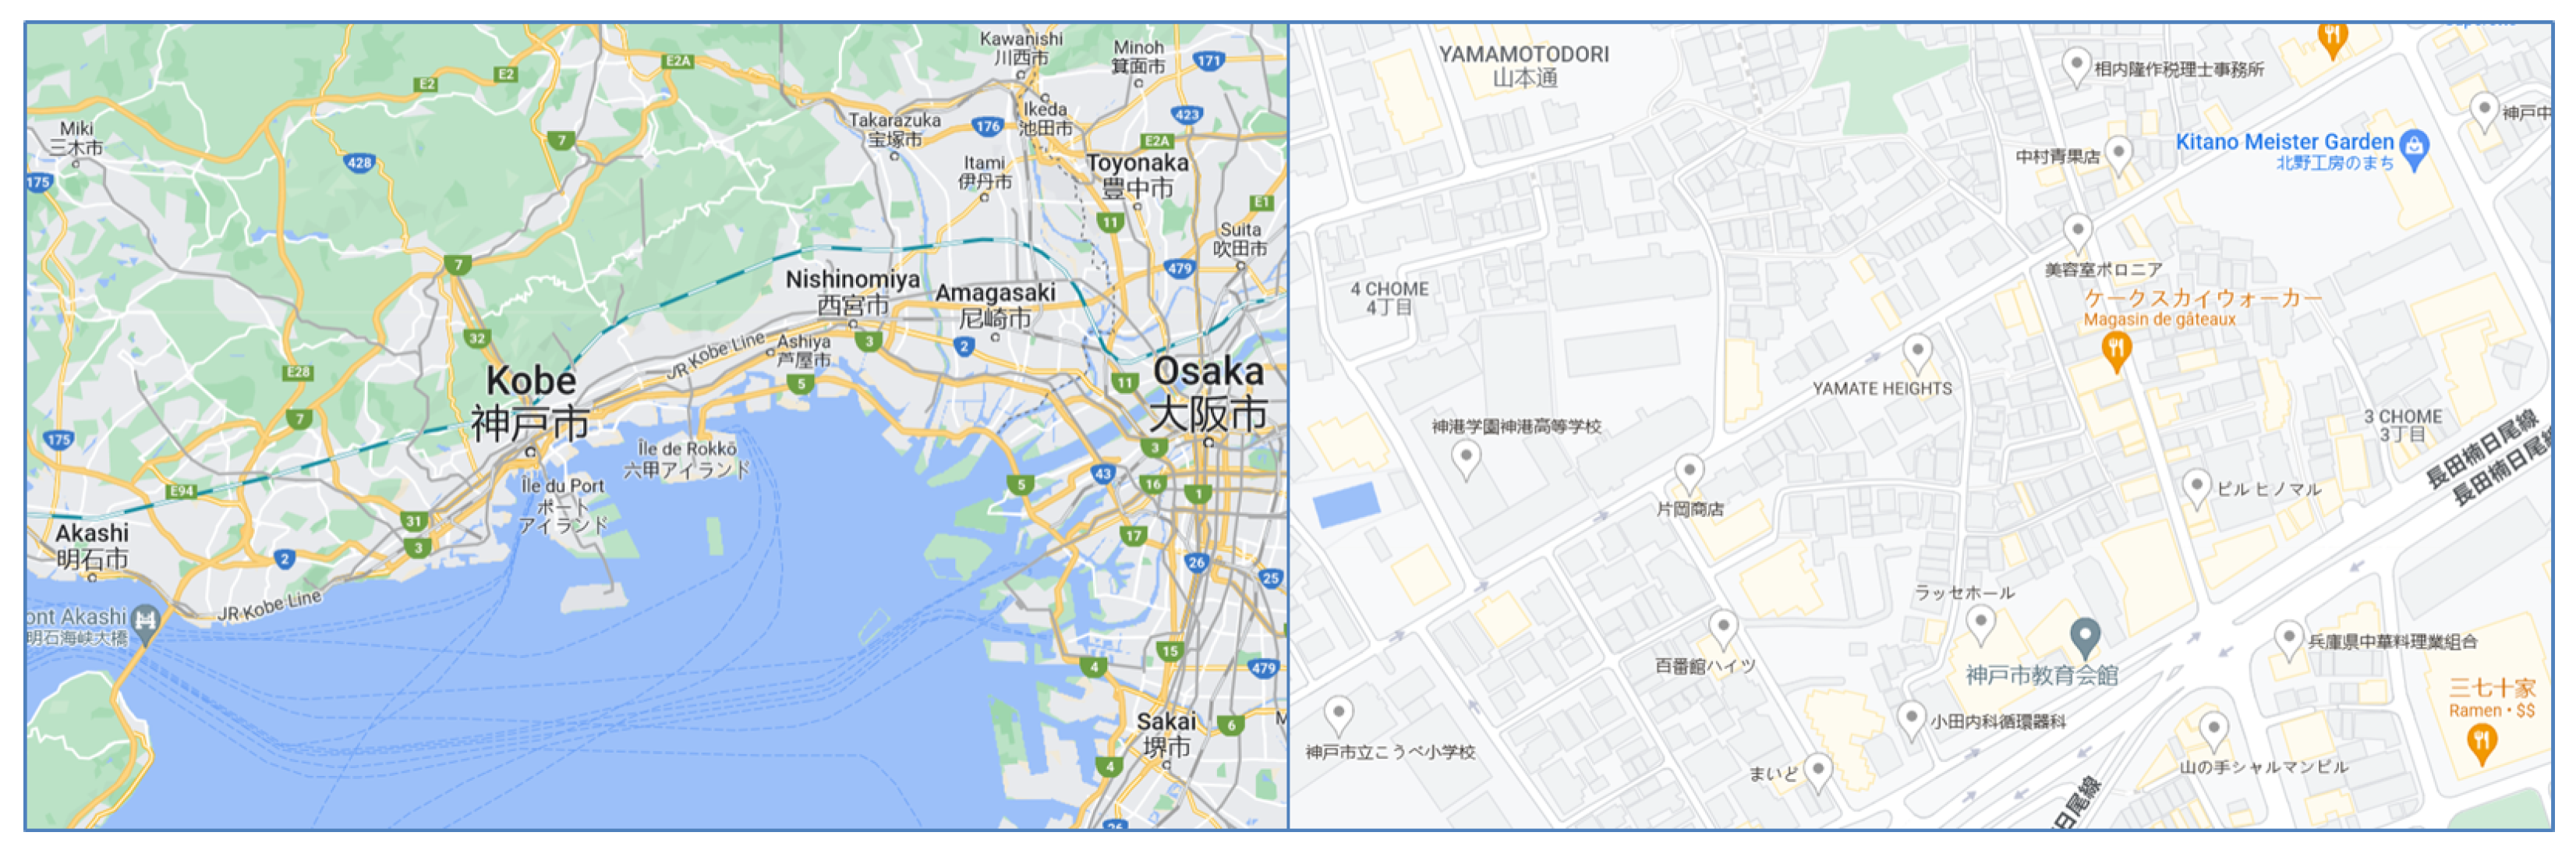
What follows is a typical example regarding cartographic disorientation that several of us experienced while planning to attend a conference (in this case, a conference in Kobe, Japan). Using Google Maps, we began at zoom level 11, which represented Osaka Bay, with the city of Kobe represented as a strip of land between the northwestern part of the bay and the mountains to the north. We quickly oriented ourselves to this map image. We then zoomed in heavily to search for the conference location: Kitano Meister Garden, which was pinned on the map thanks to a previous address search. Immediately, the contextual landmarks we used for spatial reference at zoom level 11 vanished. The mountains? Gone. The port and bay? One would not know the previous features existed, and even if a person did, he or she would not necessarily know in which direction they were (
Figure 1). We were presented with entirely new cartographic features, predominantly streets and buildings. However, because we had never been to Kobe, the map at this scale was largely useless as a contextual tool because we could not get our bearings. The symbols and street names were meaningless. We were forced to zoom in and out and pan back and forth several times to capture other landmarks at different scales and distinguish the location of the conference venue within the city. If one tries to reproduce this story with the zoom interaction currently implemented in Google Maps, one will notice that the transition from zoom level 11 and zoom level 17 is much slower and smoother. A user cannot jump across several zoom levels when using the mouse wheel anymore. However, this slow zoom is not implemented with the finger pinch interaction, and the other mapping applications based on tools such as Leaflet or OpenLayers still enable these zooms across several levels.
Every day, millions of people using pan-scalar maps—interactive maps designed to provide pan-optic usability across multiple geographic scales [
1]—must potentially muddle through cartographic disorientation as we did. This disorientation during z-scale zooming is well documented and was even given a label, the “desert fog effect”, by human–computer interaction specialists before the invention of pan-scalar maps [
2]. It earned this name due to the disappearance of visual cues while zooming, similar to how sand storms in deserts reshape the dunes and remove visual cues. It not only happens in pan-scalar maps but also in many other digital interfaces with zoom controls (e.g., [
3]). However, if we want to mitigate this desert fog effect by designing better pan-scalar maps [
4], we first need to better understand how and why such disorientation occurs among users of these maps.
Though spatial cognition researchers have made many discoveries regarding disorientation during wayfinding tasks, including while people are actively using maps, pan-scalar map disorientation outside of active wayfinding is different and deserves to be examined more thoroughly. We are not interested in the disorientation people can experience using any map but rather the one that is specifically attributable to the interactions available in these pan-scalar maps. This disorientation is more subtle and probably less damaging than the one occurring when people get lost during a journey, but it is also more ubiquitous. Paramount to such an endeavour, researchers need theoretical models on which to build and test this specific type of cartographic disorientation. This paper proposes a model of disorientation in pan-scalar map exploration. The forthcoming theoretical model is informed by the literature on disorientation in spatial cognition, neurosciences, human–computer interaction, and philosophy. We discuss the pan-scalar disorientation model using a corpus we are currently building that allows users to report experiences of disorientation during the exploration of maps.
This paper is structured as follows.
Section 2 provides some definitions about disorientation and pan-scalar maps.
Section 3 describes our collection of reported experiences of disorientation.
Section 4 describes the proposed model for disorientation and discusses how the disorientation experiences described in the previous section can be explained by the model.
Section 5 discusses the possible methods to carry out user surveys and measure or analyse this disorientation, and it summarises how we see this model being used in the future to design pan-scalar maps that minimise disorientation.
2. Related Work and Definitions
Human disorientation is a phenomenon of form and origin that is particularly diverse, and it has been investigated in different domains [
5,
6,
7]. Montello accredits the origin of a phenomenon of geographic disorientation from a certain awareness of being lost, adding that we are more or less conscious of being lost all the time and that it is its degrees and intensity vary [
7]. This statement seems to come from a property of spatiality sensed in previous works. “Spatiality is the property of reality that reflects the fact that everything is not at one location” [
8]. This awareness can wrongly be ignored during a period of time and thus may magnify one disorientation feeling [
6]. There are many definitions of disorientation [
5,
6], or of being lost, and they all refer to being lost in the real world, assisted by a map or not. Being lost or disoriented during the exploration of a pan-scalar map is not the same phenomenon, but we base our definition of disorientation on the straightforward and simple definition of geographic disorientation by Montello [
7], which also applies to our problem:
Definition 1. Disorientation occurs during the exploration of a pan-scalar map when people are consciously aware that they do not know where exactly the place depicted on a map is or where they need to go (horizontally or vertically) to get to the desired map view.
Montello also conceived being lost as realizing that one does not know enough (or does not have enough information available) for what one thinks is needed for the task: “being lost requires us to believe we know less than we think we want or need to know” [
7]. This conception seems to reflect the importance of expertise in pan-scalar map (dis)orientation, as it is the expertise that enables the assessment of needs (e.g., how to make the map communicate through interaction, where to look, what is the significance of a symbol or at the scale at which one is). In a cartographic exploration, this may be understood as the absence of proper cartographic information, impeding reconciliation between the cartographic communication to an existing mental representation. For an unknown environment, this feeling of disorientation could be revealed with the awareness of our incapacity (or at least the struggle) to construct a mental representation from cartographic communication (
Figure 2).
There is a vast amount of research on the definition of cartography as a communication process [
9,
10,
11,
12,
13,
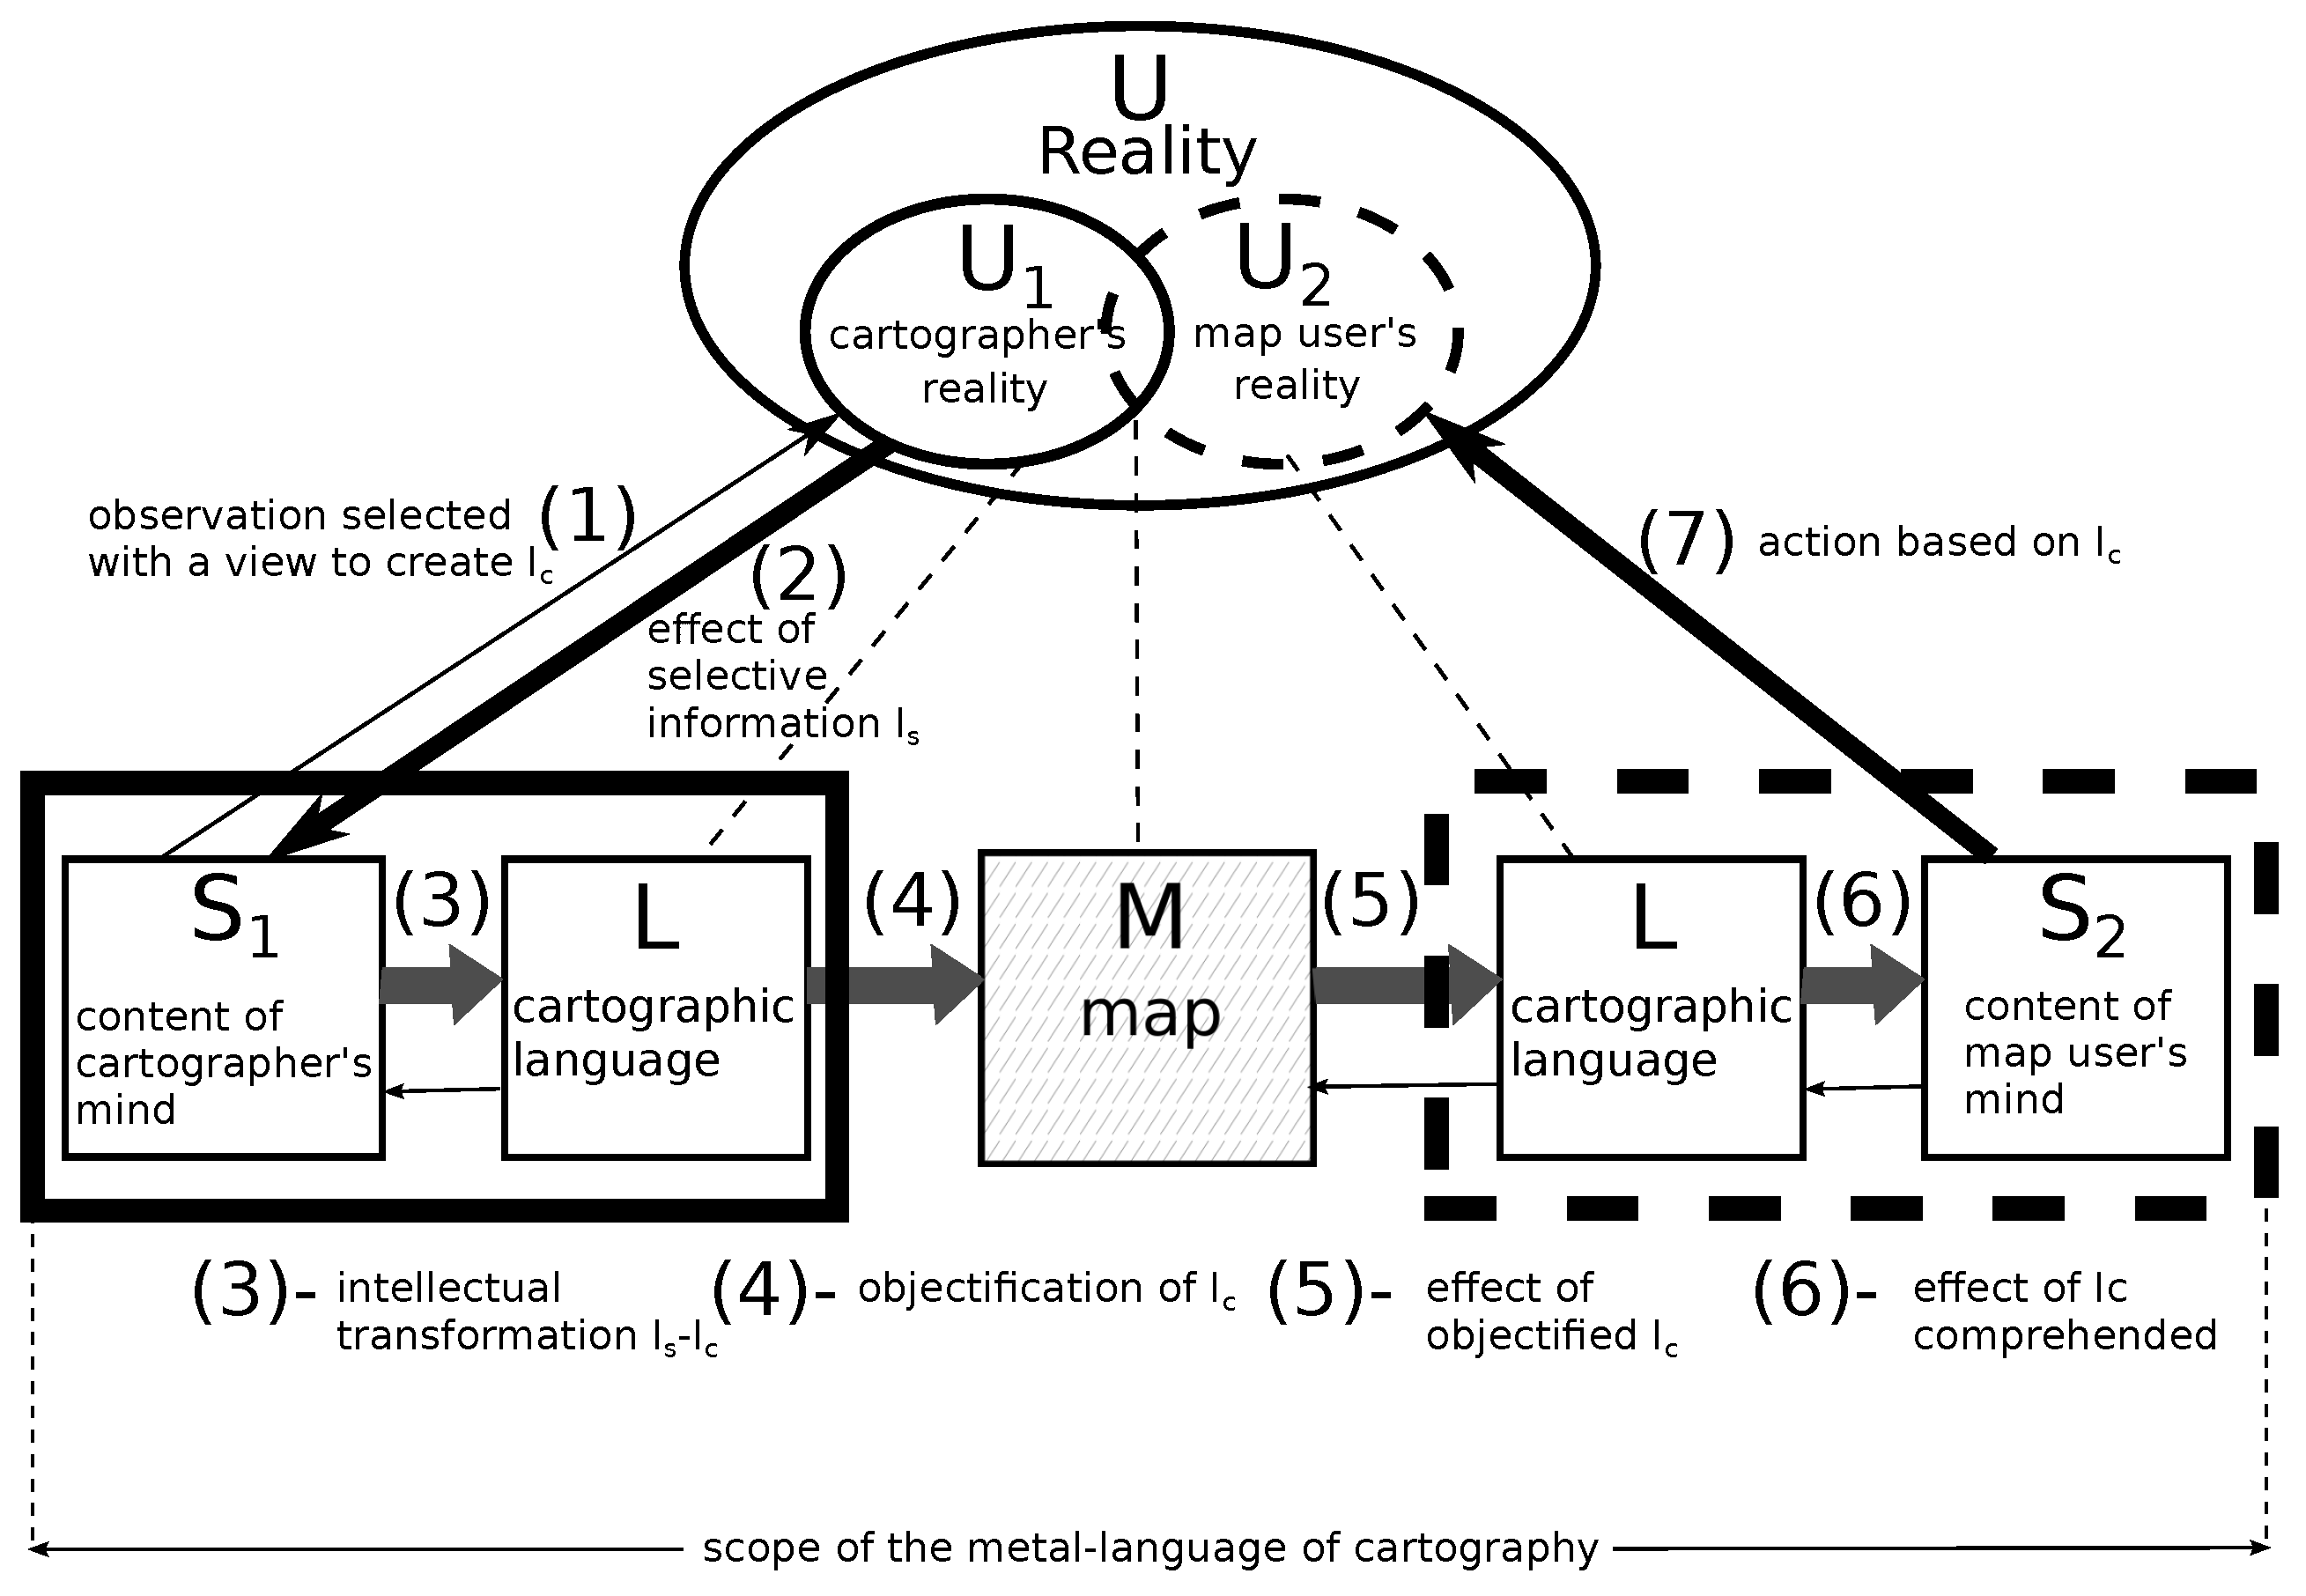
14], and we do not aim to revisit all these models in this paper. The model from Kolacny can be seen as a linear communication process. However, with pan-scalar maps, the process has become more of a communication loop, where the cartographic language constantly updates based on interactions stemming from the user’s mind. To summarise, pan-scalar map disorientation is less likely when both the cartographer and the map user are highly skilled in cartographic literacy. Unfortunately, it is likely rare that this is the case.
For phenomenologists, disorientation comes from “the link between our sense of space and our sense of possibility” [
6,
15]. It may rejoin Tuan’s sense of place, where he said that a mental map gives a person “a degree of assurance that we would not otherwise have” [
16]. Geographical spaces of small scales are mainly constructed of cartographic perceptions of views [
17,
18,
19]. However, people can obviously also build their mental representations with direct experiences [
6,
17,
20,
21]. To sum up, we compose our mental representation of a space according to our direct navigation of the environment or through the perception of maps and other media (e.g., language, books and film). These explorations build, reconcile, affirm or contradict our initial conception: “Within such spaces, we constantly move around. We explore geographic space by navigating in it, and we conceptualise it from multiple views, which are put together (mentally) like a jigsaw puzzle” [
22]. In an interactive map and its exploration, we can pay attention to details or remain passive and let the map communication compose itself as an existing mental representation. Casati notes that the feeling of disorientation could trigger a modular change for reorientation practices (towards a more attentive mode, for example): “a certain outcome may feel ’fishy’; expertise plays a role here” [
23]. Disorientation seems to intervene when the perception of multi-scale cartographic elements rubs against and resists an existing mental representation.
Then what is the desert fog effect mentioned and studied by researchers in human–computer interactions? It does occur with different types of interactive tools and not only maps [
3,
4,
24]. Based on the description from Jul and Furnas [
2], we propose the following definition of the desert fog:
Definition 2. The desert fog effect occurs while navigating in a pan-scalar map when the navigator faces a map view totally devoid of navigational cues.
3. Experiences of Cartographic Disorientation
Though it is a common feeling to all users of pan-scalar maps, disorientation can be multi-fold, and we decided to collect the experiences of people feeling disoriented during the exploration of a pan-scalar map to better characterise the many sides of this feeling. Such a corpus is also a way to assess the proposed model of disorientation, which is described in
Section 4. Different corpora of disorientation cases have been proposed in the past [
7,
15], but there are two reasons why we decided to collect a new one. First, the existing corpora collect experiences of geographic disorientation, and this is not exactly the same phenomenon as the one we are interested in. Second, these corpora are not openly available for any researcher to work with. Our proposed corpus is still under construction, but some of the stories summarised in this section already show different forms of disorientation.
The first story (
) takes place in Berlin, Germany (
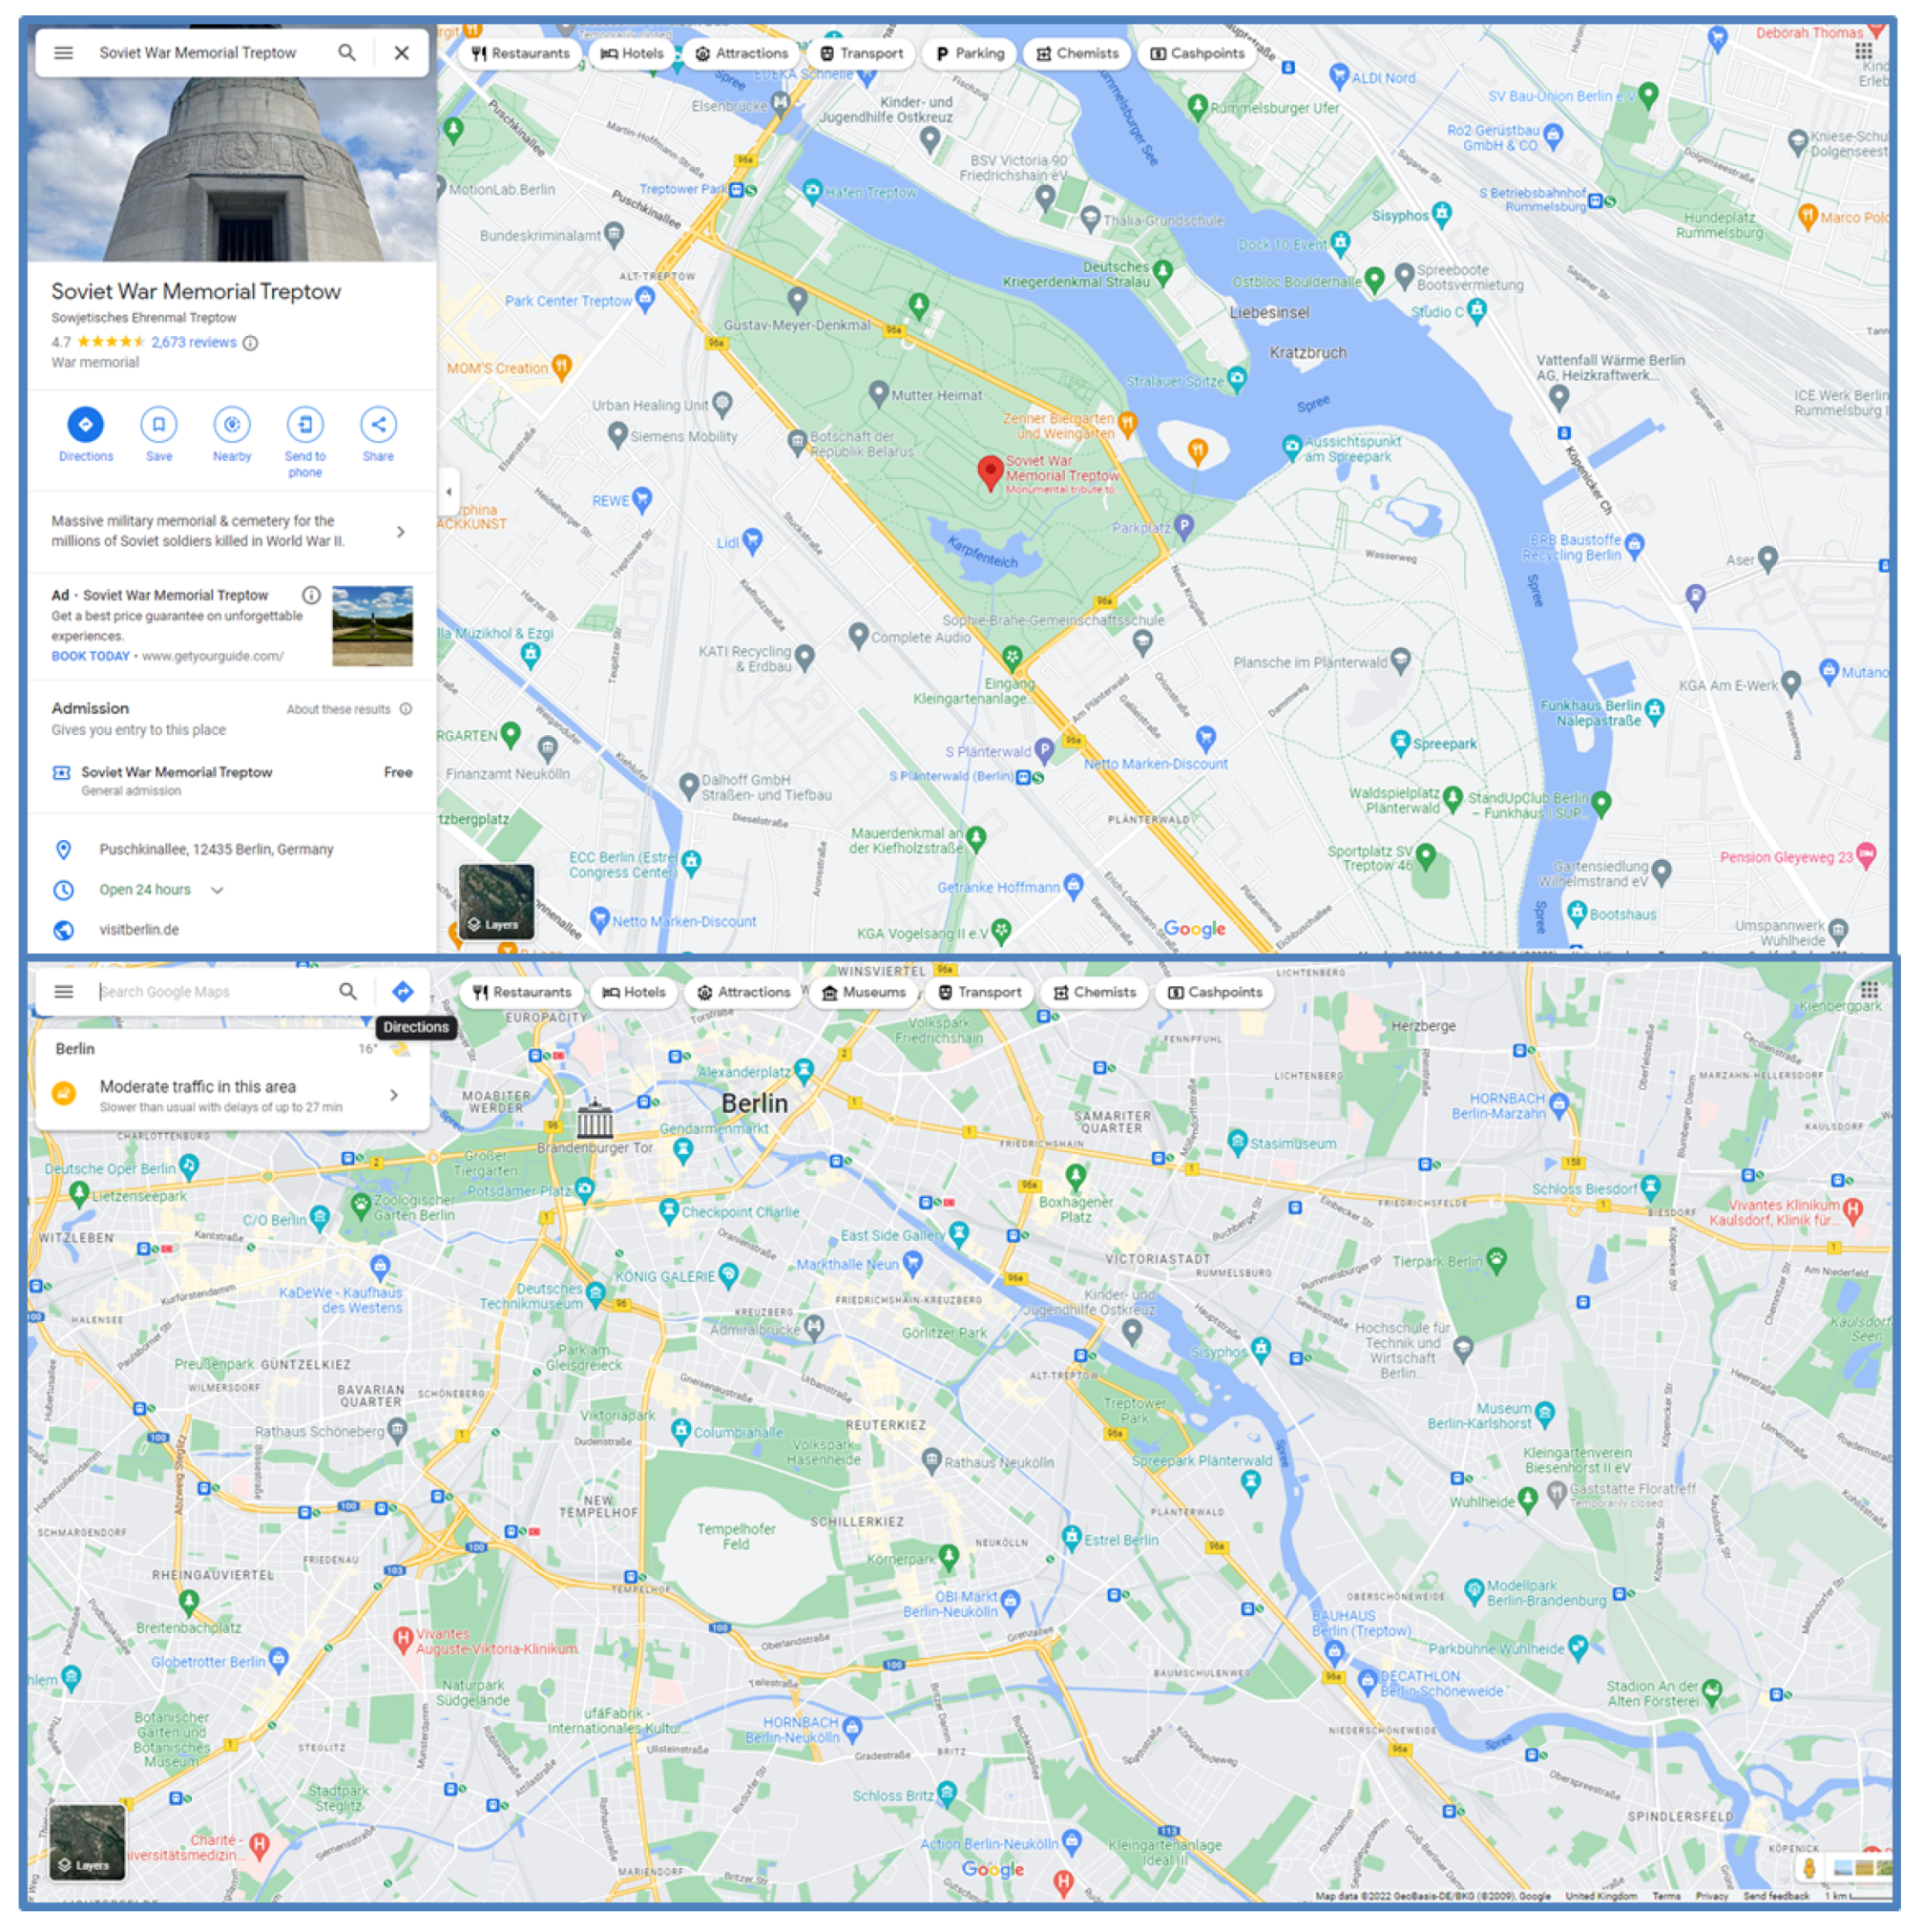
Figure 3) and illustrates the importance of salient structures on a map to prevent or correct a disorientation feeling. The story is fully reproduced below:
“Friend of mine was in Berlin and wanted to visit the USSR war memorial. Task was to (1) locate where it was, (2) see if was walkable, taxi, bus or train, (3) schedule visit and execute. He got lost in zoom trying to achieve these tasks. After several zooms in and out, he managed to anchor his exploration. At a large zoom level, centered on the memorial, he learnt the memorial runs close to a river. He learnt that it was close to a unique and significant water feature. The river became the salient anchor. It had a unique shape compared with other entities. It had a unique shape near the memorial that made the river differentiable. It became central to the decision making and the search for (1) distance to his hotel, (2) the search for metro stations, (3) the search for bus stops—as my friend panned and zoomed.”
The second story (
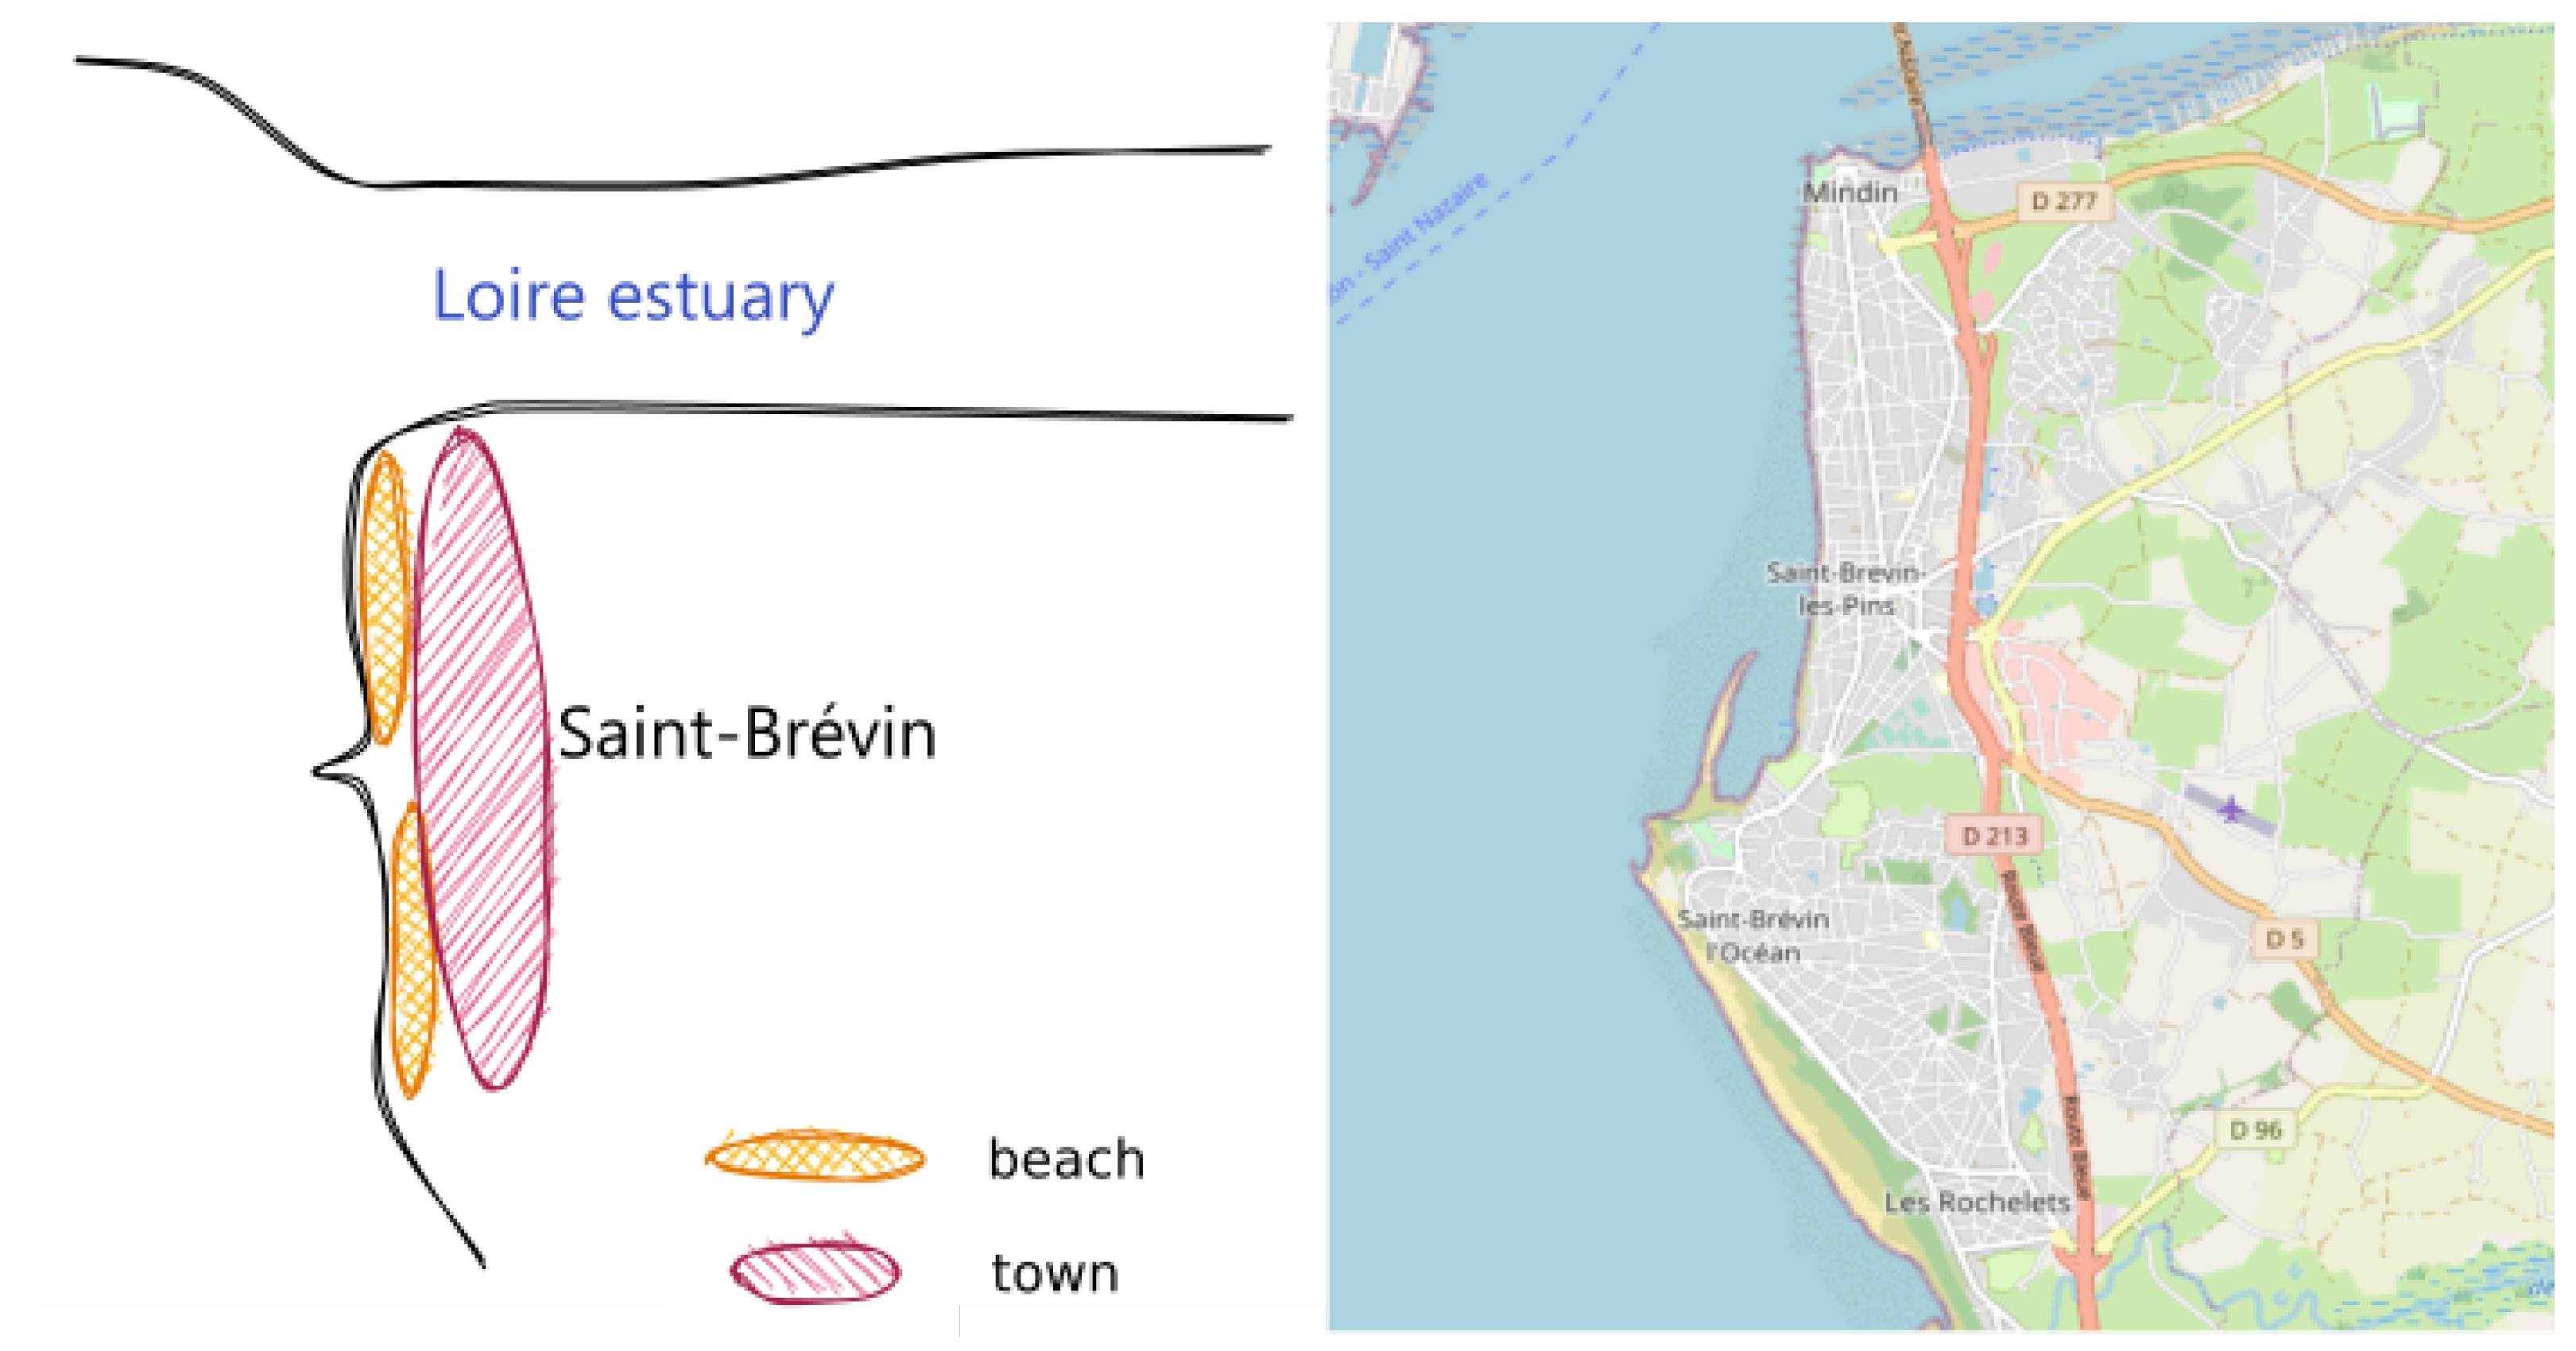
) illustrates the importance of the mental map in the orientation and disorientation process. It takes place in the seaside city of Saint-Brévin in France, where a colleague is used to spending summer holidays. Her mental representation of the city is composed of a few blocks of buildings packed along a long straight beach (
Figure 4). When she looked at the map for the first time, she was totally disoriented by the orientation of the city with the significant angle at the middle of the beach, and the map did not match her mental representation.
The third story (
) illustrates one of the obvious characteristics of pan-scalar maps: the scale continually changes as users pan and zoom. While zooming and looking at a topographic map from the French National Mapping Agency, the protagonist of the story noticed a long pink linear feature, which is the border between France and Italy (
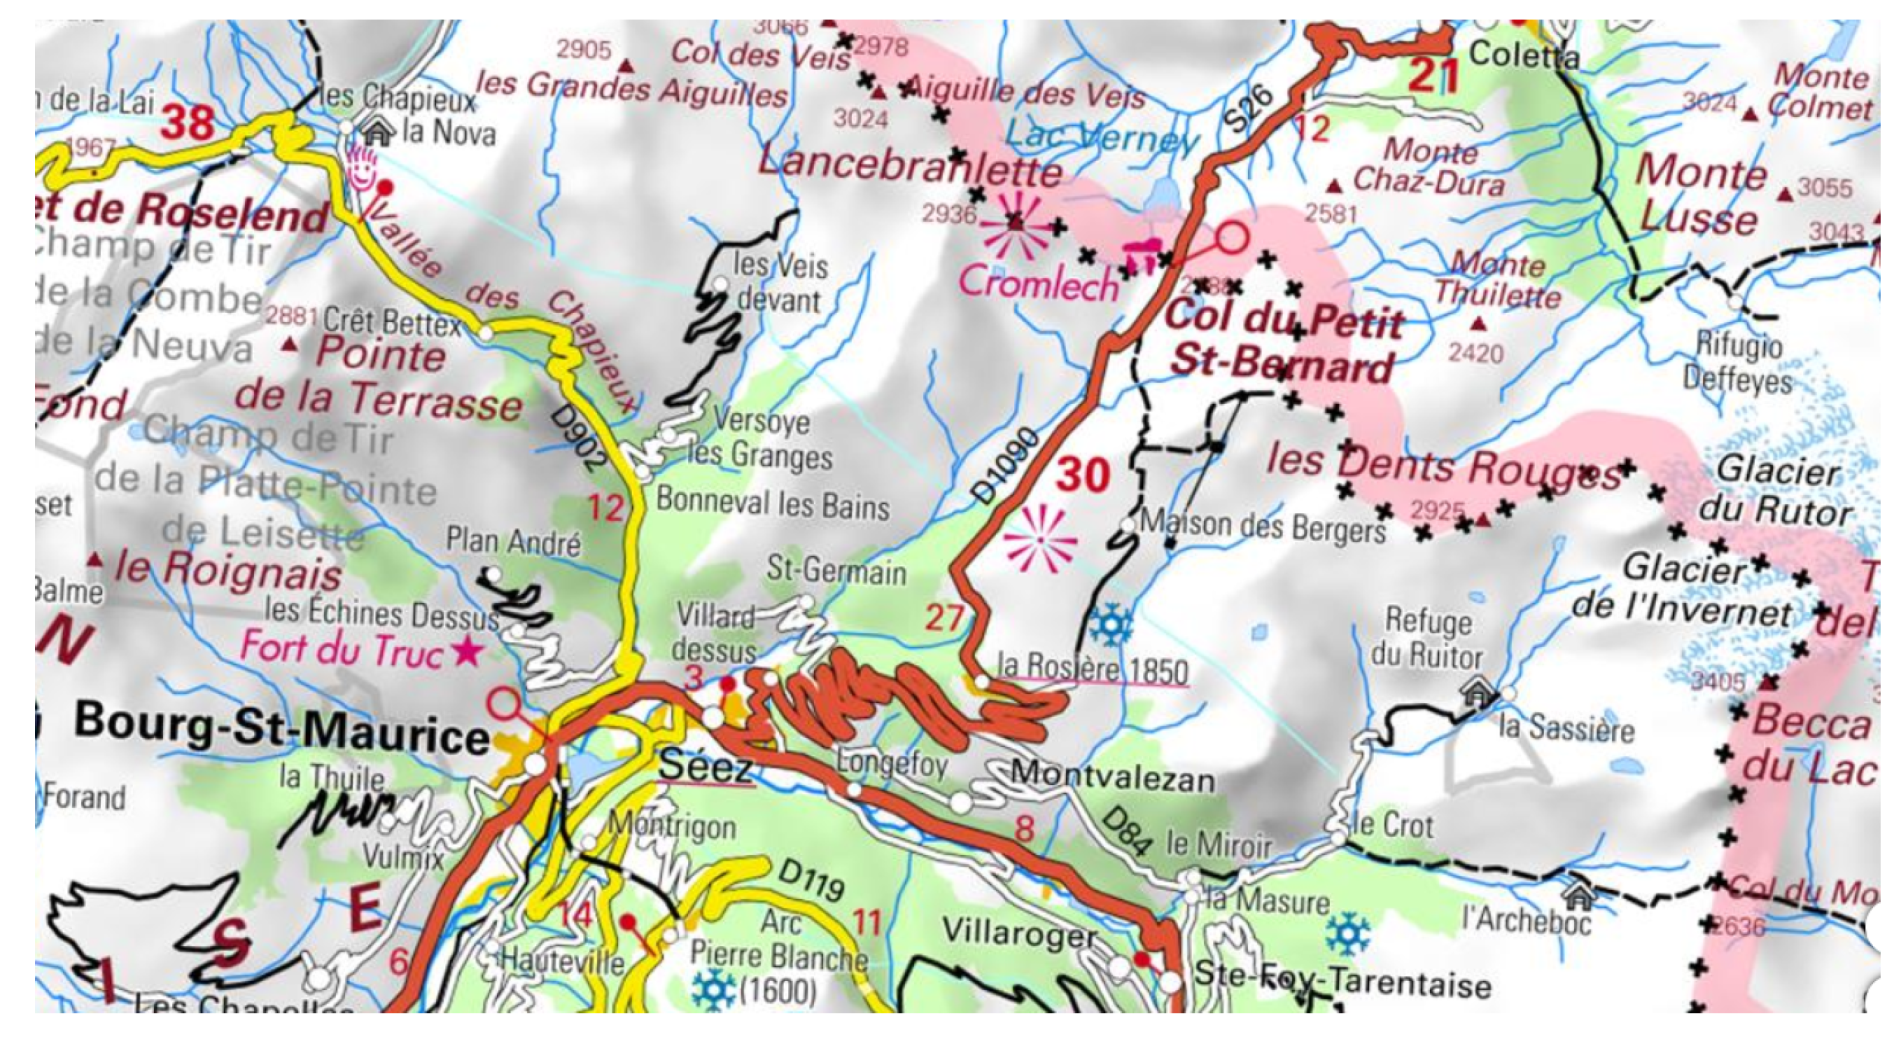
Figure 5). They were disoriented because they could not tell what this feature was, and they thought it could not be the border because it was not supposed to be visible at this scale, according to the scale estimation made during the exploration.
If we consider the Kobe story mentioned in the introduction as our fourth story (
), the last story we want to use in this article shows how the trust people have in a map can cause disorientation (
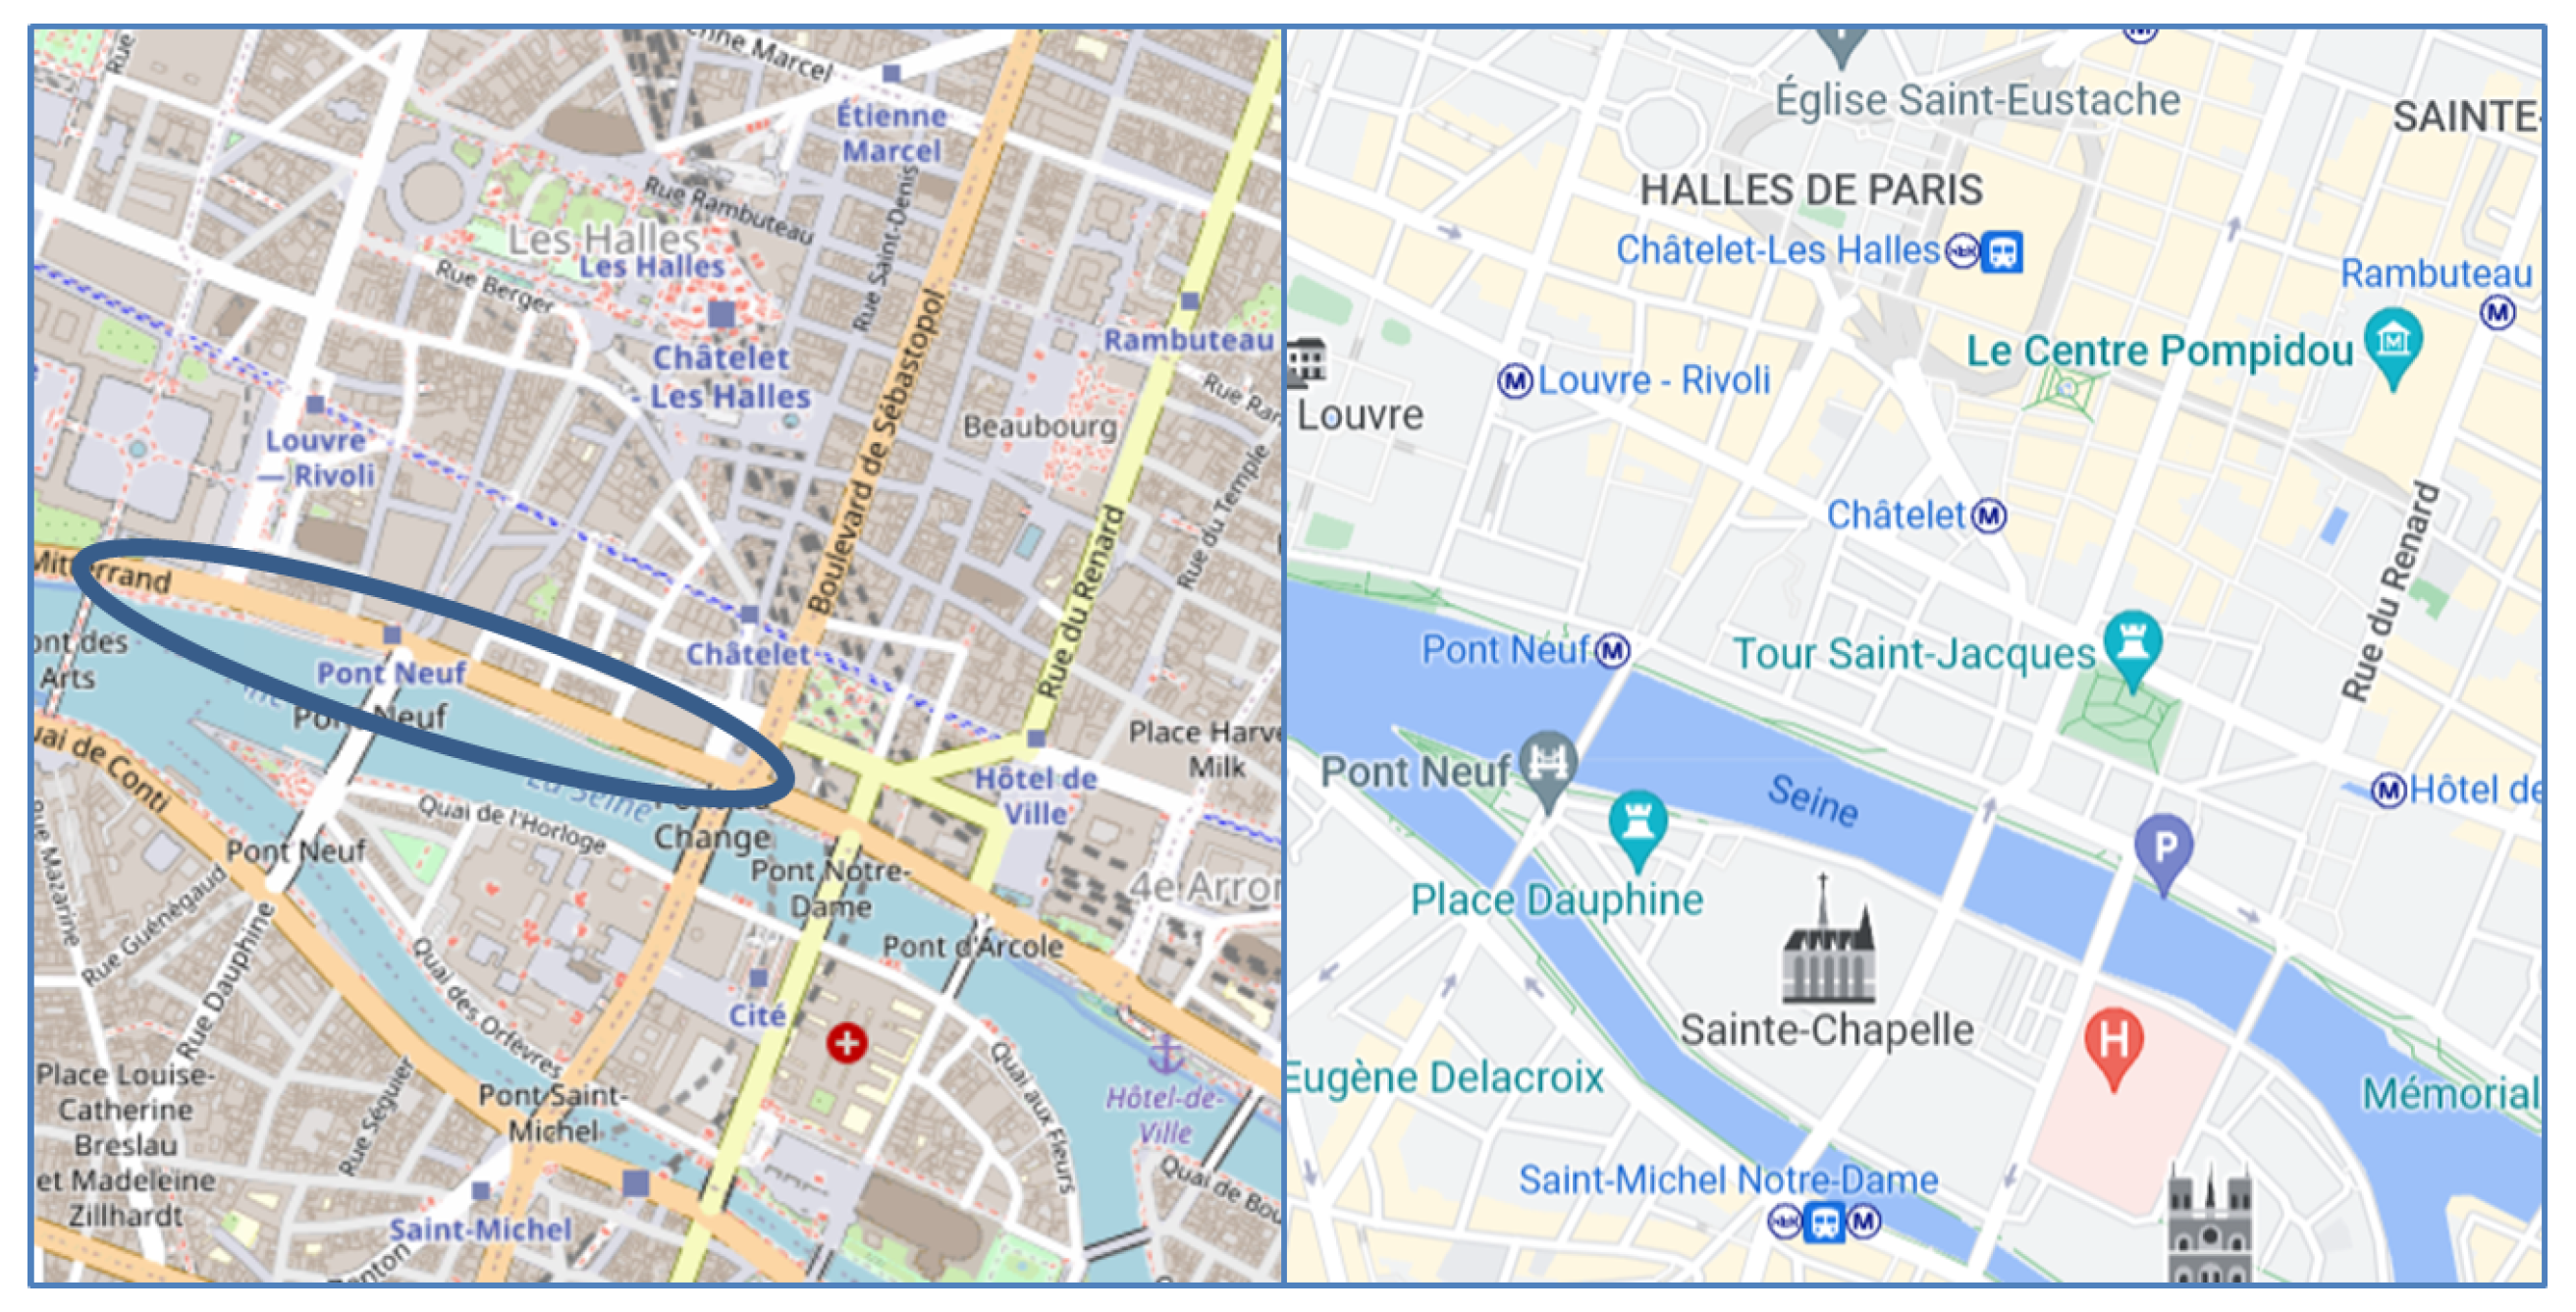
). Someone was zooming in on Paris, France using the OpenStreetMap.org pan-scalar map when they encountered a representation of the quays of the Seine River, which caused disorientation (
Figure 6). This part of the quay is now a pedestrian road, but it was represented as a secondary road on the map. As they trusted the map, the map reader became disoriented, suddenly questioning whether they were actually where they thought they were. If they had used Google Maps in this case, where the quay is rendered as a pedestrian road, then the disorientation probably would not have occurred.
4. Cartographic Disorientation as a Reconciliation Problem
4.1. A Model of the Exploration of Pan-Scalar Maps
To model the disorientation that occurs during the exploration of a pan-scalar map, we think that it is necessary to first better define what this exploration is exactly. We define pan-scalar map exploration as a function of time in Definition 3:
Definition 3. The exploration of a multi-scale map is the function , which gives a map view (i.e., the map extract that appears on the screen) or a transition between views (i.e., a zoom or a pan) for any time t of the exploration.
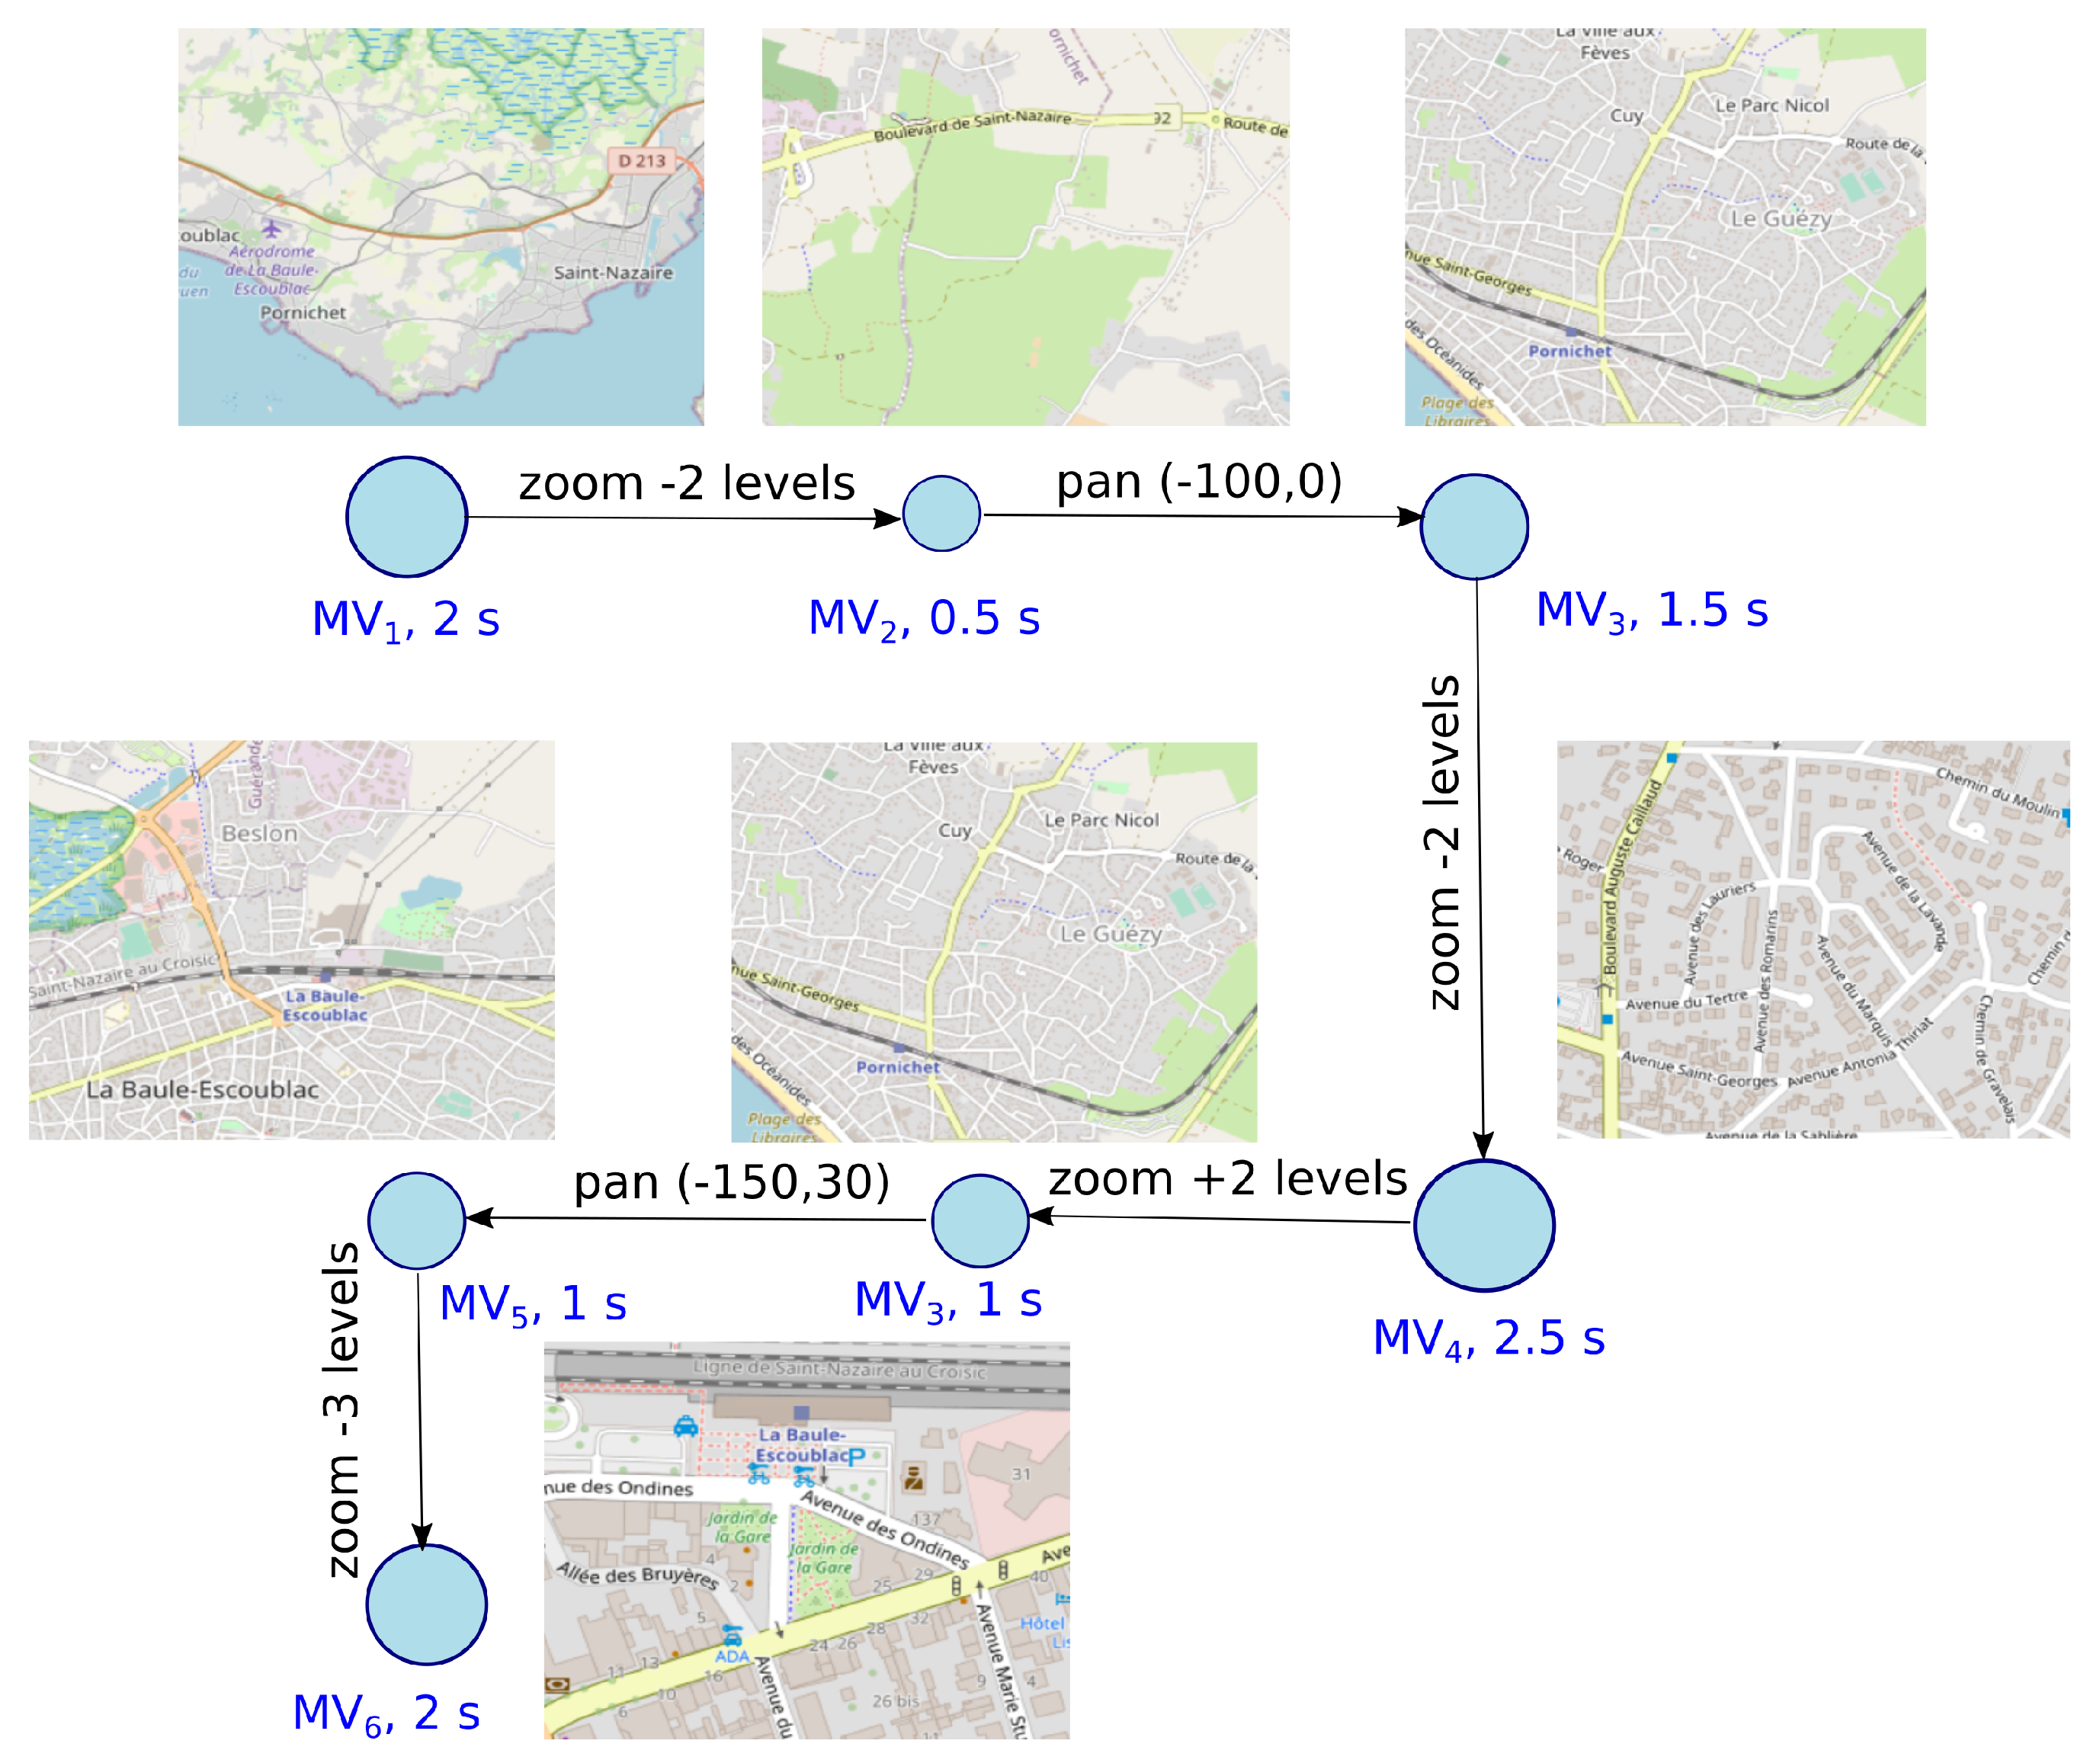
Figure 7 illustrates how the exploration can be deconstructed into several steps using this definition. In this example, the user is searching for the train station of La Baule in France. Starting with a small-scale view of the coastal town and its surroundings, the user searched for the railroad and zoomed in before quickly panning, as the zoom was imprecise and not centred on the railroad. Then, seeing a train station, the user zoomed in once again but realised that this new view (
) did not show the correct train station. After a zoom out and a pan, the user zoomed in again on a train station, and the visualisation of
confirmed that this was where the train station was. During this dynamic exploration, there were multiple times when the user could experience disorientation, and we can see that it is not only a single map view that users try to localise but a complete path.
4.2. Conceptual Model of Pan-Scalar Map Disorientation
In this section, we propose a model of (dis)orientation during the exploration of a pan-scalar map (
Figure 8). This model was inspired by the model of attention proposed in neurosciences [
25], as we assume that orientation is both a pre-attentive and attention-based cognitive process [
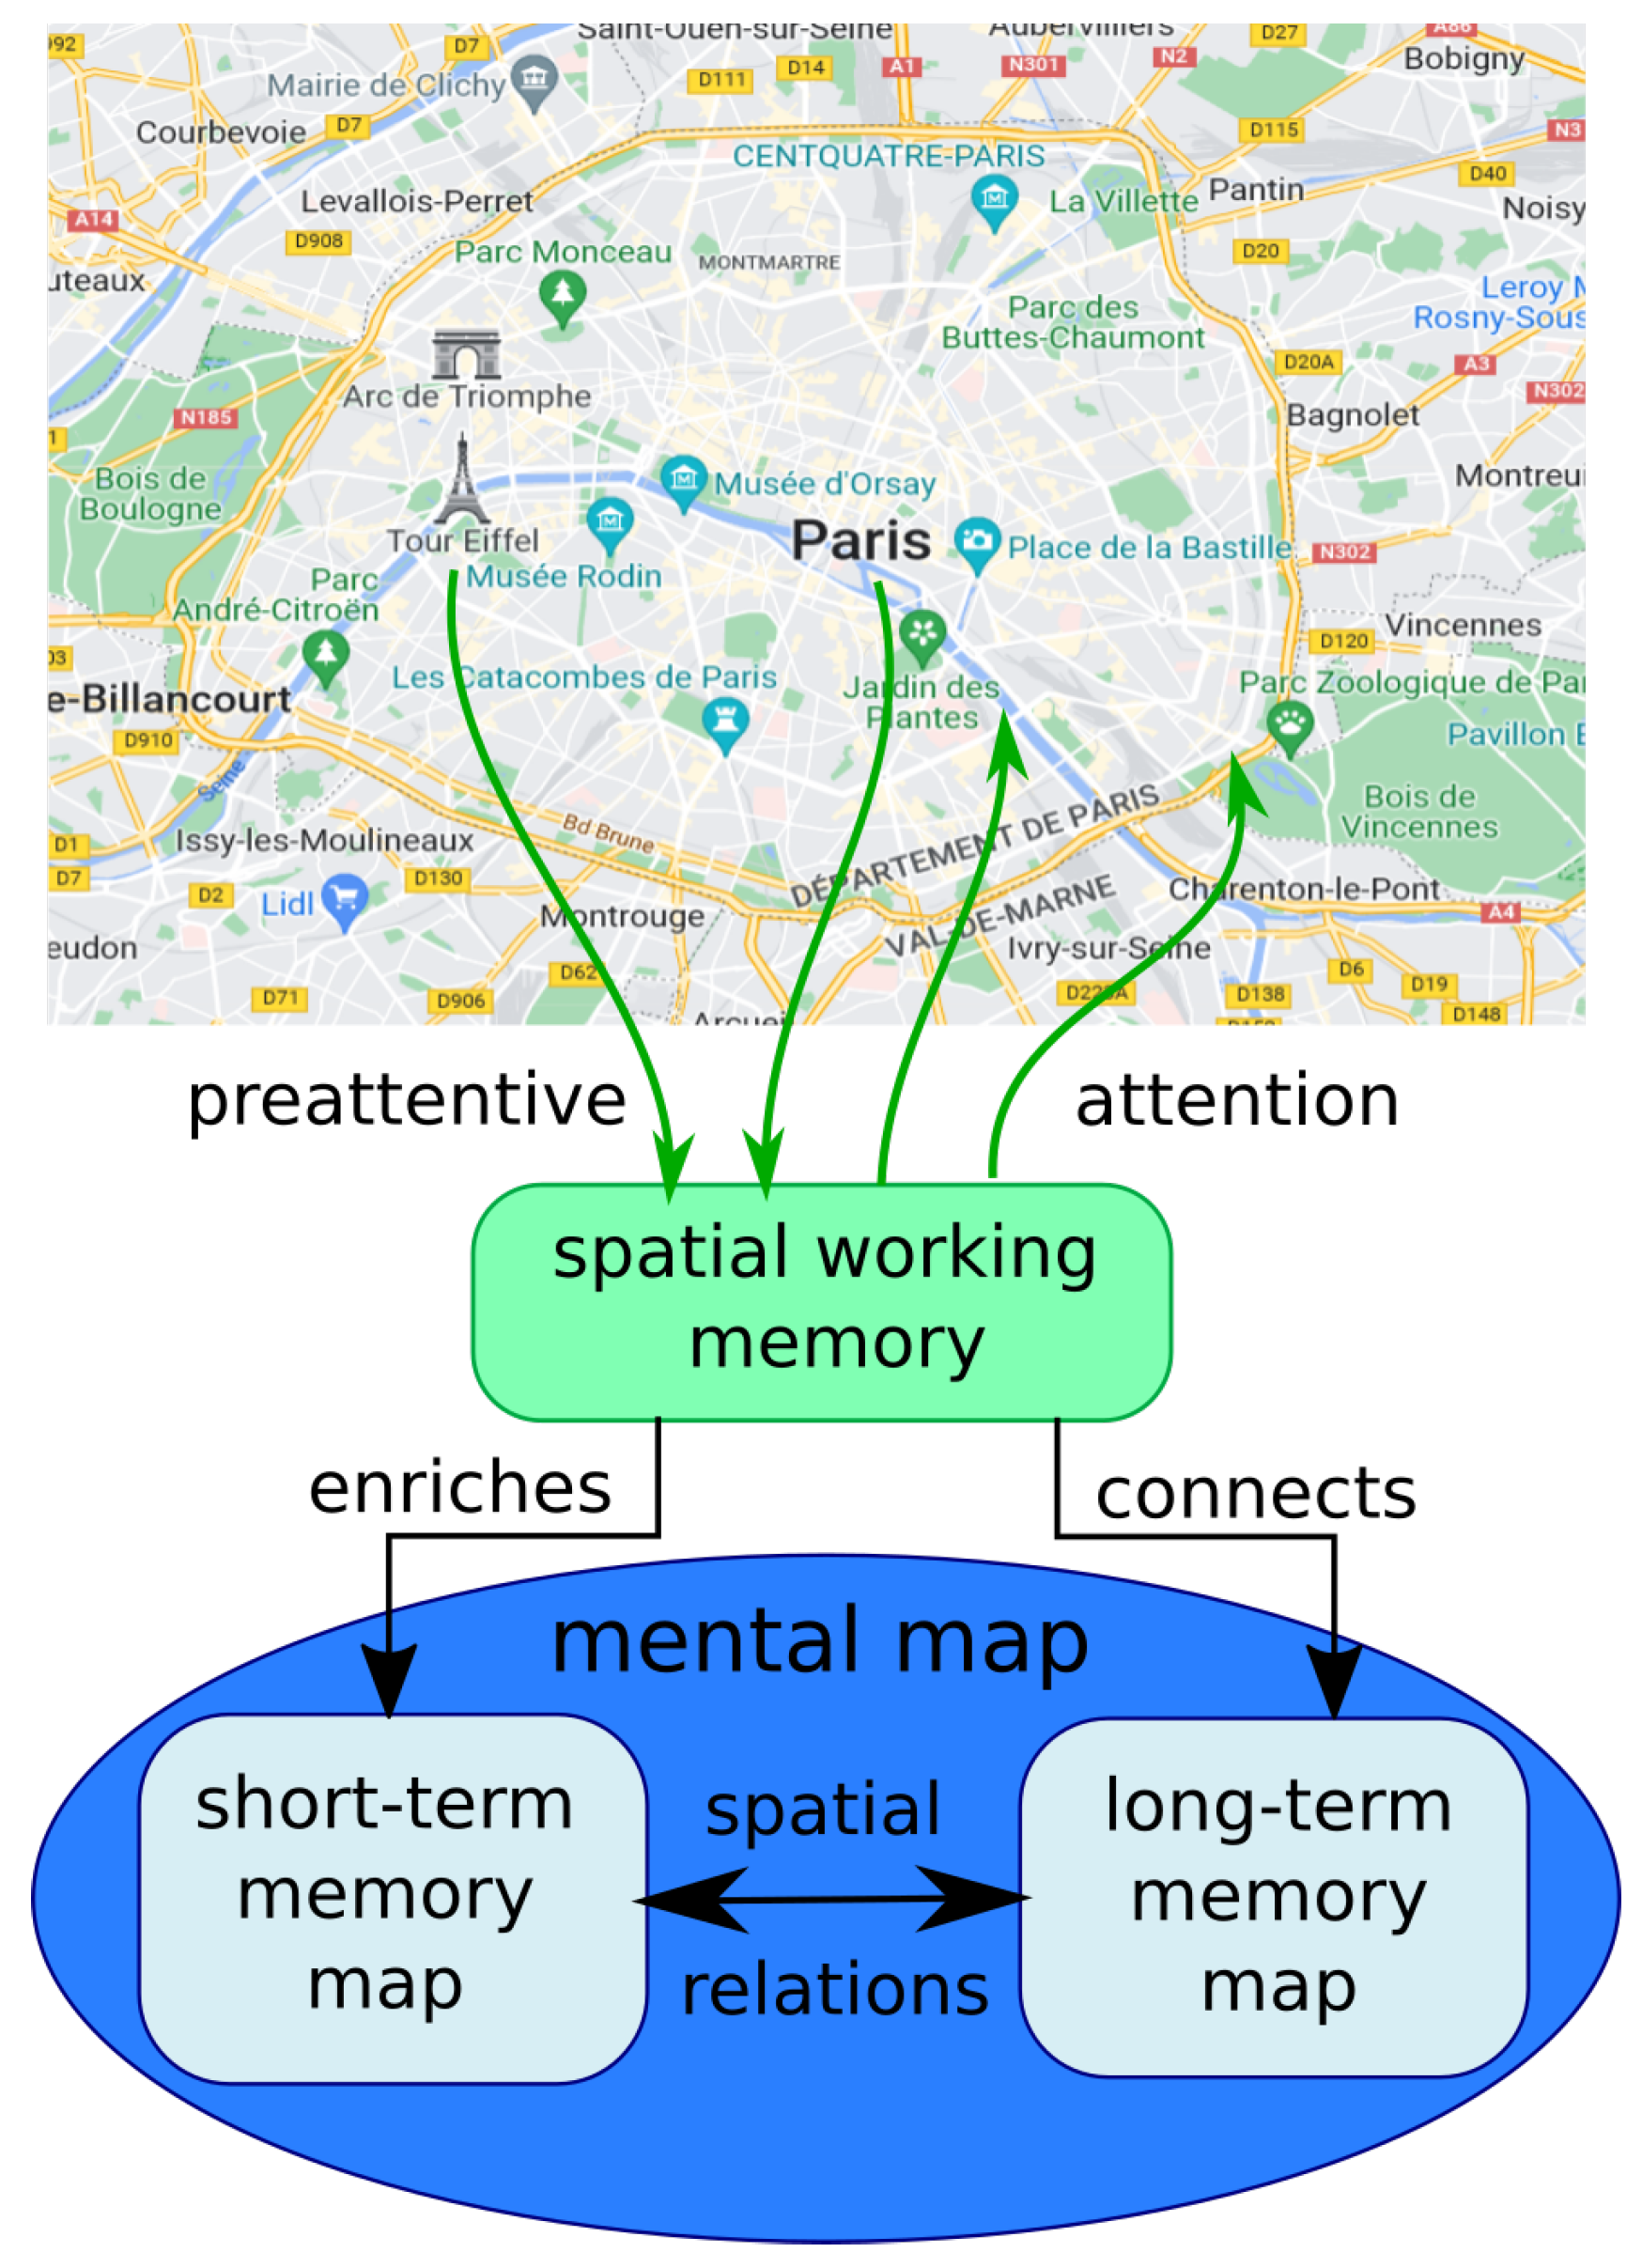
23]. We argue that orientation is a reconciliation process conducted by the spatial working memory [
23,
25] between the views of the map (and even the whole exploration path) and the mental map.
In this model, we differentiate the three types of memory: working memory, short-term memory and long-term memory [
26]. The working memory, and more precisely the spatial working memory, is the brain component that processes the spatial information that we see and reconciles the information with our mental representation. This mental representation can use short-term memory, the part of the memory that is easily accessible but suffers from limited storage capacities and decays over time [
27,
28]. This is where we store the large river that we saw in our previous map view before zooming. Obviously, the mental representation is also mainly stored in the long-term memory, which knows that Paris is the capital of France and contains the famous Eiffel Tower (
Figure 8). The more we remember the past views of the map and connect them to our long-term memory mental map, the better we reconcile the current view. This is why it is important to study how memorable a map is [
29,
30,
31]. Mental maps and representations are much more complex than physical maps; they are a cognitive collage [
32] or a cognitive multi-scale atlas [
33] (i.e., a set of fragments of mental maps) at different scales and locations connected with topological (mainly) and metrical (sometimes) spatial relations.
The theory of anchors states that these fragments of mental maps are connected by important landmarks or cognitive regions (a person’s home, workplace and the city he or she lives in) that are spatially connected with the other elements of the mental map [
34]: “Cognitive regions are regions in the mind, reflecting informal ways individuals and cultural groups organise their understanding of earth landscapes” [
35]. For most French people, France, Paris or the Alps are cognitive regions that people have stored in their long-term mental maps. We consider that the atomic components of the mental representation are either cognitive regions or landmarks [
36,
37] when the atomic element is too small or thin to be considered as a region containing other regions or landmarks. For instance, apart from perhaps people having strong and repeated experiences inside the Eiffel Tower, the tower cannot be considered a region but more a punctual landmark.
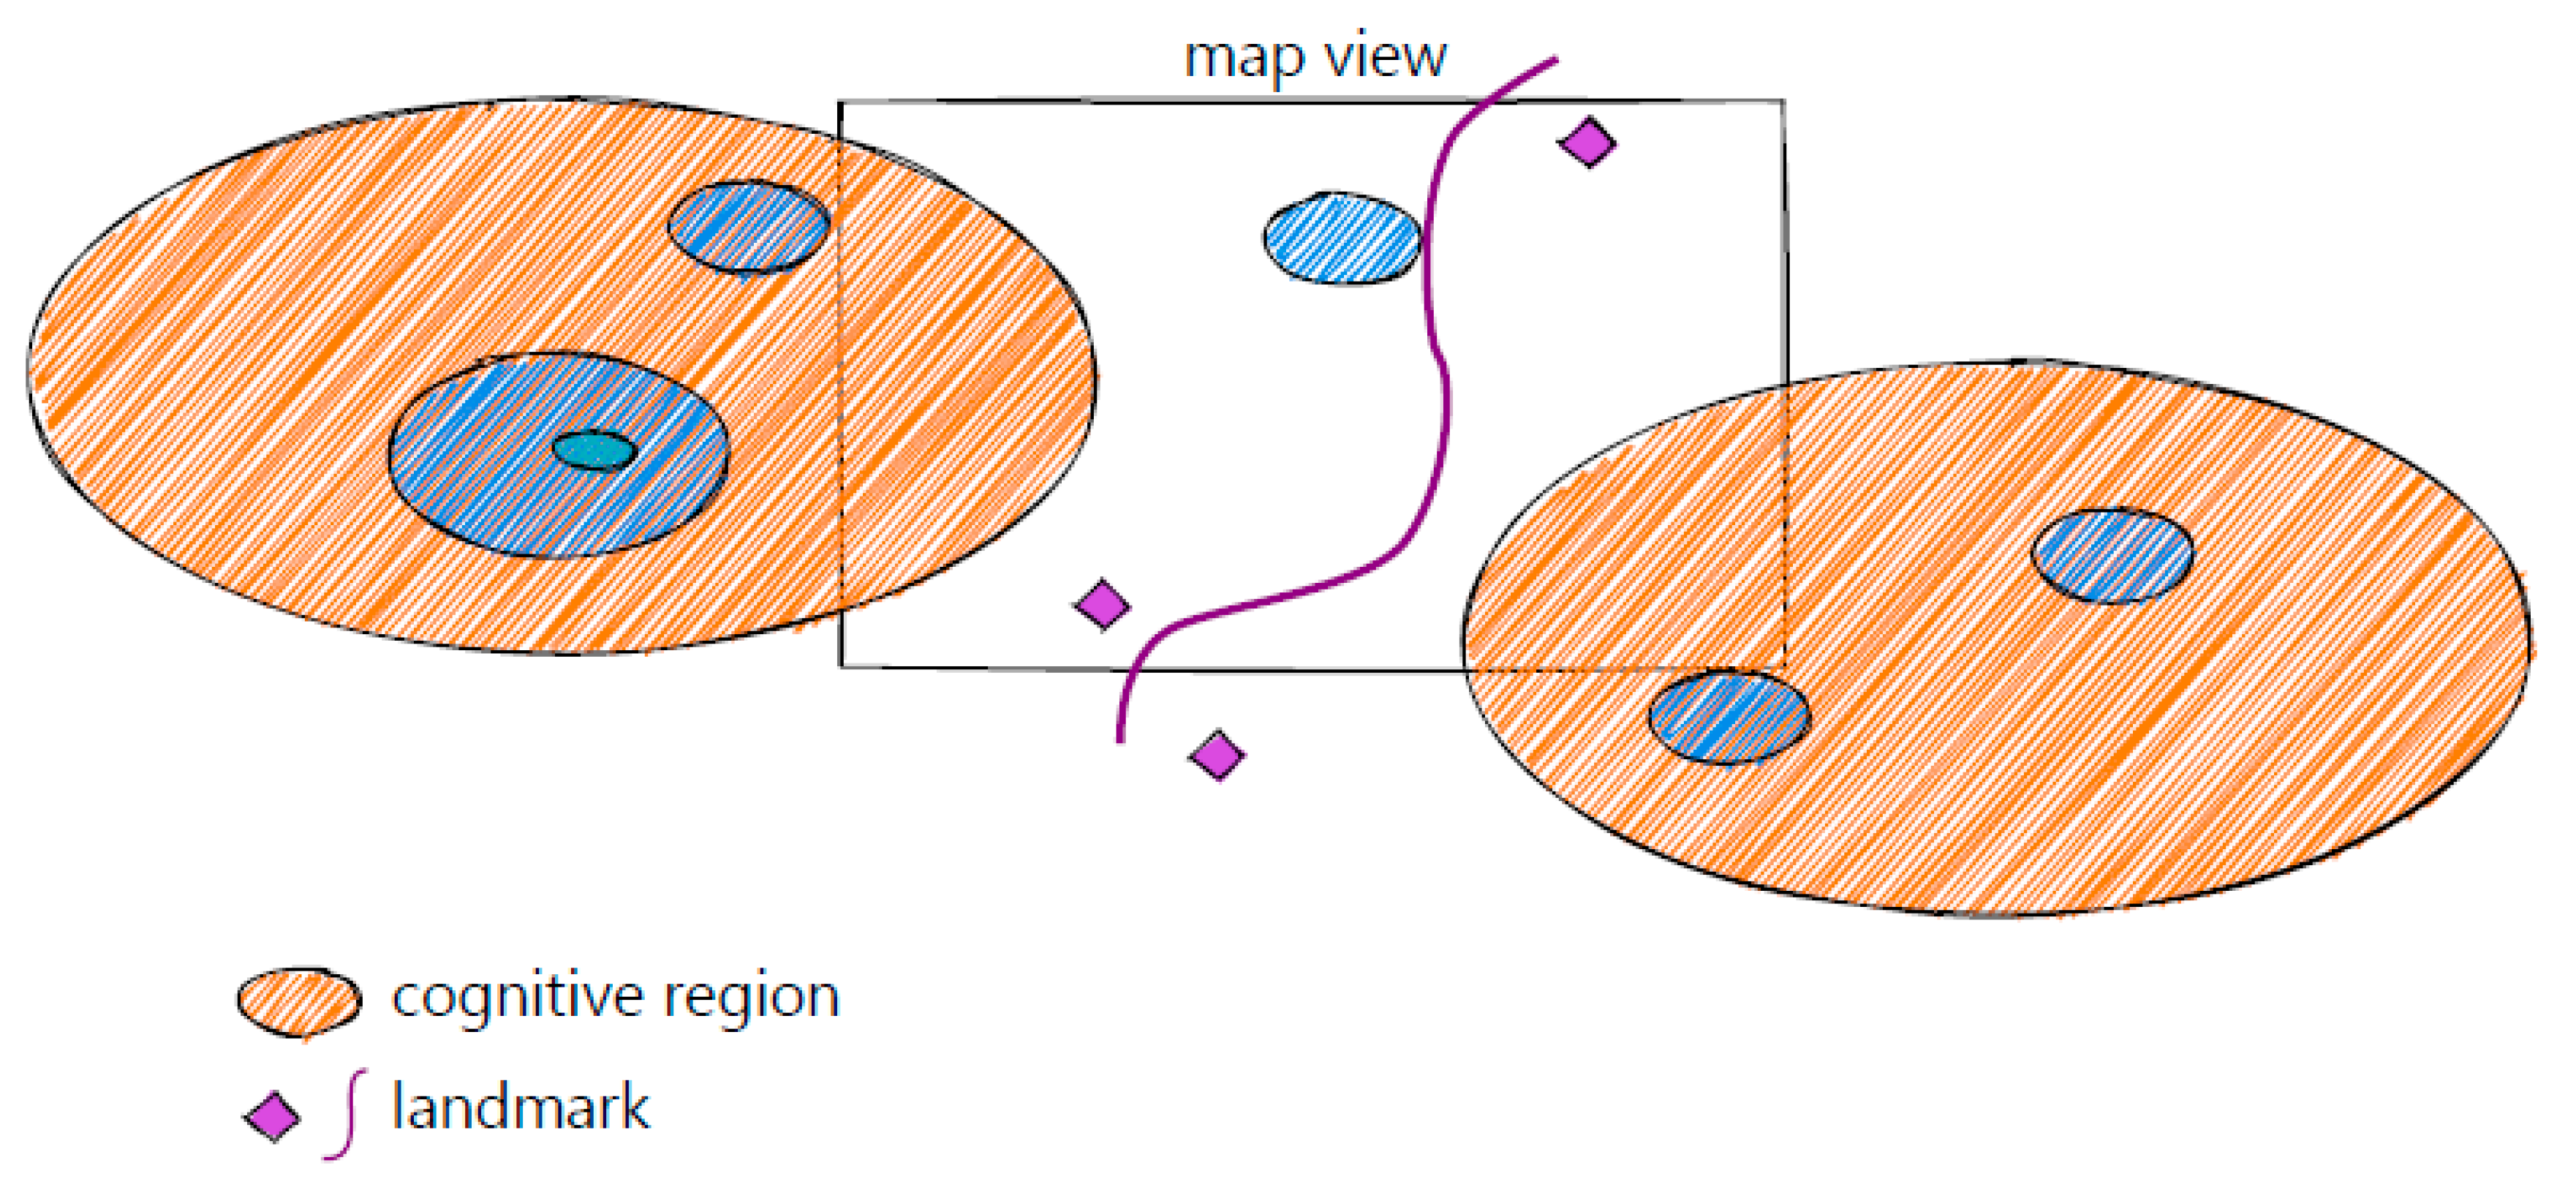
Figure 9 further illustrates the principles of the reconciliation as a process similar to the georeferencing of an aerial image with control points but in a much less metrical way. When a symbol of the map or a group of symbols is interpreted as matching one of the cognitive regions or landmarks from the short-term or long-term memory, it serves as a control point to reconcile the map view and the mental map. Similar to georeferencing, several control points are often necessary to reinforce a reconciliation. As there are different modes of cognition [
23,
38], there are different modes of reconciliation. A first mode would be a pre-attentive one, which is automatic, fast and imprecise but gives a “local and acceptable result”. A second mode would be modulated by attention and “operates slowly and stepwise, intensely uses working memory, and is, in general, more accurate” [
23].
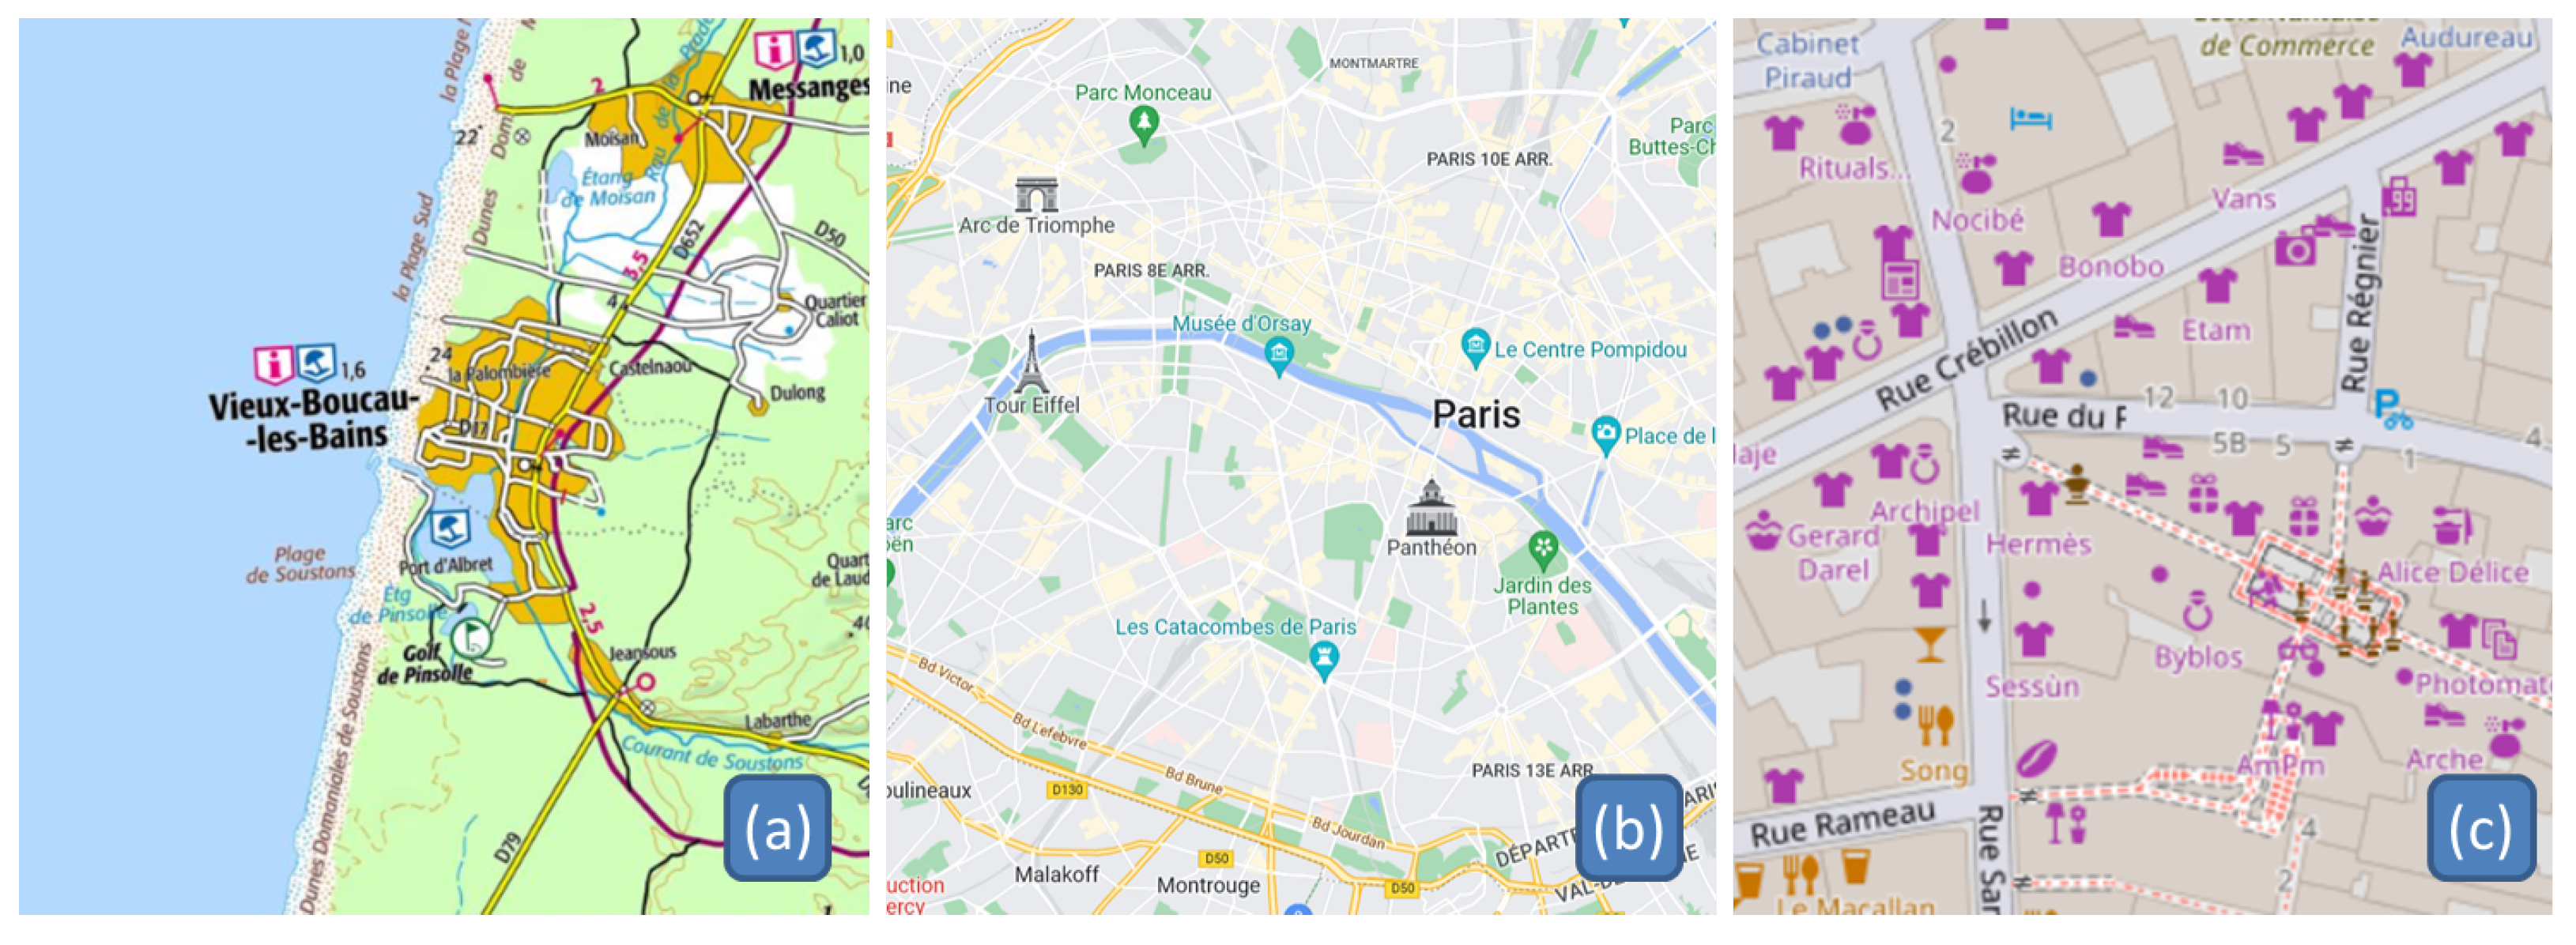
Figure 10 illustrates with three maps the factors that can influence the first mode of reconciliation: the pre-attentive phase. This pre-attentive mode would be guided by Gestalt considerations [
39,
40], as pre-attentive salient structures help this first match with the mental map. In the map of
Figure 10a, the sea clearly stands out as a Gestalt element and can be pre-attentively matched to the cognitive region of the Atlantic Ocean. More generally, this pre-attentive phase is the one where the reader makes sense of the cartographic symbols [
41,
42,
43], so a clear cartographic language with symbols and colours that are easy to interpret should help this first reconciliation.
Figure 10b illustrates the importance of saliency [
44] in the pre-attentive phase, as some symbols are really salient. Finally, the role of clutter is illustrated in the third map, where the amount of similar symbols in terms of colour and size limits the pre-attentive recognition of landmarks and cognitive regions [
45,
46]. The pre-attentive visual variables have gained recent interest in cartography [
47,
48], and it will be beneficial to understand what makes a map symbol pre-attentively remarkable.
Regarding the second mode of reconciliation, where attention is involved, the research covers visual searching [
49,
50,
51,
52,
53]. In particular, the guided search theory is interesting because it explains that searching for a target in an image is guided by both top-down (i.e., the attention) and bottom-up (i.e., what stands out in the image) information [
52]. If this visual search is too complex because of the bottom-up information, the cognitive load of the task [
54] might be too heavy and cause disorientation. If we focus more on the literature in cartography, the role of text is prominent in this attentional mode of reconciliation [
55]. The reconciliation is easier if we can see and read text information that refers to our cognitive regions.
4.3. Causes of Failed Reconciliations
In this section, we discuss how the proposed model can explain different causes of disorientation in the use of a pan-scalar map. We first propose four causes for being lost during exploration:
The person has no mental representation of the map view and its surroundings in space and scale, which may occur when exploring an area he or she does not know, such as in the Kobe example (). This means that the map exploration at previous scales did not provide enough landmarks to reconcile with the map view.
A drift in the past reconciliations of the exploration can also cause disorientation. If the past reconciliations slightly deviate, with each time leading a little more deviation, then one end up being unable to reconcile his or her mental representation with the map view. This can happen, for instance, when using long landmarks, such as the Spree River in Berlin in ().
The lack of landmarks in the map view can also cause a failed reconciliation, even though one has a mental representation of the map view. This can be due to a cluttered map view [
45], for instance, or by design choices (e.g., a person use the subway stations in his or her mental representation of Paris, and they do not appear on the map). The situation in (
) also shows that landmarks can be there but are deceptive (lack of updates, for instance).
There can be confusion with the interpretation of map signs, which prevents the reconciliation. The last two items show that multi-scale map exploration is not yet
fluid, as defined by Elmqvist et al. [
56], as there are problems in promoting flow and direct manipulation of the maps during exploration. In this paper, (
) and (
) are two different examples where the map signs were not interpreted correctly.
There can be a spatial distortion between the map and the mental representation. The situation in () is an example of such a distortion where the mental representation is deceptive. As mental representations are based more on topology and spatial relations, this phenomenon happens frequently.
The cognitive regions, landmarks, anchors, cognitive images, geographical concepts, etc. our mental representation is built on are mentally dependent on the scale [
18,
19,
57]. This is what can be called the persistence of an element [
19]. When one reconciles the map with his or her mental representation, one somehow guesses the scale of the map while connecting its landmarks and cognitive regions to the ones of his or her mental map that are also related to a scale. The situation in (
) shows that when one’s guess of the scale is wrong, the reconciliation can fail.
Pan-and-zoom expertise or just map exploration experience plays a role in the success of the reconciliation process. For a given task to accomplish with a pan-scalar map, there is an infinite number of possible exploration paths, but not all of them are efficient, and some will cause more disorientation than others. Expertise helps in choosing the good (if not optimal) exploration paths.
We have seen in the definitions that disorientation is not only being lost but also being aware of being lost, so we also reviewed the causes for discovering that one is lost when exploring a pan-scalar map:
Reconciliation is a dynamic process, and we update the reconciliation of our entire exploration path at each view. We also anticipate the reconciliations at further scales, and this anticipated reconciliation can fail, making us realise errors or drifts in our past reconciliations.
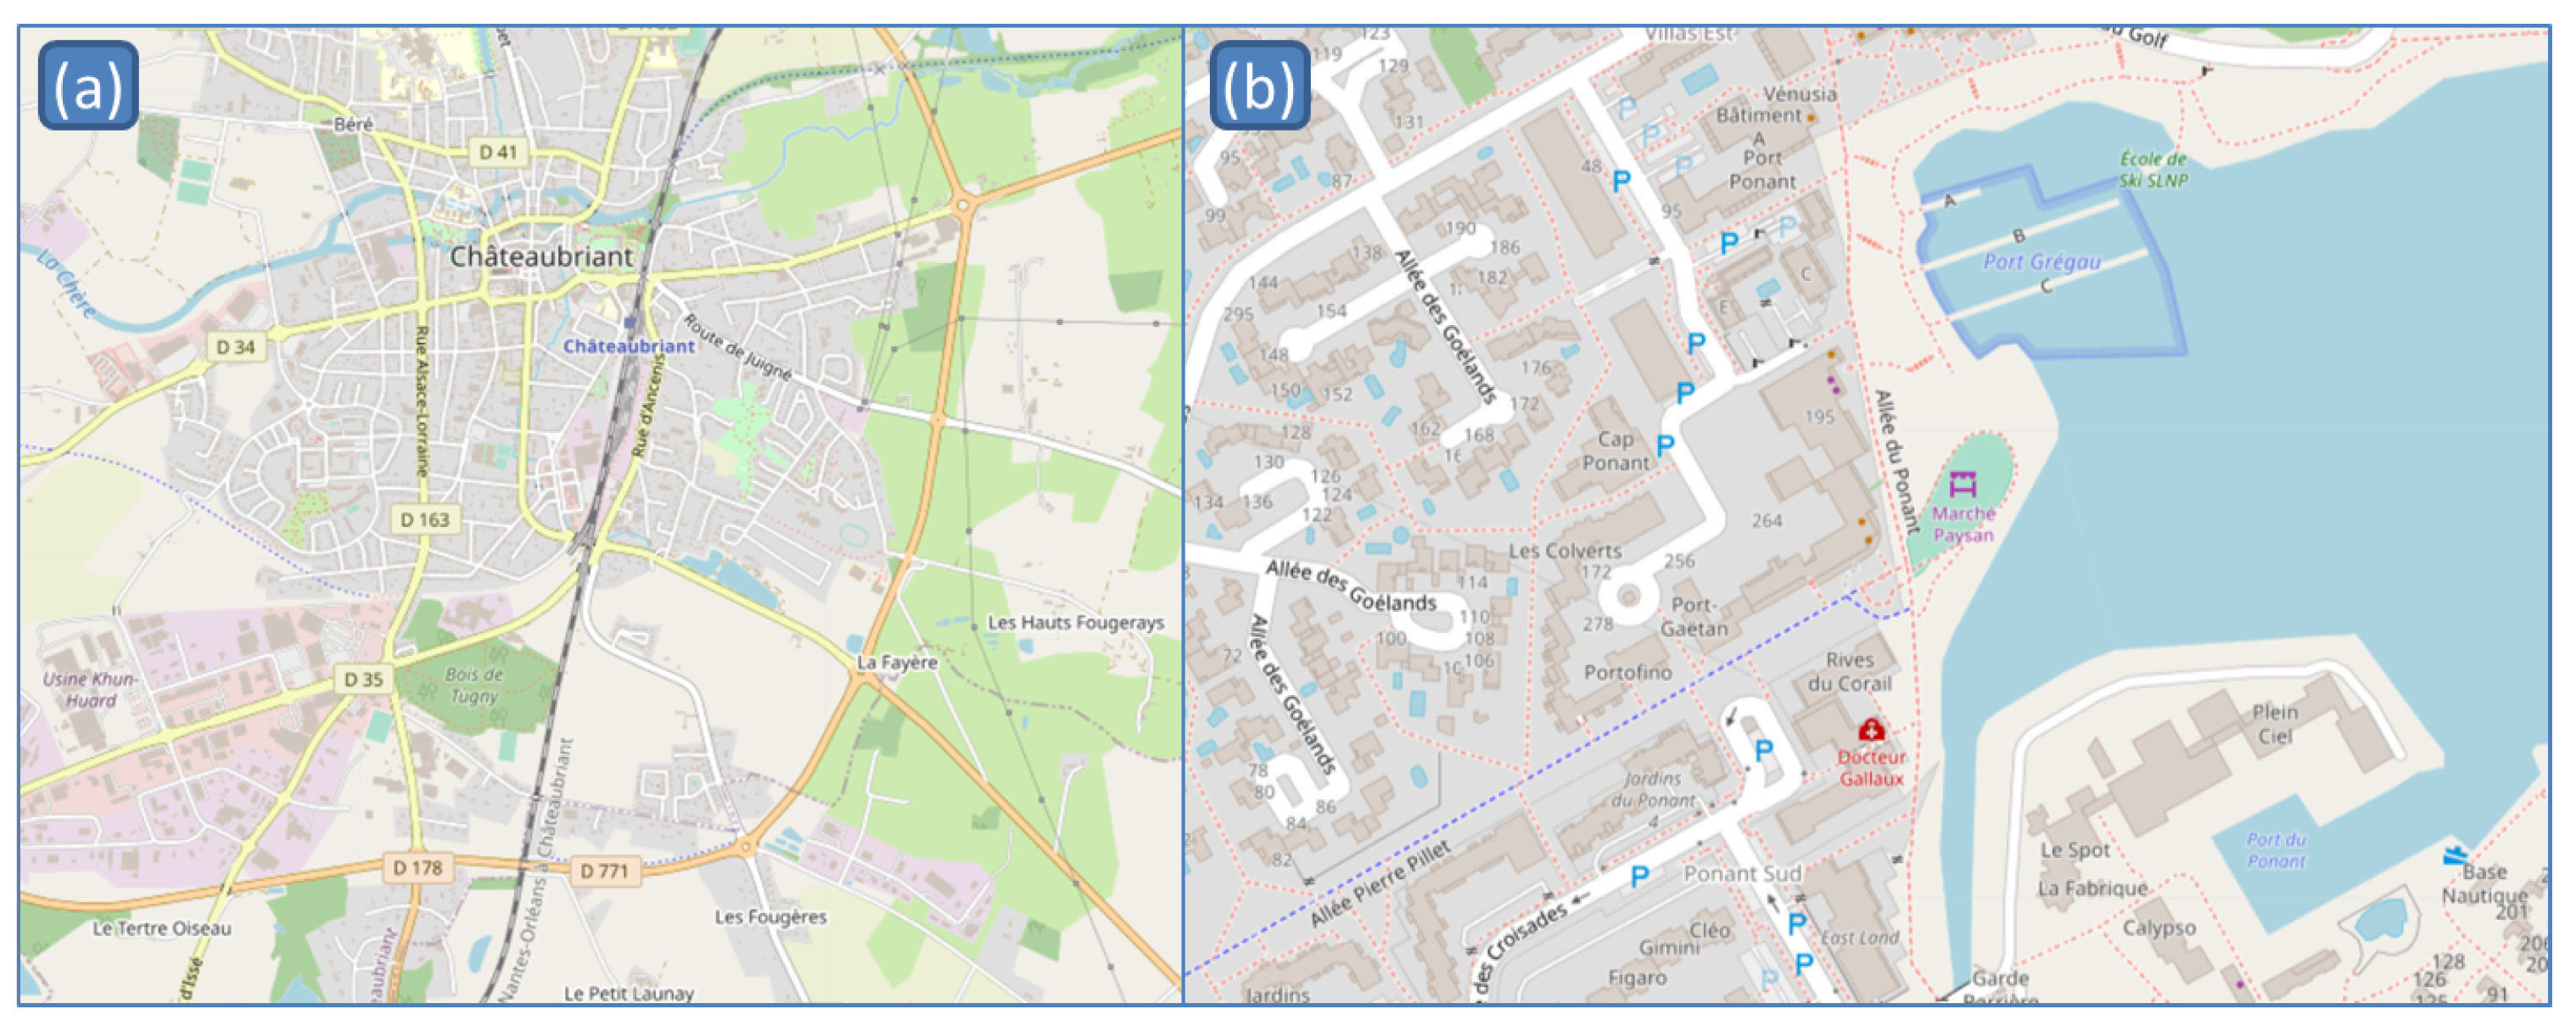
Figure 11 shows two examples where our brain might anticipate what we will see when zooming out. On the left, the half-circle formed by the orange road is deceptive if we anticipate seeing a full ring road, and on the right, in this map of a coastal town, we anticipate the blue area to be the sea, but it is a lake, and the sea is south of this place. More simply, if one cannot find on the map the restaurant or museum he or she is looking for, it is a signal that he or she is lost.
The contrary might also bring awareness of being lost (i.e., the presence of a known landmark that should not be there). This is quite common when zooming in heavily on a map (e.g., if one wants to zoom in on New York, and Boston appears after the zoom, then one knows that he or she is not where he or she is supposed to be and zooms back out).
The lack of landmark and cognitive regions in the map view is a cause for being lost but also helps to realize one is lost.
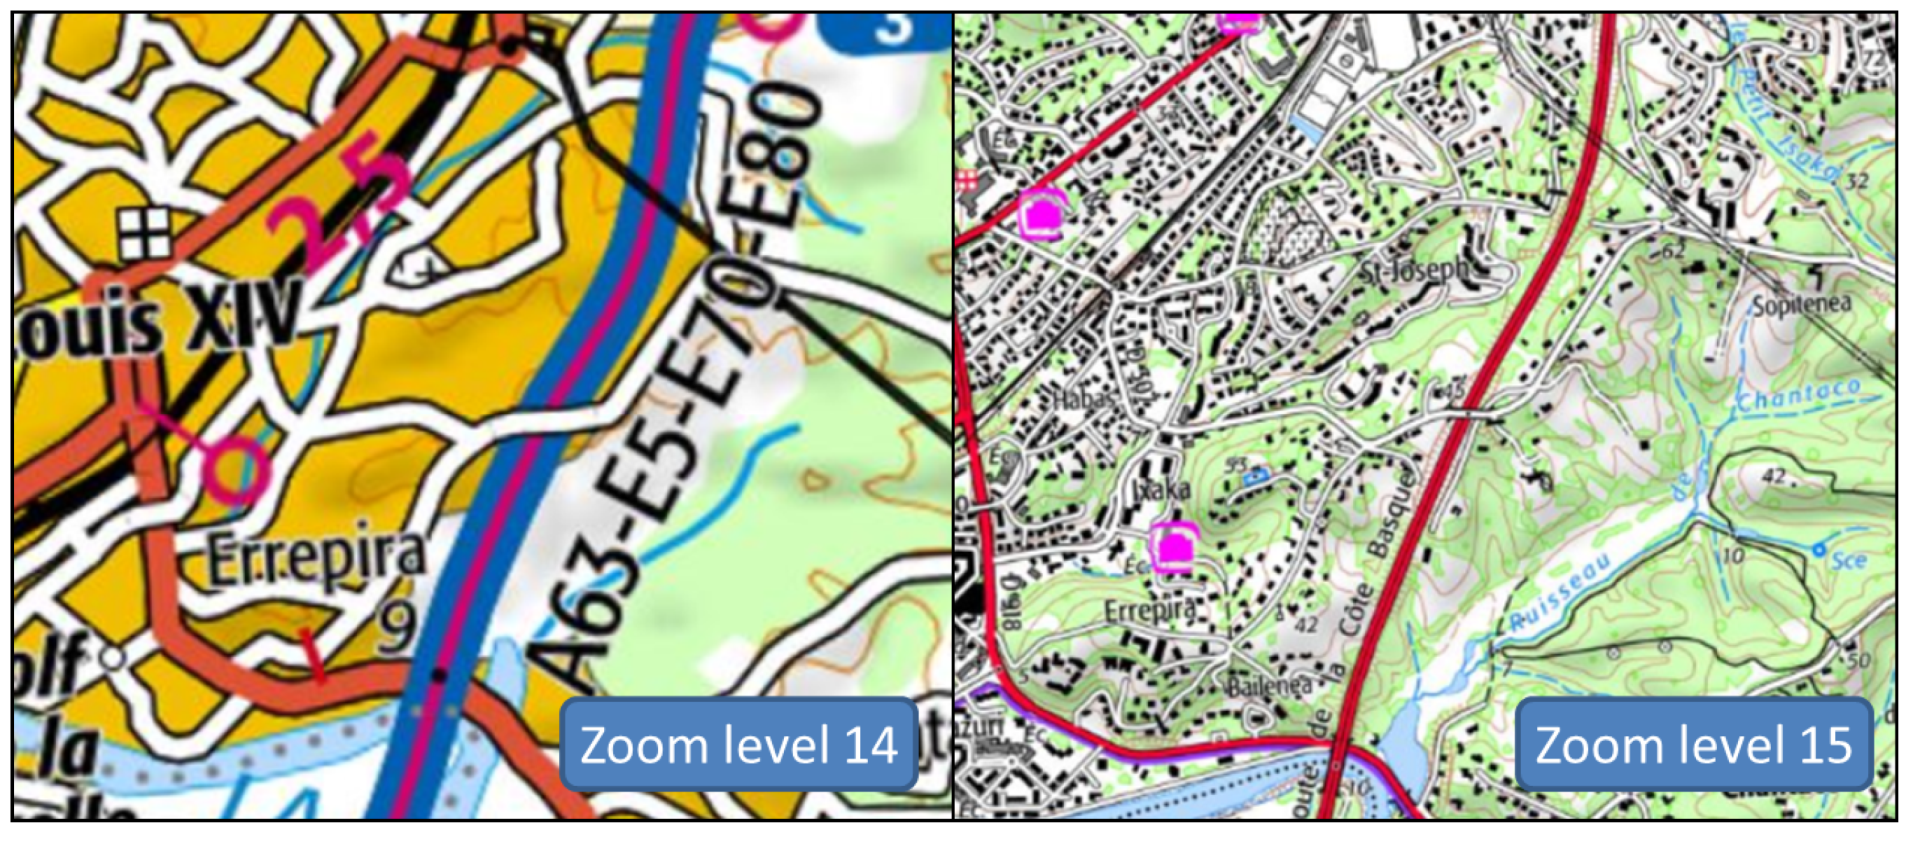
We can also differentiate the cases of failed reconciliation based on the duration of this failure. Sometimes, the reconciliation fails at a pre-attentive stage, but then an attention-guided search in the map helps one reconcile it with his or her mental representation. This happens when the map changes a lot with a zoom, and a person cannot use the landmarks from the previous map view for a pre-attentive reconciliation (
Figure 12). We can link this short disorientation to the desert fog effect [
2]. When the disorientation goes beyond the pre-attentive observation of the map view, and even a closer inspection of the map cannot reconcile with one’s mental representation, then this is not only a desert fog effect, and the disorientation feeling is quite similar to the one occurring when people get lost during a trip.
5. Pan-Scalar Anchors
Though inspired by the anchor theory in spatial cognition [
34], what we call a pan-scalar anchor is a different concept, mainly because the pan-scalar anchors are elements of the pan-scalar maps and not of the mental representation [
4,
58]:
Definition 4. A pan-scalar anchor is a cartographic symbol, group of symbols or spatial relation between symbols that is salient or recognisable in all the maps at several consecutive zoom levels.
As a consequence, pan-scalar anchors would reproduce in the map the role that anchors have in our mental representations. A pan-scalar map with many good pan-scalar anchors should be much easier to reconcile, as long as the anchors are the same in the map and the mental representation of the user. We make the assumption that the current pan-scalar map lacks good anchors, either because the potential anchors are not visible in scale ranges that are large enough or because when they are visible on the map, they are not pre-attentively visible, or they are too transformed across scales to be visible as one anchor. To illustrate this assumption, we list below the anchors used by the protagonists of our five stories.
In (), there were three anchors used by the protagonist: the Spree River, the fork confluence point of the Spree close to the monument and the park around the monument. However, these anchors were not used initially when disorientation was experienced, and we can wonder if this was due to a lack of expertise or if it was because these anchors were not so salient at the smaller scales.
In (), the anchors were clearly cited by the protagonist (i.e., the sea, the Loire River, the beach point and the town of Saint-Brévin). However, disorientation was not caused here by a multi-scale exploration path, so it was not possible to argue if these were good anchors.
The situation in () is interesting because it shows how several pan-scalar anchors with a good spatial distribution could help to easily grasp the approximate scale of the map view. Here, the only anchors used during zooming were the town of Bourg-St-Maurice and the road in the valley that crossed the town. Another anchor, such as a prominent summit close to the border, would have helped the protagonist to understand that the large pink line really was the border because it was close to the summit.
The story in () is rather similar in terms of pan-scalar anchors. The claimed anchors were Osaka Bay, the port, which can be seen as a particular region of the bay, and the mountain above Kobe. However, there was no anchor in between in the city of Kobe, and when the protagonist zoomed in strongly, none of the three anchors were visible, causing disorientation. In this case, the protagonist had no long-term memory map, so they only relied on the short-term memory map enriched with the visual anchors, but there was nothing salient in this pan-scalar map aside from the three aforementioned anchors.
The final story () focused on the centre of Paris, where the anchors were the Seine River, Sebastopol Boulevard and Cité Island, which served as control points to precisely locate where the quay became a pedestrian street. In this case, the anchors played their role, but it was another element of the map that caused the disorientation. The strength of the anchors (there was no doubt in the protagonist that they were looking at the right place) convinced them that there was a problem with the map and not with the orientation.
6. Discussion
Though the vision components of the presented model focused on attention, the peripheral vision represents 99.9% of a visual scene [
59], and it undoubtedly plays a role in the reconciliation process. The information in the peripheral vision is lossy [
60], but it is used in most visual tasks, such as visual searching [
59]. For instance, peripheral vision is used to obtain the “gist” (i.e., the context of a visual scene) [
61], which might be important for reconciliation of the map scene with specific regions. As a consequence, we believe that the proposed model should be extended by considering the role of peripheral vision in the reconciliation and its role when reconciliation fails. Research on the role of peripheral vision for different tasks should be studied to understand how it applies to the reconciliation process in pan-scalar maps [
62].
Though the model for pan-scalar (dis)orientation proposed in this paper is based on factual experiences of disorientation, it requires experimental results to show how much it explains or does not explain the disorientation people can feel during their exploration and their use of pan-scalar maps. User studies are common in cartography [
63], and different methods can give feedback on different parts of the model. First, the pre-computer technique of paper-and-pencil drawings has been extensively used in spatial cognition but is still valid with pan-scalar maps. The participants in a user study can draw one’s mental representations of their exploration path, following past research on mental representations [
64]. We can also ask participants to draw on the map to mimic the attention phase, as drawing requires attention [
23]. As disorientation is also a feeling of disorientation, we believe that think-aloud techniques [
65] are necessary to really capture the motives of disorientation. Obviously, eye tracking will be necessary to analyse the pre-attentive phase [
66] and understand how much eye fixations are used or if the peripheral view is key to collecting bottom-up landmarks. However, eye tracking could also be useful in analysing the paths of fixations and saccades [
67] during the attentional phase of reconciliation. As a complement to eye tracking, interaction logging (i.e., logging zoom and pan interactions [
68], or mouse movements [
47,
69]) should be useful for both characterising disorientation through interactions and assessing the impact of disorientation on these interactions. For instance, pan-scalar disorientation should cause more zooming in and out and back and forth. One last interesting method is to give the user a task that involves zooming [
70] and to assess how much failed reconciliations impact the success of the task.
The proposed model of disorientation is already based on neuroscience considerations, with the integration of attention and the three types of memory, but a much deeper use of neurosciences might be interesting in the future for two reasons. First, experimental techniques could be useful to better characterise brain activity during different types of reconciliations. Electroencephalography (EEG) has been used recently in cartography research to better understand the brain’s reactions during a task involving a map or a geovisualisation [
71,
72]. Such experiments could confirm that the two modes of attention for reconciliation do exist. Then, more precise techniques, such as functional magnetic resonance imaging (fMRI), which have already been used to study the impact of cartography on brain activity [
73] could help us better understand the interactions between the cognitive functions that decode the map and the mental representations stored in our memory. More generally, collaborations with neuroscientists would be necessary to better characterise the proposed model of pan-scalar (dis)orientation.
The last question we want to discuss in this paper is in fact the one, as cartographers, that initiated this research: how do we improve pan-scalar maps to reduce disorientation? From the experiences we collected in the corpus, we believe that disorientation is closely related to how pan-scalar maps are designed and used. If we analyse the differences between the way a single map and a pan-scalar map should be designed, then this can explain what we should do to improve pan-scalar map design.
First, a map at a single scale is designed to contain all the necessary information for its use in a single view, while a pan-scalar map should have the information optimally distributed across scales. If we consider only topographic maps, single-view maps are only designed for an attentional exploration of the map, while the pan-scalar map should be designed to allow both pre-attentional and attentional visualisations, as some map views are only short steps of the exploration path. This exploration path can also be used in the design of the map. For instance, instead of using size or color as visual variables to convey hierarchy, we can use the scale of appearance [
1].
In order to improve pre-attentional reconciliation, we believe that it is really important to design pan-scalar maps with salient pan-scalar anchors [
4]. The use of progressive or continuous map generalisation could be useful too, as would a reduction in cartographic clutter. To improve the ease of reconciliation, it is also important to favour the enrichment of mental representation during exploration.
In the case of places that the user does not have experience with prior to map exploration (), helping the user build a local mental map in his or her short-term memory could facilitate further reconciliations during exploration. One issue that is mentioned only indirectly is the speed of the current explorations of pan-scalar maps. People feeling disoriented usually pan and zoom very quickly during their experiences. We would like to test if going a little bit slower during zooming would help to better reconcile and reduce disorientation.
Finally, story (
) highlights the importance of the distortions between the mental representation, mostly based on non-metrical spatial relations, and the map. A more naive cartography [
22] might help to trigger a reconciliation based more heavily on those non-metrical spatial relations.
Author Contributions
Conceptualisation, Guillaume Touya and Maïeul Gruget; methodology, Guillaume Touya and Maïeul Gruget; validation, Guillaume Touya, Maïeul Gruget and Ian Muehlenhaus; formal analysis, Guillaume Touya, Maïeul Gruget and Ian Muehlenhaus; resources, Guillaume Touya; data curation, Maïeul Gruget; writing—original draft preparation, Guillaume Touya and Maïeul Gruget; writing—review and editing, Ian Muehlenhaus; visualisation, Guillaume Touya and Maïeul Gruget; supervision, Guillaume Touya and Ian Muehlenhaus; project administration, Guillaume Touya; funding acquisition, Guillaume Touya. All authors have read and agreed to the published version of this manuscript.
Funding
This project received funding from the European Research Council (ERC) under the European Union’s Horizon 2020 research and innovation programme (grant agreement No. 101003012, LostInZoom).
Data Availability Statement
Acknowledgments
The authors want to thank all the colleagues and friends that shared stories of disorientation with multi-scale maps with us.
Conflicts of Interest
The authors declare no conflict of interest.
References
- Gruget, M.; Touya, G.; Muehlenhaus, I. Missing the City for Buildings? A Critical Review of Pan-Scalar Map Generalization and Design in Contemporary Zoomable Maps. Int. J. Cartogr. 2023, in press. [Google Scholar] [CrossRef]
- Jul, S.; Furnas, G.W. Critical Zones in Desert Fog: Aids to Multiscale Navigation. In Proceedings of the 11th Annual ACM Symposium on User Interface Software and Technology, UIST’98, San Francisco, CA, USA, 1–4 November 1998; ACM: New York, NY, USA, 1998; pp. 97–106. [Google Scholar] [CrossRef]
- Bederson, B.B. PhotoMesa: A zoomable image browser using quantum treemaps and bubblemaps. In Proceedings of the 14th Annual ACM Symposium on User Interface Software and Technology, UIST’01, Orlando, FL, USA, 11–14 November 2001; Association for Computing Machinery: New York, NY, USA, 2001; pp. 71–80. [Google Scholar] [CrossRef]
- Touya, G.; Lobo, M.J.; Mackaness, W.A.; Muehlenhaus, I. Please, Help Me! I Am Lost in Zoom. In Proceedings of the ICA, Firenze, Italy, 14–18 December 2021; Copernicus Publications: Göttingen, Germany, 2021; Volume 4, p. 107. [Google Scholar] [CrossRef]
- Friedberg, M.S.d. Geographies of Disorientation; Routledge: London, UK, 2016. [Google Scholar] [CrossRef]
- Fernández Velasco, P.; Casati, R. Subjective disorientation as a metacognitive feeling. Spat. Cogn. Comput. 2020, 20, 281–305. [Google Scholar] [CrossRef]
- Montello, D.R. Geographic orientation, disorientation, and misorientation: A commentary on Fernandez Velasco and Casati. Spat. Cogn. Comput. 2020, 20, 306–313. [Google Scholar] [CrossRef]
- Montello, D.R.; Raubal, M. Functions and applications of spatial cognition. In Handbook of Spatial Cognition; American Psychological Association: Washington, DC, USA, 2013; pp. 249–264. [Google Scholar] [CrossRef]
- Koláčný, A. Cartographic Information—A Fundamental Concept and Term in Modern Cartography. Cartogr. J. 1969, 6, 47–49. [Google Scholar] [CrossRef]
- Robinson, A.H.; Petchenik, B.B. (Eds.) The Nature of Maps; University of Chicago Press: Chicago, IL, USA, 1976. [Google Scholar]
- Taylor, D.R.F. Graphic communication and design in contemporary cartography: An introduction. In Graphic Communication and Design in Contemporary Cartography; Taylor, D.R.F., Ed.; John Wiley & Sons: Hoboken, NJ, USA, 1983; pp. 1–10. [Google Scholar]
- Castner, H.W. (Ed.) Seeking New Horizons: A Perceptual Approach to Geographic Education; McGill-Queen’s University Press: Montreal, QC, Canada, 1990. [Google Scholar]
- Kent, A.J.; Vujakovic, P. Cartographic Language: Towards a New Paradigm for Understanding Stylistic Diversity in Topographic Maps. Cartogr. J. 2011, 48, 21–40. [Google Scholar] [CrossRef]
- Kent, A.J. Form Follows Feedback: Rethinking Cartographic Communication. Westminst. Pap. Commun. Cult. 2018, 13, 96–112. [Google Scholar] [CrossRef]
- Fernandez Velasco, P. A Unified Theory of Disorientation. Ph.D. Thesis, EHESS, Paris, France, 2021. [Google Scholar]
- Tuan, Y.F. Images and Mental Maps. Ann. Assoc. Am. Geogr. 1975, 65, 205–212. [Google Scholar] [CrossRef]
- Montello, D.R. Scale and multiple psychologies of space. In Proceedings of the Spatial Information Theory: A Theoretical Basis for GIS, Elba Island, Italy, 19–22 September 1993; Springer: Berlin/Heidelberg, Germany, 1993; pp. 312–321. [Google Scholar]
- Montello, D.R. Scale in Geography. In International Encyclopedia of the Social & Behavioral Sciences; Smelser, N.J., Baltes, P.B., Eds.; Pergamon: Oxford, UK, 2001; pp. 13501–13504. [Google Scholar] [CrossRef]
- Mackaness, W.A. Chapter 1—Understanding Geographic Space. In Generalisation of Geographic Information; Mackaness, W.A., Ruas, A., Sarjakoski, L.T., Eds.; International Cartographic Association, Elsevier Science B.V.: Amsterdam, The Netherlands, 2007; pp. 1–10. [Google Scholar] [CrossRef]
- Couclelis, H.; Gottsegen, J. What maps mean to people: Denotation, connotation, and geographic visualization in land-use debates. In Spatial Information Theory—A Theoretical Basis for GIS. COSIT 1997; Hirtle, S.C., Frank, A.U., Eds.; Springer: Berlin/Heidelberg, Germany, 2006; pp. 151–162. [Google Scholar] [CrossRef]
- Ishikawa, T.; Montello, D.R. Spatial knowledge acquisition from direct experience in the environment: Individual differences in the development of metric knowledge and the integration of separately learned places. Cogn. Psychol. 2006, 52, 93–129. [Google Scholar] [CrossRef]
- Egenhofer, M.J.; Mark, D.M. Naive Geography. In Proceedings of the Spatial Information Theory A Theoretical Basis for GIS, Semmering, Austria, 21–23 September 1995; Frank, A.U., Kuhn, W., Eds.; Springer: Berlin/Heidelberg, Germany, 1995; pp. 1–15. [Google Scholar]
- Casati, R. Two, Then Four Modes of Functioning of the Mind: Towards a Unification of “Dual” Theories of Reasoning and Theories of Cognitive Artifacts. In Representations in Mind and World; Routledge: London, UK, 2017; 17p. [Google Scholar]
- Furnas, G.W. Effective View Navigation. In Proceedings of the ACM SIGCHI Conference on Human Factors in Computing Systems, CHI’97, Atlanta, GA, USA, 22–27 March 1997; Association for Computing Machinery: New York, NY, USA, 1997; pp. 367–374. [Google Scholar] [CrossRef]
- Knudsen, E.I. Fundamental Components of Attention. Annu. Rev. Neurosci. 2007, 30, 57–78. [Google Scholar] [CrossRef] [PubMed]
- Cowan, N. What are the differences between long-term, short-term, and working memory? In Progress in Brain Research; Sossin, W.S., Lacaille, J.C., Castellucci, V.F., Belleville, S., Eds.; Essence of Memory; Elsevier: Amsterdam, The Netherlands, 2008; Volume 169, pp. 323–338. [Google Scholar] [CrossRef]
- Miller, G.A. The magical number seven, plus or minus two: Some limits on our capacity for processing information. Psychol. Rev. 1956, 63, 81. [Google Scholar] [CrossRef] [PubMed] [Green Version]
- Cowan, N. The magical number 4 in short-term memory: A reconsideration of mental storage capacity. Behav. Brain Sci. 2001, 24, 87–114. [Google Scholar] [CrossRef] [PubMed]
- Bestgen, A.K.; Edler, D.; Müller, K.; Schulze, P.; Dickmann, F.; Kuchinke, L. Where Is It (in the Map)? Recall and Recognition of Spatial Information. Cartographica 2017, 52, 80–97. [Google Scholar] [CrossRef]
- Dickmann, F.; Edler, D.; Bestgen, A.K.; Kuchinke, L. Exploiting Illusory Grid Lines for Object-Location Memory Performance in Urban Topographic Maps. Cartogr. J. 2017, 54, 242–253. [Google Scholar] [CrossRef]
- Korte, A.; Keil, J.; Dickmann, F. The impact of map-structuring elements on object location memory error. Abstr. ICA 2022, 5, 109. [Google Scholar] [CrossRef]
- Tversky, B. Cognitive maps, cognitive collages, and spatial mental models. In Proceedings of the Spatial Information Theory A Theoretical Basis for GIS, Elba Island, Italy, 19–22 September 1993; Lecture Notes in Computer Science; Frank, A.U., Campari, I., Eds.; Springer: Berlin/Heidelberg, Germany, 1993; pp. 14–24. [Google Scholar] [CrossRef]
- Kuipers, B. The “Map in the Head” Metaphor. Environ. Behav. 1982, 14, 202–220. [Google Scholar] [CrossRef]
- Couclelis, H.; Golledge, R.G.; Gale, N.; Tobler, W. Exploring the anchor-point hypothesis of spatial cognition. J. Environ. Psychol. 1987, 7, 99–122. [Google Scholar] [CrossRef]
- Montello, D.R.; Friedman, A.; Phillips, D.W. Vague cognitive regions in geography and geographic information science. Int. J. Geogr. Inf. Sci. 2014, 28, 1802–1820. [Google Scholar] [CrossRef]
- Sorrows, M.E.; Hirtle, S.C. The Nature of Landmarks for Real and Electronic Spaces. In Proceedings of the Spatial Information Theory. Cognitive and Computational Foundations of Geographic Information Science, Stade, Germany, 25–29 August 1999; Freksa, C., Mark, D.M., Eds.; Springer: Berlin/Heidelberg, Germany, 1999; pp. 37–50. [Google Scholar]
- Richter, K.F.; Winter, S. Landmarks: GIScience for Intelligent Services; Springer International Publishing: Berlin/Heidelberg, Germany, 2014. [Google Scholar] [CrossRef]
- Evans, J.S.B.T. Thinking Twice: Two Minds in One Brain; Oxford University Press: New York, NY, USA, 2010. [Google Scholar]
- Wertheimer, M. Laws of organization in perceptual forms. In A Source Book of Gestalt Psychology; Ellis, W.D., Ed.; Kegan Paul, Trench, Trubner & Company: London, UK, 1938; pp. 71–88. [Google Scholar]
- Wagemans, J.; Elder, J.H.; Kubovy, M.; Palmer, S.E.; Peterson, M.A.; Singh, M.; von der Heydt, R. A century of Gestalt psychology in visual perception: I. Perceptual grouping and figure-ground organization. Psychol. Bull. 2012, 138, 1172–1217. [Google Scholar] [CrossRef] [Green Version]
- Wood, D.; Fels, J. Designs On Signs/Myth And Meaning In Maps. Cartographica 1986, 23, 54–103. [Google Scholar] [CrossRef]
- Harley, J.B. Deconstructing the map. Passages 1992, 26, 1–20. [Google Scholar]
- Muehlenhaus, I. The design and composition of persuasive maps. Cartogr. Geogr. Inf. Sci. 2013, 40, 401–414. [Google Scholar] [CrossRef]
- Itti, L.; Koch, C. Computational modelling of visual attention. Nat. Rev. Neurosci. 2001, 20, 1254–1259. [Google Scholar] [CrossRef] [PubMed]
- Rosenholtz, R.; Li, Y.; Nakano, L. Measuring visual clutter. J. Vis. 2007, 7, 17. [Google Scholar] [CrossRef] [PubMed]
- Touya, G.; Hoarau, C.; Christophe, S. Clutter and Map Legibility in Automated Cartography: A Research Agenda. Cartogr. Int. J. Geogr. Inf. Geovisualization 2016, 51, 198–207. [Google Scholar] [CrossRef]
- Pappa, A.; Krassanakis, V. Examining the preattentive effect on cartographic backgrounds utilizing remote mouse tracking. Abstr. ICA 2022, 5, 111. [Google Scholar] [CrossRef]
- Cybulski, P. Preattentive features of cartographic symbols in animated mapping. Abstr. ICA 2022, 5, 1–3. [Google Scholar] [CrossRef]
- Treisman, A.M.; Gelade, G. A feature-integration theory of attention. Cogn. Psychol. 1980, 12, 97–136. [Google Scholar] [CrossRef] [PubMed]
- Julesz, B. A theory of preattentive texture discrimination based on first-order statistics of textons. Biol. Cybern. 1981, 41, 131–138. [Google Scholar] [CrossRef]
- Treisman, A. Preattentive processing in vision. Comput. Vision Graph. Image Process. 1985, 31, 156–177. [Google Scholar] [CrossRef]
- Wolfe, J.M. Guided Search 2.0 A revised model of visual search. Psychon. Bull. Rev. 1994, 1, 202–238. [Google Scholar] [CrossRef]
- Eckstein, M.P. Visual search: A retrospective. J. Vis. 2011, 11, 14. [Google Scholar] [CrossRef]
- Paas, F.; Tuovinen, J.E.; Tabbers, H.; Van Gerven, P.W.M. Cognitive Load Measurement as a Means to Advance Cognitive Load Theory. Educ. Psychol. 2003, 38, 63–71. [Google Scholar] [CrossRef]
- Fairbairn, D.J. On the nature of cartographic text. Cartogr. J. 1993, 30, 104–111. [Google Scholar] [CrossRef]
- Elmqvist, N.; Moere, A.V.; Jetter, H.C.; Cernea, D.; Reiterer, H.; Jankun-Kelly, T.J. Fluid interaction for information visualization. Inf. Vis. 2011, 10, 327–340. [Google Scholar] [CrossRef]
- Frank, A.; Timpf, S. Multiple representations for cartographic objects in a multi-scale tree—An intelligent graphical zoom. Comput. Graph. 1994, 18, 823–829. [Google Scholar] [CrossRef]
- Touya, G. Finding the Oasis in the Desert Fog? Understanding Multi-Scale Map Reading. In Proceedings of the Abstraction, Scale and Perception Workshop, Tokyo, Japan, 15 July 2019. [Google Scholar]
- Rosenholtz, R. Capabilities and Limitations of Peripheral Vision. Annu. Rev. Vis. Sci. 2016, 2, 437–457. [Google Scholar] [CrossRef]
- Rosenholtz, R.; Huang, J.; Ehinger, K. Rethinking the Role of Top-Down Attention in Vision: Effects Attributable to a Lossy Representation in Peripheral Vision. Front. Psychol. 2012, 3, 13. [Google Scholar] [CrossRef]
- Rousselet, G.; Joubert, O.; Fabre-Thorpe, M. How long to get to the “gist” of real-world natural scenes? Vis. Cogn. 2005, 12, 852–877. [Google Scholar] [CrossRef]
- Vater, C.; Wolfe, B.; Rosenholtz, R. Peripheral vision in real-world tasks: A systematic review. Psychon. Bull. Rev. 2022, 29, 1531–1557. [Google Scholar] [CrossRef]
- Roth, R.E.; Çöltekin, A.; Delazari, L.; Filho, H.F.; Griffin, A.; Hall, A.; Korpi, J.; Lokka, I.; Mendonça, A.; Ooms, K.; et al. User studies in cartography: Opportunities for empirical research on interactive maps and visualizations. Int. J. Cartogr. 2017, 3, 61–89. [Google Scholar] [CrossRef]
- Montello, D.R. Cognitive Map-Design Research in the Twentieth Century: Theoretical and Empirical Approaches. Cartogr. Geogr. Inf. Sci. 2002, 29, 283–304. [Google Scholar] [CrossRef]
- Skarlatidou, A.; Haklay, M. Public Web Mapping: Preliminary Usability Evaluation. In Proceedings of the Geographical Information Science Research Conference 2006 (GISRUK’06), Nottingham, UK, 5–7 April 2006. [Google Scholar]
- Garlandini, S.; Fabrikant, S.I. Evaluating the Effectiveness and Efficiency of Visual Variables for Geographic Information Visualization. In Proceedings of the Spatial Information Theory, Aber Wrac’h, France, 21–25 September 2009; Hornsby, K.S., Claramunt, C., Denis, M., Ligozat, G., Eds.; Lecture Notes in Computer Science; Springer: Berlin/Heidelberg, Germany, 2009; pp. 195–211. [Google Scholar] [CrossRef]
- Ooms, K.; Dupont, L.; Lapon, L. Mixing Methods and Triangulating Results to Study the Influence of Panning on Map Users’ Attentive Behaviour. Cartogr. J. 2017, 54, 196–213. [Google Scholar] [CrossRef]
- Unrau, R.; Kray, C. Enhancing Usability Evaluation of Web-Based Geographic Information Systems (WebGIS) with Visual Analytics. In Proceedings of the 11th International Conference on Geographic Information Science (GIScience 2021)—Part I, Poznan, Poland, 27–30 September 2021; Janowicz, K., Verstegen, J.A., Eds.; Leibniz International Proceedings in Informatics (LIPIcs); Schloss Dagstuhl–Leibniz-Zentrum für Informatik: Dagstuhl, Germany, 2020; Volume 177. [Google Scholar] [CrossRef]
- Ooms, K.; Coltekin, A.; De Maeyer, P.; Dupont, L.; Fabrikant, S.; Incoul, A.; Kuhn, M.; Slabbinck, H.; Vansteenkiste, P.; Van der Haegen, L. Combining user logging with eye tracking for interactive and dynamic applications. Behav. Res. Methods 2015, 47, 977–993. [Google Scholar] [CrossRef] [PubMed]
- Harrower, M.; Sheesley, B. Designing Better Map Interfaces: A Framework for Panning and Zooming. Trans. GIS 2005, 9, 77–89. [Google Scholar] [CrossRef]
- Kapaj, A.; Lanini-Maggi, S.; Fabrikant, S.I. The impact of landmark visualization style on expert wayfinders’ cognitive load during navigation. Abstr. ICA 2021, 3, 138. [Google Scholar] [CrossRef]
- Qin, T.; Huang, H. Visual attention and neuro-cognitive processes in map use. Abstr. ICA 2022, 5, 114. [Google Scholar] [CrossRef]
- Lobben, A.; Lawrence, M.; Olson, J.M. fMRI and Human Subjects Research in Cartography. Cartogr. Int. J. Geogr. Inf. Geovisualization 2009, 44, 159–169. [Google Scholar] [CrossRef]
Figure 1.
Maps of Kobe at different scales from Google Maps, showing the differences that cause the desert fog effect.
Figure 1.
Maps of Kobe at different scales from Google Maps, showing the differences that cause the desert fog effect.
Figure 2.
Simplified version of the cartographic communication model by Kolacny [
9].
Figure 2.
Simplified version of the cartographic communication model by Kolacny [
9].
Figure 3.
Zoomed-in view of the Berlin memorial of the Soviet War on top and a view at a smaller scale, where the Y-shaped river section can be used to find the memorial (source: Google).
Figure 3.
Zoomed-in view of the Berlin memorial of the Soviet War on top and a view at a smaller scale, where the Y-shaped river section can be used to find the memorial (source: Google).
Figure 4.
Illustration of the spatial distortion effect with a mental representation of Saint-Brévin, France on the left and the corresponding map extract on the right (©OpenStreetMap contributors).
Figure 4.
Illustration of the spatial distortion effect with a mental representation of Saint-Brévin, France on the left and the corresponding map extract on the right (©OpenStreetMap contributors).
Figure 5.
The map that caused the France and Italy border disorientation experience, where the border is the wide pink line (source: IGN).
Figure 5.
The map that caused the France and Italy border disorientation experience, where the border is the wide pink line (source: IGN).
Figure 6.
On the left is the OSM map that caused the trust disorientation experience, with the quay that is now pedestrian still represented as a secondary road. In the Google map, the quay is correctly represented as a pedestrian road (source: Google and OpenStreetMap contributors).
Figure 6.
On the left is the OSM map that caused the trust disorientation experience, with the quay that is now pedestrian still represented as a secondary road. In the Google map, the quay is correctly represented as a pedestrian road (source: Google and OpenStreetMap contributors).
Figure 7.
A pan-scalar map exploration to search for the train station of La Baule in France. The exploration was composed of phases where the user inspected map views and transition phases between two map views (source: OpenStreetMap contributors).
Figure 7.
A pan-scalar map exploration to search for the train station of La Baule in France. The exploration was composed of phases where the user inspected map views and transition phases between two map views (source: OpenStreetMap contributors).
Figure 8.
Reconciliation model of (dis)orientation during the exploration of pan-scalar maps. At each new view, the spatial working memory connects and reconciles the content of the map view with the mental representation of space, which is temporarily enriched by the previous views visited in the exploration path.
Figure 9.
Illustration of the reconciliation process (i.e., locating the map view within one’s mental map).
Figure 9.
Illustration of the reconciliation process (i.e., locating the map view within one’s mental map).
Figure 10.
Three examples illustrating the pre-attentive mode of reconciliation. (a) The sea is a clear Gestalt element that enables a pre-attentive reconciliation (source: IGN). (b) Some touristic venues of Paris are highlighted with symbols that are very salient compared with the map background (source: Google Maps). (c) This cluttered map limits any pre-attentive reconciliation due to the amount of rendered information (source: OpenStreetMap contributors).
Figure 11.
Two examples where a failed anticipation might occur. (a) The Gestalt principle of closure anticipates a ring road around the town of Chateaubriant, France, whereas it only covers three fourth of the extent. (b) The water surface in the coastal town of La Grande Motte, France seems to be the Mediterranean Sea, but it is a lake, and the sea shore is just south of this place (©OpenStreetMap contributors).
Figure 12.
Two consecutive scales at zoom levels 14 and 15 where the map changes a lot, preventing pre-attentive reconciliation based on common landmarks (source: IGN).
Figure 12.
Two consecutive scales at zoom levels 14 and 15 where the map changes a lot, preventing pre-attentive reconciliation based on common landmarks (source: IGN).
| Disclaimer/Publisher’s Note: The statements, opinions and data contained in all publications are solely those of the individual author(s) and contributor(s) and not of MDPI and/or the editor(s). MDPI and/or the editor(s) disclaim responsibility for any injury to people or property resulting from any ideas, methods, instructions or products referred to in the content. |
© 2023 by the authors. Licensee MDPI, Basel, Switzerland. This article is an open access article distributed under the terms and conditions of the Creative Commons Attribution (CC BY) license (https://creativecommons.org/licenses/by/4.0/).


