
Flash Flood Hazard Assessment along the Red Sea Coast Using Remote Sensing and GIS Techniques
 , , and
Abstract
:1. Introduction
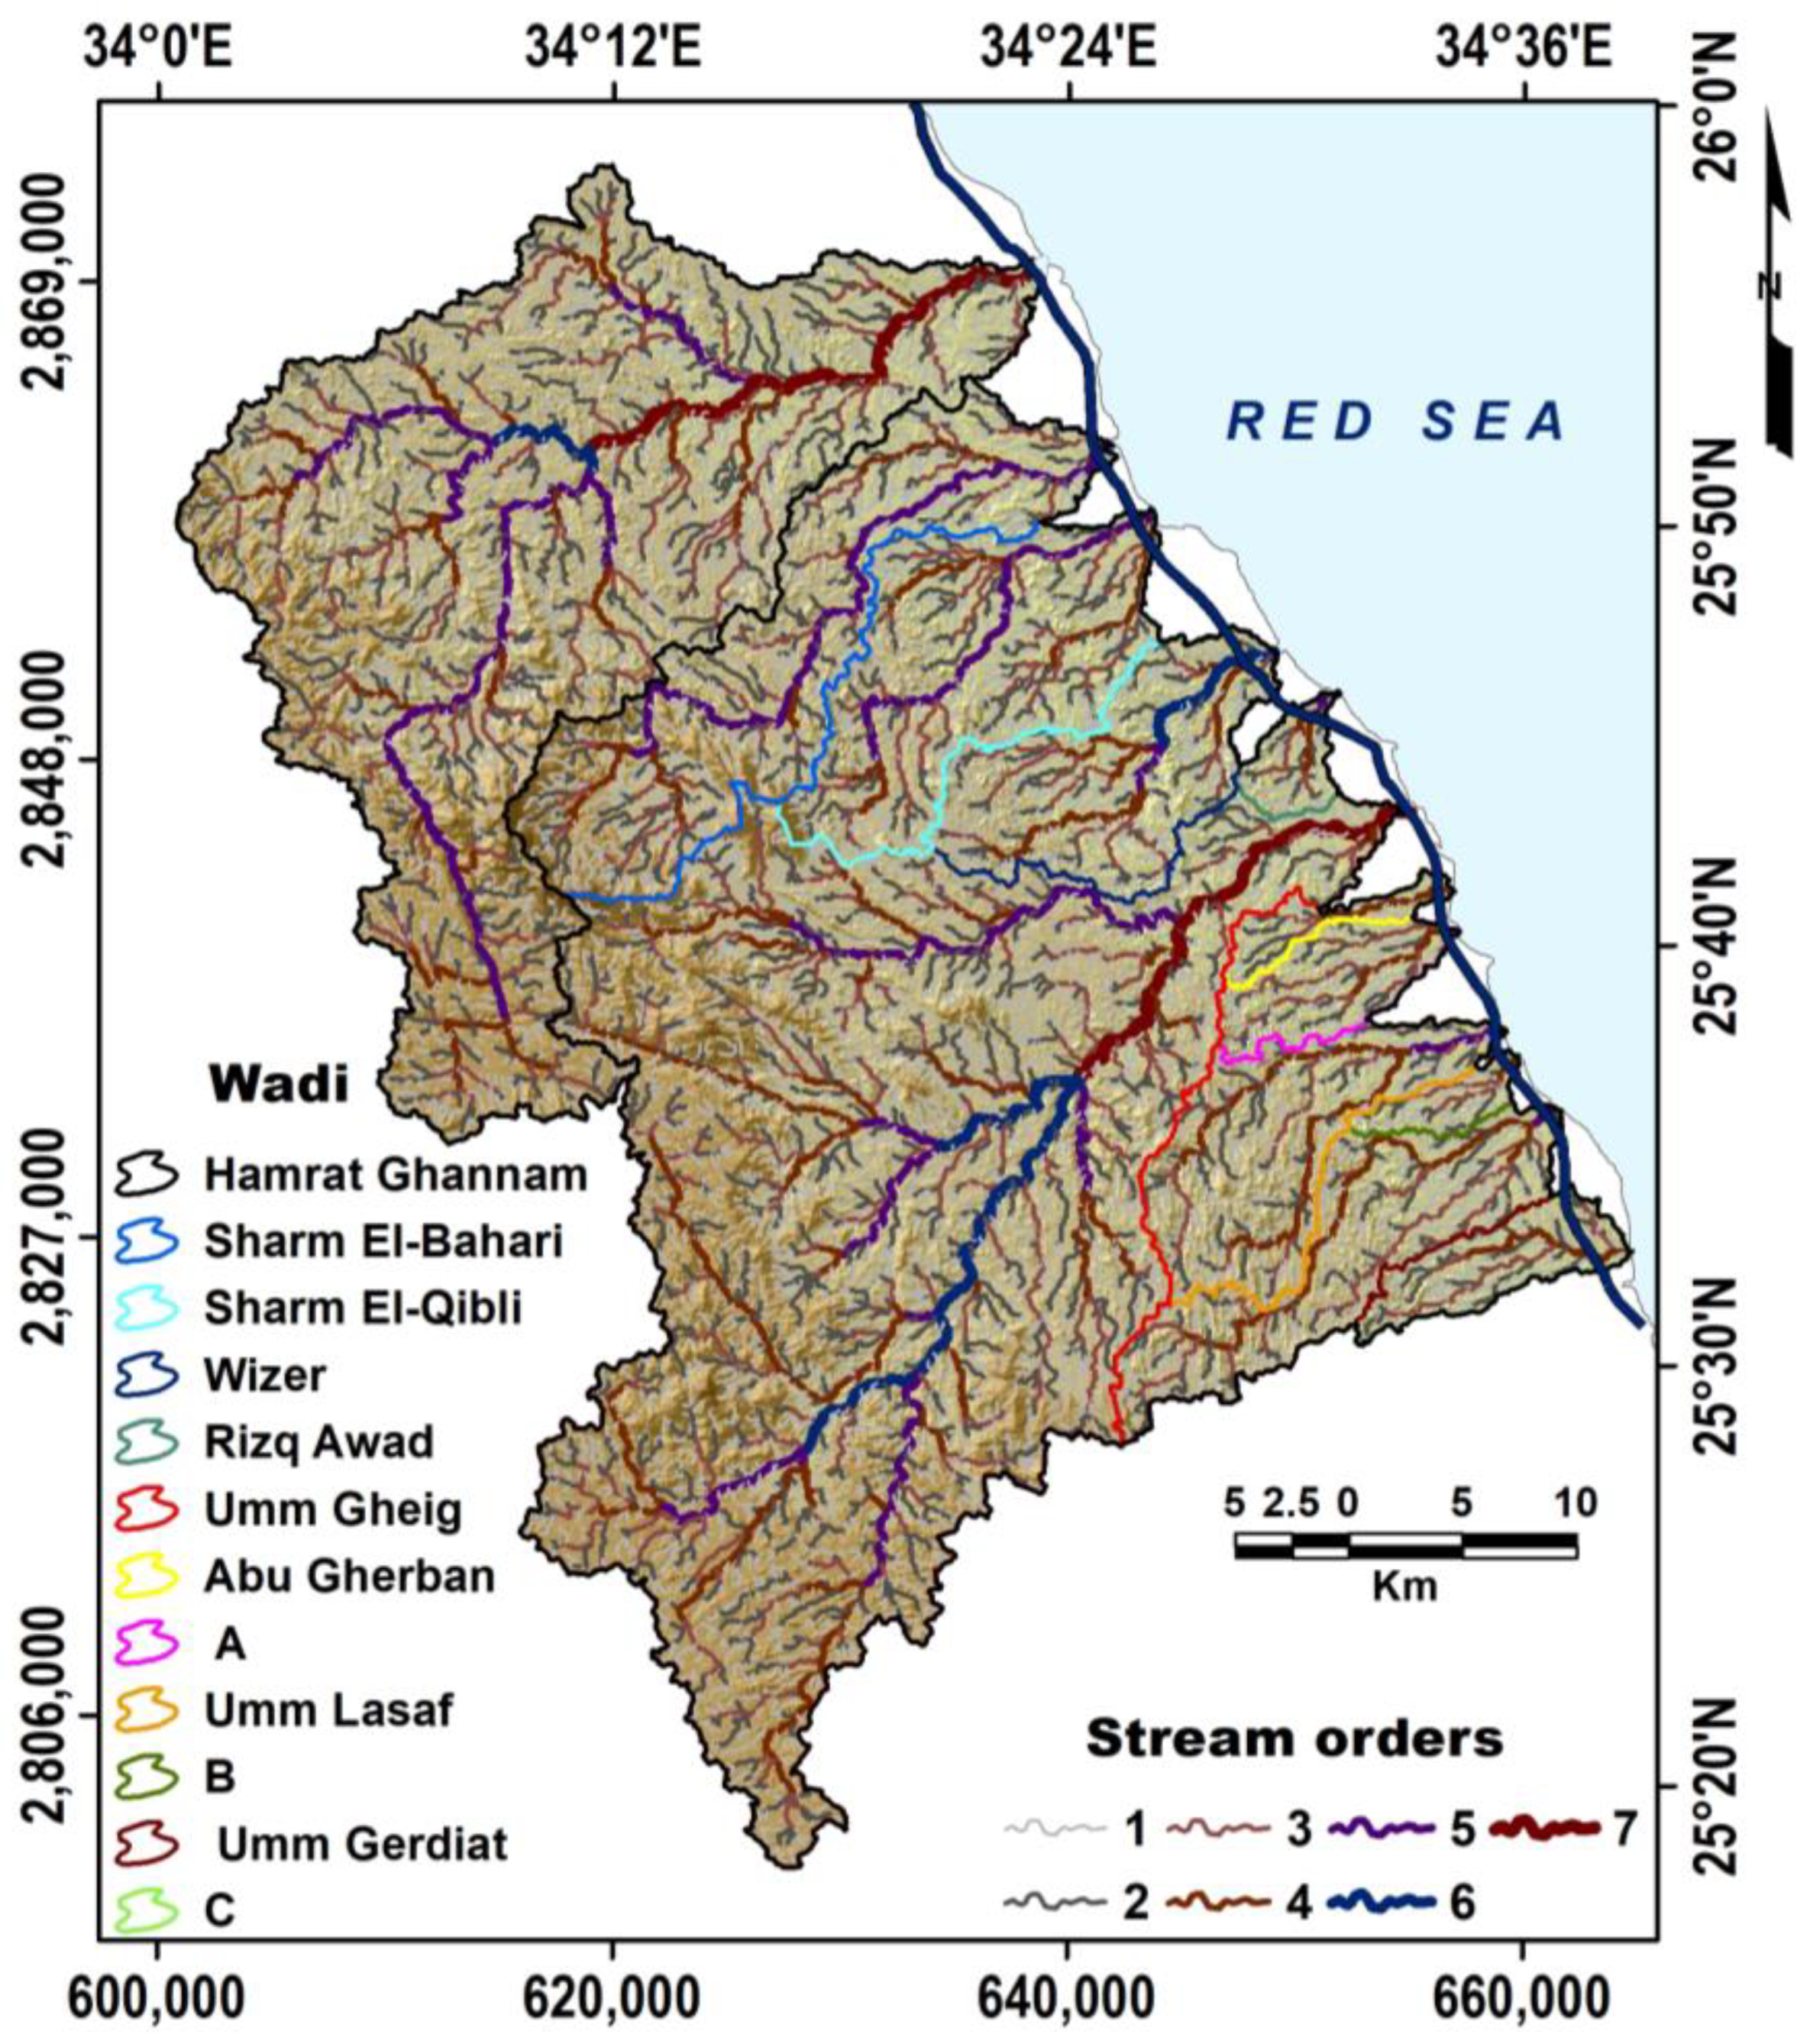
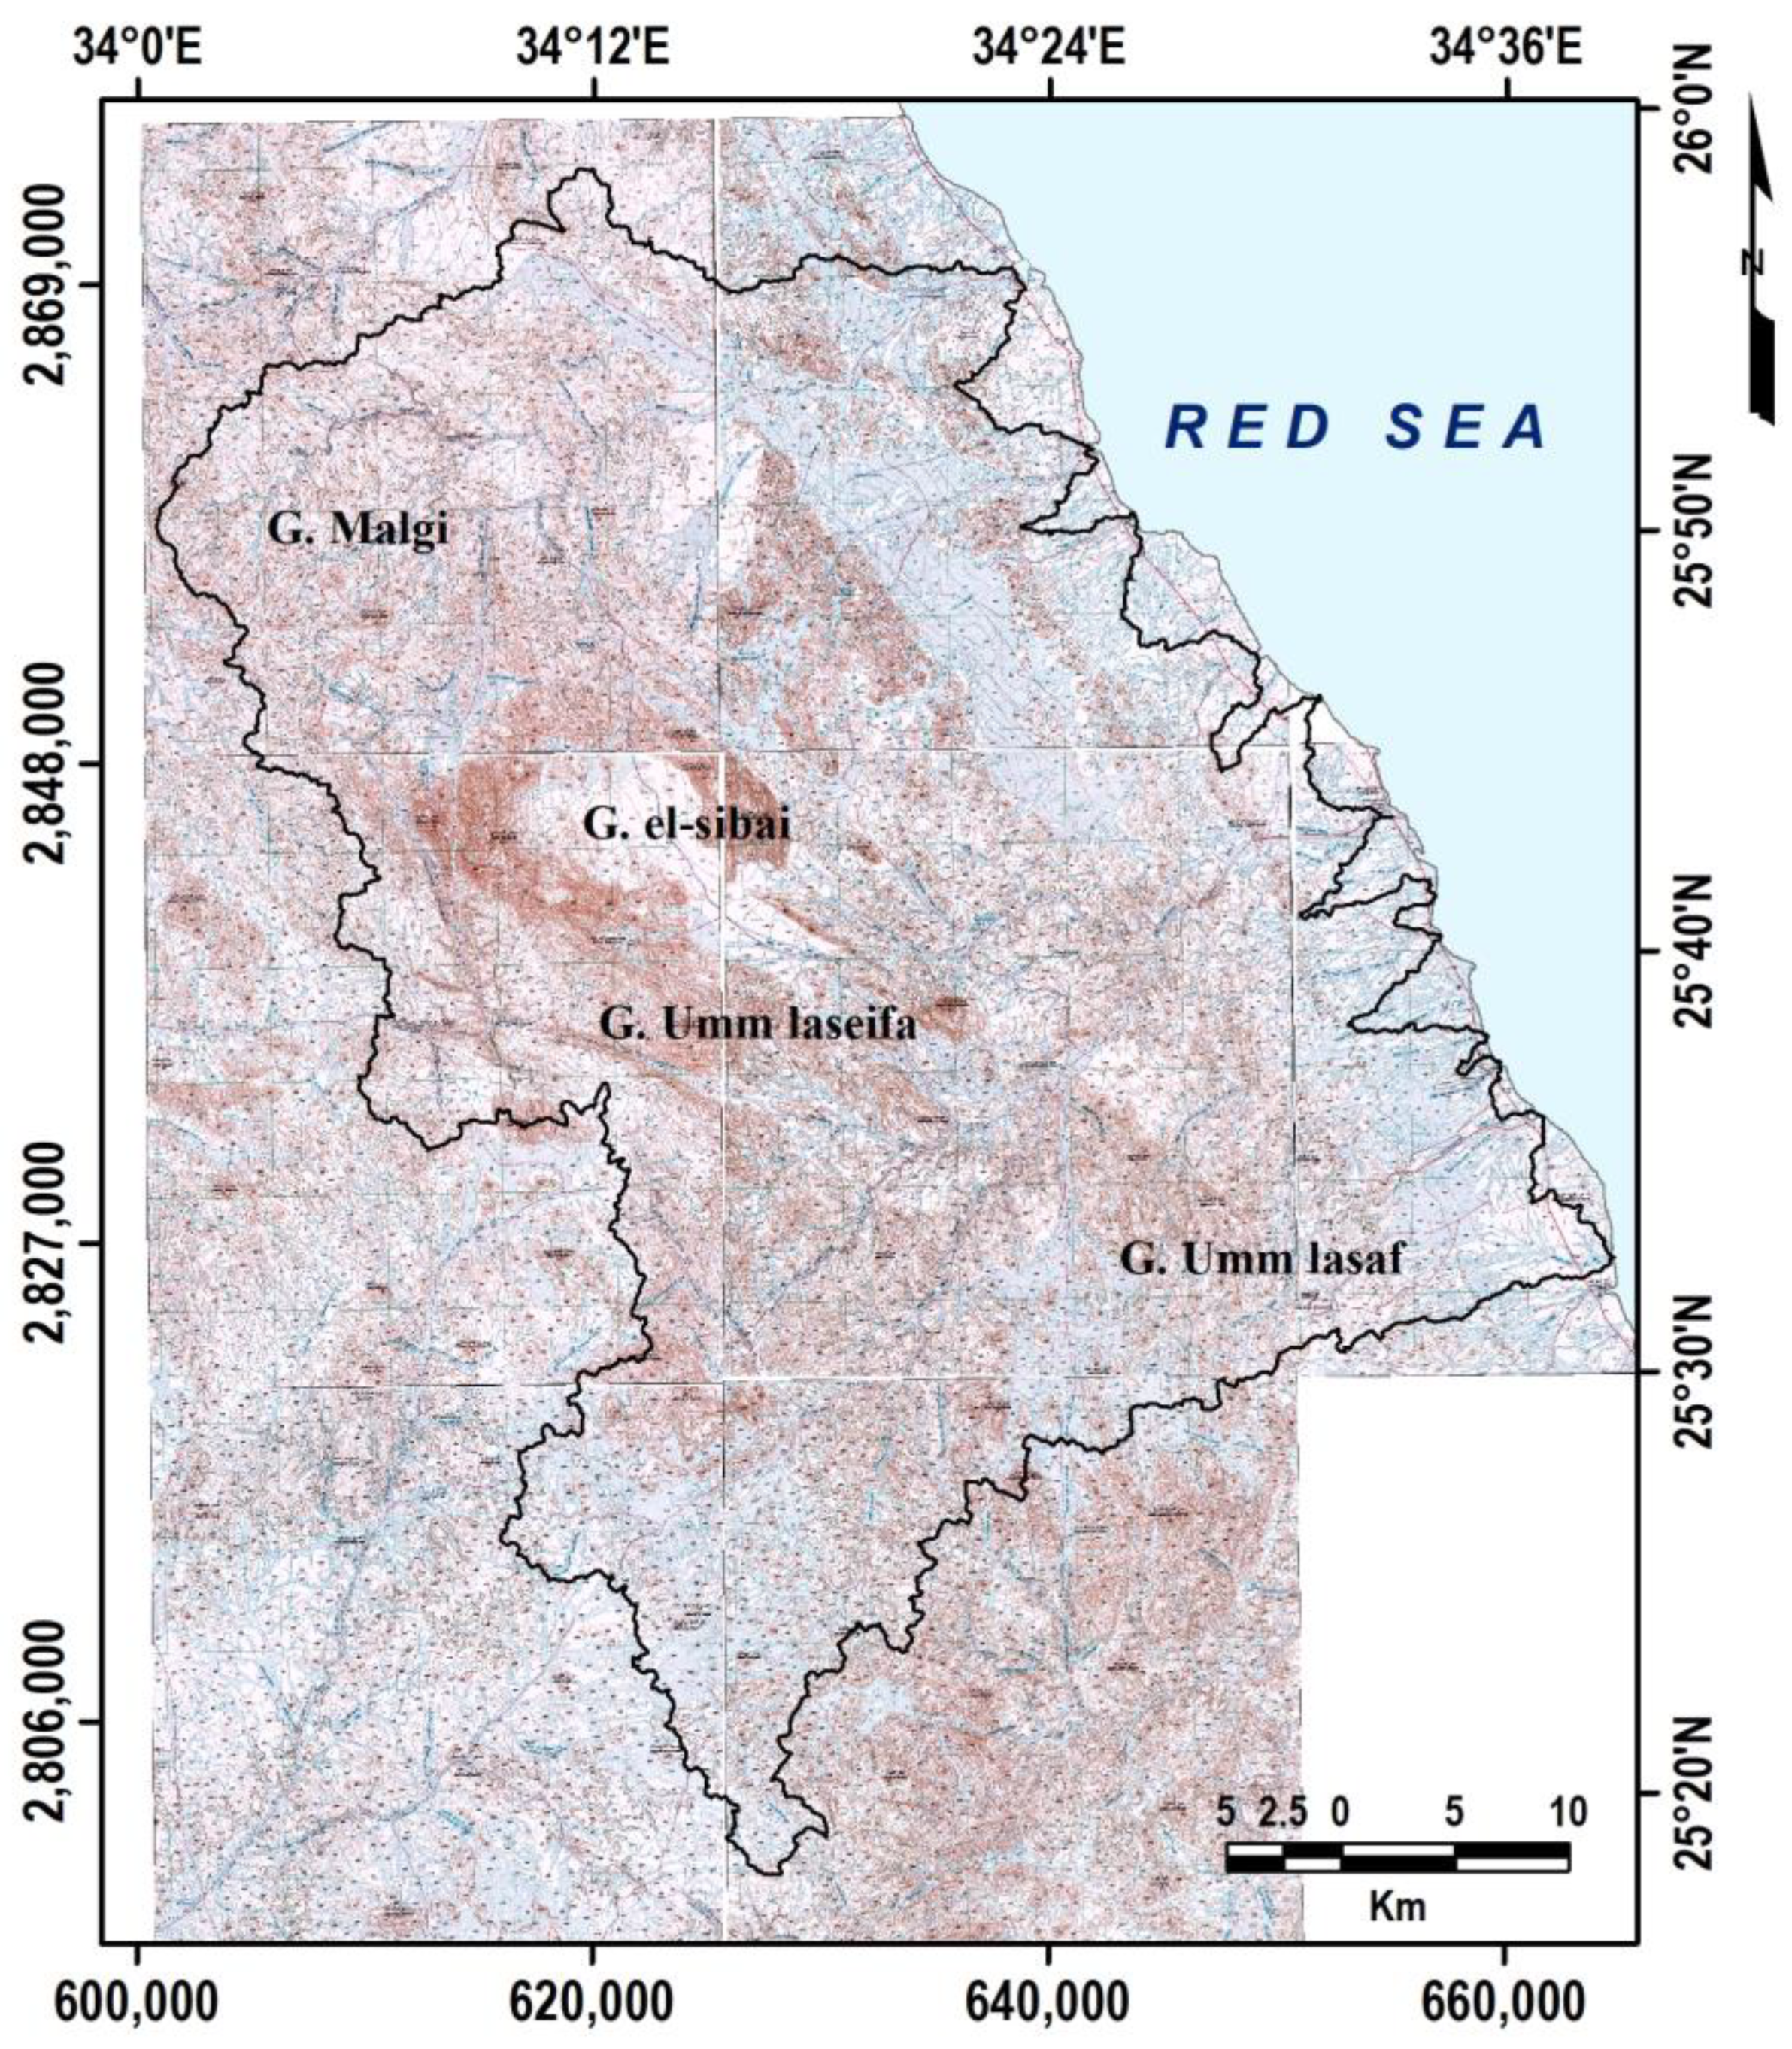
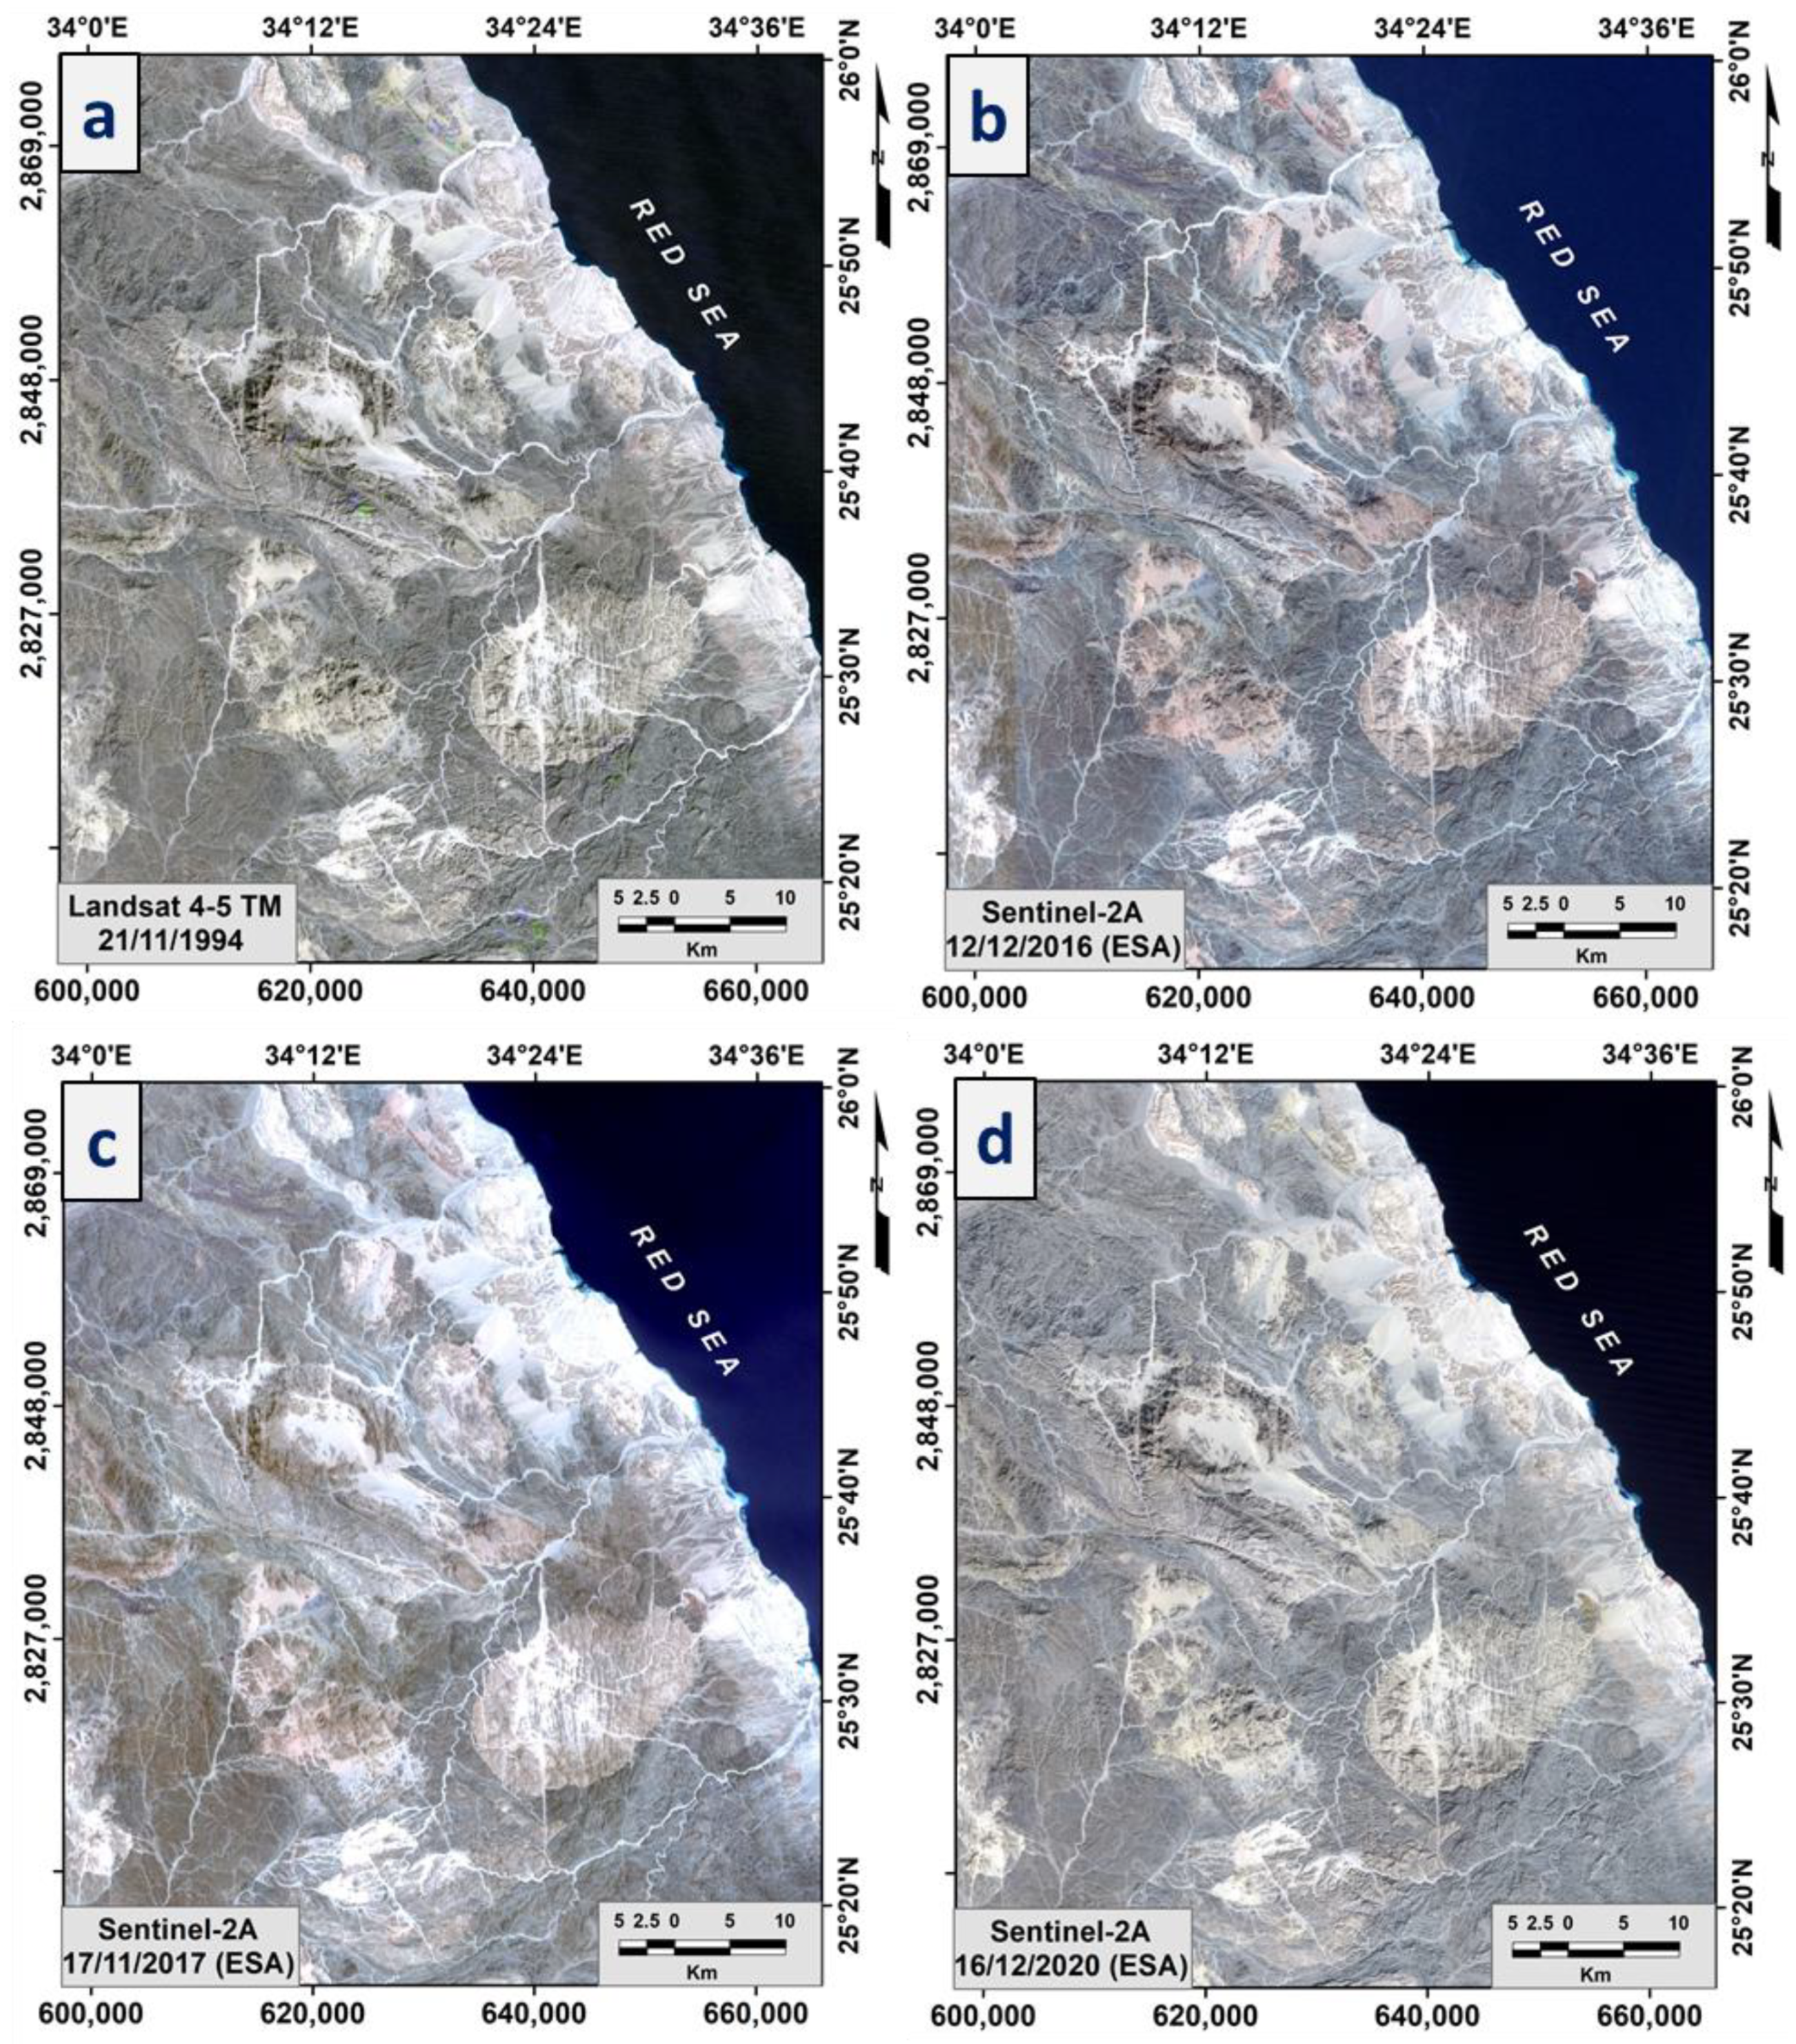
2. Study Area
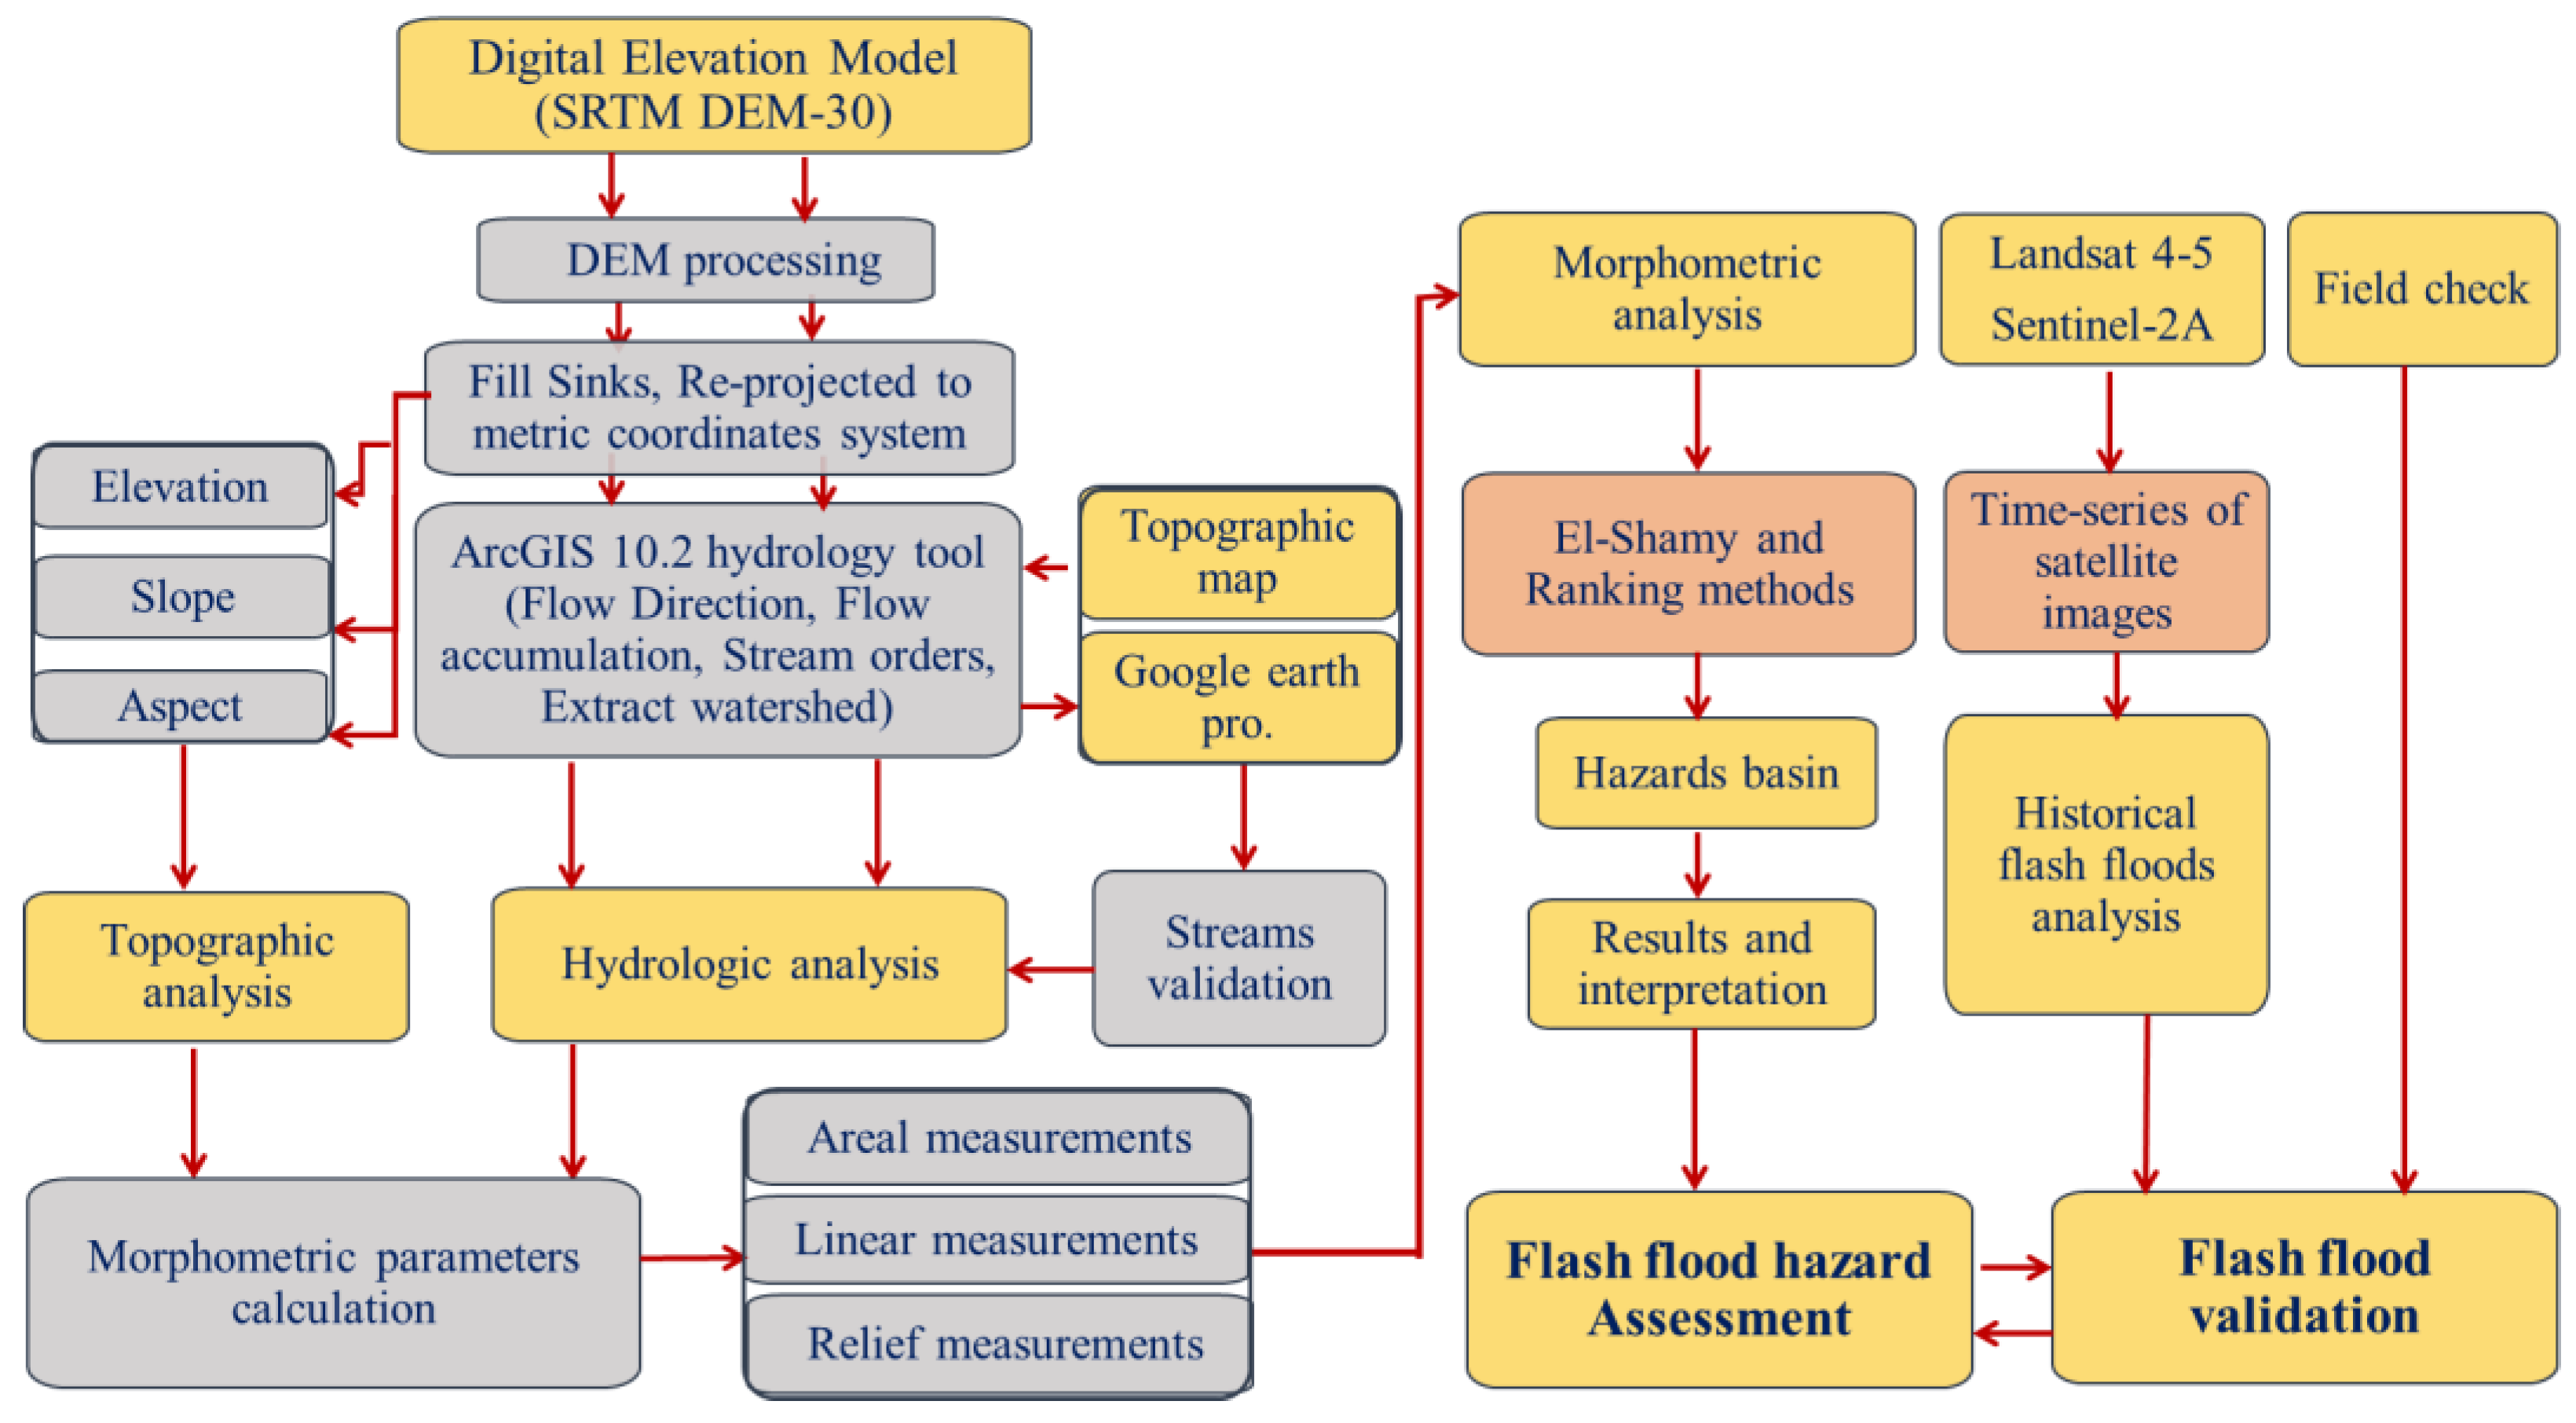
3. Methodology
- (a)
- El-Shamy approach [33]
- (b)
- Ranking method
4. Hydro-Morphometric Analysis
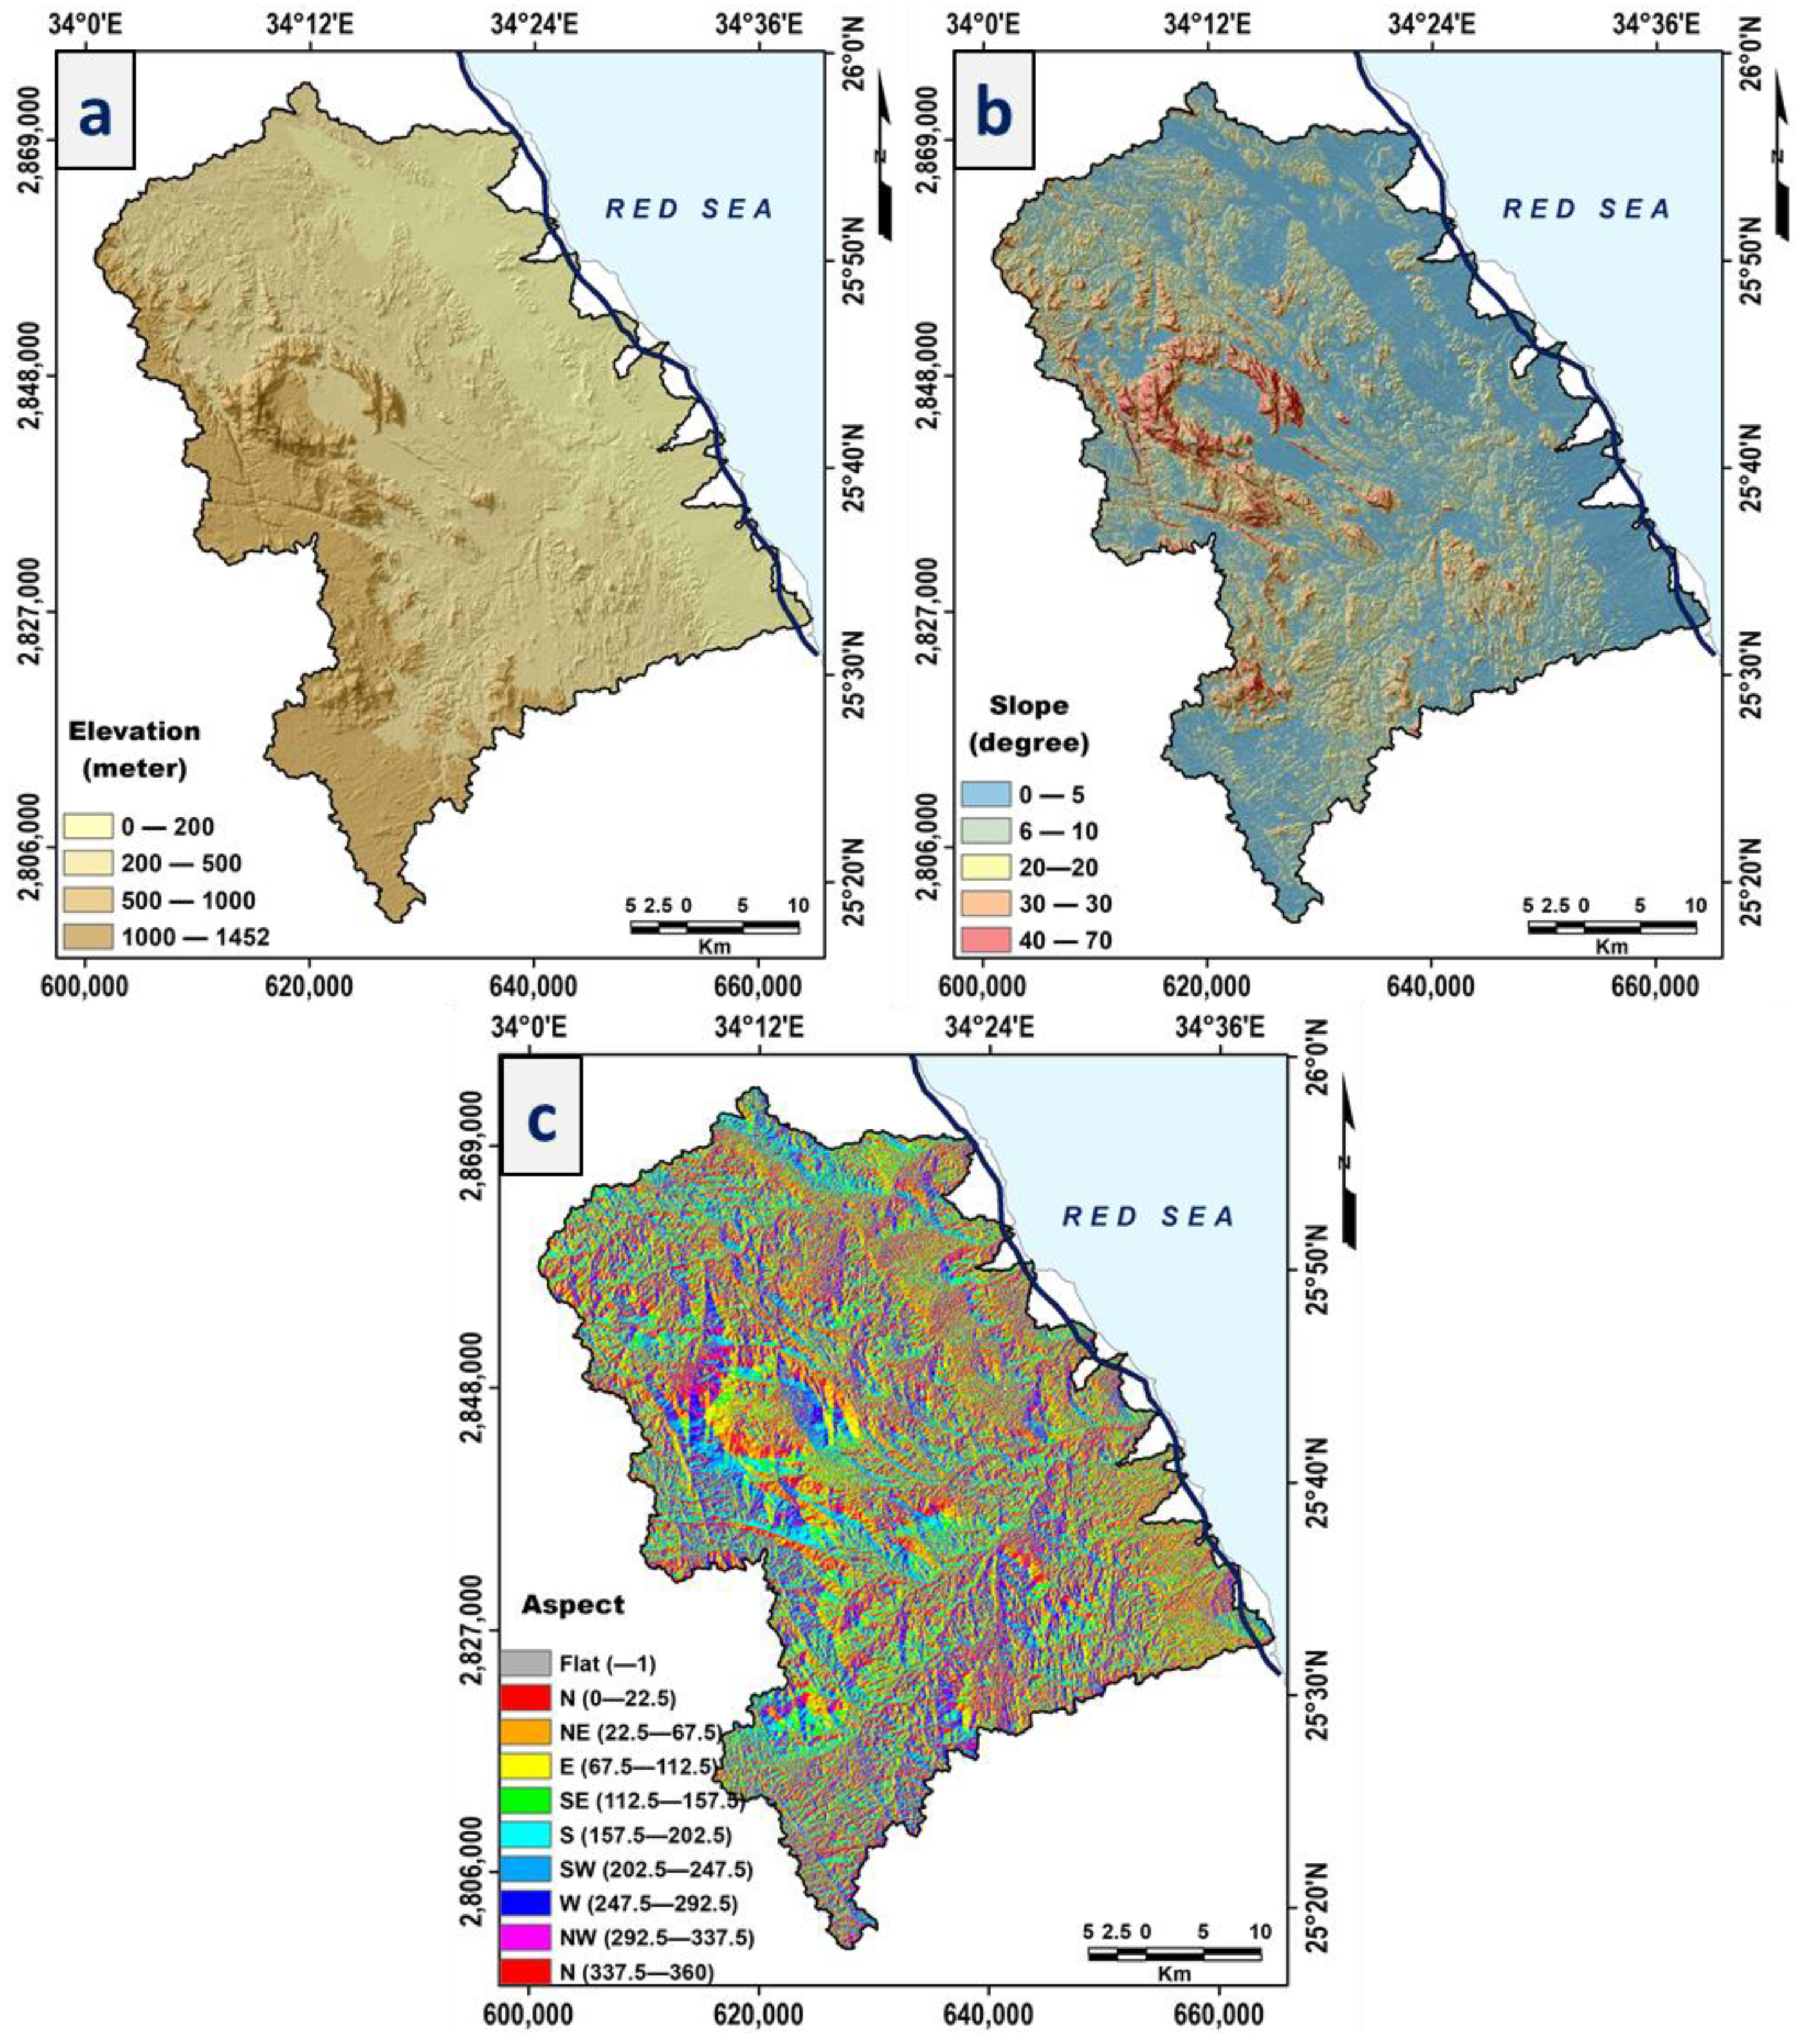
4.1. Topographic Analysis
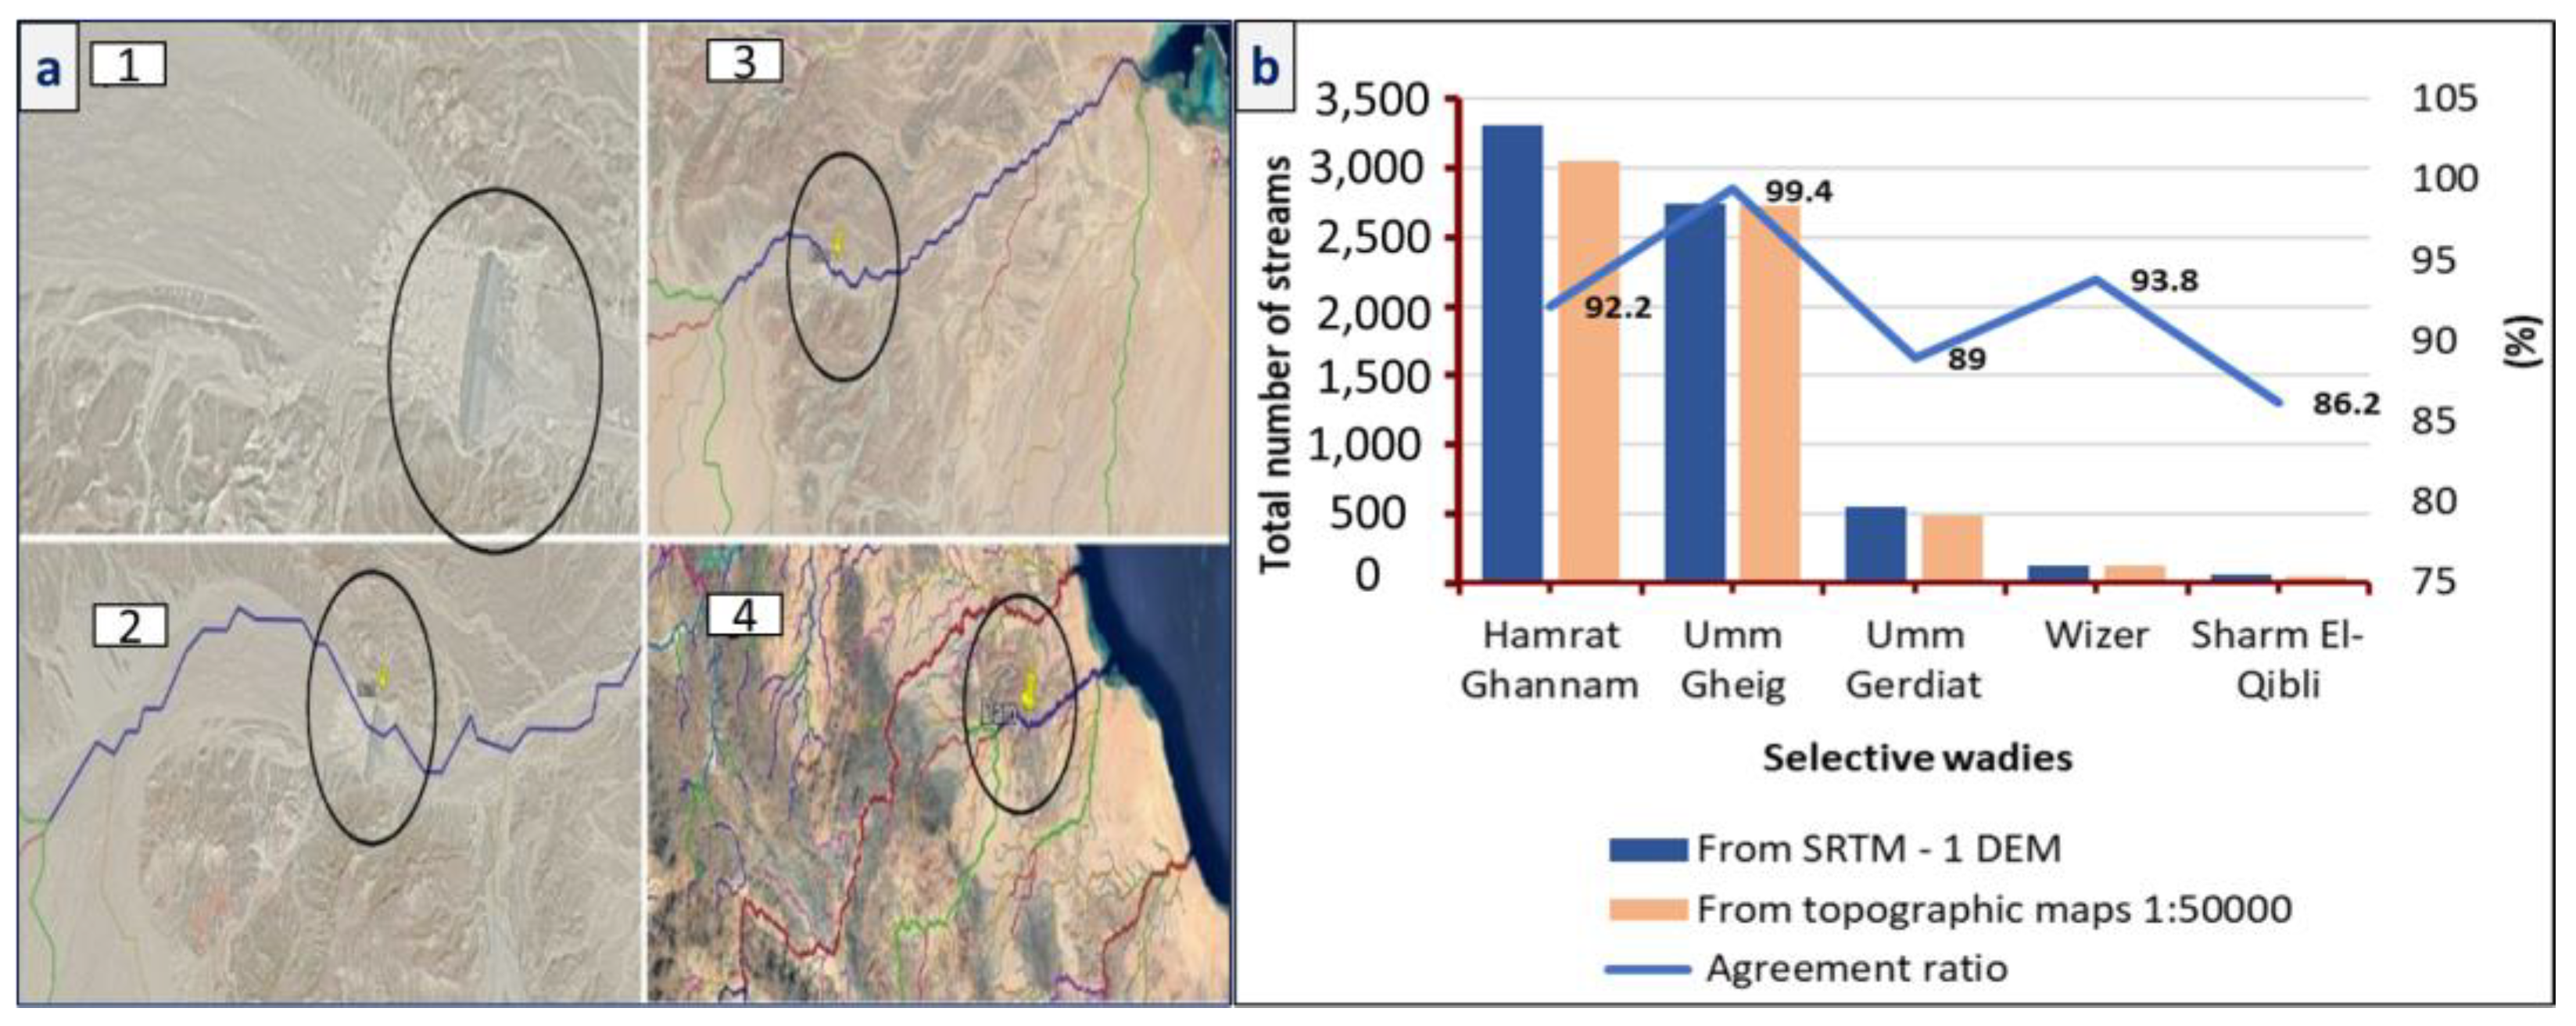
4.2. Hydrological Analysis
4.3. Quantitative Morphometric Analysis

| Morphometric Parameters | Mathematical Expression | References | |
|---|---|---|---|
| A | Linear measurements of the drainage watershed | ||
| 1 | Stream order (Su) | Hierarchical ordering | [37] |
| 2 | Stream number (Nu) | Nu = N1 + N2 + Nn | [36] |
| 3 | Stream length (Lu) km | Lu = L1 + L2……Ln | [40] |
| 4 | Drainage basin length (Lb) | The longest dimension of the basin, which is parallel to the principal drainage (km) | [41] |
| 5 | Average basin width (Wb) | Basin area (A) divided by its length (Lb) | |
| 6 | Mean bifurcation ratio (MRb) | MRb = Average of bifurcation ratios Rb of all orders; Rb=Nu/N(u+1); Nu is number of streams of any given order, and (u+1) is the next higher order | [36] |
| 7 | Length of overland flow (Lg) | Lg = 1/(2 × Dd) | [36] |
| B | Areal measurements of the drainage watershed | ||
| 1 | The area of drainage (A) km2 | GIS software analysis | [41] |
| 2 | Basin perimeter (P) km | Total length of outer boundary of drainage basin | [41] |
| 3 | Stream frequency (Fs) km2 | Fs = (ΣNu)/A | [36] |
| 4 | Drainage density (Dd) km/km2 | Dd = (ΣLu)/A | [36] |
| 5 | Circularity ratio (Rc) | Rc = 12.57 × (A/P2) | [43] |
| 6 | Elongation ratio (Re) | Re = 2/Lb × (A/π) 0.5 | [41] |
| 7 | Form factor (Ff) | Ff = A/Lb2 | [36] |
| 8 | Infiltration number (If) | If = Dd × Fs | [44] |
| C | Relief measurements of the drainage watershed | ||
| 1 | Basin relief (R) | R = H − h; H is maximum elevation and h is minimum elevation of the basin | [40] |
| 2 | Relief ratio (Rr) | Rr = R/Lb | [41] |
| 3 | Drainage texture (T) | T = (ΣNu)/p | [45] |
| 4 | Ruggedness number (Rn) | Rn = R × Dd/1000 | [41] |
| 5 | Basin Slope (Bs) | WMS software “topaz model” | |
4.3.1. Linear Measurements of the Basins
4.3.2. Areal Measurements of the Basins
4.3.3. Relief Characteristics of the Drainage Watersheds
5. Results and Discussion
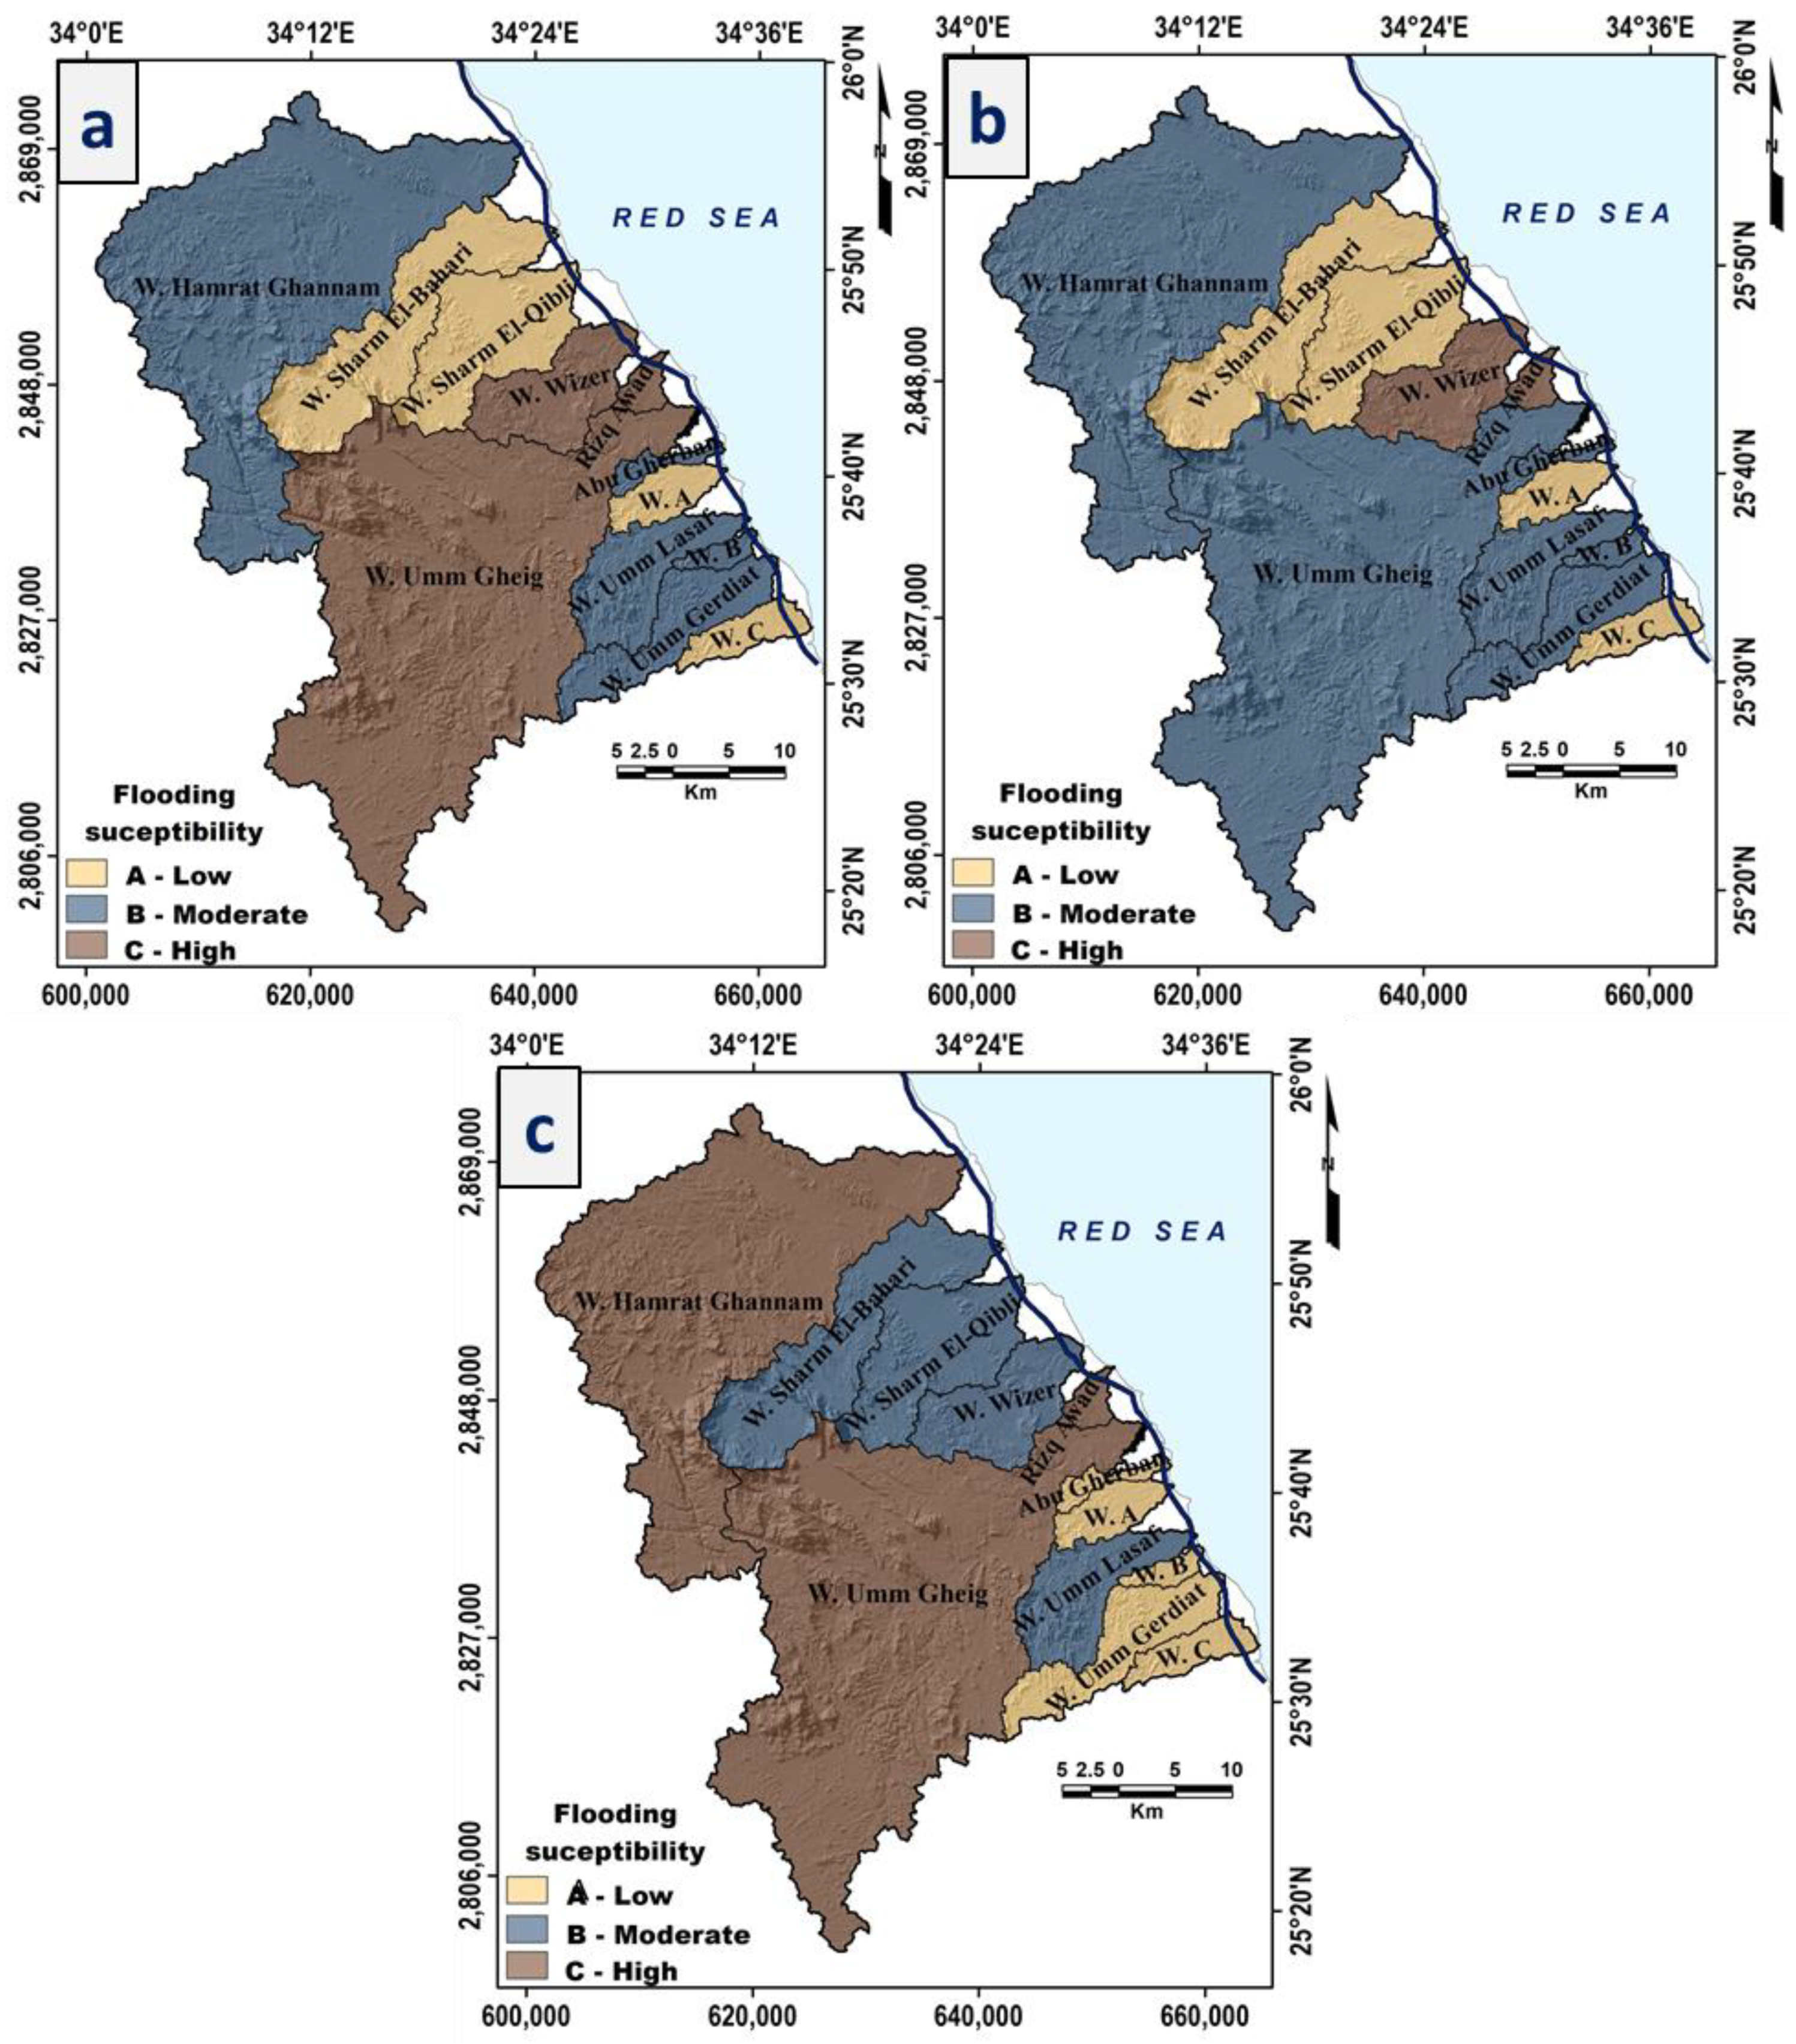
5.1. Assessment of the Risk from Floods Using Morphometric Parameters
5.1.1. El-Shamy’s Approach for Assessment of the Risk of Floods
5.1.2. The Ranking Method for Assessment of the Risk of Floods
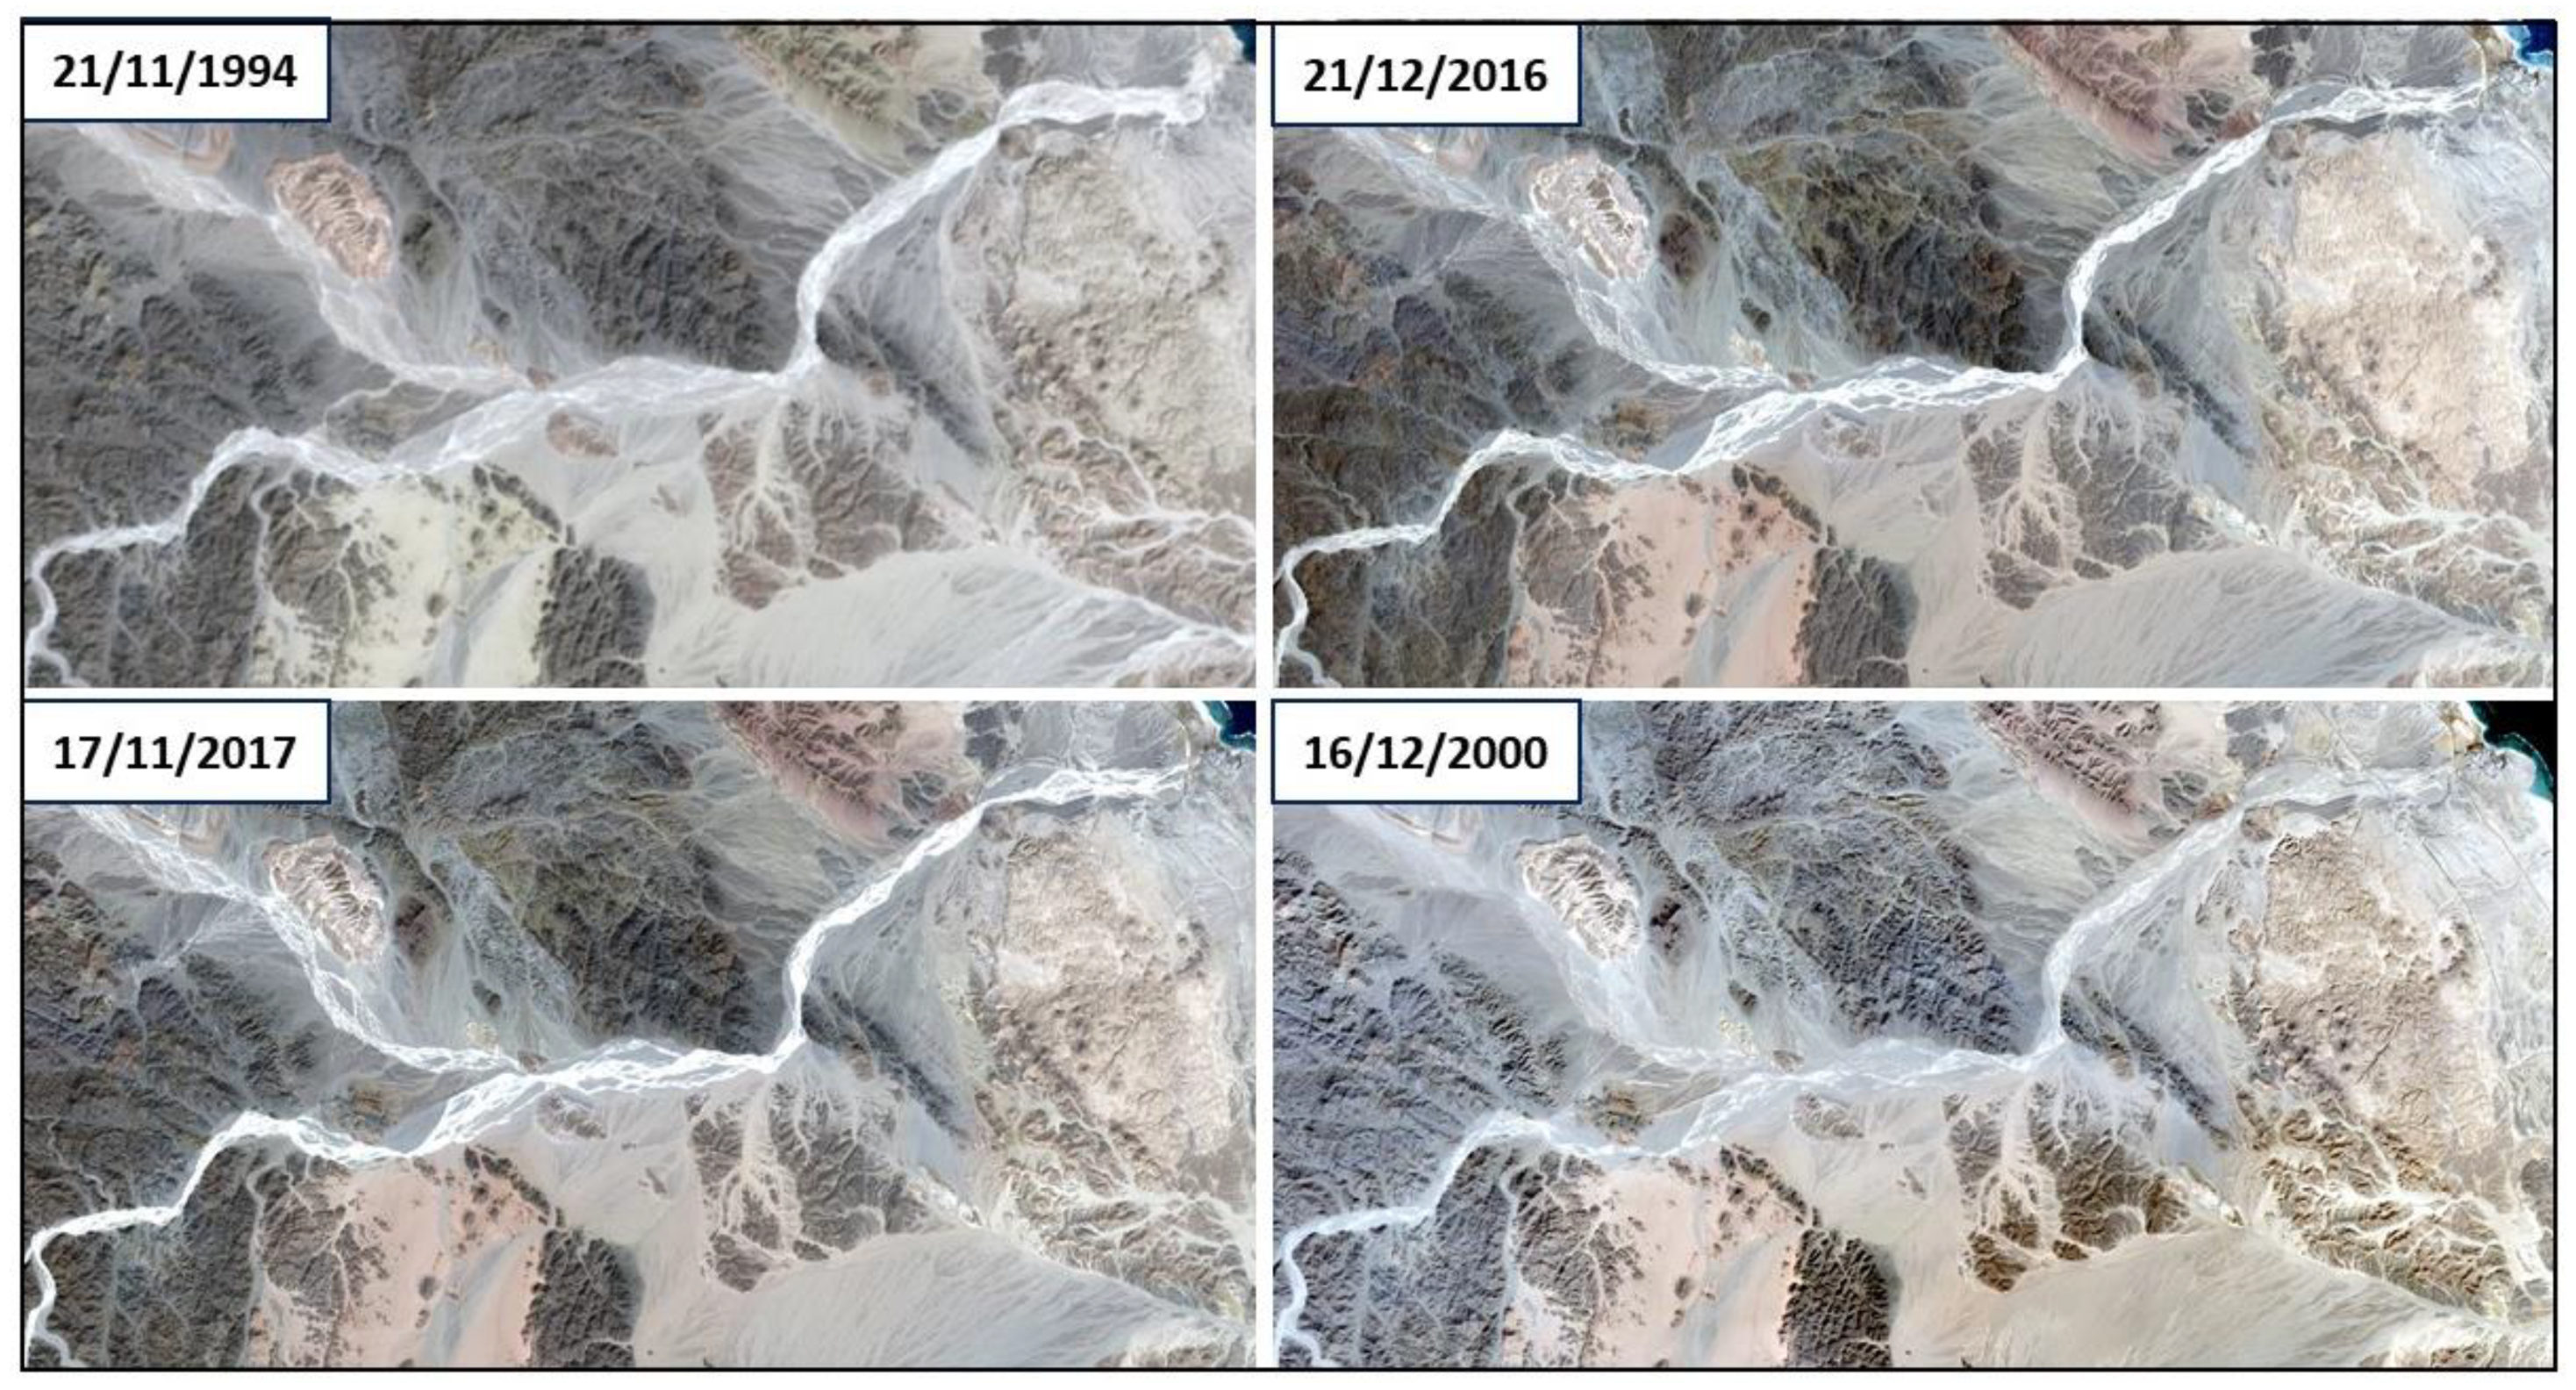
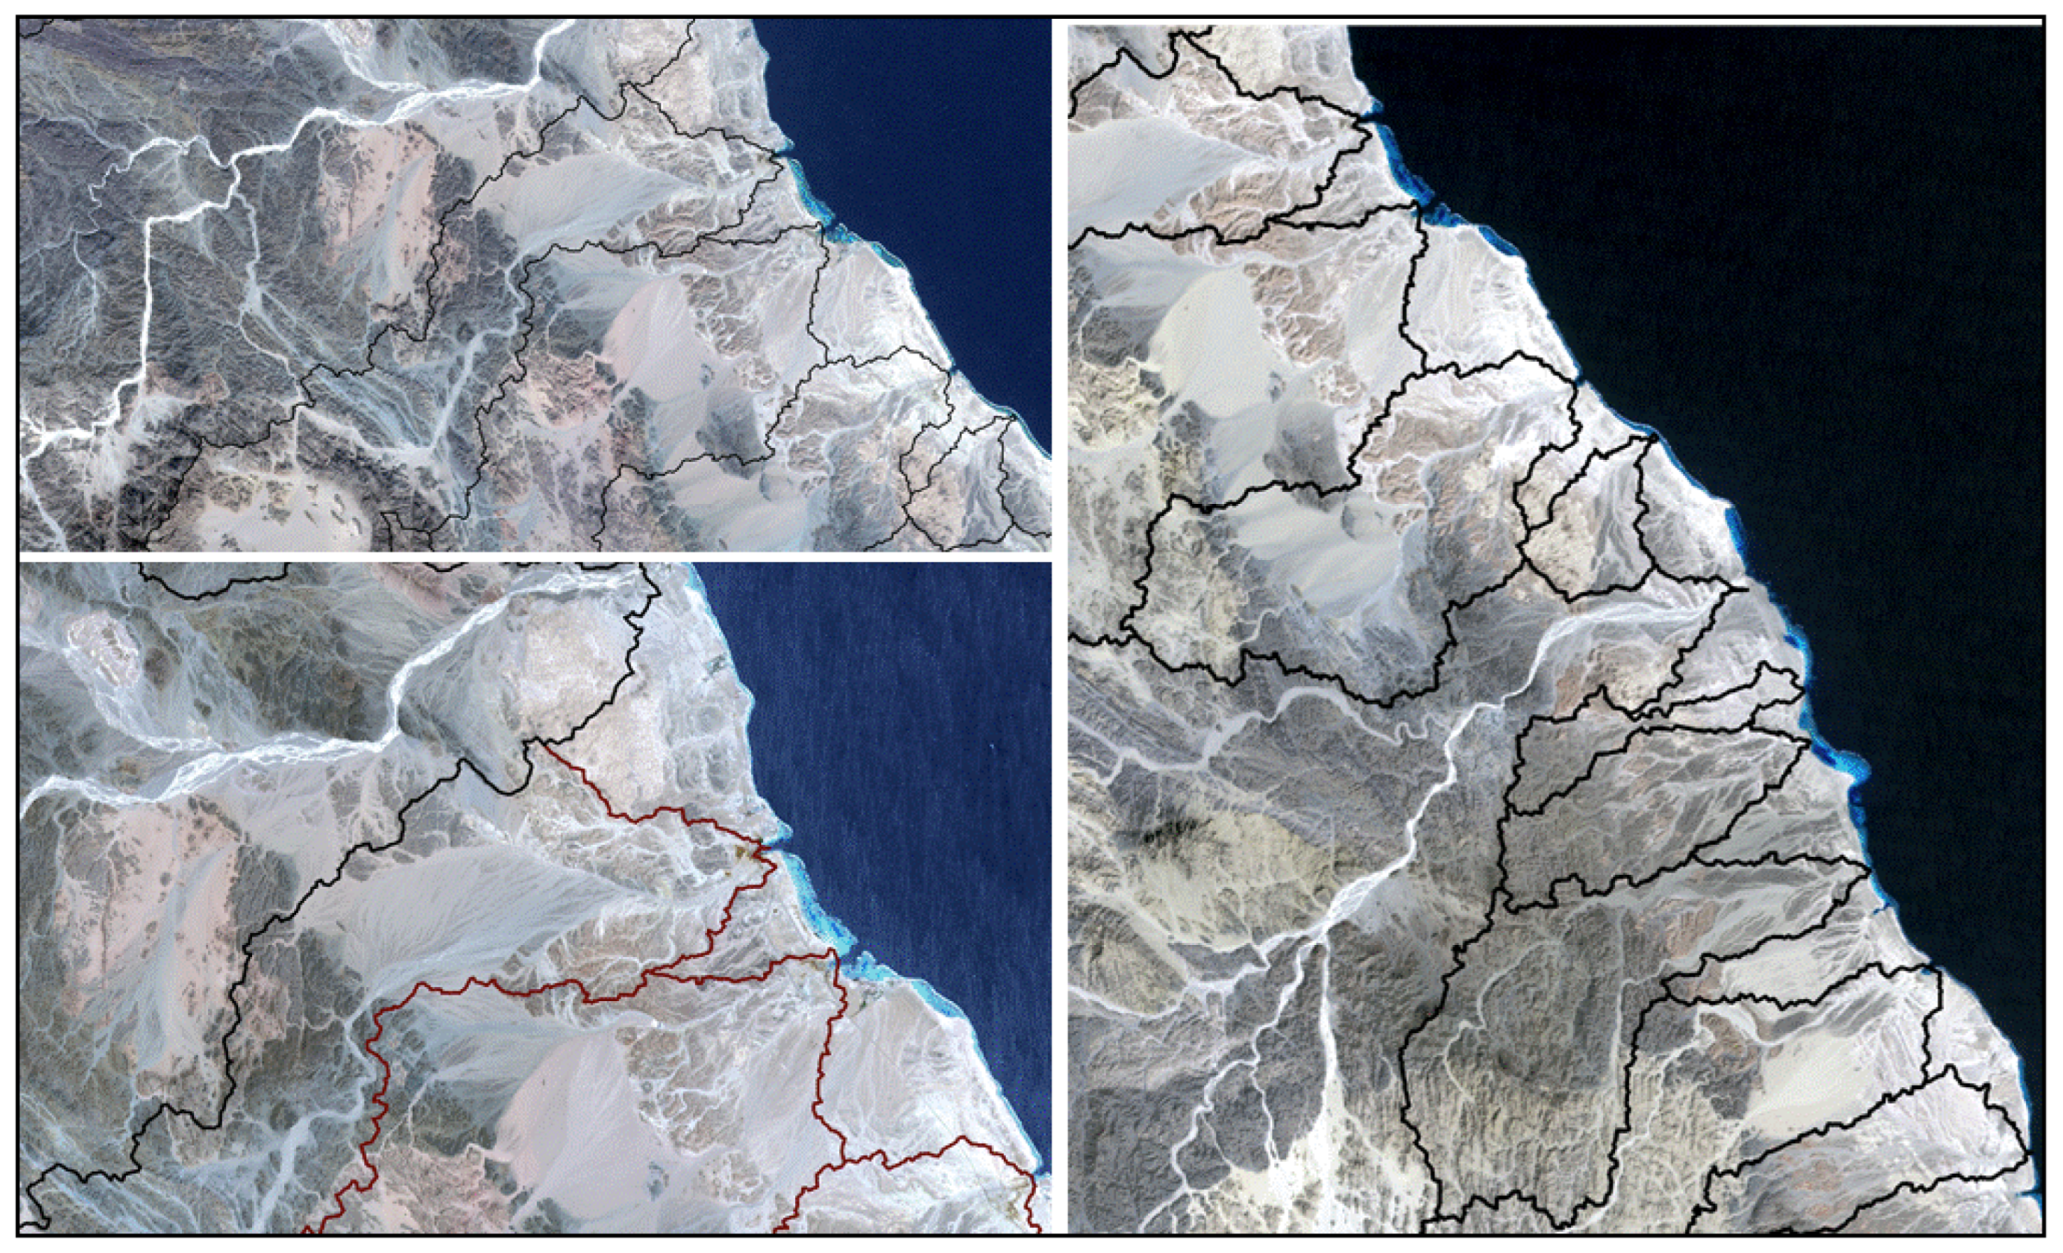
5.2. Flash Flood Verification
6. Conclusions
Author Contributions
Funding
Data Availability Statement
Acknowledgments
Conflicts of Interest
Appendix A
| Slope Class | Description |
|---|---|
| 0–2 | Flat |
| 2–8 | Gentle |
| 8–16 | Slightly steep |
| 16–30 | Steep |
| >30 | Very steep |
Appendix B


References
- Abdelmohsen, K.; Sultan, M.; Save, H.; Abotalib, A.Z.; Yan, E. What can the GRACE seasonal cycle tell us about lake-aquifer interactions? Earth-Sci. Rev. 2020, 211, 103392. [Google Scholar] [CrossRef]
- Khalil, M.M.; Tokunaga, T.; Heggy, E.; Abotalib, A.Z. Groundwater mixing in shallow aquifers stressed by land cover/land use changes under hyper-arid conditions. J. Hydrol. 2021, 598, 126245. [Google Scholar] [CrossRef]
- McCarthy, J.J.; Canziani, O.F.; Leary, N.A.; Dokken, D.J.; White, K.S. (Eds.) Climate Change 2001: Impacts, Adaptation, and Vulnerability: Contribution of Working Group II to the Third Assessment Report of the Intergovernmental Panel on Climate Change; Cambridge University Press: Cambridge, UK, 2001; Volume 2. [Google Scholar]
- Abdel-Fattah, M.; Kantoush, S.; Suni, T. Integrated management of flash flood in wadi system of Egypt: Disaster prevention and water harvesting. J. Annu. Disas. Prev. Res. Inst. Kyoto Univ. 2015, 58, 485–496. [Google Scholar]
- Prama, M.; Omran, A.; Schröder, D.; Abouelmagd, A. Vulnerability assessment of flash floods in Wadi Dahab Basin, Egypt. Environ. Earth Sci. 2020, 79, 114. [Google Scholar] [CrossRef]
- Murray, V.; Ebi, K.L. IPCC special report on managing the risks of extreme events and disasters to advance climate change adaptation (SREX). J. Epidemiol. Community Health 2012, 66, 759–760. [Google Scholar] [CrossRef]
- Attwa, M.; El Bastawesy, M.; Ragab, D.; Othman, A.; Assaggaf, H.M.; Abotalib, A.Z. Toward an integrated and sustainable water resources management in structurally-controlled watersheds in desert environments using geophysical and remote sensing methods. Sustainability 2021, 13, 4004. [Google Scholar] [CrossRef]
- Abotalib, A.Z.; Heggy, E.; El Bastawesy, M.; Ismail, E.; Gad, A.; Attwa, M. Groundwater mounding: A diagnostic feature for mapping aquifer connectivity in hyper-arid deserts. Sci. Total Environ. 2021, 801, 149760. [Google Scholar] [CrossRef]
- Sultan, M.; Yan, E.; Sturchio, N.; Wagdy, A.; Gelil, K.A.; Becker, R.; Manocha, N.; Milewski, A. Natural discharge: A key to sustainable utilization of fossil groundwater. J. Hydrol. 2007, 335, 25–36. [Google Scholar] [CrossRef]
- Yousif, M.; Henselowsky, F.; Bubenzer, O. Palaeohydrology and its impact on groundwater in arid environments: Gebel Duwi and its vicinities, Eastern Desert, Egypt. Catena 2018, 171, 29–43. [Google Scholar] [CrossRef]
- Aljammaz, A.; Sultan, M.; Izadi, M.; Abotalib, A.Z.; Elhebiry, M.S.; Emil, M.K.; Abdelmohsen, K.; Saleh, M.; Becker, R. Land subsidence induced by rapid urbanization in arid environments: A remote sensing-based investigation. Remote Sens. 2021, 13, 1109. [Google Scholar] [CrossRef]
- Pradhan, B. Flood susceptible mapping and risk area delineation using logistic regression, GIS and remote sensing. J. Spat. Hydrol. 2010, 9, 4. [Google Scholar]
- Alshehri, F.; Abuamarah, B.A.; El-Hamid, H.T.A. Impact of land use dynamics on land surface temperature using optical remote sensing data integrated with statistical analysis in Riyadh, Saudi Arabia. Adv. Space Res. 2023, 72, 1739–1750. [Google Scholar] [CrossRef]
- Abd El Aal, A.; Kamel, M.; Al-Homidy, A. Using remote sensing and GIS techniques in monitoring and mitigation of geohazards in Najran Region, Saudi Arabia. Geotech. Geol. Eng. 2019, 37, 3673–3700. [Google Scholar] [CrossRef]
- Elsadek, W.M.; Ibrahim, M.G.; Mahmod, W.E.; Kanae, S. Developing an overall assessment map for flood hazard on large area watershed using multi-method approach: Case study of Wadi Qena watershed, Egypt. Nat. Hazards 2019, 95, 739–767. [Google Scholar] [CrossRef]
- Nasir, M.J.; Iqbal, J.; Ahmad, W. Flash flood risk modeling of swat river sub-watershed: A comparative analysis of morphometric ranking approach and El-Shamy approach. Arab. J. Geosci. 2020, 13, 1082. [Google Scholar] [CrossRef]
- El-Hamid, A.; Taha, H.; Alshehri, F. Integrated remote sensing data and machine learning for drought prediction in Eastern Saudi Arabia. J. Coast. Conserv. 2023, 27, 48. [Google Scholar] [CrossRef]
- Mohamed, M.; Othman, A.; Abotalib, A.Z.; Majrashi, A. Urban heat island effects on megacities in desert environments using spatial network analysis and remote sensing data: A case study from western Saudi Arabia. Remote Sens. 2021, 13, 1941. [Google Scholar] [CrossRef]
- Embabi, N.S. Landscapes and Landforms of Egypt; Springer: Berlin/Heidelberg, Germany, 2018. [Google Scholar]
- EMA (Egyptian Meteorological Authority). Normals for Meteorological Surface Station from (1981–2010); Egyptian Meteorological Authority: Cairo, Egypt, 2019. [Google Scholar]
- Elnazer, A.A.; Salman, S.A.; Asmoay, A.S. Flash flood hazard affected Ras Gharib city, Red Sea, Egypt: A proposed flash flood channel. Nat. Hazards 2017, 89, 1389–1400. [Google Scholar] [CrossRef]
- Megahed, H.A.; El Bastawesy, M.A. Hydrological problems of flash floods and the encroachment of wastewater affecting the urban areas in Greater Cairo, Egypt, using remote sensing and GIS techniques. Bull. Natl. Res. Cent. 2020, 44, 188. [Google Scholar] [CrossRef]
- Youssef, A.M.; Pradhan, B.; Hassan, A.M. Flash flood risk estimation along the St. Katherine road, southern Sinai, Egypt using GIS based morphometry and satellite imagery. Environ. Earth Sci. 2011, 62, 611–623. [Google Scholar] [CrossRef]
- Helmi, A.M.; Zohny, O. Flash flood risk assessment in Egypt. In Flash Floods in Egypt; Springer: Berlin/Heidelberg, Germany, 2020; pp. 253–312. [Google Scholar]
- Cononco. Geological Map of Egypt, Scale 1:500,000, 1987; Egyptian General Petroleum Corporation-Conoco Coral: Cairo, Egypt, 1987. [Google Scholar]
- ArcGIS. Mapping Products|GIS Software Products—Esri, Version 10.2. 2014. Available online: https://www.esri.com/en-us/arcgis/products/index (accessed on 15 July 2021).
- WMS. Downloads|Aquaveo.Com, Version 11.1. Build Date: 7 November 2019. 2019. Available online: https://www.aquaveo.com/downloads-wms?s=WMS&v=11.0 (accessed on 15 July 2022).
- ESA SNAP. Sentinel Application Platform|Product the European Space Agency Earth, Version 9.0, Released on 29 June 2022. 2022. Available online: https://step.esa.int/main/download/snap-download/ (accessed on 5 March 2023).
- Google Earth Pro. Professional|Product Google, Version 7.3. Build Date: 29 December 2022. 2022. Available online: https://google-earth-pro.en.uptodown.com/windows/download (accessed on 15 January 2023).
- EGSA. Topographical Maps of Egypt, Scale 1:50,000, Finnish Egyptian Project; Egyptian General Survey Authority (EGSA): Giza, Egypt, 1989. [Google Scholar]
- Forkuor, G.; Maathuis, B. Comparison of SRTM and ASTER Derived Digital Elevation Models over Two Regions in Ghana-Implications for Hydrological and Environmental Modeling; INTECH Open Access Publisher: London, UK, 2012; pp. 219–240. [Google Scholar]
- Patel, A.; Katiyar, S.K.; Prasad, V. Performances evaluation of different open source DEM using Differential Global Positioning System (DGPS). Egypt. J. Remote Sens. Space Sci. 2016, 19, 7–16. [Google Scholar] [CrossRef]
- El Shamy, I.Z. Recent recharge and flash flooding opportunities in the Eastern Desert, Egypt. Ann. Geol. Surv. Egypt 1992, 18, 323–334. [Google Scholar]
- Davis, J.C. Statics and Data Analysis in Geology; Wiley: New York, NY, USA, 1975. [Google Scholar]
- Zuidam, R.V. Aerial Photo-Interpretationin Terrain Analysis and Geomorphologic Mapping (No.C25102); Smits Publishers: The Hague, The Netherlands, 1986. [Google Scholar]
- Horton, R.E. Erosional development of streams and their drainage basins; hydrophysical approach to quantitative morphology. Geol. Soc. Am. Bull. 1945, 56, 275–370. [Google Scholar] [CrossRef]
- Strahler, A.N. Quantitative analysis of watershed geomorphology. Eos Trans. Am. Geophys. Union 1957, 38, 913–920. [Google Scholar]
- Shreve, R.L. Infinite topologically random channel networks. J. Geol. 1967, 75, 178–186. [Google Scholar] [CrossRef]
- Strahler, A.N. Hypsometric (area-altitude) analysis of erosional topography. Geol. Soc. Am. Bull. 1952, 63, 1117–1142. [Google Scholar] [CrossRef]
- Strahler, A.N. Quantitative geomorphology of drainage basin and channel networks. In Handbook of Applied Hydrology; McGraw-Hill: NewYork, NY, USA, 1964; pp. 4–39. [Google Scholar]
- Schumm, S.A. The evolution of drainage systems and slopes in badland at Perth Amboy, New Jersey. Geol. Sac. Am. Bull. 1956, 67, 597–646. [Google Scholar] [CrossRef]
- Patton, P.C. Drainage Basin Morphometry and Floods. In Flood Geomorphology; John Wiley & Sons: New York, NY, USA, 1988; pp. 51–64. [Google Scholar]
- Miller, V.C. A Quantitative Geomorphic Study of Drainage Basin Characteristics in the Clinch Mountain Area, Virginia and Tennessee; Columbia University: New York, NY, USA, 1953. [Google Scholar]
- Alshehri, F.; Abdelrahman, K. Integrated approach for the investigation of groundwater quality using hydrochemical and geostatistical analyses in Wadi Fatimah, western Saudi Arabia. Front. Earth Sci. 2023, 11, 1166153. [Google Scholar] [CrossRef]
- Smith, K.G. Standards for grading texture of erosional topography. Am. J. Sci. 1950, 248, 655–668. [Google Scholar] [CrossRef]
- Yousif, M. Combination of remote sensing, GIS and palaeohydrologic remarks for promoting the exploitation of water resources in the Sahara: Cases from the Red Sea Coast, Egypt. Environ. Earth Sci. 2020, 79, 222. [Google Scholar] [CrossRef]
- Abdelkader, M.M.; Al-Amoud, A.I.; El Alfy, M.; El-Feky, A.; Saber, M. Assessment of flash flood hazard based on morphometric aspects and rainfall-runoff modeling in Wadi Nisah, central Saudi Arabia. Remote Sens. Appl. Soc. Environ. 2021, 23, 100562. [Google Scholar] [CrossRef]
- Gregory, K.J. Fluvial processes in British basins. In Geomorphology—Present Problems and Future Prospects; Embleton, C., Brunsden, D., Jones, D.K.C., Eds.; OUP: New York, NY, USA, 1978; pp. 40–72. [Google Scholar]
- Zuchiewicz, W. Morphotectonic phenomena in the polish flysch Carpathians: A case study of the Eastern Beskid Niski Mountains. Quest. Geogr. Spec. Issue 1989, 2, 155–167. [Google Scholar]
- Chopra, R.; Dhiman, R.D.; Sharma, P.K. Morphometric analysis of sub-watersheds in Gurdaspur district, Punjab using remote sensing and GIS techniques. J. Indian Soc. Remote Sens. 2005, 33, 531–539. [Google Scholar] [CrossRef]
- Abdalla, F.; El Shamy, I.; Bamousa, A.O.; Mansour, A.; Mohamed, A.; Tahoon, M. Flash floods and groundwater recharge potentials in arid land alluvial basins, southern Red Sea coast, Egypt. Int. J. Geosci. 2014, 5, 971–982. [Google Scholar] [CrossRef]
- Horton, R.E. Drainage-basin characteristics. Trans. Am. Geophys. Union 1932, 13, 350–361. [Google Scholar]
- Singh, S.; Singh, M.B. Morphometric analysis of Kanhar river basin. Natl. Geogr. J. India 1997, 43, 31–43. [Google Scholar]
- Singh, P.; Gupta, A.; Singh, M. Hydrological inferences from watershed analysis for water resource management using remote sensing and GIS techniques. Egypt. J. Remote Sens. Space Sci. 2014, 17, 111–121. [Google Scholar] [CrossRef]
- Abdelkareem, M. Targeting flash flood potential areas using remotely sensed data and GIS techniques. Nat. Hazards 2017, 85, 19–37. [Google Scholar] [CrossRef]
- Eze, E.B.; Efiong, J. Morphometric parameters of the Calabar River basin: Implication for hydrologic processes. J. Geogr. Geol. 2010, 2, 18. [Google Scholar]
- Abduladheem, A.; Elmewafey, M.; Beshr, A.F.; Elnaggar, A.A. Using GIS based morphometry estimation of flood hazard impacts on desert roads in South Sinai, Egypt. Int. J. Sci. Eng. Res. 2015, 6, 1593–1599. [Google Scholar]
- Kadam, A.K.; Jaweed, T.H.; Kale, S.S.; Umrikar, B.N.; Sankhua, R.N. Identification of erosion-prone areas using modified morphometric prioritization method and sediment production rate: A remote sensing and GIS approach. Geomatics. Nat. Hazards Risk 2019, 10, 986–1006. [Google Scholar] [CrossRef]
- Kumar, A.; Samuel, S.K.; Vyas, V. Morphometric analysis of six sub-watersheds in the central zone of Narmada River. Arab. J. Geosci. 2015, 8, 5685–5712. [Google Scholar] [CrossRef]
- Rai, P.K.; Mohan, K.; Mishra, S.; Ahmad, A.; Mishra, V.N. A GIS-based approach in drainage morphometric analysis of Kanhar River Basin, India. Appl. Water Sci. 2017, 7, 217–232. [Google Scholar] [CrossRef]
- Sujatha, E.R.; Selvakumar, R.; Rajasimman, U.A.B.; Victor, R.G. Morphometric analysis of sub-watershed in parts of Western Ghats, South India using ASTER DEM. Geomat. Nat. Hazards Risk 2015, 6, 326–341. [Google Scholar] [CrossRef]
- Melton, M.A. An Analysis of the Relations among Elements of Climate, Surface Properties, and Geomorphology; Columbia University: New York, NY, USA, 1957. [Google Scholar]
- El Bastawesy, M.; White, K.; Nasr, A. Integration of remote sensing and GIS for modelling flash floods in Wadi Hudain catchment, Egypt. Hydrol. Process. Int. J. 2009, 23, 1359–1368. [Google Scholar] [CrossRef]
- Wheater, H.S.; Ballard, B.W.; Jolley, T.J. An integrated model of arid zone water resources: Evaluation of rainfall-runoff simulation performance. Sustain. Water Resour. Under Increasing Uncertain. 1997, 240, 395–405. [Google Scholar]
- Zhang, Y.; Huang, C.C.; Pang, J.; Zha, X.; Zhou, Y.; Yin, S.; Wang, J. Comparative study of the modern flood slackwater deposits in the upper reaches of Hanjiang and Weihe River Valleys, China. Quat. Int. 2012, 282, 184–191. [Google Scholar] [CrossRef]
- Benito, G.; Thorndycraft, V.R. Palaeoflood hydrology and its role in applied hydrological sciences. J. Hydrol. 2005, 313, 3–15. [Google Scholar] [CrossRef]
- Vittala, S.S.; Govindaiah, S.; Honne Gowda, H. Morphometric analysis of sub-watersheds in the Pavagada area of Tumkur district, South India using remote sensing and GIS techniques. J. Indian Soc. Remote Sens. 2004, 32, 351–362. [Google Scholar] [CrossRef]
- Alshehri, F.; Sultan, M.; Karki, S.; Alwagdani, E.; Alsefry, S.; Alharbi, H.; Sahour, H.; Sturchio, N. Mapping the distribution of shallow groundwater occurrences using Remote Sensing-based statistical modeling over southwest Saudi Arabia. Remote Sens. 2020, 12, 1361. [Google Scholar] [CrossRef]


| Linear Morphometric Parameters | Areal Morphometric Parameters | Relief Morphometric Parameters | ||||||||||||||||||||||||||
|---|---|---|---|---|---|---|---|---|---|---|---|---|---|---|---|---|---|---|---|---|---|---|---|---|---|---|---|---|
| Number of Steams of Each Order | ||||||||||||||||||||||||||||
| W | 1st | 2nd | 3rd | 4th | 5th | 6th | 7th | Nu | Lu | Lb | Wb | MRb | Lg | A | P | Re | Rc | Ff | Dd | Fs | If | H | h | R | Rr | T | Rn | Bs |
| 1 | 1988 | 475 | 250 | 24 | 5 | 2 | 1 | 2745 | 1879.7 | 39.67 | 16.6 | 4.30 | 0.176 | 660.2 | 194.2 | 0.73 | 0.22 | 0.42 | 2.85 | 4.16 | 11.9 | 1450 | 5 | 1445 | 0.036 | 14.1 | 4.11 | 0.171 |
| 2 | 561 | 143 | 30 | 6 | 1 | … | … | 741 | 501.1 | 31.3 | 6.0 | 4.92 | 0.189 | 189.0 | 106.58 | 0.50 | 0.21 | 0.19 | 2.65 | 3.92 | 10.4 | 1452 | 0 | 1452 | 0.046 | 6.95 | 3.85 | 0.180 |
| 3 | 420 | 95 | 25 | 5 | 1 | … | … | 546 | 351 | 21.5 | 6.7 | 4.56 | 0.205 | 143.8 | 73.60 | 0.63 | 0.33 | 0.31 | 2.44 | 3.80 | 9.3 | 1056 | 0 | 1056 | 0.049 | 7.42 | 2.58 | 0.100 |
| 4 | 311 | 71 | 16 | 6 | 2 | 1 | … | 407 | 278.3 | 17.7 | 5.7 | 3.30 | 0.180 | 100.4 | 60.66 | 0.64 | 0.34 | 0.32 | 2.77 | 4.05 | 11.2 | 417 | 0 | 417 | 0.024 | 6.7 | 1.16 | 0.086 |
| 5 | 51 | 15 | 4 | 2 | 1 | … | … | 73 | 43.0 | 6.27 | 2.5 | 2.79 | 0.179 | 15.41 | 20.27 | 0.70 | 0.46 | 0.39 | 2.79 | 4.74 | 13.2 | 183 | 5 | 178 | 0.028 | 3.6 | 0.5 | 0.067 |
| 6 | 2522 | 601 | 145 | 31 | 8 | 2 | 1 | 3310 | 2560 | 49.97 | 17.1 | 3.82 | 0.167 | 855.3 | 229.63 | 0.66 | 0.20 | 0.34 | 2.99 | 3.87 | 11.6 | 1349 | 0 | 1349 | 0.027 | 14.4 | 4.04 | 0.170 |
| 7 | 38 | 6 | 2 | 1 | … | … | … | 47 | 39.10 | 10.26 | 1.5 | 3.78 | 0.193 | 15.07 | 31.29 | 0.42 | 0.19 | 0.14 | 2.59 | 3.12 | 8.1 | 210 | 3 | 207 | 0.020 | 1.5 | 0.54 | 0.065 |
| 8 | 98 | 24 | 5 | 1 | … | … | … | 127 | 92.4 | 12.0 | 3.1 | 4.63 | 0.159 | 36.79 | 34.97 | 0.57 | 0.38 | 0.26 | 2.51 | 3.45 | 8.7 | 338 | 0 | 338 | 0.028 | 3.63 | 0.85 | 0.072 |
| 9 | 285 | 63 | 12 | 2 | 1 | … | .... | 363 | 242 | 18.1 | 5.2 | 4.44 | 0.196 | 94.72 | 62.54 | 0.60 | 0.30 | 0.28 | 2.55 | 3.83 | 9.8 | 586 | 0 | 586 | 0.032 | 5.80 | 1.50 | 0.161 |
| 10 | 45 | 10 | 2 | 1 | … | … | … | 58 | 30.8 | 7.96 | 1.7 | 3.83 | 0.223 | 13.71 | 22.78 | 0.52 | 0.33 | 0.22 | 2.25 | 4.23 | 9.5 | 210 | 0 | 210 | 0.026 | 2.55 | 0.47 | 0.043 |
| 11 | 284 | 66 | 12 | 2 | 1 | … | … | 365 | 252.7 | 24.1 | 3.96 | 4.45 | 0.189 | 95.48 | 74.29 | 0.45 | 0.21 | 0.16 | 2.65 | 3.82 | 10.1 | 620 | 4 | 616 | 0.026 | 4.91 | 1.63 | 0.094 |
| 12 | 101 | 24 | 4 | 1 | … | … | … | 130 | 94.0 | 11.13 | 3.1 | 4.74 | 0.182 | 34.15 | 37.83 | 0.59 | 0.30 | 0.28 | 2.75 | 3.81 | 10.5 | 316 | 0 | 316 | 0.028 | 3.44 | 0.87 | 0.060 |
| Wadi | A | Re | Rc | Ff | Dd | Fs | Rr | Rn | Bs | LU | If | MRb | Lg | Sum of Hazard | Hazard Degree |
|---|---|---|---|---|---|---|---|---|---|---|---|---|---|---|---|
| 1 | 4.1 | 5.0 | 1.4 | 5.0 | 4.2 | 3.6 | 3.2 | 5.0 | 4.7 | 3.9 | 3.9 | 2.2 | 3.9 | 50 | 5 |
| 2 | 1.8 | 2.0 | 1.3 | 1.7 | 3.2 | 3.0 | 4.6 | 4.7 | 5.0 | 1.7 | 2.8 | 1.0 | 3.1 | 36 | 3 |
| 3 | 1.6 | 3.7 | 3.1 | 3.4 | 2.0 | 2.7 | 5.0 | 3.3 | 2.7 | 1.5 | 1.9 | 1.7 | 2.1 | 35 | 3 |
| 4 | 1.4 | 3.8 | 3.2 | 3.6 | 3.8 | 3.3 | 1.6 | 1.8 | 2.3 | 1.4 | 3.4 | 4.0 | 3.7 | 37 | 3 |
| 5 | 1.0 | 4.6 | 5.0 | 4.6 | 3.9 | 5.0 | 2.1 | 1.0 | 1.7 | 1.0 | 5.0 | 5.0 | 3.8 | 44 | 4 |
| 6 | 5.0 | 4.1 | 1.1 | 3.9 | 5.0 | 2.9 | 2.0 | 4.9 | 4.7 | 5.0 | 3.7 | 3.1 | 4.5 | 50 | 5 |
| 7 | 1.0 | 1.0 | 1.0 | 1.0 | 2.8 | 1.0 | 1.0 | 1.1 | 1.6 | 1.0 | 1.0 | 3.1 | 2.9 | 20 | 1 |
| 8 | 1.1 | 2.9 | 3.8 | 2.7 | 2.4 | 1.8 | 2.1 | 1.4 | 1.8 | 1.1 | 1.5 | 1.5 | 5.0 | 29 | 2 |
| 9 | 1.4 | 3.3 | 2.6 | 3.0 | 2.6 | 2.8 | 2.7 | 2.1 | 4.4 | 1.3 | 2.3 | 1.9 | 2.7 | 33 | 3 |
| 10 | 1.0 | 2.3 | 3.1 | 2.1 | 1.0 | 3.7 | 1.8 | 1.0 | 1.0 | 1.0 | 2.1 | 3.0 | 1.0 | 24 | 1 |
| 11 | 1.4 | 1.4 | 1.3 | 1.3 | 3.2 | 2.7 | 1.8 | 2.3 | 2.5 | 1.4 | 2.6 | 1.9 | 3.1 | 27 | 2 |
| 12 | 1.1 | 3.2 | 2.6 | 3.0 | 3.7 | 2.7 | 2.1 | 1.4 | 1.5 | 1.1 | 2.9 | 1.3 | 3.6 | 30 | 2 |
| Watershed | El-Shamy’s Approach (MRb vs. Dd) | El-Shamy’s Approach (MRb vs. Fs) | Ranking Method |
|---|---|---|---|
| Hamrat Ghannam | Moderate | Moderate | High |
| Sharm El-Bahari | Low | Low | Moderate |
| Sharm El-Qibli | Low | Low | Moderate |
| Wizer | High | High | Moderate |
| Rizq Awad | High | High | High |
| Umm Gheig | High | Moderate | High |
| Abu Gherban | Moderate | Moderate | Low |
| A | Low | Low | Low |
| Umm Lasaf | Moderate | Moderate | Moderate |
| B | Moderate | Moderate | Low |
| Umm Gerdiat | Moderate | Moderate | Low |
| C | Low | Low | Low |
Disclaimer/Publisher’s Note: The statements, opinions and data contained in all publications are solely those of the individual author(s) and contributor(s) and not of MDPI and/or the editor(s). MDPI and/or the editor(s) disclaim responsibility for any injury to people or property resulting from any ideas, methods, instructions or products referred to in the content. |
© 2023 by the authors. Licensee MDPI, Basel, Switzerland. This article is an open access article distributed under the terms and conditions of the Creative Commons Attribution (CC BY) license (https://creativecommons.org/licenses/by/4.0/).
Share and Cite
Rashwan, M.; Mohamed, A.K.; Alshehri, F.; Almadani, S.; Khattab, M.; Mohamed, L. Flash Flood Hazard Assessment along the Red Sea Coast Using Remote Sensing and GIS Techniques. ISPRS Int. J. Geo-Inf. 2023, 12, 465. https://doi.org/10.3390/ijgi12110465
Rashwan M, Mohamed AK, Alshehri F, Almadani S, Khattab M, Mohamed L. Flash Flood Hazard Assessment along the Red Sea Coast Using Remote Sensing and GIS Techniques. ISPRS International Journal of Geo-Information. 2023; 12(11):465. https://doi.org/10.3390/ijgi12110465
Chicago/Turabian StyleRashwan, Mohamed, Adel K. Mohamed, Fahad Alshehri, Sattam Almadani, Mohammed Khattab, and Lamees Mohamed. 2023. "Flash Flood Hazard Assessment along the Red Sea Coast Using Remote Sensing and GIS Techniques" ISPRS International Journal of Geo-Information 12, no. 11: 465. https://doi.org/10.3390/ijgi12110465