
Rapid Extreme Tropical Precipitation and Flood Inundation Mapping Framework (RETRACE): Initial Testing for the 2021–2022 Malaysia Flood

 , , , , ,
  and
and
Abstract
:1. Introduction
2. Materials and Methods
2.1. The 2021–2022 Malaysia Flood
2.2. Global Precipitation Measurement (GPM) Mission
2.3. Sentinel Satellites
2.4. RETRACE
2.4.1. Pre-Processing of Sentinel Data
- “” denotes the pixel’s angle of incidence;
- “” denotes the image center’s angle of incidence;
- “K” denotes the calibration constant of the SAR image.
2.4.2. Precipitation and Flood Victim Analysis
2.4.3. Flood Inundation Mapping
2.4.4. Accuracy Assessment
3. Results
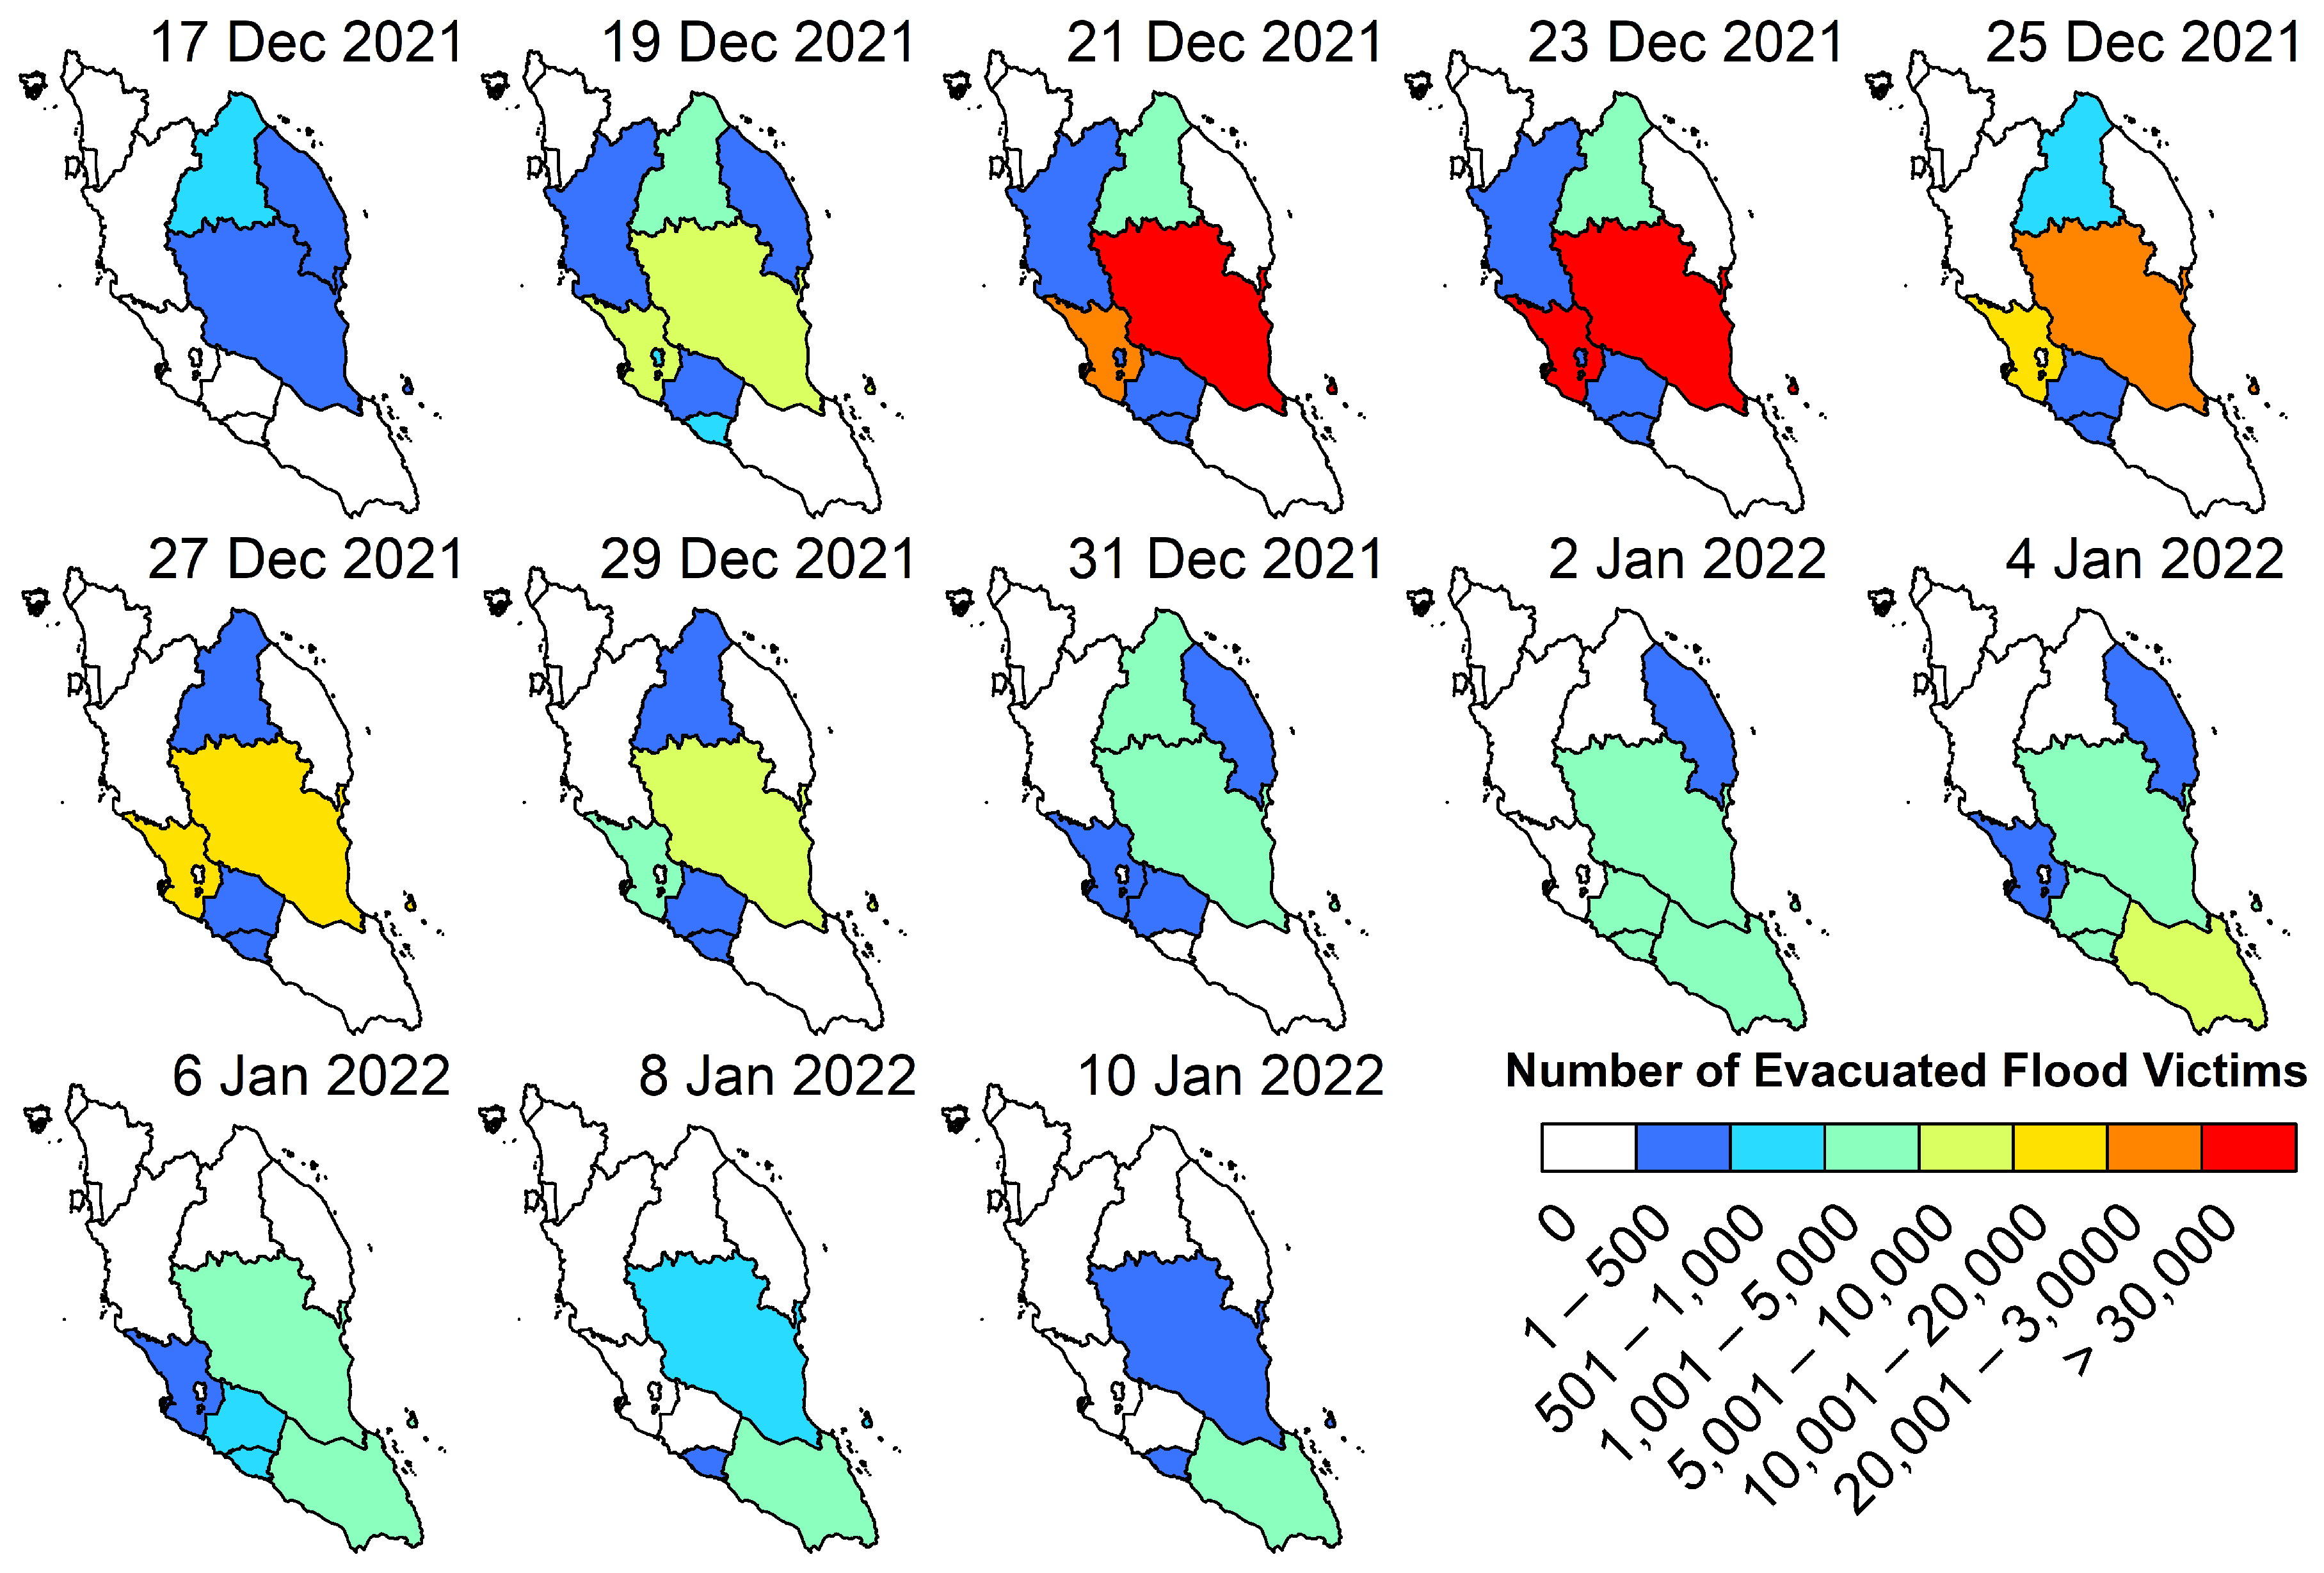
3.1. Flood Victim Analysis
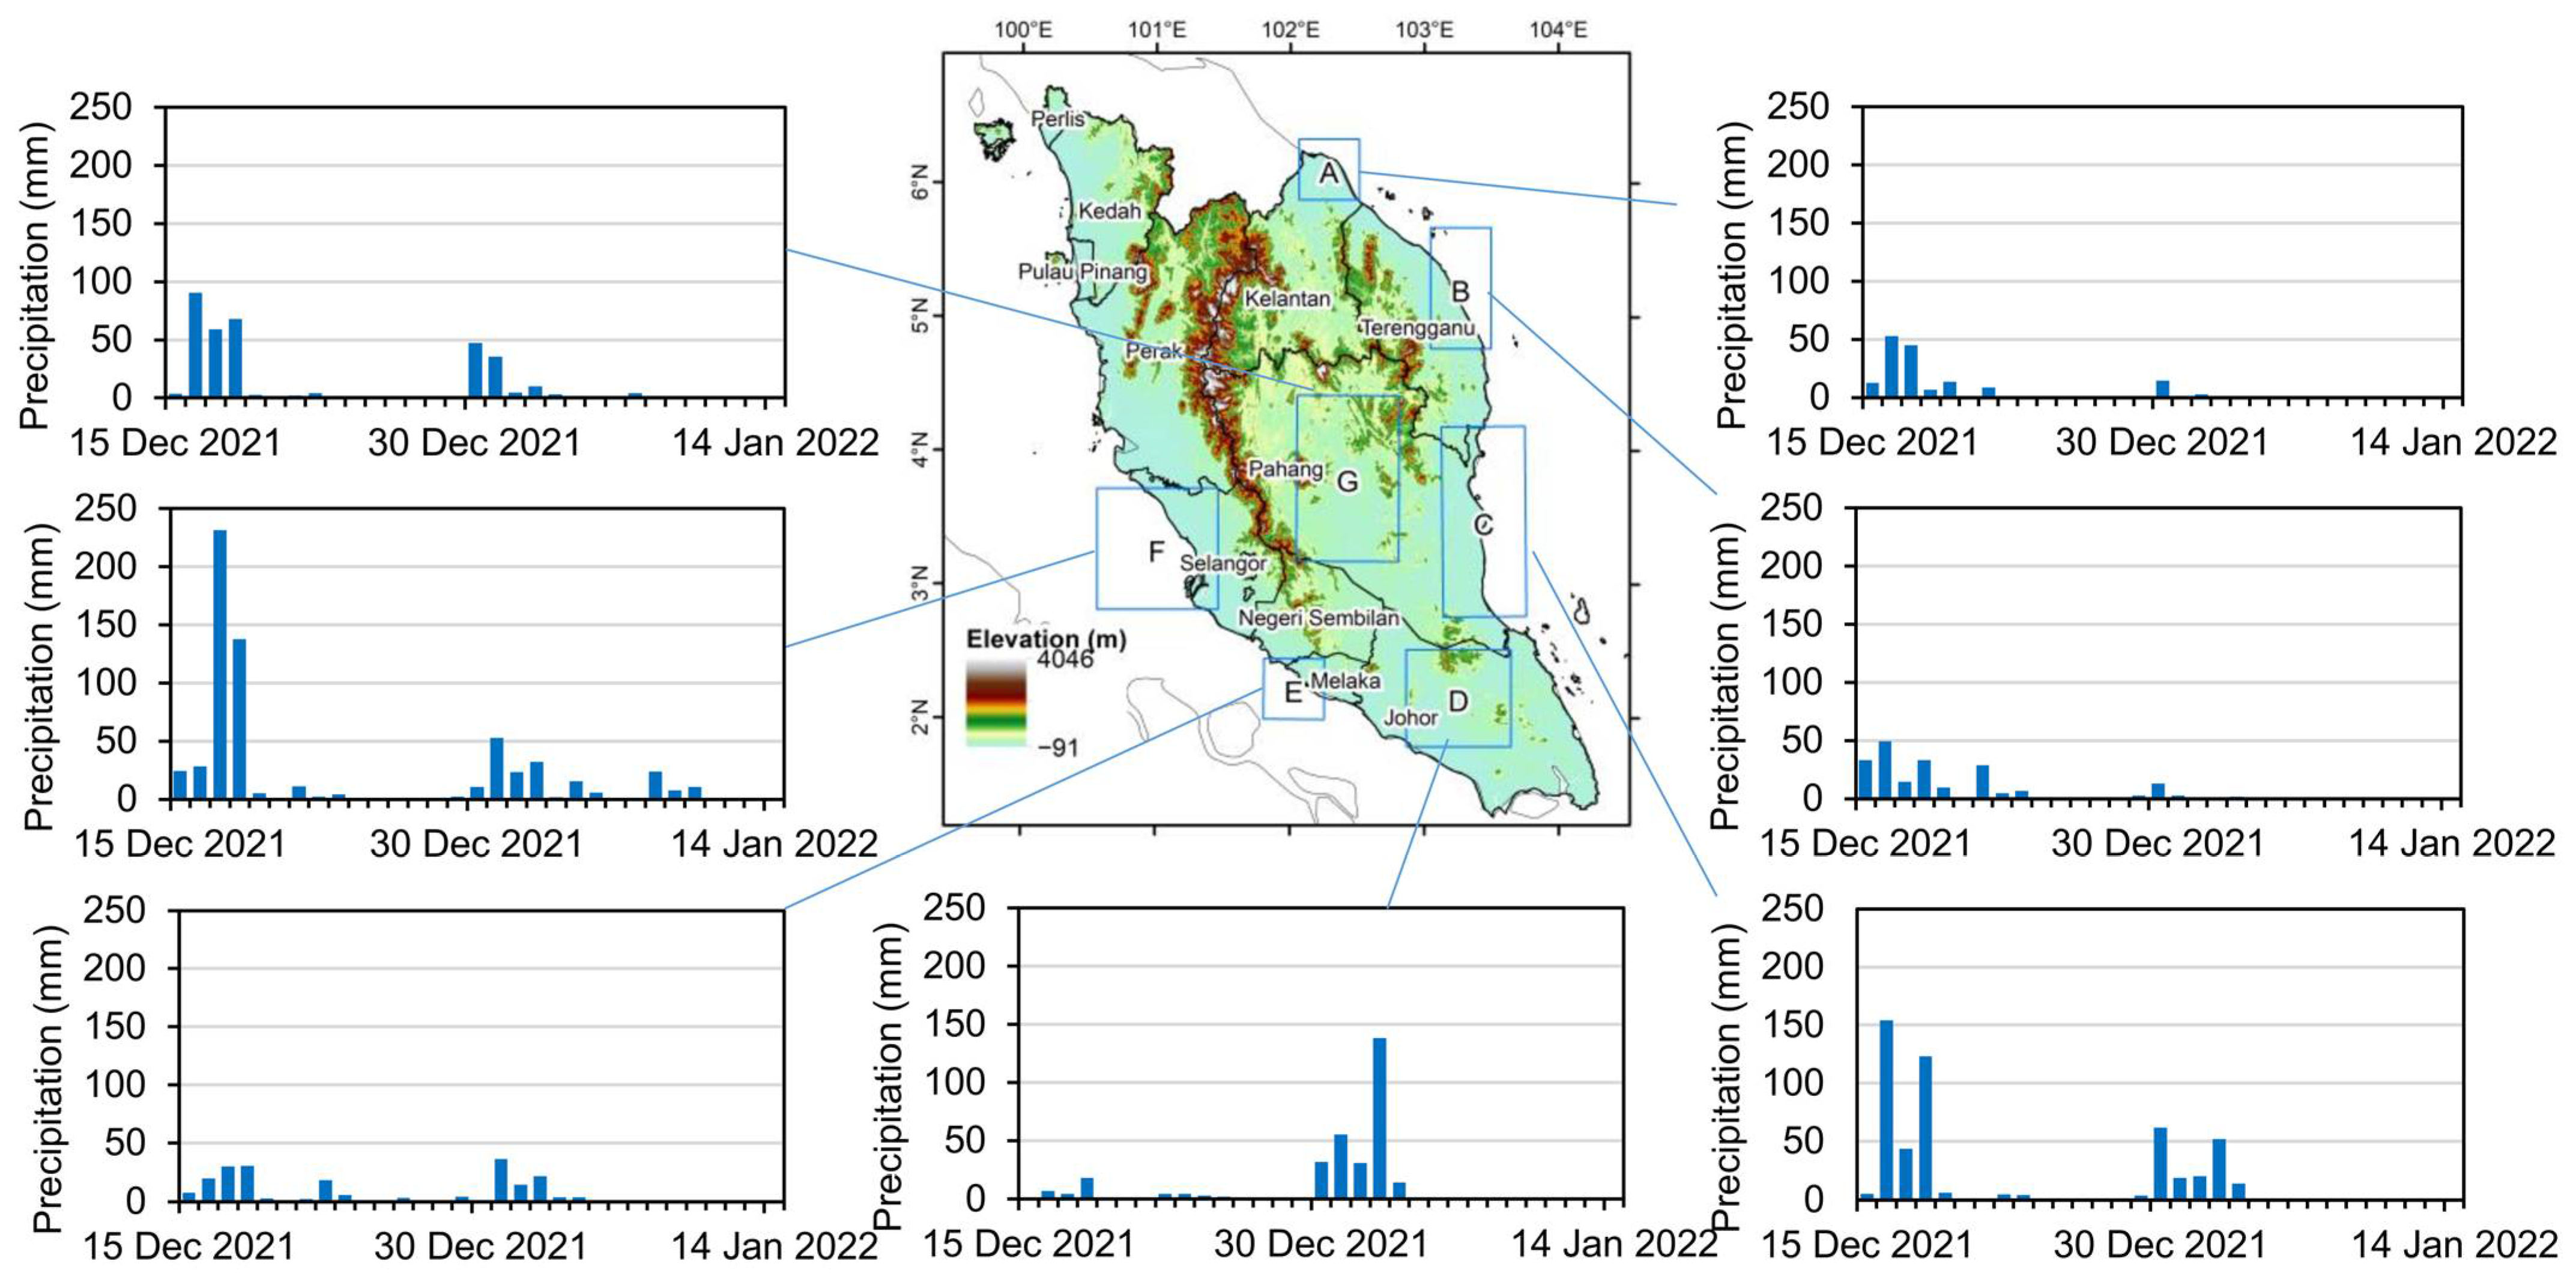
3.2. Extreme Precipitation Analysis
3.3. Accuracy Assessment of Flood Inundation Maps
3.4. Flood Inundation Mapping for the 2021–2022 Malaysia Flood
4. Discussion
4.1. GPM Precipitation Analysis
4.2. The 2021–2022 Malaysia Flood
4.3. Limitations of the Study
5. Conclusions
Author Contributions
Funding
Institutional Review Board Statement
Informed Consent Statement
Data Availability Statement
Acknowledgments
Conflicts of Interest
References
- IPCC. AR6 Climate Change 2021: The Physical Science Basis. In Working Group 1; Cambridge University Press: Cambridge, UK; New York, NY, USA, 2021; p. 1300. [Google Scholar]
- EM-DAT. EM-DAT: The Emergency Events Database. 2022. Available online: www.emdat.be (accessed on 1 April 2022).
- Tang, Z.; Li, Y.; Gu, Y.; Jiang, W.; Xue, Y.; Hu, Q.; LaGrange, T.; Bishop, A.; Drahota, J.; Li, R. Assessing Nebraska playa wetland inundation status during 1985–2015 using Landsat data and Google Earth Engine. Environ. Monit. Assess. 2016, 188, 1–14. [Google Scholar] [CrossRef] [PubMed]
- Bernama. Floods: 10 Missing in Pahang, Selangor Worst Hit State; Astro Awani: Kuala Lumpur, Malaysia, 2021. [Google Scholar]
- Bernama. Flood Situation Worsens as at Afternoon, More Than 34,000 Victims Evacuated; The Sun Daily: Kuala Lumpur, Malaysia, 2021. [Google Scholar]
- Reuters. Floods Hit Seven States in Malaysia, Thousands More Evacuated, in Reuters; Reuters: Kuala Lumpur, Malaysia, 2022. [Google Scholar]
- Rahman, S. Malaysia’s Floods of December 2021: Can Future Disasters be Avoided? Researchers at ISEAS–Yusof Ishak Institute Analyse Current Events; ISEAS–Yusof Ishak Institute: Singapore, 2022. [Google Scholar]
- Ong, H.S. Expert: Debris Flood in Pahang and Selangor Caused by Multiple Landslides, Streams of Waste; The Star: Kuantan, Malaysia, 2022. [Google Scholar]
- NATION. Flood Alert: Sections of KL-Karak Highway Impassable Due to Water, landslides; The Star: Kuantan, Malaysia, 2021. [Google Scholar]
- Zakaria, S.F.; Mohamad Zin, R.; Mohamad, I.; Balubaid, S.; Mydin, S.H.; MDR, E.R. The Development of Flood Map in Malaysia. AIP Conf. Proc. 2017, 1903, 110006. [Google Scholar]
- Ab Ghani, A.; Chang, C.K.; Leow, C.S.; Zakaria, N.A. Sungai Pahang digital flood mapping: 2007 flood. Int. J. River Basin Manag. 2012, 10, 139–148. [Google Scholar] [CrossRef]
- Liew, Y.S.; Mat Desa, S.; Noh, M.N.M.; Tan, M.L.; Zakaria, N.A.; Chang, C.K. Assessing the Effectiveness of Mitigation Strategies for Flood Risk Reduction in the Segamat River Basin, Malaysia. Sustainability 2021, 13, 3286. [Google Scholar] [CrossRef]
- Tan, M.L.; Ibrahim, A.L.; Duan, Z.; Cracknell, A.P.; Chaplot, V. Evaluation of Six High-Resolution Satellite and Ground-Based Precipitation Products over Malaysia. Remote Sens. 2015, 7, 1504–1528. [Google Scholar] [CrossRef] [Green Version]
- Tan, M.L.; Gassman, P.W.; Liang, J.; Haywood, J.M. A review of alternative climate products for SWAT modelling: Sources, assessment and future directions. Sci. Total Environ. 2021, 795, 148915. [Google Scholar] [CrossRef]
- Huffman, G.J.; Bolvin, D.T.; Nelkin, E.J.; Wolff, D.B.; Adler, R.F.; Gu, G.; Hong, Y.; Bowman, K.P.; Stocker, E.F. The TRMM Multisatellite Precipitation Analysis (TMPA): Quasi-Global, Multiyear, Combined-Sensor Precipitation Estimates at Fine Scales. J. Hydrol. 2007, 8, 38–55. [Google Scholar] [CrossRef]
- Hou, A.Y.; Kakar, R.K.; Neeck, S.; Azarbarzin, A.A.; Kummerow, C.D.; Kojima, M.; Oki, R.; Nakamura, K.; Iguchi, T. The Global Precipitation Measurement Mission. Bull. Am. Meteorol. Soc. 2014, 95, 701–722. [Google Scholar] [CrossRef]
- Tapiador, F.J.; Marcos, C.; Sancho, J.M.; Santos, C.; Núñezb, J.Á.; Navarroc, A.; Kummerowd, C.; Adlere, R.F. The September 2019 floods in Spain: An example of the utility of satellite data for the analysis of extreme hydrometeorological events. Atmos. Res. 2021, 257, 105588. [Google Scholar] [CrossRef]
- Qi, W.; Yong, B.; Gourley, J.J. Monitoring the super typhoon lekima by GPM-based near-real-time satellite precipitation estimates. J. Hydrol. 2021, 603, 126968. [Google Scholar] [CrossRef]
- Tan, M.L.; Santo, H. Comparison of GPM IMERG, TMPA 3B42 and PERSIANN-CDR satellite precipitation products over Malaysia. Atmos. Res. 2018, 202, 63–76. [Google Scholar] [CrossRef]
- Kuntla, S.K. An era of Sentinels in flood management: Potential of Sentinel-1, -2, and -3 satellites for effective flood management. Open Geosci. 2021, 13, 1616–1642. [Google Scholar] [CrossRef]
- Zhang, D.; Yang, M.; Ma, M.; Tang, G.; Wang, T.; Zhao, X.; Ma, S.; Wu, J.; Wang, W. Can GPM IMERG Capture Extreme Precipitation in North China Plain? Remote Sens. 2022, 14, 928. [Google Scholar] [CrossRef]
- Li, Z.; Shen, H.; Cheng, Q.; Li, W.; Zhang, L. Thick Cloud Removal in High-Resolution Satellite Images Using Stepwise Radiometric Adjustment and Residual Correction. Remote Sens. 2019, 11, 1925. [Google Scholar] [CrossRef] [Green Version]
- Twele, A.; Cao, W.; Plank, S.; Martinis, S. Sentinel-1-based flood mapping: A fully automated processing chain. Int. J. Remote Sens. 2016, 37, 2990–3004. [Google Scholar] [CrossRef]
- Huang, W.; DeVries, B.; Huang, C.; Lang, M.W.; Jones, J.W.; Creed, I.F.; Carroll, M.L. Automated Extraction of Surface Water Extent from Sentinel-1 Data. Remote Sens. 2018, 10, 797. [Google Scholar] [CrossRef] [Green Version]
- Liang, J.; Liu, D. A local thresholding approach to flood water delineation using Sentinel-1 SAR imagery. ISPRS J. Photogramm. Remote Sens. 2019, 159, 53–62. [Google Scholar] [CrossRef]
- Zhang, M.; Chen, F.; Liang, D.; Tian, B.; Yang, A. Use of Sentinel-1 GRD SAR Images to Delineate Flood Extent in Pakistan. Sustainability 2020, 12, 5784. [Google Scholar] [CrossRef]
- Manjusree, P.; Kumar, L.P.; Bhatt, C.M.; Rao, G.S.; Bhanumurthy, V. Optimization of threshold ranges for rapid flood inundation mapping by evaluating backscatter profiles of high incidence angle SAR images. Int. J. Disaster Risk Sci. 2012, 3, 113–122. [Google Scholar] [CrossRef] [Green Version]
- Tripathi, G.; Pandey, A.C.; Parida, B.R.; Kumar, A. Flood Inundation Mapping and Impact Assessment Using Multi-Temporal Optical and SAR Satellite Data: A Case Study of 2017 Flood in Darbhanga District, Bihar, India. Water Resour. Manag. 2020, 34, 1871–1892. [Google Scholar] [CrossRef]
- Gorelick, N.; Hancher, M.; Dixon, M.; Ilyushchenko, S.; Thau, D.; Moore, R. Google Earth Engine: Planetary-scale geospatial analysis for everyone. Remote Sens. Environ. 2017, 202, 18–27. [Google Scholar] [CrossRef]
- Uddin, K.; Matin, M.A.; Meyer, F.J. Operational Flood Mapping Using Multi-Temporal Sentinel-1 SAR Images: A Case Study from Bangladesh. Remote Sens. 2019, 11, 1581. [Google Scholar] [CrossRef] [Green Version]
- AHA. Flooding in 8 States Malaysia–Flash Update #1; AHA Center: Jakarta Timur, Indonesia, 2021. [Google Scholar]
- DOSM. Launching of Report on the Key Findings Population and Housing Census Of Malaysia 2020. Brief Report on Key Findings Population and Housing Census of Malaysia 2020. Available online: https://www.dosm.gov.my/v1/index.php?r=column/cthemeB-Cat&cat=117&bul_id=akliVWdIa2g3Y2VubTVSMkxmYXp1UT09&menu_id=L0pheU43NWJwRWVSZklWdzQ4TlhUUT09 (accessed on 3 March 2022).
- Tan, M.L.; Juneng, L.; Tangang, F.T.; Chunag, J.X.; Radin Firdaus, R.B. Changes in Temperature Extremes and Their Relationship with ENSO in Malaysia from 1985 to 2018. Int. J. Climatol. 2020, 41, E2564–E2580. [Google Scholar] [CrossRef]
- Tang, K.H.D. Climate change in Malaysia: Trends, contributors, impacts, mitigation and adaptations. Sci. Total Environ. 2018, 650, 1858–1871. [Google Scholar] [CrossRef]
- Ismail, M.S.N.; Abdul Ghani, A.N.; Md Ghazaly, Z. The characteristics of road inundation during flooding events in Peninsular Malaysia. Int. J. GEOMATE 2019, 54, 129–133. [Google Scholar]
- Mohd Taib, Z.; Jaharuddin, N.S.; Mansor, Z. A Review of Flood Disaster and Disaster Management in Malaysia. Int. J. Account. Bus. Manag. 2016, 4, 9. [Google Scholar]
- DID. Flood Management-Programme and Activities. 2017. Available online: https://www.water.gov.my/index.php/pages/view/419 (accessed on 3 March 2022).
- Shah, S.M.H.; Mustaffa, Z.; Yusof, K.W. Disasters Worldwide and Floods in the Malaysian Region: A Brief Review. Indian J. Sci. Technol. 2017, 10, 9. [Google Scholar] [CrossRef]
- Ibrahim, N.A.; Wan Alwi, S.R.; Abdul Manan, Z.; Mustaffa, A.A.; Kidam, K. Flood Impact on Renewable Energy System in Malaysia. Chem. Eng. Trans. 2021, 89, 193–198. [Google Scholar]
- Durumin Iya, S.G.; BarzaniGasim, M.; EkhwanToriman, M.; Abdullahi, M.G. Floods in Malaysia: Historical Reviews, Causes, Effects and Mitigations Approach. Int. J. Interdiscip. Res. Innov. 2014, 2, 50–65. [Google Scholar]
- Aiman, A. Flood Losses ‘Could Amount to RM20 Billion’; Free Malaysia Today: Petaling Jaya, Malaysia, 2021. [Google Scholar]
- Skofronick-Jackson, G.; Petersen, W.A.; Berg, W.; Kidd, C.; Stocker, E.F.; Kirschbaum, D.B.; Kakar, R.; Braun, S.A.; Huffman, G.J.; Iguchi, T.; et al. The Global Precipitation Measurement (GPM) Mission for Science and Society. Bull. Am. Meteorol. Soc. 2017, 98, 1679–1695. [Google Scholar] [CrossRef]
- Huffman, G.J.; Bolvin, D.T.; Braithwaite, D.; Hsu, K.-L.; Joyce, R.J.; Kidd, C.; Nelkin, E.J.; Sorooshian, S.; Stocker, E.F.; Tan, J. Integrated multi-satellite retrievals for the Global Precipitation Measurement (GPM) mission (IMERG). In Satellite Precipitation Measurement; Springer: Cham, Switzerland, 2020; pp. 343–353. [Google Scholar]
- Pradhan, R.K.; Markonis, Y.; Godoy, M.R.V.; Villalba-Pradas, A.; Andreadis, K.M.; Nikolopoulos, E.I.; Papalexiou, S.M.; Rahim, A.; Tapiador, F.J.; Hanel, M. Review of GPM IMERG performance: A global perspective. Remote Sens. Environ. 2021, 268, 112754. [Google Scholar] [CrossRef]
- ESA. The Sentinel Missions. 2022. Available online: https://www.esa.int/Applications/Observing_the_Earth/Copernicus/The_Sentinel_missions#:~:text=ESA%20is%20developing%20a%20new,robust%20datasets%20for%20Copernicus%20services (accessed on 2 March 2022).
- Potin, P.; Bargellini, P.; Laur, H.; Rosich, B.; Schmuck, S. Sentinel-1 Mission Operations Concept. In Proceedings of the 2012 IEEE International Geoscience and Remote Sensing Symposium, Munich, Germany, 22–27 July 2012; p. 4. [Google Scholar]
- Kseňak, Ľ.; Pukanská, K.; Bartoš, K.; Blišťan, P. Assessment of the Usability of SAR and Optical Satellite Data for Monitoring Spatio-Temporal Changes in Surface Water: Bodrog River Case Study. Water 2022, 14, 299. [Google Scholar] [CrossRef]
- Tsyganskaya, V.; Martinis, S.; Marzahn, P.; Ludwig, R. Detection of Temporary Flooded Vegetation Using Sentinel-1 Time Series Data. Remote Sens. 2018, 10, 1286. [Google Scholar] [CrossRef] [Green Version]
- Huang, M.; Jin, S. Rapid Flood Mapping and Evaluation with a Supervised Classifier and Change Detection in Shouguang Using Sentinel-1 SAR and Sentinel-2 Optical Data. Remote Sens. 2020, 12, 2073. [Google Scholar] [CrossRef]
- Schlaffer, S.; Chini, M.; Dorigo, W.; Plank, S. Monitoring surface water dynamics in the Prairie Pothole Region of North Dakota using dual-polarised Sentinel-1 synthetic aperture radar (SAR) time series. Hydrol. Earth Syst. Sci. 2022, 26, 841–860. [Google Scholar] [CrossRef]
- Anusha, N.; Bharathi, B. Flood detection and flood mapping using multi-temporal synthetic aperture radar and optical data. Egypt. J. Remote Sens. Space Sci. 2019, 23, 207–219. [Google Scholar] [CrossRef]
- GoogleDevelopers. FAO GAUL: Global Administrative Unit Layers 2015, First-Level Administrative Units. 2022. Available online: https://developers.google.com/earth-engine/datasets/catalog/FAO_GAUL_2015_level1 (accessed on 8 March 2022).
- GoogleDevelopers. JRC Global Surface Water Mapping Layers, v1.3. 2022. Available online: https://developers.google.com/earth-engine/datasets/catalog/JRC_GSW1_3_GlobalSurfaceWater (accessed on 8 March 2022).
- GoogleDevelopers. WWF HydroSHEDS Void-Filled DEM, 3 Arc-Seconds. 2022. Available online: https://developers.google.com/earth-engine/datasets/catalog/WWF_HydroSHEDS_03VFDEM (accessed on 8 March 2022).
- Tavus, B.; Kocaman, S.; Gokceoglu, C. Flood damage assessment with Sentinel-1 and Sentinel-2 data after Sardoba dam break with GLCM features and Random Forest method. Sci. Total Environ. 2021, 816, 151585. [Google Scholar] [CrossRef]
- Laur, H.; Bally, P.; Meadows, P.; Sanchez, J.; Schaettler, B.; Lopinto, E.; Esteban, D. Derivation of the Backscattering Coefficient σo in ESA ERS SAR PRI Products. In Sentinel-1 SAR; Calibration, E.S., Ed.; ESA: Paris, France, 2004. [Google Scholar]
- Pramanick, N.; Acharyya, R.; Mukherjee, S.; Mukherjee, S.; Pal, I.; Mitra, D.; Mukhopadhyay, A. SAR based flood risk analysis: A case study Kerala flood 2018. Adv. Space Res. 2021, 69, 1915–1929. [Google Scholar] [CrossRef]
- Haralick, R.M.; Shanmugam, K.; Dinstein, I.H. Textural Features for Image Classification. IEEE Trans. Syst. Man Cybern. 1973, 6, 610–621. [Google Scholar] [CrossRef] [Green Version]
- Amitrano, D.; Di Martino, G.; Iodice, A.; Riccio, D.; Ruello, G. Unsupervised Rapid Flood Mapping Using Sentinel-1 GRD SAR Images. IEEE Trans. Geosci. Remote Sens. 2018, 56, 3290–3299. [Google Scholar] [CrossRef]
- Tulbure, M.G.; Broich, M.; Vincius, P.; Gaines, M.; Ju, J.; Stehman, S.V.; Pavelsky, T.; Masek, J.G.; Yin, S.; Mai, J.; et al. Can we detect more ephemeral floods with higher density harmonized Landsat Sentinel 2 data compared to Landsat 8 alone? ISPRS J. Photogramm. Remote Sens. 2022, 185, 232–246. [Google Scholar] [CrossRef]
- NADMA. Monthly Report of Disasters in Malaysia; National Disaster Management Agency: Putrajaya, Malaysia, 2022; p. 1.
- Landuyt, L.; Van Wesemael, A.; Schumann, G.J.-P.; Hostache, R.; Verhoest, N.E.C.; Van Coillie, F.M.B. Flood Mapping Based on Synthetic Aperture Radar: An Assessment of Established Approaches. IEEE Trans. Geosci. Remote Sens. 2018, 57, 722–739. [Google Scholar] [CrossRef]
- Clinton, N. Otsu’s Method for Image Segmentation. 2017. Available online: https://medium.com/google-earth/otsus-method-for-image-segmentation-f5c48f405e (accessed on 14 June 2022).
- Otsu, N. A Tlreshold Selection Method from Gray-Level Histograms. IEEE Trans. Syst. Man Cybern. 1979, SMC-9, 62–66. [Google Scholar] [CrossRef] [Green Version]
- Baillarin, S.J.; Meygret, A.; Dechoz, C.; Petrucci, B.; Lacherade, S.; Tremas, T.; Isola, C.; Martimort, P.; Spoto, F. Sentinel-2 Level 1 Products and Image Processing Performances. In Proceedings of the 2012 IEEE International Geoscience and Remote Sensing Symposium, Munich, Germany, 22–27 July 2012; p. 4. [Google Scholar]
- GoogleDevelopers. Sentinel-2 MSI: MultiSpectral Instrument, Level-2A. 2022. Available online: https://developers.google.com/earth-engine/datasets/catalog/COPERNICUS_S2_SR (accessed on 19 April 2022).
- Stephens, E.; Schumann, G.; Bates, P. Problems with binary pattern measures for flood model evaluation. Hydrol. Process. 2013, 28, 4928–4937. [Google Scholar] [CrossRef]
- Mason, D.C.; Bevington, J.; Dance, S.; Revilla-Romero, B.; Smith, R.; Vetra-Carvalho, S.; Cloke, H. Improving Urban Flood Mapping by Merging Synthetic Aperture Radar-Derived Flood Footprints with Flood Hazard Maps. Water 2021, 13, 1577. [Google Scholar] [CrossRef]
- ChePa, N.; Hashim, N.L.; Yusof, Y.; Hussain, A. Adaptive Emergency Evacuation Centre Management for Dynamic Relocation of Flood Victims using Firefly Algorithm. J. Telecommun. Electron. Comput. Eng. 2016, 8, 115–119. [Google Scholar]
- Harries, T.; Penning-Rowsell, E. Victim pressure, institutional inertia and climate change adaptation: The case of flood risk. Glob. Environ. Chang. 2011, 21, 188–197. [Google Scholar] [CrossRef] [Green Version]
- Da Silva, N.A.; Webber, B.G.M.; Matthews, A.J.; Feist, M.M.; Stein, T.H.M.; Holloway, C.E.; Abdullah, M.F.A.B. Validation of GPM IMERG Extreme Precipitation in the Maritime Continent by Station and Radar Data. Earth Space Sci. 2021, 8, e2021EA001738. [Google Scholar] [CrossRef]
- Mayowa, O.O.; Pour, S.H.; Shahid, S.; Mohsenipour, M.; BIN Harun, S.; Heryansyah, A.; Ismail, T. Trends in rainfall and rainfall-related extremes in the east coast of peninsular Malaysia. J. Earth Syst. Sci. 2015, 124, 1609–1622. [Google Scholar] [CrossRef] [Green Version]
- Hammim, R. Number of flood evacuees in Johor increasing. In New Straits Times; New Straits Times Press (Malaysia) Berhad (NSTP): Johor Bahru, Malaysia, 2022. [Google Scholar]
- Bernama. Johor Latest to be Hit by Floods, Number of Evacuees up Elsewhere; Free Malaysia Today: Kuala Lumpur, Malaysia, 2022. [Google Scholar]
- Liang, J.; Tan, M.L.; Hawcroft, M.; Catto, J.L.; Hodges, K.I.; Haywood, J.M. Monsoonal precipitation over Peninsular Malaysia in the CMIP6 Hormesis experiments: The role of model resolution. Clim. Dyn. 2021, 58, 2783–2805. [Google Scholar] [CrossRef]
- Tan, M.L.; Ibrahim, A.L.; Cracknell, A.P.; Yusop, Z. Changes in precipitation extremes over the Kelantan River Basin, Malaysia. Int. J. Clim. 2016, 37, 3780–3797. [Google Scholar] [CrossRef]
- Tarpanelli, A.; Mondini, A.C.; Camici, S. Effectiveness of Sentinel-1 and Sentinel-2 for Flood Detection Assessment in Europe. Nat. Hazards Earth Syst. Sci. 2022, 1–24. [Google Scholar]
- Rana, V.K.; Suryanarayana, T.M.V. Evaluation of SAR speckle filter technique for inundation mapping. Remote Sens. Appl. Soc. Environ. 2019, 16, 100271. [Google Scholar] [CrossRef]
- Pekel, J.-F.; Cottam, A.; Gorelick, N.; Belward, A.S. High-resolution mapping of global surface water and its long-term changes. Nature 2016, 540, 418–422. [Google Scholar] [CrossRef] [PubMed]


| Year | Date | States | Outcome | Reference |
|---|---|---|---|---|
| 2010 | 10 October–19 November | Kedah Perlis | Triggered by a tropical depression and later aggravated by La Nina monsoon rains; 45,000 hectares of rice fields were damaged and government pledged USD 6.5 billion to help the farmers. | [36,38,39,40] |
| 2014 | 15 December 2014–3 January 2015 | Johor Kelantan Kedah Negeri Sembilan Pahang Perak Perlis Sabah Sarawak Selangor Terengganu | Heavy rainfall as part of the northeast monsoon. The worst flood in Kelantan in history with 202,000 individuals evacuated; property damage of USD 560 million. | |
| 2017 | 4–5 November | Pulau Pinang | Caused by Tropical Depression 29W on 3 November; flash flood in Pulau Pinang with maximum flood level 3.7 m. | |
| 2021 | 16–31 December | Perak Selangor Kuala Lumpur Negeri Sembilan Melaka Johor Pahang Terengganu Kelantan Sabah | Caused by Tropical Depression 29W on 14–17 December. Heavy flood in four states and minor flood in four other states; government estimated total of USD 1.55 billion in property damage. | [4,41] |
| State | Flood Date | Available Datasets |
|---|---|---|
| Pahang | 17–31 December | 868 |
| Selangor | 17–31 December | 534 |
| Negeri Sembilan | 18–31 December | 204 |
| Melaka | 17–25 December | 199 |
| Johor | 05–31 December | 708 |
| Terengganu | 02–31 December | 651 |
| Kelantan | 17–31 December | 589 |
| Perak | 19–21 December | 852 |
| Threshold (Pixel) | Pahang (%) | Selangor (%) |
|---|---|---|
| 3 | 68.75 | 61.25 |
| 4 | 69.45 | 61.88 |
| 5 | 70.20 | 62.80 |
| State | Flooded Area (km2) | District | Flooded Area by District (km2) | Figure |
|---|---|---|---|---|
| Pahang (Figure 8a) | 28.87 | Kuantan | 4.21 | Figure 8b |
| Temerloh | 0.77 | Figure 8d | ||
| Rompin | 5.09 | Figure 8f | ||
| Raub | 0.02 | |||
| Pekan | 16.32 | Figure 8c,e | ||
| Maran | 1.14 | |||
| Lipis | 0.02 | |||
| Jerantut | 0.72 | |||
| Cameron | 0.01 | |||
| Bera | 0.54 | |||
| Bentong | 0.03 | |||
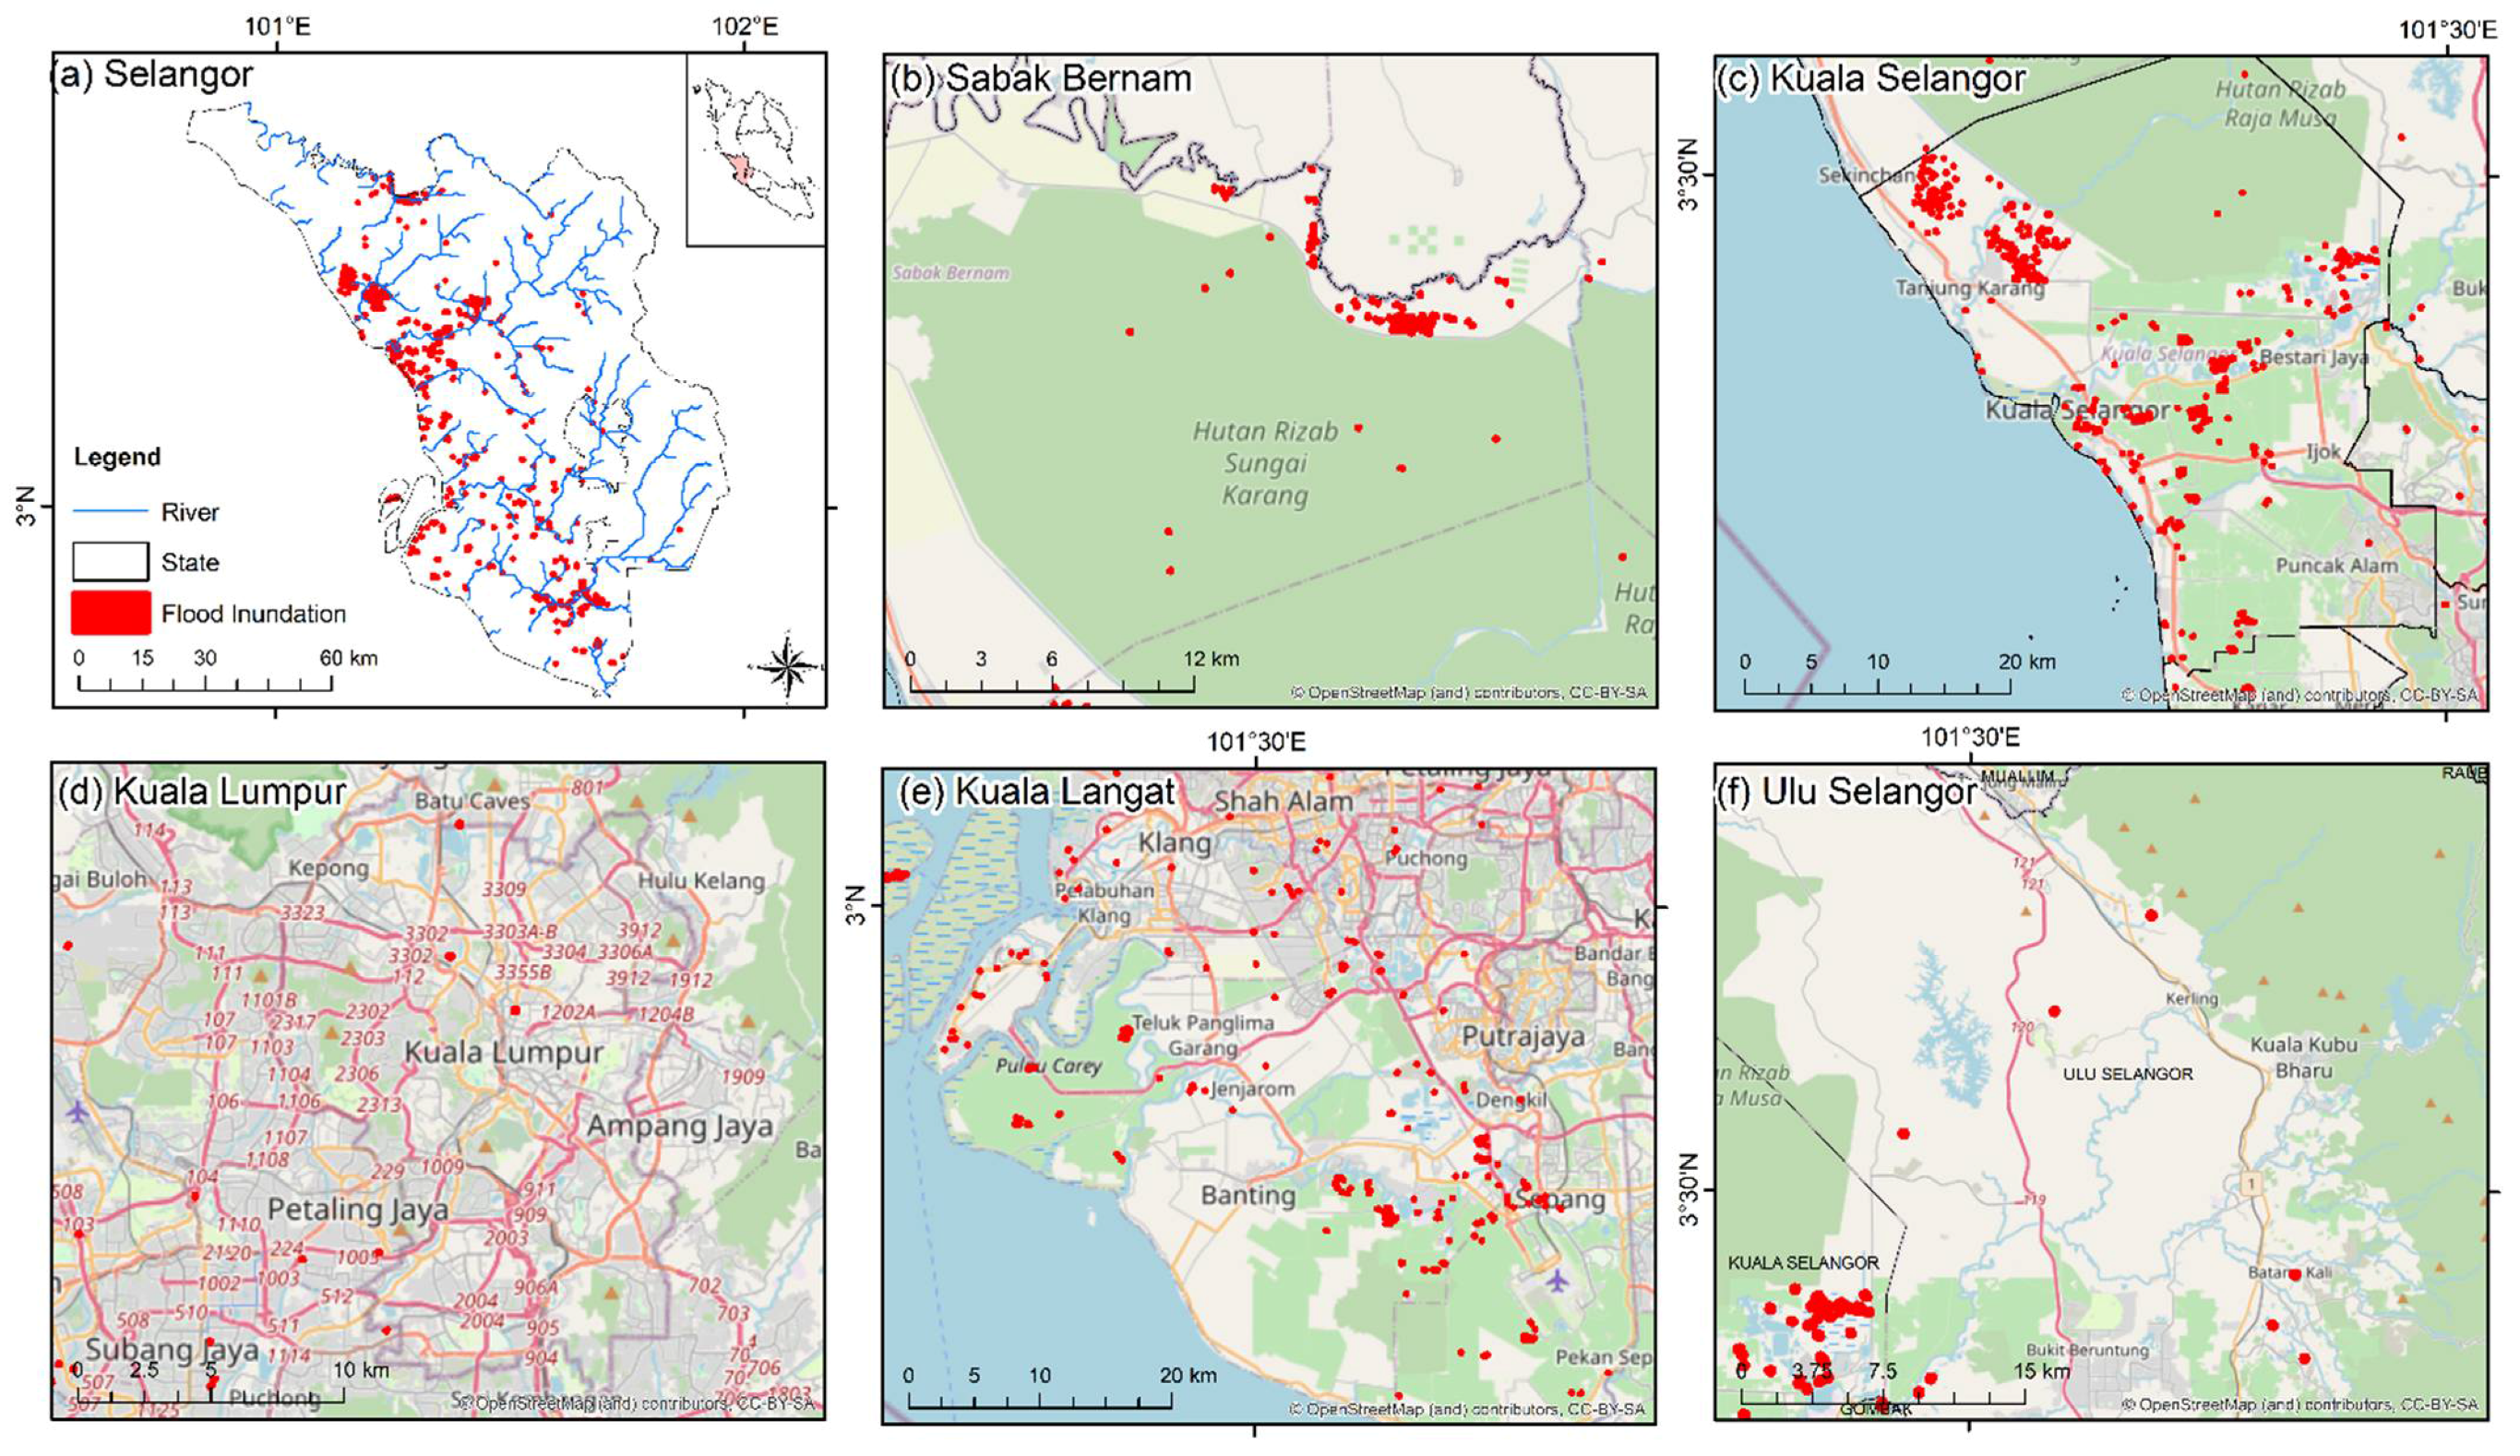
| Selangor (Figure 9a) | 7.24 | Gombak | 0.06 | Figure 9 |
| Klang | 0.52 | |||
| Kuala Selangor | 4.28 | Figure 9c | ||
| Petaling | 0.12 | |||
| Sabak Bernam | 0.77 | Figure 9b | ||
| Sepang | 0.43 | |||
| Ulu Langat | 0.01 | |||
| Ulu Selangor | 0.1 | Figure 9f | ||
| Kuala Langat | 0.95 | Figure 9e | ||
| Kelantan (Figure 10a) | 32.32 | Bachok | 2.24 | |
| Kota Bharu | 11.29 | Figure 10d | ||
| Kuala Krai | 0.01 | |||
| Pasir Mas | 11.76 | Figure 10b | ||
| Pasir Puteh | 4.4 | Figure 10e | ||
| Tanah Merah | 0.43 | Figure 10f | ||
| Tumpat | 1.46 | Figure 10c | ||
| Machang | 0.73 | Figure 10f | ||
| Johor (Figure 11a) | 8.25 | Kota Tinggi | 0.54 | |
| Batu Pahat | 1.6 | Figure 11d | ||
| Mersing | 0.38 | Figure 11c | ||
| Muar | 0.17 | |||
| Pontian | 0.44 | |||
| Segamat | 2.61 | Figure 11b | ||
| Johor Bahru | 0.23 | Figure 11f | ||
| Kluang | 1.5 | Figure 11e | ||
| Kulai | 0.07 | |||
| Tangkak | 0.71 | |||
| Kuala Lumpur | 0.014 | |||
| Melaka | 0.63 | Jasin | 0.27 | |
| Melaka Tengah | 0.1 | |||
| Alor Gajah | 0.26 | |||
| Negeri Sembilan | 0.031 | Kuala Pilah | 0.005 | |
| Seremban | 0.004 | |||
| Tampin | 0.01 | |||
| Perak | 0.08 | Bagan Datuk | 0.02 | |
| Batang Padang | 0.01 | |||
| Muallim | 0.05 |
Publisher’s Note: MDPI stays neutral with regard to jurisdictional claims in published maps and institutional affiliations. |
© 2022 by the authors. Licensee MDPI, Basel, Switzerland. This article is an open access article distributed under the terms and conditions of the Creative Commons Attribution (CC BY) license (https://creativecommons.org/licenses/by/4.0/).
Share and Cite
Tew, Y.L.; Tan, M.L.; Juneng, L.; Chun, K.P.; Hassan, M.H.b.; Osman, S.b.; Samat, N.; Chang, C.K.; Kabir, M.H. Rapid Extreme Tropical Precipitation and Flood Inundation Mapping Framework (RETRACE): Initial Testing for the 2021–2022 Malaysia Flood. ISPRS Int. J. Geo-Inf. 2022, 11, 378. https://doi.org/10.3390/ijgi11070378
Tew YL, Tan ML, Juneng L, Chun KP, Hassan MHb, Osman Sb, Samat N, Chang CK, Kabir MH. Rapid Extreme Tropical Precipitation and Flood Inundation Mapping Framework (RETRACE): Initial Testing for the 2021–2022 Malaysia Flood. ISPRS International Journal of Geo-Information. 2022; 11(7):378. https://doi.org/10.3390/ijgi11070378
Chicago/Turabian StyleTew, Yi Lin, Mou Leong Tan, Liew Juneng, Kwok Pan Chun, Mohamad Hafiz bin Hassan, Sazali bin Osman, Narimah Samat, Chun Kiat Chang, and Muhammad Humayun Kabir. 2022. "Rapid Extreme Tropical Precipitation and Flood Inundation Mapping Framework (RETRACE): Initial Testing for the 2021–2022 Malaysia Flood" ISPRS International Journal of Geo-Information 11, no. 7: 378. https://doi.org/10.3390/ijgi11070378